The Impact of Voluntary Disclosures on Sell-Side Analyst Stock Recommendations: Australian Evidence By Worrawan T. Laohapolwatana*, Malcolm Smith**, and Brian Howieson*** *School of Commerce, University of South Australia *School of Accounting, Finance and Economics Edith Cowan University ** University of Adelaide Graduate Business School School of Accounting, Finance and Economics & FIMARC Working Paper Series Edith Cowan University November 2005 Working Paper 0511 Correspondence author: Professor Malcolm Smith School of Accounting, Finance & Economics Edith Cowan University 100 Joondalup Drive Joondalup WA 6027 Western Australia Phone: 61+ (8) 6304 5623 Fax: 61+ (8) 6304 5271 Email: [email protected]
Transcript
The Impact of Voluntary Disclosures on Sell-Side Analyst Stock Recommendations: Australian Evidence
By
Worrawan T. Laohapolwatana*, Malcolm Smith**, and Brian Howieson***
*School of Commerce, University of South Australia
*School of Accounting, Finance and Economics Edith Cowan University
** University of Adelaide Graduate Business School
School of Accounting, Finance and Economics & FIMARC Working Paper Series Edith Cowan University
November 2005 Working Paper 0511
Correspondence author: Professor Malcolm Smith School of Accounting, Finance & Economics Edith Cowan University 100 Joondalup Drive Joondalup WA 6027 Western Australia Phone: 61+ (8) 6304 5623 Fax: 61+ (8) 6304 5271 Email: [email protected]
Abstract
This paper investigates the impact of voluntary disclosures on sell-side analyst stock recommendations. It uses content analysis method to measure quality of information disclosures and emphasis on particular themes. The focus of this study is on changes in analyst recommendations and the new information disclosures that have been made public since the previous revision of recommendation. The proxies for voluntary disclosures are information released by firms via company announcements and associated media reports. The characteristics of these disclosures are examined to explore their impact on the changes in analysts’ stock recommendations. Based on a sample of over 200 recommendation revisions of 40 listed Australian companies, the results suggest that voluntary disclosures do contribute to analyst stock revisions. The findings reveal that the quantity of disclosures is positively associated with the number of recommendation revisions, and that disclosures with favourable signals or with price-sensitive contents are significantly related to the direction and type of analyst revisions. In addition, disclosure of specific themes (e.g., dividend and product) in company announcements and news are significantly associated with the recommendation change. This has implications for both the formulation of accounting policies and the regulation of financial disclosure.
Acknowledgements: The authors acknowledge the support of Thomson Financial in the conduct of this research through their provision of data from the Institutional Brokers Estimate System (I/B/E/S) service. This data has been provided as part of a broad academic program to encourage earnings expectation research. The authors acknowledge the helpful comments from participants at the BAA Annual Conference (2004), University of York.
1. Introduction
Changes in the business environment such as globalisation, financial deregulation, and
technological advances require that companies increasingly seek to communicate with outside
parties to keep up with rapid growth and competition. Healy and Palepu (2001) note that, in
the capital market economy, corporate disclosures play an important role in spreading
information to the relevant parties outside the companies. Accounting information is useful to
shareholders, suppliers, creditors, potential investors, analysts, and others because they can
use such information to assess a business, update subjective estimations, and make effective
decisions on investing their resources in a company. Healy and Palepu (1993) also assert that
information disclosure becomes a distinctive strategy as companies try to communicate
information to the financial markets in order to raise capital.
Apart from mandatory disclosures to disseminate company information, companies can
additionally present discretionary information to accompany the mandated requirements, and
many choose to do so. This view is in line with the report of the Business Research Project
by the Financial Accounting Standards Board (FASB 2001), which studies the voluntary
disclosure of business information. The report (FASB 2001, p. 3) concludes that voluntary
disclosure is useful to investors and indicates that “effective voluntary disclosure can provide
more transparency and understanding about the company to investors and creditors”. The
same report also finds that there are a variety of companies currently willing to disclose some
of their critical business information voluntarily and that voluntary disclosure appears to be
valuable in communicating information to investors and creditors.
The importance of company information is evident to users as they use such information
for their decision-making process. Therefore users are persons who perceive and make
judgements as to what information is important and useful. This corresponds to the view
noted by Wallman (1995, p. 83) in that the value and worth of financial reporting lie in its
usefulness to users. The AICPA Special Committee (1994, Chapter 1-2), which studied
users’ information needs, simply grouped users into two categories, namely professionals and
non-professionals. This grouping is based on skills, resources, and purposes to make
decisions using accounting information. However, professional users - including analysts,
brokers, and others - are the focus of the AICPA’ report. Professional users, especially
2
financial analysts, generally base their decisions on superior models; they control a significant
proportion of capital in the market; and more non-professional users tend to rely on the advice
of professionals as the market place is constantly changing and becomes much more complex
(AICPA 1994, Chapter 2).
In this regard, Schipper (1991, p.105) notes that “it makes sense to study analyst
decision processes because analysts are among the primary users of financial accounting
information”. Analysts are important in the sense that they are intermediaries who receive and
process financial information for investors. Healy and Palepu (2001) lend support to this idea
and conclude from their evidence that analysts create value in the capital market through their
provision of an analysis of company information to investors. Schipper (1991, p.112)
summarise the major tasks of analysts as to collect company information from various sources,
analyse company performance, make earnings forecasts, and arrive at buy/hold/sell
recommendations. These activities result in two kinds of analysts’ work, namely analysts’
earnings forecasts and analysts’ stock recommendations. Healy and Palepu (2001, p.416)
note that analysts’ forecasts and recommendation reports are the principal focus of academic
research relevant to the assessment of information intermediaries. Analysts intensely use
financial information to reach their decisions, thus the quality of their work is influenced by
the quality of the information they use. Analysts, as the key users of corporate information,
are sophisticated users who can realistically be regarded as representatives of prime user
groups and can be assumed to be able to use information effectively. Hence, a study of
analysts’ work should enable us to examine the decision usefulness of corporate information.
The primary purpose of this study is to contribute to the existing knowledge on how
company voluntary disclosures are decision useful to investment analysts as major users of
corporate information. It aims to assess the decision usefulness of voluntary accounting
disclosures by examining the nature of analysts’ stock recommendations. The study examines
the relationship between the characteristics of voluntary disclosures and the properties of
analysts’ recommendations by observing whether voluntary disclosures are useful and
relevant to analysts’ decision-making process given that analysts use corporate voluntary
information to reach conclusions in their work. It then seeks to determine the impact of the
extent of voluntary information disclosure on the attributes of analysts’ recommendations.
3
In doing so, this study investigates the analysts’ recommendation revisions (the changed
rating) for company stocks. The analysts’ recommendation revisions are central to this paper
in measuring the decision usefulness of corporate voluntary disclosure. After the
recommendation revisions (revised ratings) have been gathered, the period between the old
and new ratings can be determined, and the voluntary disclosures during the change period are
identified and matched with the corresponding recommendation revisions. The characteristics
of voluntary disclosures over the same period of change are later examined to determine
whether they can explain the properties of recommendation revision.
Based on a sample of over 200 recommendation revisions of 40 listed Australian
companies, the results suggest that voluntary disclosures1 help to explain the variations in
analyst recommendation revisions. The results reveal that the quantity of disclosures is
positively associated with the number of recommendation revisions, and that disclosures with
favourable signals or with price-sensitive contents are significantly related to the direction and
type of recommendation revisions. In addition, disclosure of specific themes (e.g., dividend
and product) in company announcements and news are significantly associated with the
recommendation change.
The remainder of this paper is organised into four further sections. Section two
provides a review of the literature and develops hypotheses. Section three explains the
sample and data collected, and discusses the research method employed. Section four reports
the results. Finally, Section five provides conclusions, implications, limitations and possible
extensions of the study.
2. Literature Review, Related research and development of hypotheses
2.1 Related Research
The motivation for this study arises from an extensive review of the voluntary
disclosure literature, most notably the contribution of Healy and Palepu (2001). The literature
shows that the benefits of voluntary disclosures have long been recognised and investigated
from many different perspectives. The studies on the benefits of voluntary disclosures are
important for the current initiatives to improve the quality of business reporting process and
4
firm disclosure strategy. The FASB Steering Committee Report (FASB 2001) states
that many leading companies are voluntarily disclosing an extensive amount of information to
investors and predicts that the importance of voluntary disclosures is expected to increase in
the future because of the fast pace of change in the business environment.
Voluntary disclosures themselves have also been proved to have importance to capital
markets as evidenced from a number of empirical studies in this area. Benefits of disclosures
to the company are well-documented in the literature. Companies making voluntary
disclosures can gain perceived market benefits in the form of improved stock liquidity,
reduced cost of capital, and increased information intermediation (Healy & Palepu 2001) and
increased stock liquidity and investor attractiveness (Diamond & Verrechia 1991). A number
of empirical studies support these assertions: Welker (1995) finds that firms with a well-
regarded disclosure policy have lower bid-ask spreads, which are a proxy for the information
asymmetry component of the cost of capital; Healy, Hutton, and Palepu (1999) find that firms
with increased disclosures have lower bid-ask spreads and conclude that expanded disclosures
lead to increases in stock liquidity and attract more institutional investors. Leuz and
Verrecchia (2000) also find that firms with a higher disclosure level have lower bid-ask
spreads and higher trading volumes, thus lowering the cost of issuing capital. Botosan (1997)
directly observes firms’ cost of capital, and documents a relationship between firms’
disclosure levels and the cost of capital, finding that, for firms with a low analyst following,
there is an association between greater disclosure and the lower cost of capital. Botosan and
Plumlee (2002) extend this study to include firms with high analyst following, noting the
same negative association between the extent of disclosures observed from annual reports and
cost of capital.
The extent of voluntary disclosure varies according to firm characteristics, including
firm size, listing status, industry environment, and firm performance (profitability and return
variability). In order to measure the extent of disclosure levels, the elements that could
potentially affect the level of disclosures must be considered. Several prior studies examine
the determinants of cross-sectional variations in voluntary disclosure levels. Lang and
Lundholm (1993) use analyst ratings of firms’ disclosures as a proxy for disclosure quality,
and examine the cross-sectional variations in analysts’ published ratings of firms’ disclosure
practices. They find significant evidence of a positive relation between disclosure ratings and
firm size, current performance, and new security issuance. They find that disclosure scores
5
increase as firm size increases, which is consistent with much of the existing research on
voluntary disclosure. Also, disclosure ratings are higher for firms that perform well, firms
with a weaker relationship between annual stock returns and earnings, and firms that issue
securities. The relationship between the disclosure scores and firm characteristics also varies
across sources of disclosures, with investor relations the most responsive to firm
characteristics in their study. This is consistent with the fact that disclosures in annual reports
and other publications are infrequently varied, while investor relations are the most flexible
channels over short time periods.
In an investigation of factors influencing voluntary annual report disclosures by
multinational companies, Meek, Roberts and Gray (1995) identify a number of variables (firm
size, industry, leverage, profitability, country, and international listing status) that might be
associated with disclosure levels, and present evidence to support a relationship with company
size, country, and listing status. Similarly, Robb, Single and Zarzeski (2001) find that large
companies tend to provide more disclosures. In addition, they observe some industry effects
on the level of disclosures, with, firms in the chemicals and construction industries providing
higher levels of disclosure content. Ahmed and Courtis (1999) conduct a meta-analysis
reviewing past literature studying the association between annual report disclosure level and
firm characteristics, and find three variables (firm size, exchange listing status, and leverage)
to have statistically significant positive associations with firms’ disclosure levels.
Beattie, McInnes and Fearnley (2002, 2004) note that information disclosed by a
company could be part of a very large topic area; this necessitates disclosure studies having a
narrower focus on to specific areas or subsets of information disclosure (e.g., forward-looking,
historical, or background information; financial or nonfinancial information; environmental
disclosures; accounting figures or narratives). Although, all the information is essential to
users’ decision making collectively, it is likely that the decision-relevance of information
varies by information types. Several studies (e.g., Eccles & Mavrinac 1995; Meek et al. 1995;
Robb et al. 2001; Grant, Fogarty, Bricker & Previts 2000) show that different types of
particular information items do not create equal value-relevance to users’ decision-making
processes.
There have been two approaches to the examination of the information content of
disclosures. The study of market reactions is one such method. An inference is made,
6
implying that the content of disclosures is useful, when it has an effect on stock performance
(share prices and/or returns). Studies including Brookfield and Morris (1992), Rippington
and Taffler (1995), Amir and Lev (1996), Lev and Zarowin (1999), Ely and Waymire (1999),
Francis and Schipper (1999), Francis, Schipper and Vincent (2002) have shown that corporate
information disclosures have an impact on stock performance, providing evidence of an effect
which implies that the disclosure is useful and has information content. The other method,
content analysis, investigates the information contained in disclosures and attempts to observe
the intrinsic value (such as predictive ability) of information. The content analysis method
has been mainly applied to examine narrative information contained in the
chairman/president’s letter and MD&A of firms’ operations. Past research on thematic
(27.7%) (19.9%) (43.4%) (6.7%) (2.2%) (100.0%) * The rating follows the I/B/E/S Recommendation Scale.
28
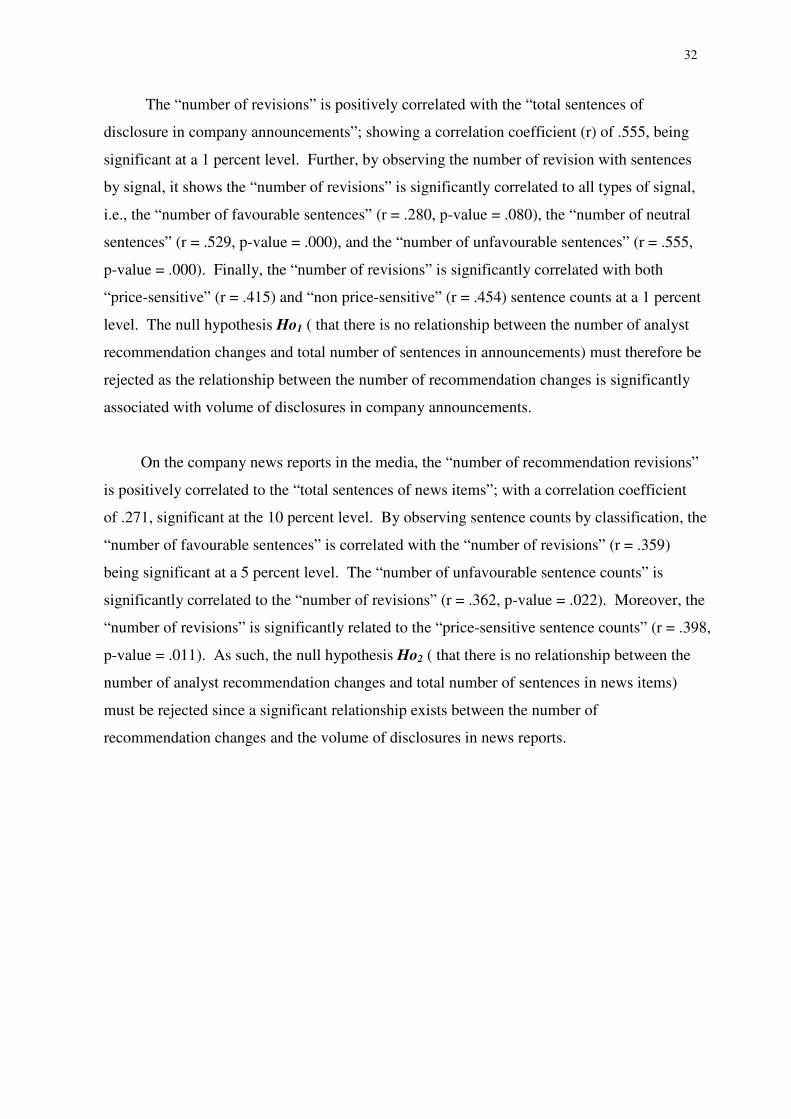
Table 5 shows the available sample of revisions for each measure of recommendation
changes. Out of 267 total revisions, there are 9 change periods having no announcements and
12 periods with no news items. As a result, samples of recommendation revisions are slightly
adjusted according to the availability of data relevant to the analysis of each measure
(attribute of revision).
Table 5: Recommendation Changes (Number of Change Periods), Classified by Types of Revisions, Available to Corresponding Disclosures
Number of cases matched to each measurement of disclosures (n) Measure of
recommendation changes
Content analysis of announcements Content analysis of news items
1. Direction 258 255 Upgrade 133 128 Downgrade 125 127
2. Type of rating 258 255
Buy 123 119 Non-buy 135 136
4.2 Descriptive Evidence
4.2.1 Volume of Disclosures from Announcements and News
The descriptive statistics of the volume of disclosures from announcements and
coverage by the media are reported in Table 6. These figures are aggregated over all 40
companies. In terms of volume of items and total sentences disclosed, the media discloses
more company information than does the company directly via its announcements. On the
signal basis, companies prefer to disclose neutral messages while the media divides almost
equally between favourable and neutral messages. Obviously, unfavourable messages are the
least common disclosures in both sources. With respect to the sensitivity category, non price-
sensitive information is far more prevalent than price-sensitive information in these two
sources.
29
Table 6: Descriptive Statistics of Volume of Disclosures by Source and by Category Mean numbers announcements news items Number of items 53.73 104.65 Number of total sentences 757.18 915.80 By signal category: No. of favourable sentences 290.08 343.93 No. of neutral sentences 411.10 383.68 No. of unfavourable sentences 56.00 188.20
By sensitivity category: No. of price-sensitive sentences 281.28 295.70 No. of non price-sensitive sentences 475.90 620.10
4.2.2 Disclosures from Announcements
The characteristics of the disclosure measures from the announcements are presented in
Table 7. It reports the number of sentences and proportions of the amount of disclosures as
measured by the number of sentences classified by signal, price-sensitivity, and theme. In
addition, it also reports the descriptive statistics including the mean value of all variables
recorded from the content analysis of announcements.
Regarding the signal of disclosures, more than 50 percent of company disclosures
(announcements) are classified as “neutral”. It is not surprising that the “unfavourable
disclosures” are the smallest component of disclosures from a company; these accounted for
only 8.54 percent of all disclosures whereas the “favourable messages” reach almost 40
percent. This is in agreement with the claim that information provided directly from a
company is often “superficial and one-sided”, i.e., it did not provide sufficient insights and
focused too much on positive events (AICPA 1994, Chapter 3).
The “price-sensitivity” aspect of disclosures accounts for only 37.31% of all disclosures,
so the great majority of disclosures via announcements are “non price-sensitive”. These
findings are consistent with the suggestion made by Brown et al. (1999) that much of the
disclosed information is not value relevant.
The thematic categories of the disclosures are sorted in a descending order of
percentage to all disclosures. Earnings related disclosures (“earnings and results”) are the
most prevalent theme of disclosures from company announcements with 26.71%. The next
three frequent themes are “management” (16.23%), “financing/capital structure” (15.50%),
30
and “others” (13.60%). The distribution of themes is highly skewed, with the top four themes
accounting for more than 70% of disclosures from announcements.
Table 7: Characteristics and Descriptive Statistics of Announcement Disclosure Variables
Theme Number of sentences % of all sentences Mean sentence counts Signal
Company size .390 (.013)* Industry Type -.131 (.420)
** Correlation is significant at the 0.01 level (2-tailed) * Correlation is significant at the 0.05 level (2-tailed) ^ Correlation is significant at the 0.10 level (2-tailed)
Prior empirical evidence has suggested that company size might be an influential
variable to explain the number of recommendation revisions, and in this case the “number of
revisions” is positively associated with “company size” (r = .390, p-value = .013) significant
at the 5 percent level. As expected, this indicates that larger companies are likely to have a
higher number of recommendation revisions than smaller firms. Accordingly, this facilitates
the rejection of the null hypothesis Ho3 (stating that there is no relationship between the
number of analyst recommendation changes and company size). In addition, the correlations
between company size and the characteristics of disclosures are observed. There is a
significant positive relationship between “company size” and the quantity of company
information disclosures, measured by the “number of total sentences of disclosures in
company announcements” (r = .470, p-value = .002). This result is consistent with the
evidence of previous studies (e.g., Ahmed & Courtis 1999) that large companies tend to
disclose more information than small companies.
With respect to industry type, the univariate results show that the influence of industry
type on number of revisions is very weak and not significant for the total number of all
revisions (r = -.131, p-value = .420). Accordingly, the null hypothesis Ho4 (that there is no
relationship between the number of analyst recommendation changes and industry type cannot
be rejected. The relationship between industry type and the number of revisions cannot be
established; implying that industry type is not an indicator of the number of revisions. The
test of significance of an association between industry type and the amount of voluntary
34
disclosures is also observed, and it reveals that the manufacturing and non-manufacturing
firms are not differentiated in terms of number of sentences disclosed in company
announcements and news items.
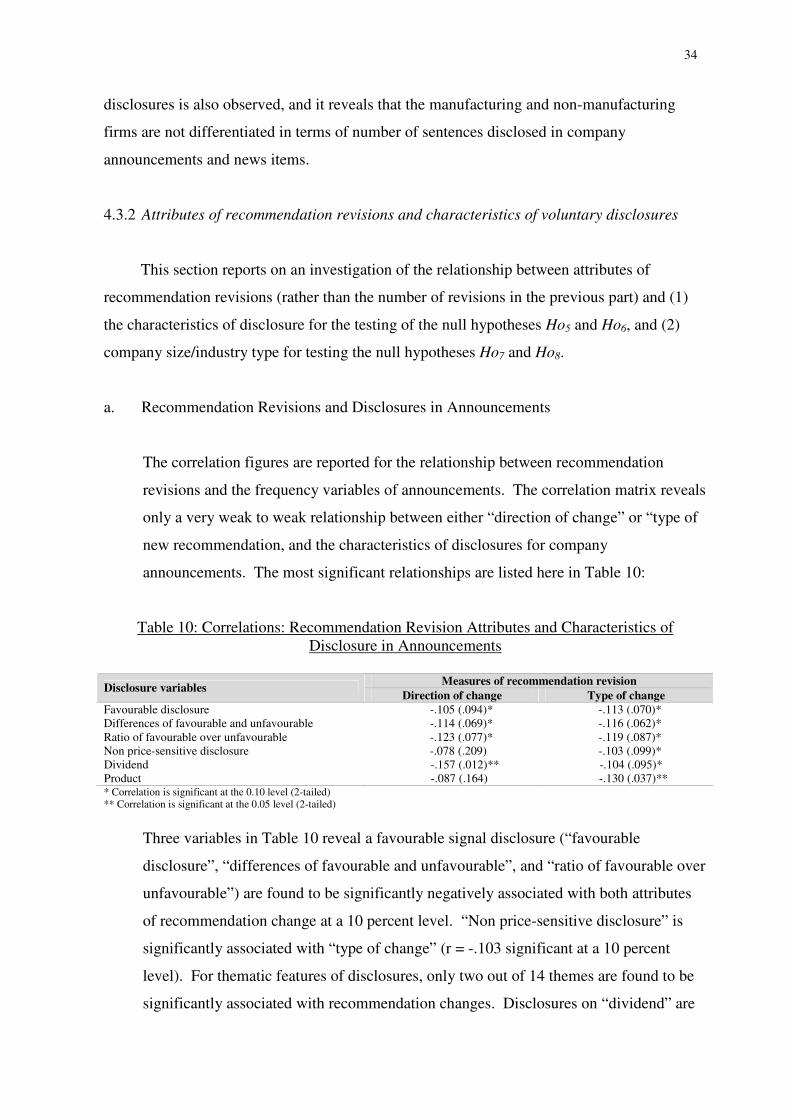
4.3.2 Attributes of recommendation revisions and characteristics of voluntary disclosures
This section reports on an investigation of the relationship between attributes of
recommendation revisions (rather than the number of revisions in the previous part) and (1)
the characteristics of disclosure for the testing of the null hypotheses Ho5 and Ho6, and (2)
company size/industry type for testing the null hypotheses Ho7 and Ho8.
a. Recommendation Revisions and Disclosures in Announcements
The correlation figures are reported for the relationship between recommendation
revisions and the frequency variables of announcements. The correlation matrix reveals
only a very weak to weak relationship between either “direction of change” or “type of
new recommendation, and the characteristics of disclosures for company
announcements. The most significant relationships are listed here in Table 10:
Table 10: Correlations: Recommendation Revision Attributes and Characteristics of Disclosure in Announcements
Measures of recommendation revision Disclosure variables Direction of change Type of change
Favourable disclosure -.105 (.094)* -.113 (.070)* Differences of favourable and unfavourable -.114 (.069)* -.116 (.062)* Ratio of favourable over unfavourable -.123 (.077)* -.119 (.087)* Non price-sensitive disclosure -.078 (.209) -.103 (.099)* Dividend -.157 (.012)** -.104 (.095)* Product -.087 (.164) -.130 (.037)** * Correlation is significant at the 0.10 level (2-tailed) ** Correlation is significant at the 0.05 level (2-tailed)
Three variables in Table 10 reveal a favourable signal disclosure (“favourable
disclosure”, “differences of favourable and unfavourable”, and “ratio of favourable over
unfavourable”) are found to be significantly negatively associated with both attributes
of recommendation change at a 10 percent level. “Non price-sensitive disclosure” is
significantly associated with “type of change” (r = -.103 significant at a 10 percent
level). For thematic features of disclosures, only two out of 14 themes are found to be
significantly associated with recommendation changes. Disclosures on “dividend” are
35
negatively related to “direction of change” (r = -.157, p-value = .012) and “type or
change (r = -.104, p-value = .095). Disclosures on “product” information are
significantly related to “type of change” (r = -.130) at a 5 percent level. These
significant associations suggest that the null hypothesis Ho5 ( that there is no
relationship between recommendation changes and characteristics of disclosures from
announcements) can be rejected. It is concluded that there is a relationship between
recommendation changes and quality of disclosures (in terms of signal, price-sensitivity,
or themes) from company announcements.
b. Recommendation Revisions and Disclosures in News
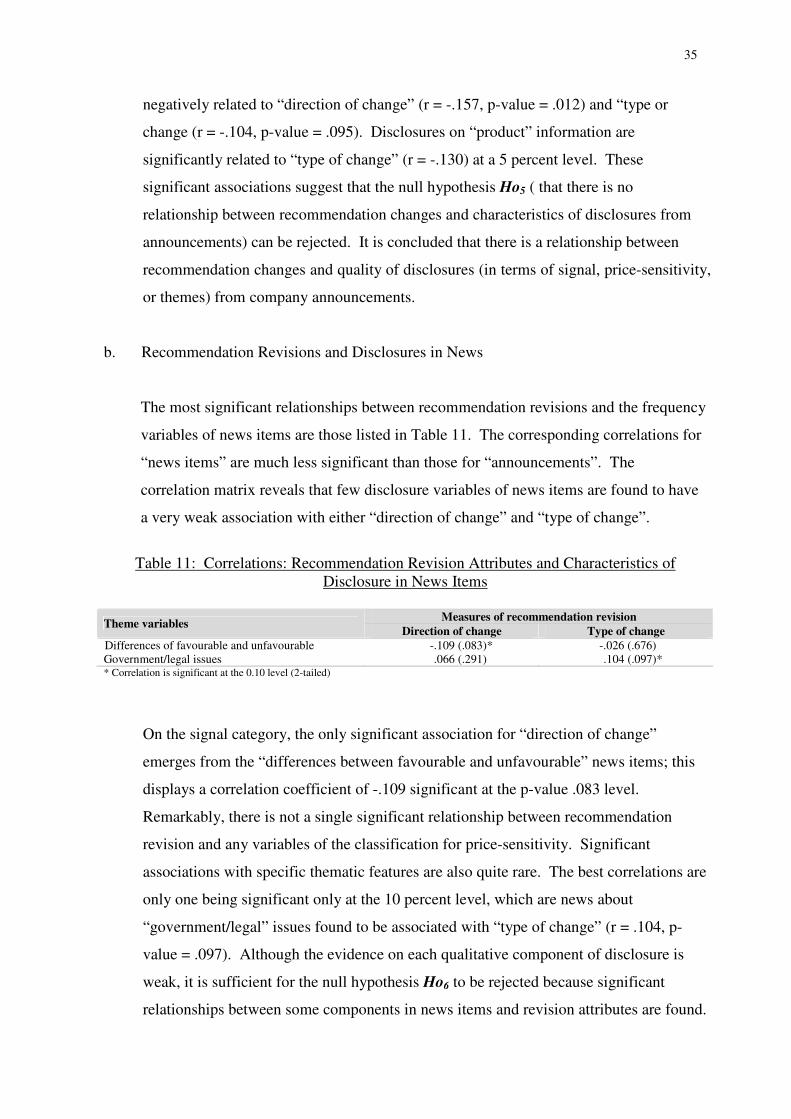
The most significant relationships between recommendation revisions and the frequency
variables of news items are those listed in Table 11. The corresponding correlations for
“news items” are much less significant than those for “announcements”. The
correlation matrix reveals that few disclosure variables of news items are found to have
a very weak association with either “direction of change” and “type of change”.
Table 11: Correlations: Recommendation Revision Attributes and Characteristics of
Disclosure in News Items
Measures of recommendation revision Theme variables Direction of change Type of change Differences of favourable and unfavourable -.109 (.083)* -.026 (.676) Government/legal issues .066 (.291) .104 (.097)* * Correlation is significant at the 0.10 level (2-tailed)
On the signal category, the only significant association for “direction of change”
emerges from the “differences between favourable and unfavourable” news items; this
displays a correlation coefficient of -.109 significant at the p-value .083 level.
Remarkably, there is not a single significant relationship between recommendation
revision and any variables of the classification for price-sensitivity. Significant
associations with specific thematic features are also quite rare. The best correlations are
only one being significant only at the 10 percent level, which are news about
“government/legal” issues found to be associated with “type of change” (r = .104, p-
value = .097). Although the evidence on each qualitative component of disclosure is
weak, it is sufficient for the null hypothesis Ho6 to be rejected because significant
relationships between some components in news items and revision attributes are found.
36
c. Recommendation Revisions and Control Variables
The univariate analysis between the attributes of recommendation revisions and
company size/industry type has also been conducted. In the absence of conventionally
significant relationships between any measures of recommendation revisions and
company size/industry type, the null hypothesis Ho7 (that there is no relationship
between attributes of recommendation changes and company size) and Ho8 (that there is
no relationship between attributes of recommendation changes and industry type)
cannot be rejected.
4.3.3 Concluding remarks on correlation analysis
Overall, the univariate results suggest that voluntary disclosures do have an impact on
the direction and type of analyst recommendation changes, but that it is difficult to pinpoint
more precise sources of influence. These univariate test results also indicate the need to
perform multivariate analysis in order to be able to further refine the findings. Multivariate
data analysis combining several independent variables is reported in the next section, with the
exception that more meaningful relationships may be revealed.
4.4 Regression analysis
The regression analysis focuses only on an examination of the relationship between each
individual attribute of recommendation revisions and the characteristics of disclosure. Both
attributes of recommendation revisions (“direction of change” and “type of change”) are
measured on a dichotomous scale; as a result the binary logistic regression is applied.
4.4.1 Announcements
The correlations between all independent variables are checked to detect possible
collinearity between any pair of independent variables. The correlation matrix (not reported
here) shows no correlation between independent variables exceeding 0.80. For
comprehensive detection, the VIF values of independent variables in both models are
observed. There are no variables with a VIF value exceeding 10, suggesting that there no
significant presence of multicollinearity.
37
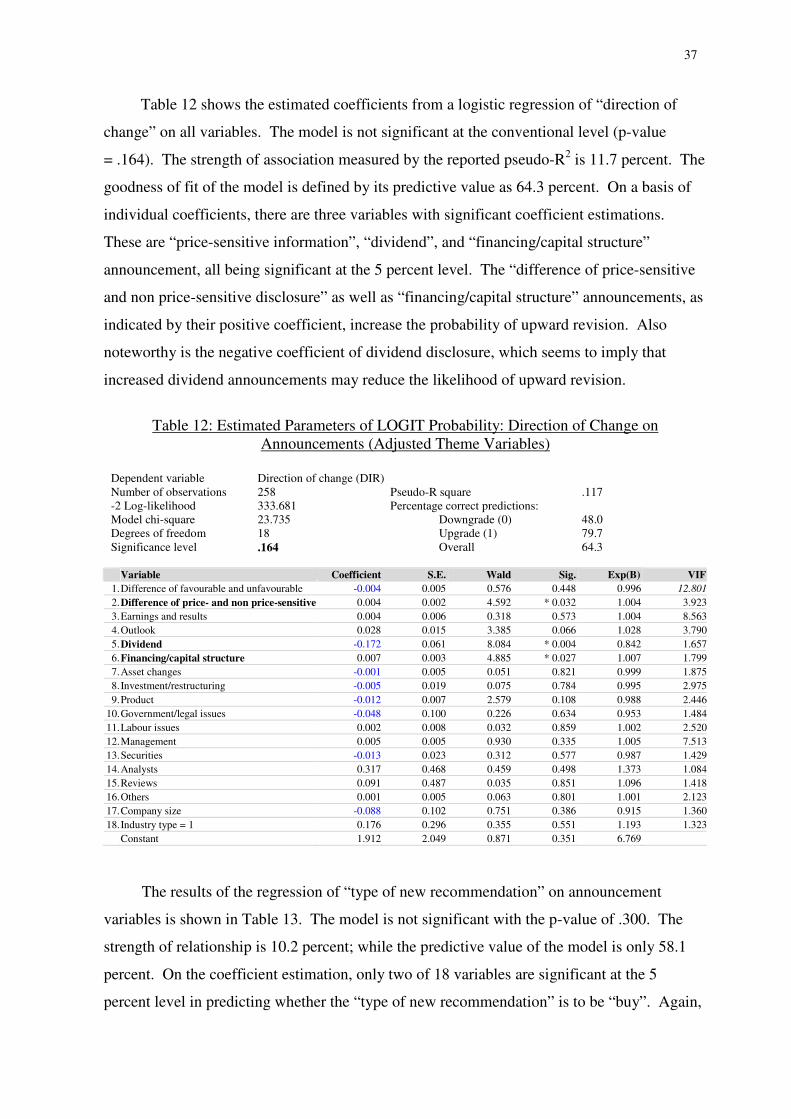
Table 12 shows the estimated coefficients from a logistic regression of “direction of
change” on all variables. The model is not significant at the conventional level (p-value
= .164). The strength of association measured by the reported pseudo-R2 is 11.7 percent. The
goodness of fit of the model is defined by its predictive value as 64.3 percent. On a basis of
individual coefficients, there are three variables with significant coefficient estimations.
These are “price-sensitive information”, “dividend”, and “financing/capital structure”
announcement, all being significant at the 5 percent level. The “difference of price-sensitive
and non price-sensitive disclosure” as well as “financing/capital structure” announcements, as
indicated by their positive coefficient, increase the probability of upward revision. Also
noteworthy is the negative coefficient of dividend disclosure, which seems to imply that
increased dividend announcements may reduce the likelihood of upward revision.
Table 12: Estimated Parameters of LOGIT Probability: Direction of Change on
Announcements (Adjusted Theme Variables)
Dependent variable Direction of change (DIR) Number of observations 258 Pseudo-R square .117 -2 Log-likelihood 333.681 Percentage correct predictions: Model chi-square 23.735 Downgrade (0) 48.0 Degrees of freedom 18 Upgrade (1) 79.7 Significance level .164 Overall 64.3
Regarding the hypothesis testing, even though the evidence is weak (corresponding with the
univariate results) the null hypothesis Ho6 can still be rejected because there is evidence that
several theme variables of news items have a significant impact on recommendation revisions.
For company size and industry type, in this context of news item, there is no evidence that
company size or industry type is significantly related to any attributes of recommendation
revisions. As a result, the findings suggest that the null hypotheses Ho7 (that there is no
significant relationship between recommendation revision and company size) and Ho8 (that
there is no significant relationship between industry type and recommendation revision)
cannot be rejected; these outcomes correspond with the results reported for the univariate data
analysis.
4.4.3 Concluding remarks on regression analysis
There are two major reservations regarding the results and conclusions drawn from the
multivariate analysis which need to be addressed here.
42
First, the direction of some significant relationships is somewhat paradoxical, especially
the direction of relationships between recommendation revisions and disclosure on “dividend”
and “product”, which both report a “negative” relationship. However, the evidence of these
relationships, as found for both the correlations in the univariate analysis and the direction of
coefficient in the multivariate analysis, is not random but consistent throughout the main
analysis of both announcements and news items. One possible explanation for these results is
that “dividend” and “product” disclosures have a positive impact on price changes shortly
after their announcement (e.g., Morse 1982; Thompson et al. 1987) and so analysts have
already upgraded their stock recommendations (the old or previous rating) since the time of
the announcements. As these disclosures may have already been positively reflected in the
share price by the market, further recommendation revisions (the new or following rating)
might be to downgrade, since there is no further basis for analysts to issue more of an upgrade
revision for the company’s shares.
Second, the rejection of the null hypotheses (especially the null hypotheses Ho5 and Ho6
concerning the recommendation revisions and the characteristics of disclosures from
announcements and news items) is made on the basis of statistical models which are overall
not statistically significant but which include some variables that are significant. The
conclusions drawn are tentative, since the evidence of significant relationships is thin, and
scarcely sufficient to enable the rejection of the null hypothesis. The circumstances are
acknowledged and reserved here.
5. Conclusions
This paper examines the impact of voluntary disclosures on sell-side analyst stock
recommendation revisions. Voluntary disclosures include company continuous
announcements and news reports in the media. The characteristics of voluntary disclosures
over the same period of change are examined to determine whether they can explain the
properties of recommendation revision. Content analysis is used as a method for the
measurement of both announcements and news items.
The distribution of sentences in announcements and news (by signal, price-sensitiveness,
or themes) facilitates comparison of disclosures between these two sources. Disclosures in
43
“announcements” are far more positive than in “news”. There is also a larger number of
occurrences of non price-sensitive, rather than price-sensitive, disclosures in both sources.
For the thematic aspect of disclosures, both announcements and news items have some
themes in common; it can be interpreted that these themes are the types of information that a
company is apparently keen to disclose and such information is deemed noteworthy to the
market. Most of the news in the media is generated directly from company sources, which
suggests that announcements and news items represent similar content thus giving the
impression that, to some extent, content in news is only repeating the message from corporate
announcements.
In order to test the hypotheses, both univariate (correlation) and multivariate (regression)
analyses are conducted. The results reject the benchmark null hypothesis and support the
position that there are relationships between analyst recommendation changes and the
characteristics of voluntary disclosures. Ultimately, the main research questions have been
answered in two ways. Firstly, there is evidence of a relationship between the number of
recommendation revisions and volume of voluntary disclosures (sentence counts in company
announcements and the media. It explains that the characteristics of disclosures as measured
by the amount of disclosures are positively associated with the number of recommendation
revisions. This suggests that greater disclosure does lead to more accessible and available
information and hence higher numbers of recommendation revisions for companies.
Secondly, further evidence in terms of an impact on the nature or attributes of
recommendation revisions suggests that qualitative characteristics of disclosures (signal,
price-sensitivity, and theme) do have an impact on the direction and type of new
recommendation. The results from both announcements and news items conclusively indicate
that “favourable” information, “dividend-related” and “product-related” information are the
most important types of information having an impact on analysts’ recommendation revisions.
The control variables, company size and industry type, are moderately significantly associated
with the extent of disclosures, but not significant in relation to the attributes of
recommendation revisions.
It is noted that the findings of news items in this study consistently report weak
evidence of relationship between characteristics of disclosures and attributes of
recommendation revisions compared to those of company announcements. The evidence is
44
consistent throughout the analysis in this study. It can therefore be concluded that the scope
and level of disclosures in news are of an inferior quality to those in company announcements.
Taken as a whole, the findings can be viewed as providing some fairly clear evidence
regarding the research question investigated in this paper. However, there are two
circumstances on which this study has provided a logical comment. First, the direction of
association for “favourable”, “dividend”, or “product” information and attributes of
recommendation revisions being negative, which implies that the higher incidence of these
types of messages tends to decrease the chance of an upgrade revision and/or a revision to buy.
The way that the direction of significant relationships is counter-intuitive could be explained
by the timing of recommendation revision. Disclosures relevant to these types of information
may have triggered positive market reactions as well as positive recommendation revisions
after the disclosures of such information. As a result, subsequent revisions might be
downward. Second, the extent to which conclusions about rejecting some of the null
hypotheses (regarding the relationship between recommendation revisions and the
characteristics of disclosures in announcements and news items) are being made is based on
some, not all, variables that are significant.
The investigation of the extent of voluntarily disclosed information from company
announcements and news, as in this study, is expected to yield better measurement of
voluntary disclosures when compared to previous studies (mostly annual reports).
Nevertheless, some other sources of disclosures such as conference calls, analyst meetings,
and private contacts are notably difficult to gain access to. As a result, the number of
communication channels is restricted to keep the study manageable. Future research could
examine other channels of voluntary disclosures that are not included in this paper. The data
collection process has likely compromised the size of the studied sample. Although the study
examined in excess of 200 observations of recommendation revisions these were drawn from
only 40 companies because of the constraints imposed by the hand-collection and human
coding of data. In addition, the time period of the study covers only two years (1998-1999) as
such disclosures in all sources of this study are restricted to this two-year period, also due to
time constraints. These limitations may restrict the generalisability of the findings. It then
suggests that an expansion of sample size could improve the overall statistical characteristics
of data and improve the generalisation of the results. In addition, a further attempt to secure
45
direct access to analyst research reports could also be a beneficial aspect of additional work in
this area.
46
Notes 1. Voluntary disclosures include company continuous announcements, company news in
the media and narrative disclosure in annual reports. In this paper, the scope of disclosures from the first two sources are analysed and reported, but their readability is not examined.
2. The index is made up of the weighted share prices of approximately 500 of the largest
Australian companies. Established by the ASX at 500 points in January 1980, it is the predominant measure of the overall performance of the Australian share market. The companies are weighted according to their size in terms of market capitalisation (total market value of a company's shares) (ASX 2002).
3. All disclosures in company announcements are labelled (by the company and later
verified by the ASX) as being either price-sensitive or non price-sensitive information. It is noted that Brown et al. (1999) opt to include only the price-sensitive information as the proxy for voluntary disclosures in their work.
5. Holsti (1969, p. 116) describes a theme as a single assertion about some subject. Weber (1990, p. 37) defines a theme as “clusters of words with different meanings or connotations that taken together refer to some issue”. Boyatzis (1998, p. 161) states that “a theme is a pattern found in the information that at the minimum describes and organises the possible observations or at the maximum interprets aspects of the phenomenon”.
6. The approach used in this study actually applies both “meaning-oriented” and “form-oriented” analysis. At first, the sentence is analysed by relying on subjective judgement on keywords and the context of the sentence. Later, all sentences are counted and aggregated according to the corresponding category to determine the category importance.
7. Personal email communications in February 2003 with the ASX Customer Service officer states that the Company Announcements Office (CAO) at the ASX that decides the sensitivity of announcements based on the type and content of reports. Certain types of announcements are always sensitive, e.g., profit reports, takeovers, etc. and others are not, e.g., change of address, etc. For the “grey” area between these extremes, a subjective decision by the processing officer is made based on the content of the announcement. Essentially, the judgement is dependent on the individual announcement, though all officers naturally attempt to be consistent in their decision-making across companies.
8 Despite the independence among three categories, the combination across
categories/elements is recorded for each sentence and the grouping among categories can be obtained.
47
9. In previous research (e.g., Ahmed & Courtis 1999), company size has been measured in a number of ways including total assets, total sales, and market capitalisation. All these three size measures are examined in the preliminary analysis. The correlation between each size measure and the level of disclosures are comparable. In addition, these measures are highly correlated to each other; therefore only one measure, “total sales”, is selected as a reported proxy for company size in this study.
10. The comparable ratio for Stickel (1995) is 4.6:1, Womack (1996) is 6.3:1, and Ho and
Harris (1998) is 5.2:1.
48
References Abrahamson, E. and Amir, E. 1996, ‘The information content of the president’s letter to
shareholders’, Journal of Business Finance & Accounting, vol. 23, no. 8, pp. 1157-1182. Ahmed, K. and Courtis, J. K. 1999, ‘Associations between corporate characteristics and
disclosure levels in annual reports: A meta-analysis’, British Accounting Review, vol. 31, no. 1, pp. 35-61.
American Institute of Certified Public Accountants (AICPA) Special Committee on Financial
Reporting 1994, Improving Business Reporting - A Customer Focus: Meeting the Information Needs of Investors and Creditors, AICPA, New York.
Amir, E. and Lev, B. 1996, ‘Value-relevance of nonfinancial information: The wireless
communications industry’, Journal of Accounting and Economics, vol. 22, no. 1-3, pp. 3-30.
Australian Stock Exchange (ASX) 2002, Glossary of sharemarket terms, [Online, accessed 12
December 2002]. URL: http://www.asx.com.au/glossary/Glossary.shtm Australian Stock Exchange (ASX) 2003a, Guidance Note 8 - Continuous Disclosure: Listing
ASX, Sydney. Baginski, S. P. and Hassell, J. M. 1990, ‘The market interpretation of management earnings
forecasts as a predictor of subsequent financial analyst forecast revision’, The Accounting Review, vol. 65, no. 1, pp. 175-190.
Bauman, W. S., Datta, S. and Iskandar-Datta, M. E. 1995, ‘Investment analyst
recommendations: A test of ‘the announcement effect’ and ‘the valuable information effect”, Journal of Business Finance & Accounting, vol. 22, no. 5, pp. 659-670.
Beattie, V., McInnes, B. and Fearnley, S. 2002, ‘Narrative reporting by listed UK companies:
A comparative within-sector topic analysis’, Working paper, University of Stirling, Scotland, UK.
Beattie, V., McInnes, B. and Fearnley, S. 2004, ‘A methodology for analysing and evaluating
narratives in annual reports: A comprehensive descriptive profile and metrics for disclosure quality attributes’, Accounting Forum, vol. 28, no. 3, pp. 205-236.
Bhushan, R. 1989, ‘Firm characteristics and analyst following’, Journal of Accounting and
Economics, vol. 11, no. 2-3, pp. 255-274. Botosan, C. A. 1997, ‘Disclosure level and the cost of equity capital’, The Accounting
Review, vol. 72, no. 3, pp. 323-349.
49
Botosan, C. A. and Harris, M. S. 2000, ‘Motivations for a change in disclosure frequency and its consequences: An examination of voluntary quarterly segment disclosures’, Journal of Accounting Research, vol. 38, no. 2, pp. 329-353.
Botosan, C. A. and Plumlee, M. A. 2002, ‘A re-examination of disclosure level and the
expected cost of equity capital’, Journal of Accounting Research, vol. 40, no. 1, pp. 21-40.
Boyatzis, R. E. 1998, Transforming qualitative information: Thematic analysis and code
development, Sage Publications, Thousand Oaks, California. Bradshaw, M. T. 2002, ‘The use of target prices to justify sell-side analysts’ stock
recommendations’, Accounting Horizons, vol. 16, no. 1, pp. 27-41. Bradshaw, M. T. 2004, ‘How do analysts use their earnings forecasts in generating stock
recommendation?’ The Accounting Review, vol. 79, no. 1, pp. 25-50. Breton, G. and Taffler, R. J. 2001, ‘Accounting information and analyst stock
recommendation decisions: a content analysis approach’, Accounting & Business Research, vol. 31, no. 2, pp. 91-101.
Brookfield, D. and Morris, R. 1992, ‘The market impact of UK company news
announcements’, Journal of Business Finance & Accounting, vol. 19, no. 4, pp. 585-602. Brown, L. D. 1993, ‘Earnings forecasting research: Its implications for capital markets
research’, International Journal of Forecasting, vol. 9, no. 3, pp. 295-320. Brown, P. R. 1997, ‘Financial data and decision-making by sell-side analysts’, The Journal of
Financial Statement Analysis, vol. 2, no. 3, pp. 43-48. Brown, P., Taylor, S. L. and Walter, T. S. 1999, ‘The impact of statutory sanctions on the
level and information content of voluntary corporate disclosure’, Abacus, vol. 35, no. 2, pp. 138-162.
Bryan, S. H. 1997, ‘Incremental information content of required disclosures contained in
management discussion and analysis’, The Accounting Review, vol. 72, no. 2, pp. 285-301.
Cooke, T. E. 1989, ‘Voluntary corporate disclosure by Swedish Companies’, Journal of
International Financial Management and Accounting, vol. 1, no. 2, pp. 171-195. Cooke, T. E. 1991, ‘An assessment of voluntary disclosure in the annual reports of Japanese
corporations’, International Journal of Accounting, vol. 26, no. 3, pp. 174-189. Cooke, T. E. 1992, ‘The impact of size, stock market listing and industry type on disclosure in
the annual reports of Japanese listed corporations’, Accounting & Business Research, vol. 22, no. 87, pp. 229-237.
Diamond, D. W. and Verrecchia, R. E. 1991, ‘Disclosure, liquidity, and the cost of capital’,
The Journal of Finance, vol. 46, no. 4, pp. 1325-1359.
50
Eccles, R. G. and Mavrinac, S. C. 1995, ‘Improving the corporate disclosure process’, Sloan Management Review, vol. 36, no. 4, pp. 11-25.
Ely, K. and Waymire, G. 1999, ‘Accounting standard-setting organizations and earnings
relevance: Longitudinal evidence from NYSE common stocks, 1927-93’, Journal of Accounting Research, vol. 37, no. 2, pp. 293-317.
Financial Accounting Standards Board (FASB) 2001, Improving Business Reporting: Insights
into enhancing voluntary disclosures, FASB, New York. Foster, G. 1986, Financial Statement Analysis, 2nd edn, Prentice-Hall, Englewood Cliffs,
New Jersey. Francis, J. and Schipper, K. 1999, ‘Have financial statements lost their relevance?’ Journal of
Accounting Research, vol. 37, no. 2, pp. 319-352. Francis, J., Schipper, K. and Vincent, L. 2002, ‘Expanded disclosures and the increased
usefulness of earnings announcements’, The Accounting Review, vol. 77, no. 3, pp. 515-546.
Francis, J. and Soffer, L. 1997, ‘The relative informativeness of analysts’ stock
recommendations and earnings forecasts revisions’, Journal of Accounting Research, vol. 35, no. 2, pp. 193-211.
Frazier, K. B., Ingram, R. W. and Tennyson, B. M. 1984, ‘A methodology for the analysis of
narrative accounting disclosures’, Journal of Accounting Research, vol. 22, no. 1, pp. 318-331.
Grant, J., Fogarty, T. J., Bricker, R. J. and Previts, G. J. 2000, Corporate reporting of
nonfinancial performance indicators and operating measures, Financial Executives Research Foundation, Morristown, New Jersey.
Guthrie, J. and Mathews, M. R. 1985, ‘Corporate social accounting in Australasia’, in
Research in corporate social performance and policy, vol. 7, ed. Preston, L. E., JAI Press, Greenwich, Connecticut, pp. 251-277.
Hackston, D. and Milne, M. J. 1996, ‘Some determinants of social and environmental
disclosures in New Zealand companies’, Accounting, Auditing & Accountability Journal, vol. 9, no. 1, pp. 77-108.
Hassell, J. M., Jennings, R. H. and Lasser, D. J. 1988, ‘Management earnings forecasts: Their
usefulness as a source of firm-specific information to security analysts’, The Journal of Financial Research, vol. 11, no. 4, pp. 303-319.
Healy, P. M., Hutton, A. P. and Palepu, K. G. 1999, ‘Stock performance and intermediation
changes surrounding sustained increases in disclosure’, Contemporary Accounting Research, vol. 16, no. 3, pp. 485-520.
Healy, P. M. and Palepu, K. G. 1993, ‘The effect of firms’ financial disclosure strategies on
stock prices’, Accounting Horizons, vol. 7, no. 1, pp. 1-11.
51
Healy, P. M. and Palepu, K. G. 2001, ‘Information asymmetry, corporate disclosure, and the capital markets: A review of the empirical disclosure literature’, Journal of Accounting and Economics, vol. 31, no. 1-3, pp. 405-440.
Ho, M. J. and Harris, R. S. 1998, ‘Market reactions to messages from brokerage ratings
systems’, Financial Analysts Journal, vol. 54, no. 1, pp. 49-57. Ho, M. J. and Harris, R. S. 2000, ‘Brokerage analysts’ rationale for investment
recommendations: Market responses to different types of information’, The Journal of Financial Research, vol. 23, no. 4, pp. 449-468.
Holland, J. B. 1998, ‘Private disclosure and financial reporting’, Accounting & Business
Research, vol. 28, no. 4, pp. 255-269. Holsti, O. R. 1969, Content analysis for the social sciences and humanities, Addison-Wesley
Publishing, Reading, Massachusetts. Hossain, M. and Adams, M. 1995, ‘Voluntary financial disclosure by Australian listed
companies’, Australian Accounting Review, vol. 5, no. 2, pp. 45-55. Ingram, R. W. and Frazier, K. B. 1983, ‘Narrative disclosures in annual reports’, Journal of
Business Research, vol. 11, no. 1, pp. 49-60. Jones, M. J. and Shoemaker, P. A. 1994, ‘Accounting narratives: A review of empirical
studies of content and readability’, Journal of Accounting Literature, vol. 13, pp. 142-184.
Krippendorff, K. 1980, Content analysis: An introduction to its methodology, Sage commtext
series vol. 5, Sage Publications, Beverly Hills. Lang, M. H. and Lundholm, R. J. 1993, ‘Cross-sectional determinants of analyst ratings of
corporate disclosures’, Journal of Accounting Research, vol. 31, no. 2, pp. 246-271. Lang, M. H. and Lundholm, R. J. 1996, ‘Corporate disclosure policy and analyst behavior’,
The Accounting Review, vol. 71, no. 4, pp. 467-496. Lang, M. H. and Lundholm, R. J. 2000, ‘Voluntary disclosure and equity offerings: Reducing
information asymmetry or hyping the stock?’ Contemporary Accounting Research, vol. 17, no. 4, pp. 625-662.
Leuz, C. and Verrecchia, R. E. 2000, ‘The economic consequences of increased disclosure’,
Journal of Accounting Research, vol. 38 Supplement, pp. 91-124. Lev, B. and Zarowin, P. 1999, ‘The boundaries of financial reporting and how to extend
them’, Journal of Accounting Research, vol. 37, no. 2, pp. 353-385. Marston, C. L. and Shrives, P. J. 1991, ‘The use of disclosure indices in accounting research:
A review article’, British Accounting Review, vol. 23, no. 3.
52
Meek, G. K., Roberts, C. B. and Gray, S. J. 1995, ‘Factors influencing voluntary annual reports disclosures by US, UK and Continental European multinational corporations’, Journal of International Business Studies, vol. 26, no. 3, pp. 555-572.
Milne, M. J. and Adler, R. W. 1999, ‘Exploring the reliability of social and environmental
Morse, D. 1982, ‘Wall Street Journal announcements and the securities markets’, Financial
Analysts Journal, vol. 38, no. 2, pp. 69-76. Neuendorf, K. A. 2002, The Content Analysis Guidebook, Sage Publications, Thousand Oaks,
California. O’Brien, P. C. and Bhushan, R. 1990, ‘Analyst following and institutional ownership’,
Journal of Accounting Research, vol. 28 Supplement, pp. 55-82. Orlow, D. K. 1999, ‘Market structure: How “Wall Street” works’, Journal of Retail Banking
Services, vol. 21, no. 1, pp. 57-59. Previts, G. J., Bricker, R. J., Robinson, T. R. and Young, S. J. 1994, ‘A content analysis of
sell-side financial analyst company reports’, Accounting Horizons, vol. 8, no. 2, pp. 55-70.
Pritamani, M. and Singal, V. 2001, ‘Return predictability following large price changes and
information releases’, Journal of Banking & Finance, vol. 25, no. 4, pp. 631-656. Rippington, F. A. and Taffler, R. J. 1995, ‘The information content of firm financial
disclosures’, Journal of Business Finance & Accounting, vol. 22, no. 3, pp. 345-362. Robb, S. W. G., Single, L. E. and Zarzeski, M. T. 2001, ‘Nonfinancial disclosures across
Anglo-American countries’, Journal of International Accounting, Auditing & Taxation, vol. 10, no. 1, pp. 71-83.
Rogers, R. K. and Grant, J. 1997, ‘Content analysis of information cited in reports of sell-side
financial analysts’, The Journal of Financial Statement Analysis, vol. 3, no. 1, pp. 17-31. Ryan, P. and Taffler, R. J. 2001, ‘Do brokerage houses add value? The market impact of sell-
side analyst recommendation changes’, Working paper, Cranfield School of Management, UK.
Ryan, P. and Taffler, R. J. 2004, ‘Are economically significant stock returns and trading
volumes driven by firm-specific news releases?’, Journal of Business Finance & Accounting, vol. 31, no. 1-2, pp. 49-82.
Schipper, K. 1991, ‘Analysts’ forecasts’, Accounting Horizons, vol. 5, no. 4, pp. 105-121. Smith, M. and Taffler, R. J. 2000, ‘The chairman’s statement - A content analysis of
Stickel, S. E. 1995, ‘The anatomy of the performance of buy and sell recommendations’, Financial Analysts Journal, vol. 5, no. 5, pp. 25-39.
Tennyson, B. M., Ingram, R. W. and Dugan, M. T. 1990, ‘Assessing the information content
of narrative disclosures in explaining bankruptcy’, Journal of Business Finance & Accounting, vol. 17, no. 3, pp. 391-410.
Thompson, R. B., Olsen, C. and Dietrich, J. R. 1987, ‘Attributes of news about firms: An
analysis of firm-specific news reported in the Wall Street Journal Index’, Journal of Accounting Research, vol. 25, no. 2, pp. 245-274.
Uang, J. Y., Citron, D. B. and Taffler, R. J. 2001, ‘The information content of going-concern
uncertainty disclosures’, paper presented at the Lunchtime Research Seminar, Cranfield School of Management, UK, 13 September.
Walker, M. and Tsalta, A. 2001, Corporate financial disclosure and analyst forecasting
activity: Preliminary evidence for the UK, Research report no. 67, The Certified Accountants Educational Trust, London.
Wallman, S. M. H. 1995, ‘The future of accounting and disclosure in an evolving world: The
need for dramatic change’, Accounting Horizons, vol. 9, no. 3, pp. 81-91. Waymire, G. 1986, ‘Additional evidence on the accuracy of analyst forecasts before and after
voluntary management earnings forecasts’, The Accounting Review, vol. 61, no. 1, pp. 129-142.
Weber, R. P. 1990, Basic content analysis, 2nd edn, Sage university papers series on
quantitative applications in the social sciences no. 07-049, Sage Publications, Newbury Park, California.
Welker, M. 1995, ‘Disclosure policy, information asymmetry, and liquidity in equity markets’,
Contemporary Accounting Research, vol. 11, no. 2, pp. 801-827. Williams, P. A. 1996, ‘The relation between a prior earnings forecast by management and
analyst response to a current management forecast’, The Accounting Review, vol. 71, no. 1, pp. 103-115.
Wimmer, R. D. and Dominick, J. R. 2003, Mass media research: An introduction, 7th edn,
Wadsworth/Thomson Learning, Belmont, California. Womack, K. L. 1996, ‘Do brokerage analysts’ recommendations have investment value?’ The
Journal of Finance, vol. 51, no. 1, pp. 137-167.
54
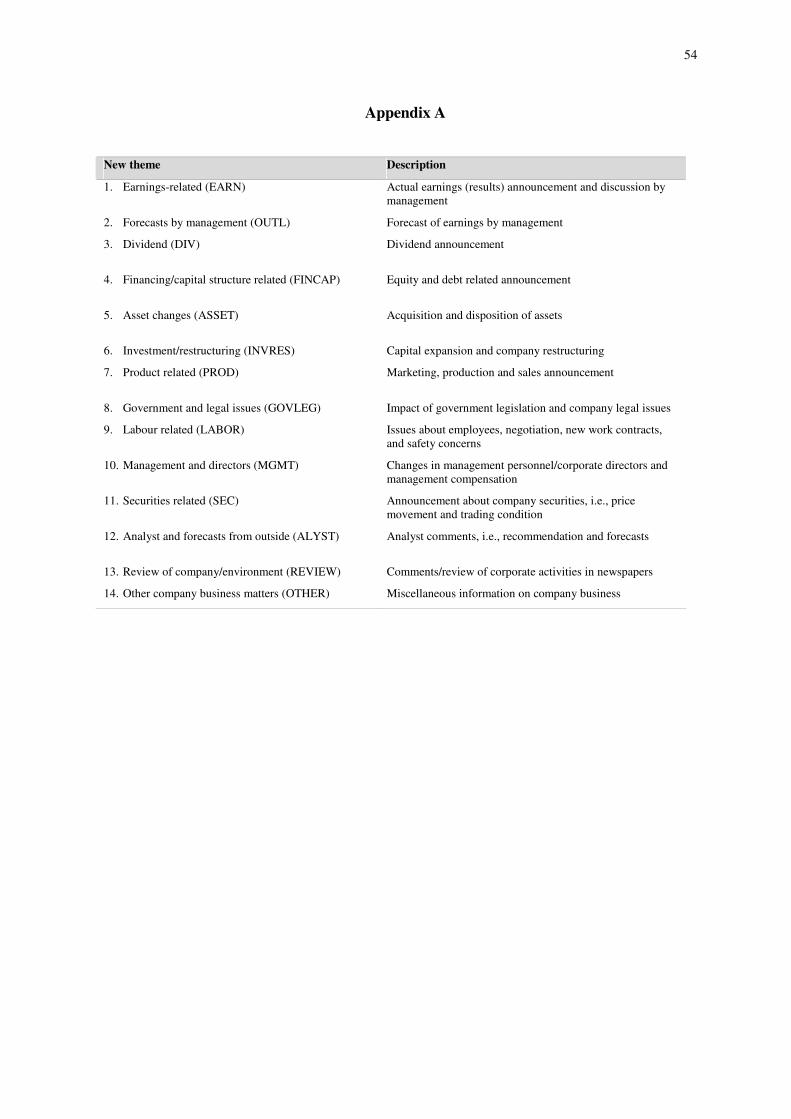
Appendix A
New theme Description
1. Earnings-related (EARN) Actual earnings (results) announcement and discussion by management
2. Forecasts by management (OUTL) Forecast of earnings by management
3. Dividend (DIV)
Dividend announcement
4. Financing/capital structure related (FINCAP)
Equity and debt related announcement
5. Asset changes (ASSET)
Acquisition and disposition of assets
6. Investment/restructuring (INVRES) Capital expansion and company restructuring
7. Product related (PROD)
Marketing, production and sales announcement
8. Government and legal issues (GOVLEG) Impact of government legislation and company legal issues
9. Labour related (LABOR) Issues about employees, negotiation, new work contracts, and safety concerns
10. Management and directors (MGMT) Changes in management personnel/corporate directors and management compensation
11. Securities related (SEC)
Announcement about company securities, i.e., price movement and trading condition
12. Analyst and forecasts from outside (ALYST)
Analyst comments, i.e., recommendation and forecasts
13. Review of company/environment (REVIEW) Comments/review of corporate activities in newspapers
14. Other company business matters (OTHER) Miscellaneous information on company business
55
Appendix B: Illustration of the coding of announcements and news items
Announcement from “Pacifica Group Limited” (PBB): 13 sentences The square bracket [ ] with a number after the sentence indicates the sentence number. ������������� ��� ���������� ����� �������������� �
Sentence Theme* Signal^ Price-sensitive# Note 1 IP F PS establish a joint venture 2 IP N PS joint venture 3 AO N PS recent acquisition 4 BC N PS company 5 BC F PS market 6 CO F PS outlook 7 IP F PS Joint venture to build plant 8 PD N PS product 9 PD N PS product
10 PD N PS product 11 BC N PS company 12 BC N PS company background 13 PD N PS product
* Theme code referred to Appendix A
^ Signal: F = favourable, N = neutral, U = unfavourable # Price-sensitivity: PS = price-sensitive, NS = non price-sensitive