Page 1
Civil Engineering and Urban Planning: An International Journal (CiVEJ ) Vol.4, No.2, June 2017
DOI:10.5121/civej.2017.4201 1
THE IMPACT OF WAITING TIME ON
PEDESTRIAN VIOLATIONS AT SIGNALIZED
INTERSECTIONS
Shuyan Chen, Jiping Xing
and Yang Cao
School of Transportation, Southeast Univ., Nanjing, Jiangsu Province, China.
ABSTRACT
The phenomenon that pedestrian violates traffic signals at intersections and crosses with danger is
universal. This study aims to find out the influence of the waiting time of pedestrians at an intersection and
the three main factors of pedestrian violations. In this study, 13 intersections and 1075 violations sample
were collected in Suzhou China, which had different maximum waiting times. The validation would use the
complementary video data. There are several factors, which have great influence on the proportion of
pedestrian violations, such as the age, sex, arrive time, red phase, conflicting traffic volume and the length
of volume crosswalks. Additionally, The significance of pedestrian maximum waiting time was highlighted
in the end. For the purpose of reducing dangerous pedestrian behaviors at signalized intersections,
minimizing waiting times is supposed to be one proper way.
KEYWORDS
Pedestrians ;Violations; Signalized intersections; Crossing Behaviour;
1. INTRODUCTION
In China, the crucial proportion of total traffic related injuries is related to pedestrian injuries.
Currently, pedestrians’ safety in urban areas has gained increasing concern. Meanwhile, the most
vulnerable users for pedestrians are signalized intersections that are in urban areas. Besides,
approximately sixty percentages of the situations pedestrians are wounded happened at
intersections in cities. As the result of the fact that intersections are the most vulnerable places
where pedestrians are exposed to motorized traffic, the intersection becomes the core roadway
factor which is related to the high concentration of vehicle pedestrian crashes. It is widely known
that intersections are complexity traffic environments. Under the impacts of one or multiple
contributing elements, such as road design, human behaviour, and built an environment,
pedestrians can be injured.
It has been highlighted in a large amount of recent studies that the factors, such as built
environment and road, play an important role on pedestrian safety . Meanwhile, the significance
of human factors is also demonstrated in some other studies. In addition, the elements associated
with pedestrians’ risky behaviors, such as red-light violations, have already been investigated in a
few past studies.
In spite of the increasing studies on this subject, only very limited empirical researches
investigate deeply into the time of pedestrians’ arrival at intersections (the moment during
pedestrians reach to signal intersections) and impacts of the waiting time (red phase). Meanwhile,
Page 2
Civil Engineering and Urban Planning: An International Journal (CiVEJ ) Vol.4, No.2, June 2017
2
depending on moments of the crossing with respects to the pedestrians’ signal, violations have not
been classified and modelled by previous studies, which only have analysed a very small sample
of intersections. In addition, past studies have rarely explored the implantation of video data.
In this paper, factors such as time of arrival, time of departure, and maximum waiting time, as
well as the analysis of pedestrian violations at signalized intersections, which have been rarely
studied, are presented. Simultaneously, based on arrival time during the cycle, previous studies
are added in this study by examining wait times. Moreover, one of the largest consideration in
this type of study is the sample of studied intersections. The study will model violation
probability by utilizing the discrete choice modelling approach. In addition, the study will collect
the video data, which will be processed for validation, for two intersections.
In the next section, the background of this work will be presented, followed by an interpretation
of the recommended methodology. Then come the presentation and discussion of the
experimental results. The final chapter is the conclusion.
2. PROBLEM DESCRIPTION
Factors associated with pedestrian crossing behavior have been widely studied. These factors are
related to the individual characteristics, environment, and other pedestrians ’ and road users’
behavior, and may have combined effects. Studies have determined that men have a tendency to
commit more violations than women (Moyano Diaz, 2002; Rosenbloom, 2009; Tiwari et al.,
2007; Yagil, 2000) and young adults tend to violate a traffic light more often than other age
groups. As people age, they are less likely to take risks while crossing the road, due in part to
their decreasing mobility (Guo et al., 2011; Zhuang & Wu, 2011). The people surrounding a
pedestrian will also affect her or his crossing behavior. The larger the group of pedestrians, either
traveling together or waiting at an intersection, the less likely a pedestrian is to violate the traffic
control (Rosenbloom, 2009; Zhuang & Wu, 2011). Teenagers, however, are more likely to violate
traffic control in a larger group: Rosenbloom (2009) suggests that teenagers traveling with their
peers tend to take bigger risks for reasons such as social acceptance. The trip purpose is also
likely to impact the decision to commit violations. People traveling to work or school are more
likely to commit violations than people traveling leisurely (Guo et al., 2011).
A pedestrian’s decision to violate traffic signalization will also be affected by the characteristics
of the intersection. Factors such as the presence of a pedestrian signal (Cambon de Lavalette et
al., 2009; Markowitz, Sciortino, Fleck, &Yee, 2006) and of countdown displays (Lipovac et al.,in
press) have been proven to reduce the proportion of violations. Research has also been undertaken
on the waiting duration. Van Houten et al. (2007) examined the relationship between pedestrian
waiting time and violations at two signalized mid-block crosswalks. Minimum vehicle green
time, i.e. pedestrian minimum waiting time, was manipulated from 30 s to 1 and 2 min, and it
was found that violation rates increased when the waiting time increased. Similar conclusions
were drawn from a study at seven intersections in India (Tiwari et al.,2007). Recent studies have
also been done in China. Based on observations at five intersections, Wang et al. (2011) found
that people who had violated the traffic signal had a slightly smaller waiting time threshold on
average; in a more recent study and using survey data, Ren et al. (2011) studied crossing
behaviors at signalized intersections in three cities. They found that the largest proportion of
surveyed individuals (30.25%) indicated that they violated traffic rules to save time and for
convenience. It is only in cases where the legal crossing must be made in two phases, that
pedestrians would have much smaller waiting times if they committed a violation (Li & Fernie,
2010).
Page 3
Civil Engineering and Urban Planning: An International Journal (CiVEJ ) Vol.4, No.2, June 2017
3
The length of the crossing will also have an impact: the longer the crossing, the less likely the
violations (Cambon de Lavalette et al., 2009; Cinnamon et al., 2011). Land use and travel
generators are also likely to have a correlation with the proportion of violations. At certain travel
generators, violations have proven to be more common (Cinnamon et al., 2011; Zhuang& Wu,
2011). Pedestrians crossing illegally will wait for an acceptable gap between oncoming traffic to
safely cross the street. When conflicting vehicle flow increases, theses gaps become smaller and
rarer, making it more difficult for pedestrians to cross the street (Wang et al.,2011; Yagil,2000;
Yang et al., 2005).
Other factors, such as the day of the week, the period of the year or the time of day also impact
the proportion of violations, as they are often linked to trip purpose and therefore change
pedestrian behavior (Guo&Wu, 2011; Wang et al., 2011). Weather will affect the level of comfort
of a pedestrian and therefore have an impact on their crossing behavior (Li & Fernie,2010; Yang
et al., 2005). A study conducted in Toronto concluded that in winter conditions, people are less
likely to wait at an intersection due to the cold. Other weather conditions, such as heavy rain, are
also likely to shorten pedestrians’ patience (Li & Fernie, 2010).
The cultural context is also very important. Norms of conduct differ from one place to another,
making it difficult to compare pedestrians from different cultural or social contexts
(Rosenbloom,2009). Furthermore, most studies are done at a punctual place or in a specific area
or city, making it difficult to generalize to other urban areas. Regardless, while results such as the
proportion of violations or the average time a pedestrian will wait can rarely be directly applied
across locations, factors associated with crossing behavior seem to be constant from one region to
another.
Researchers have also explored how personal attitudes can be linked to violations, including
violations of the rules of the road. The theory of planned behavior (TPB) is one of the most
widely used social psychological models of health and safety related behavior (Ajzen, 1991):
one’s decision to engage in a particular behavior depends on one’s attitude towards that behavior,
subjective norms, and perceived behavioral control. The TPB has been applied to understand
pedestrians’ road crossing decisions, in particular through questionnaires. Evans and Norman
(1998) identified all three components of the TPB as significant predictors of road crossing
intentions in three scenarios, with perceived behavioral control being the strongest predictor.
Moyano Diaz (2002) examined TPB in the task of crossing at mid-block: reported violations,
errors and lapses appear causally related to the intention to violate traffic regulations. Young
people have a more positive attitude towards committing violations, perceive subjective norms as
less inhibitory while they have a lower perceived behavioral control. Zhou et al. (2009) also
show that the tendency towards social conformity is associated with increased likelihood in
crossing the road when other pedestrians were crossing. The variables of TPB, as well as
perceived risk, were also significant predictors.
Despite this growing literature on pedestrian crossing behavior, in particular violations, few
studies have looked at the link between violations and pedestrian waiting time, in particular in
Chinese cities. To our knowledge, only one previous study (Van Houten et al., 2007) has looked
at this issue, but their study examined two mid-block crosswalks using precontrolled times. Also,
several other factors have been associated with the proportion of violations. However, to the
extent of our knowledge, there have been very few studies that examine the association of
pedestrian signal presence, time of arrival or maximum waiting time with the propensity to
commit a violation. Studies on waiting time has not been discussed in detail, such as the time
which they arrived at the beginning of the red and must wait the whole red phase or do they
commit violations whatever their time of arrival.
Page 4
Civil Engineering and Urban Planning: An International Journal (CiVEJ ) Vol.4, No.2, June 2017
4
Moreover, violations are usually not differentiated with other dangerous crossings. Violations can
be separated in different categories with different levels of risk. This is not to mention legal
dangerous crossings that expose pedestrians to vehicles as much as certain types of violations.
3. DEFINITIONS AND METHODOLOGY
3.1. The Definitions of Pedestrians’ Violation
The term ‘violation’ in the present research is used to denote any pedestrian crossings which are
initiated during a yellow light, red light, steady hand, or flashing hand. The reader should note
that countdown displays are excluded.
Figure.1 The process of pedestrians’ violation
Hazardous crossings constitute crossings which are initiated during a red phase, whether partially
or wholly. These are defined as hazardous owing to the way in which pedestrians engaging in
these crossings are subjected to ‘conflicting traffic’, this term being used to denote a stream of
vehicles which has the right of way during a red phase. It should be noted that conflicts also occur
between pedestrians and turning vehicles in the course of the pedestrians’ green phase, but this
does not constitute a hazard because the vehicles anticipate crossing pedestrians. It is additionally
noteworthy that patients have a ‘continuous legal right of way’ at intersections, which indicates
that where a crossing is initiated during a green phase but completed during a red phase, this is
not constitutive of a violation.
3.2. The Factor of Crossing Violations
The authors divide crossing behaviours into regular crossings, hazardous crossings, and crossing
violations to facilitate a systematic investigation of pedestrian crossing behaviours at signalised
intersections. Hazardous crossings and crossing violations are not mutually exclusive, thereby
meaning that three sub-groups can be created as follows:
Page 5
Civil Engineering and Urban Planning: An International Journal (CiVEJ ) Vol.4, No.2, June 2017
5
Figure .2 Field of Investigation
(a) Pedestrian Characteristics: Where crossings are initiated at any point of the red phase, a
hazardous violation is considered as having taken place. There are two variants of this
illegal crossing: namely, one which is initiated at the ‘anticipation phase’ (i.e. initiated
overly early) or one which is initiated during the red phase.
(b) Intersection Facilities: One category of crossing violations is not hazardous because
pedestrians are not subjected to conflicting traffic. Crossings of this type are initiated
when the crossing takes place overly late (i.e. on the yellow light, flashing/full hand
where a countdown display is not present) but completion takes place prior to conflicting
traffic receiving the green light.
(c) Traffic State: A crossing is considered legal in cases where pedestrians initiate the
crossing during the green phase or during the walking man signal, irrespective of whether
completion occurs during the red phase. Despite the pedestrians’ continuous legal right of
way in this circumstance, a hazard can be presented by conflicting traffic.
3.3. Site Selection
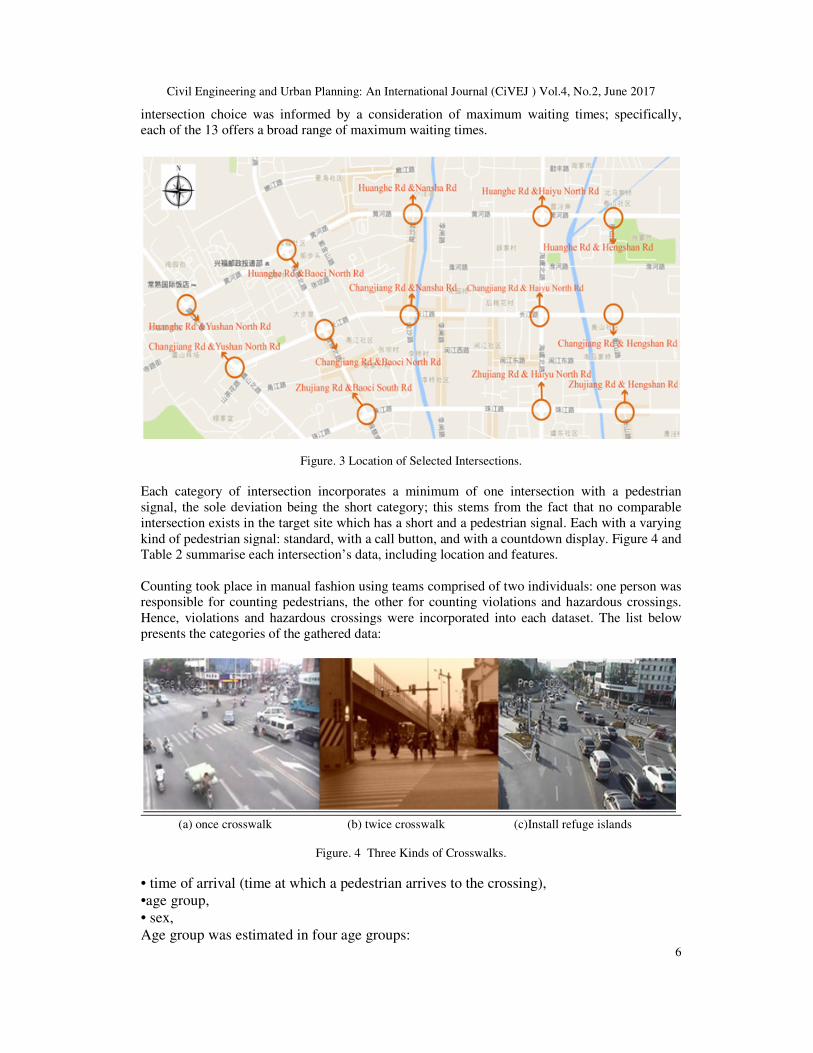
As displayed in Figure 3, 13 intersection crossings have been chosen by the authors in Suzhou,
China. These are representative of the characteristic traffic and roadway environments found in
Chinese urban spaces. The intersections are situated in diverse contexts, such as malls, housing
areas, and office blocks, and each intersection has a distinct configuration along with different
traffic conditions. The defining features of each intersection is listed in Table 1.
As noted, each intersection is in Suzhou, China, and each of the identified 13 is situated on a
prominent arterial: specifically, 12 are situated on Haiyubei Road and 1 is situated on Huanghe
Road. The underlying rationale for this decision was that each intersection should have a
comparable conflicting vehicle flow, geometry, and context. The choice of day was appropriate as
these days of the week generally experience comparable traffic conditions. In this case, the
specified window was June 21 to July 5, 2015. A series of key points to consider determined the
time of day that data collection would take place, which was set as 09:30 to 11:30, the points
being linked to the typical features of peak and non-peak times. It should also be noted that
Page 6
Civil Engineering and Urban Planning: An International Journal (CiVEJ ) Vol.4, No.2, June 2017
6
intersection choice was informed by a consideration of maximum waiting times; specifically,
each of the 13 offers a broad range of maximum waiting times.
Figure. 3 Location of Selected Intersections.
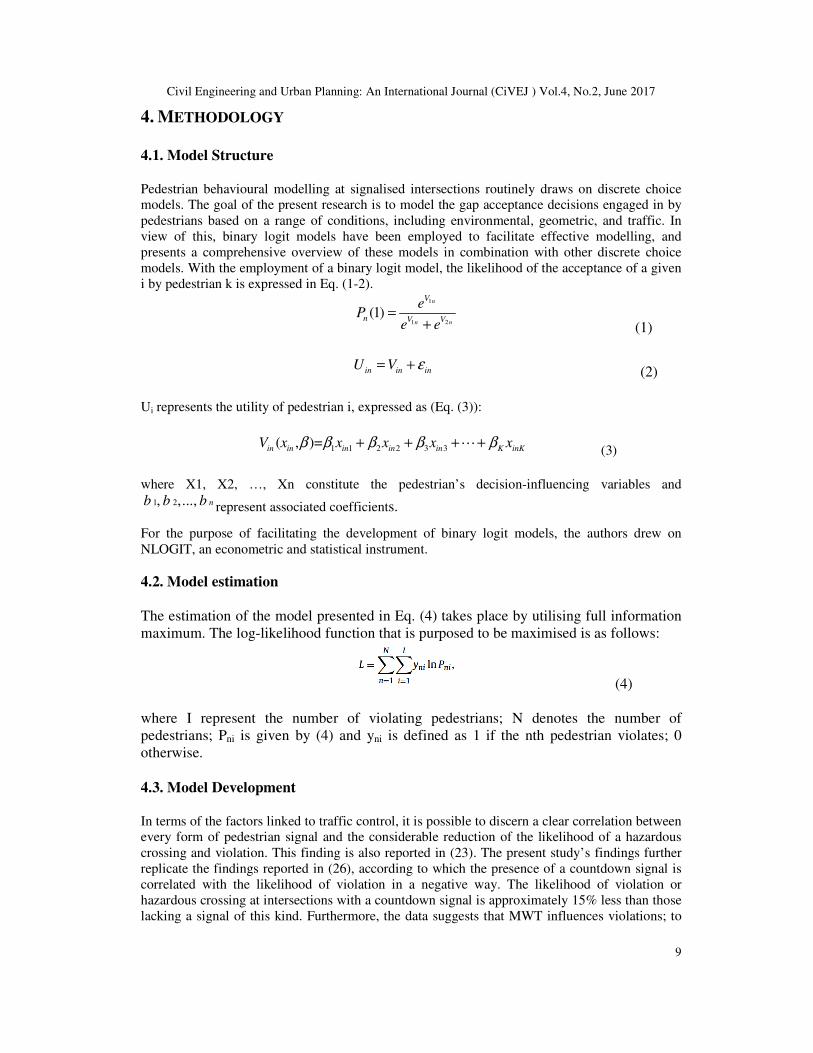
Each category of intersection incorporates a minimum of one intersection with a pedestrian
signal, the sole deviation being the short category; this stems from the fact that no comparable
intersection exists in the target site which has a short and a pedestrian signal. Each with a varying
kind of pedestrian signal: standard, with a call button, and with a countdown display. Figure 4 and
Table 2 summarise each intersection’s data, including location and features.
Counting took place in manual fashion using teams comprised of two individuals: one person was
responsible for counting pedestrians, the other for counting violations and hazardous crossings.
Hence, violations and hazardous crossings were incorporated into each dataset. The list below
presents the categories of the gathered data:
(a) once crosswalk (b) twice crosswalk (c)Install refuge islands
Figure. 4 Three Kinds of Crosswalks.
• time of arrival (time at which a pedestrian arrives to the crossing),
•age group,
• sex,
Age group was estimated in four age groups:
Page 7
Civil Engineering and Urban Planning: An International Journal (CiVEJ ) Vol.4, No.2, June 2017
7
•teenager(age 0-17),
•young adult (age 18-35),
•adult (age 36-59),
•senior (age 60+). Table 1. Characteristics of Selected Intersections
Figure 5. Pedestrians’ Violation Rates in Selected Intersections
3.4. Waiting Time Survey and Statistics
During pedestrian tracking, crossing behaviour was recorded, and Figure 6 provides a schematic
illustration of the way in which waiting time to crossing violation was calculated. A hazardous
crossing violation is considered to have taken place when a pedestrian initiates a crossing during
conflicting traffic’s green or yellow phase, and this risk is referred to as an ‘event’. Prior to
initiating the crossing, the pedestrian waits for a period of time, and this is denoted as the ‘waiting
time’. To be specific, it is equivalent to the time elapsed between the pedestrian’s arrival at the
intersection and their initiation of the crossing.
To investigate the event of time to crossing violation, the researchers have solely taken into
account pedestrians who arrive in the course of the hazardous crossing period. In this way,
Page 8
Civil Engineering and Urban Planning: An International Journal (CiVEJ ) Vol.4, No.2, June 2017
8
pedestrians C1 and C2 are not incorporated into the consideration. The minimum waiting time to
crossing is considered in conjunction with the ‘censoring time’, which constitutes the point of
time after which the crossing’s hazardous nature has been eliminated and before the vehicle’s red
phase. Consequently, pedestrians X1, X2, V1, and V2 are incorporated into the analysis because
they arrive in the course of the hazardous period. A distinction should be noted regarding X1 and
X2 in that their decision to wait until the safe crossing period to initiate their crossing means that
it is regarded as safe when the hazardous phase is completed.
One of the key findings generated from this observation is that the number of pedestrians
travelling in conjunction is associated with the frequency of violation. A manifest representation
of this is reflected in Figure 3 such that the number of violations rises as the size of the group
rises. It is notable that a comparable trend was found for several pedestrians who initiated their
crossing at the corner of the intersection; it is important to note that this has not been listed as a
key finding because much of the data remained uncollected, primarily owing to the complexity of
gathering accurate data regarding this variable.
Figure 6. Schematic Diagram of Time to Violation Crossing
Figure 7. The Distribution of Waiting Time in Intersection Survey
Page 9
Civil Engineering and Urban Planning: An International Journal (CiVEJ ) Vol.4, No.2, June 2017
9
4. METHODOLOGY
4.1. Model Structure
Pedestrian behavioural modelling at signalised intersections routinely draws on discrete choice
models. The goal of the present research is to model the gap acceptance decisions engaged in by
pedestrians based on a range of conditions, including environmental, geometric, and traffic. In
view of this, binary logit models have been employed to facilitate effective modelling, and
presents a comprehensive overview of these models in combination with other discrete choice
models. With the employment of a binary logit model, the likelihood of the acceptance of a given
i by pedestrian k is expressed in Eq. (1-2).
1
1 2(1)
n
n n
V
n V V
eP
e e=
+ (1)
in in inU V ε= + (2)
Ui represents the utility of pedestrian i, expressed as (Eq. (3)):
1 1 2 2 3 3( , )=in in in in in K inKV x x x x xLβ β β β β+ + + + (3)
where X1, X2, …, Xn constitute the pedestrian’s decision-influencing variables and
1 2, ,..., nb b b represent associated coefficients.
For the purpose of facilitating the development of binary logit models, the authors drew on
NLOGIT, an econometric and statistical instrument.
4.2. Model estimation
The estimation of the model presented in Eq. (4) takes place by utilising full information
maximum. The log-likelihood function that is purposed to be maximised is as follows:
(4)
where I represent the number of violating pedestrians; N denotes the number of
pedestrians; Pni is given by (4) and yni is defined as 1 if the nth pedestrian violates; 0
otherwise.
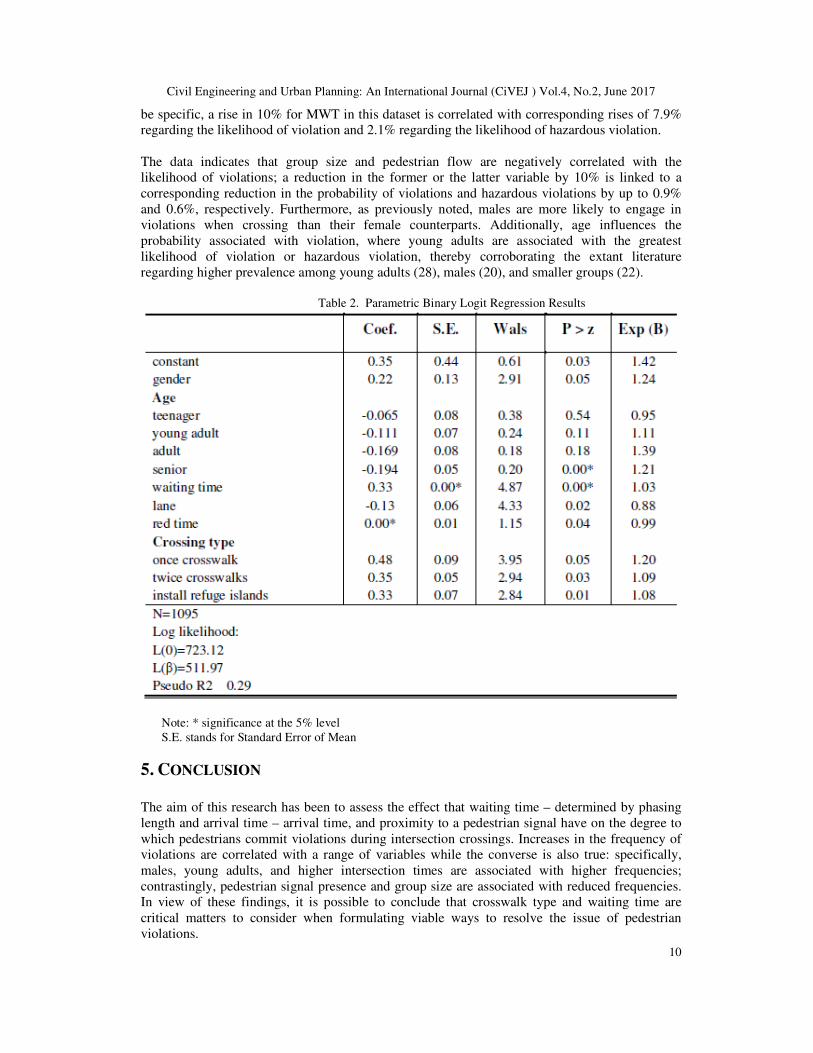
4.3. Model Development In terms of the factors linked to traffic control, it is possible to discern a clear correlation between
every form of pedestrian signal and the considerable reduction of the likelihood of a hazardous
crossing and violation. This finding is also reported in (23). The present study’s findings further
replicate the findings reported in (26), according to which the presence of a countdown signal is
correlated with the likelihood of violation in a negative way. The likelihood of violation or
hazardous crossing at intersections with a countdown signal is approximately 15% less than those
lacking a signal of this kind. Furthermore, the data suggests that MWT influences violations; to
Page 10
Civil Engineering and Urban Planning: An International Journal (CiVEJ ) Vol.4, No.2, June 2017
10
be specific, a rise in 10% for MWT in this dataset is correlated with corresponding rises of 7.9%
regarding the likelihood of violation and 2.1% regarding the likelihood of hazardous violation.
The data indicates that group size and pedestrian flow are negatively correlated with the
likelihood of violations; a reduction in the former or the latter variable by 10% is linked to a
corresponding reduction in the probability of violations and hazardous violations by up to 0.9%
and 0.6%, respectively. Furthermore, as previously noted, males are more likely to engage in
violations when crossing than their female counterparts. Additionally, age influences the
probability associated with violation, where young adults are associated with the greatest
likelihood of violation or hazardous violation, thereby corroborating the extant literature
regarding higher prevalence among young adults (28), males (20), and smaller groups (22).
Table 2. Parametric Binary Logit Regression Results
Note: * significance at the 5% level
S.E. stands for Standard Error of Mean
5. CONCLUSION
The aim of this research has been to assess the effect that waiting time – determined by phasing
length and arrival time – arrival time, and proximity to a pedestrian signal have on the degree to
which pedestrians commit violations during intersection crossings. Increases in the frequency of
violations are correlated with a range of variables while the converse is also true: specifically,
males, young adults, and higher intersection times are associated with higher frequencies;
contrastingly, pedestrian signal presence and group size are associated with reduced frequencies.
In view of these findings, it is possible to conclude that crosswalk type and waiting time are
critical matters to consider when formulating viable ways to resolve the issue of pedestrian
violations.
Page 11
Civil Engineering and Urban Planning: An International Journal (CiVEJ ) Vol.4, No.2, June 2017
11
Consequently, when programming cycle length and viable green/red periods for the respective
phases, a close focus should be directed towards pedestrian waiting times. Certain variables have
been shown to influence the category of violation committed, thereby meaning that violations and
hazardous violations can be mitigated against by aligning the waiting time to the average time
taken to complete a crossing.
Further studies could attempt to replicate the results reported by these authors by conducting
larger-scale examinations (for example, in terms of intersection number) in a range of cities in
China. The limitations associated with the manual mode of data collection – linked to
transcription errors, the inability to accurately log every pedestrian, and misevaluating pedestrian
age – could also be improved. Furthermore, the generalisability of the study is impaired by the
exclusive focus on intersections in the city centre of Suzhou, China. An expanded scope
constitutes a promising area of future investigation.
ACKNOWLEDGEMENTS
This study is supported by the National Natural Science Foundation of China (No.61374195).
REFERENCES [1] Ajzen, I. The theory of planned behavior. Organizational Behavior and Human Decision Processes,
(1991).50, 179–211.
[2] Elvik, R. The non-linearity of risk and the promotion of environmentally sustainable transport.
Accident Analysis and Prevention, (2009).41(4), 849–855.
[3] Harwood, D., Bauer, K., Richard, K., Gilmore, D., Graham, J., & Potts, I. Pedestrian Safety
Prediction Methodology. NCHRP Project 17-26. (2008).
[4] Miranda-Moreno, L. F., Morency, P.,& El-Geneidy,A.M.The link between built environment,
pedestrian activity and pedestrian-vehicle collision occurrence at signalized intersections. Accident
Analysis and Prevention, 43(5), 1624–1634.(2011).
[5] Guo, H., Gao, Z., Yang, X., & Jiang, X. Modeling pedestrian violation behavior at signalized
crosswalks in China: A hazards-based duration approach.Traffic Injury Prevention (2011)., 96-103.
[6] Li, Y., & Fernie, G. Pedestrian behavior and safety on a two-stage crossing with a center refuge island
and the effect of winter weather on pedestrian compliance rate. Elsevier Accident Analysis and
Prevention, 1156–1163.(2010).
[7] Ren, G., Zhou, Z., Wang, W., Zhang, Y., & Wang, W. Crossing behaviors of pedestrians at signalized
intersections. Transportation Research Record: Journal of the Transportation Research Board, 2264,
65-73. (2011).
[8] Rosenbloom, T. Crossing at a red light: Behaviour of individuals and groups. Elsevier Transportation
Research Part F, 389–394. (2009).
[9] Van Houten, R., Ellis, R. & Kim, J. L. The effects of varying minimum green on the percentage of
pedestrians waiting to cross with the WALK signal at mid-block crosswalks. Transportation Research
Record, No. 2002-10, 78-83). (2007).
[10] Bierlaire, M. BIOGEME: A free package for the estimation of discrete choice models. In Proceedings
of the 3rd Swiss Transportation Research Conference, Ascona, Switzerland. (2003).
[11] Bierlaire, M. An introduction to BIOGEME version 1.6. biogeme.epfl.ch.(2008).
Page 12
Civil Engineering and Urban Planning: An International Journal (CiVEJ ) Vol.4, No.2, June 2017
12
[12] Cambon de Lavalette, B., Tijus, C., Poitrenaud, S., Leproux, C., Bergeron, J., & Thouez, J.-P,
(2009)Pedestrian crossing decision-making: A situational and behavioral approach. Elsevier Safety
Science. 1248–1253.
[13] Cinnamon, J., Schuurman, N., & Hameed, S. M. (2011). Pedestrian injury and human behaviour:
Observing road-rule violations at high-incident intersections.
[14] Elvik, R. (2009)The non-linearity of risk and the promotion of environmentally sustainable transport.
Accident Analysis and Prevention.41(4), 849–855.
[15] Evans, D., & Norman, P. (1998). Understanding pedestrians’ road crossing decisions: An application
of the theory of planned behavior. Health Education Research,vol. 13. Oxford University Press (pp.
481–489). Oxford University Press.
[16] Government of Quebec Highway safety code. Consultéle (2011). on Publications du Québec.
[17] Guo, H., Gao, Z., Yang, X., & Jiang, X. (2011). Modeling pedestrian violation behavior at signalized
crosswalks in China: A hazards-based duration approach.Traffic Injury Prevention, 96-103.
[18] Harwood, D., Bauer, K., Richard, K., Gilmore, D., Graham, J., & Potts, I. (2008). Pedestrian Safety
Prediction Methodology. NCHRP Project 17-26.
[19] Ismail, K., Sayed, T., & Saunier, N. (2010). Automated analysis of pedestrian–vehicle conflicts:
Context for before-and-after studies. Transportation Research Record: Journal of the Transportation
Research Board, 2198, 52–64.
[20] Jackson, S., Miranda-Moreno, L., St-Aubin, P. & Saunier, N. (2013). A flexible, mobile video
camera system and open source video analysis software for road safety and behavioural analysis.
Transportation Research Board Annual Meeting Compendium of Papers.
[21] Li, Y., & Fernie, G. (2010). Pedestrian behavior and safety on a two-stage crossing with a center
refuge island and the effect of winter weather on pedestrian compliance rate. Elsevier Accident
Analysis and Prevention, 1156–1163.
[22] Markowitz, F., Sciortino, S., Fleck, J. L., & Yee, B. (2006). Pedestrian countdown signals:
Experience with an extensive pilot installation. ITE Journal, 43-48.
[23] Miranda-Moreno, L. F., Morency, P.,& El-Geneidy,A.M. (2011).The link between built environment,
pedestrian activity and pedestrian-vehicle collision occurrence at signalized intersections. Accident
Analysis and Prevention, 43(5), 1624–1634.
[24] Moyano Diaz, E. (2002).Theory of planned behavior and pedestrians’ intentions to violate traffic
regulations.Transportation Research Part F:Traffic Psychology and Behaviour, 5, 169-175.
[25] Ren, G., Zhou, Z., Wang, W., Zhang, Y., & Wang, W. (2011). Crossing behaviors of pedestrians at
signalized intersections. Transportation Research Record: Journal of the Transportation Research
Board, 2264, 65-73.
[26] Rosenbloom, T. (2009).Crossing at a red light: Behaviour of individuals and groups. Elsevier
Transportation Research Part F, 389–394.
[27] Saunier, N., & Sayed, T. (2006). A feature-based tracking algorithm for vehicles in intersections.
IEEE.
[28] Tiwari, G., Bangdiwala, S., Saraswat, A., & Gauray, S. (2007). Survival analysis: Pedestrian risk
exposure at signalized intersections. Elsevier TransportationResearch Part F, 77-89.
Page 13
Civil Engineering and Urban Planning: An International Journal (CiVEJ ) Vol.4, No.2, June 2017
13
[29] Van Houten, R., Ellis, R. & Kim, J. L. (2007). The effects of varying minimum green on the
percentage of pedestrians waiting to cross with the WALK signal at mid-block crosswalks.
Transportation Research Record, No. 2002-10, 78-83).
[30] Wang, W., Guo, H., Gao, Z., & Bubb, H. (2011). Individual differences of pedestrian behaviour in
midblock crosswalk and intersection. International Journal of Crashworthiness, 1-9.
[31] Wanty, D., & Wilkie, S. M. (2010) Trialling pedestrian countdown timers at traffic signals.
Wellington: NZ Transport Agency Research Report 428.
[32] Zhuang, X., & Wu, C. Pedestrians’ crossing behaviors and safety at unmarked roadway in China.
Elsevier Accident Analysis and Prevention, 1927-1936 (2011).
[33] Brilon, W., Koenig, R., & Troutbeck, R. J. (1999). Useful estimation procedures for critical gaps.
Transportation Research Part A: Policy and Practice, 33(3), 161–186.
[34] Ben-Akiva, M. E., & Lerman, S. R. (1985). Discrete choice analysis: Theory and application to travel
demand. MIT Press, 9.
AUTHORS
Jiping Xing is currentlypursuingaPh.D.in Transportation Engineering in SouthEast
University,China. He received M.E. degree in Suzhou University of Science and
Technology In 2015.His current research interests include pedestrian safety.