The impacts of Australia’s departure tax: Tourism versus the economy? Peter Forsyth a , Larry Dwyer b, * , Ray Spurr b , Tien Pham c a Department of Economics, Monash University, Clayton, Victoria 3800, Australia b School of Marketing, Australian School of Business University of New South Wales, NSW 2052, Australia c School of Tourism, University of Queensland, St. Lucia, Queensland 4072, Australia highlights We estimate the tourism flow and expenditure effects of the recent increase in Australia’s Passenger Movement Charge (PMC). We develop a framework to distinguish the effects of the increased PMC on the wider economy and on different tourism markets. Implications of the modelling results for the validity of industry criticisms of the PMC are discussed. Informs stakeholders of gainers and losers from departure tax increases in tourism destinations generally. article info Article history: Received 7 February 2013 Accepted 21 May 2013 Keywords: Aviation tax Australia Economic impacts Inbound Outbound Domestic tourism abstract This study estimates the flow and expenditure effects of the recent increase in Australia’s Passenger Movement Charge (PMC), as well as the economic impacts on the Australian economy and the tourism industry. After discussing the nature of the PMC, it outlines the types of industry stakeholder concerns as to its effects on tourism both before and after the recent increase. It then presents a framework devel- oped by the authors that can be used to distinguish the effects of the increased PMC on the wider economy and on different tourism markets. A computable general equilibrium model is then used to estimate the economic impacts of the increased charge on different Australian tourism markets e in- bound, outbound and domestic. The implications of the modelling results for the validity of the industry criticisms of the PMC are discussed. The results confirm that the tourism industry will suffer, though it also indicates that the Australian economy will gain e thus there is a clash between the industry and wider economic interests. The types of issues addressed in this paper can inform policy making regarding the gainers and losers from departure tax increases in tourism destinations generally. Ó 2013 Elsevier Ltd. All rights reserved. 1. Introduction Australia recently, and controversially, has increased the amount of the Departure Tax (the Passenger Movement Charge or PMC) levied on all travellers leaving Australia. Despite the ongoing concerns of tourism and transport stakeholders that the PMC is effectively an export tax that makes Australia a less competitive tourism destination, the government recently announced a 17 per cent increase in this tax from Aus$47 to Aus$55 per passenger, 1 to take effect from July 1, 2012. The PMC is of particular ongoing concern to the tourism sector. Australia is regarded already as a high priced destination. With a high value of the Australian dollar supported by a prolonged boom in mining exports, and a carbon tax/emissions trading scheme which began on July 1 2012, tourism stakeholders have argued that the additional charge will further impact adversely on inbound tourism, and further reduce the economic significance and employment potential of the nation’s tourism industry. The tourism industry’s concerns need also to be seen in the light of the fact that the PMC is also a tax on outbound tourism e indeed for Australia, outbound tourism is larger, in visitor terms, than in- bound tourism. Acting as a deterrent to outbound tourism, the PMC to an extent will encourage domestic tourism as a substitute. The tourism industry has not taken much notice of this effect. This debate is occurring in the context of an ongoing weak- ening in the tourism share of the Australian economy. Tourism * Corresponding author. Tel.: þ61 2 9385 2636; fax: þ61 2 96631985. E-mail address: [email protected](L. Dwyer). 1 In December 2012 Aus$1.00 was approximately equal to US$1.04. Contents lists available at SciVerse ScienceDirect Tourism Management journal homepage: www.elsevier.com/locate/tourman 0261-5177/$ e see front matter Ó 2013 Elsevier Ltd. All rights reserved. http://dx.doi.org/10.1016/j.tourman.2013.05.011 Tourism Management 40 (2014) 126e136
The impacts of Australia’s departure tax: Tourism versus theeconomy?
Peter Forsyth a, Larry Dwyer b,*, Ray Spurr b, Tien Pham c
aDepartment of Economics, Monash University, Clayton, Victoria 3800, Australiab School of Marketing, Australian School of Business University of New South Wales, NSW 2052, Australiac School of Tourism, University of Queensland, St. Lucia, Queensland 4072, Australia
h i g h l i g h t s
� We estimate the tourism flow and expenditure effects of the recent increase in Australia’s Passenger Movement Charge (PMC).� We develop a framework to distinguish the effects of the increased PMC on the wider economy and on different tourism markets.� Implications of the modelling results for the validity of industry criticisms of the PMC are discussed.� Informs stakeholders of gainers and losers from departure tax increases in tourism destinations generally.
a r t i c l e i n f o
Article history:Received 7 February 2013Accepted 21 May 2013
0261-5177/$ e see front matter � 2013 Elsevier Ltd.http://dx.doi.org/10.1016/j.tourman.2013.05.011
a b s t r a c t
This study estimates the flow and expenditure effects of the recent increase in Australia’s PassengerMovement Charge (PMC), as well as the economic impacts on the Australian economy and the tourismindustry. After discussing the nature of the PMC, it outlines the types of industry stakeholder concerns asto its effects on tourism both before and after the recent increase. It then presents a framework devel-oped by the authors that can be used to distinguish the effects of the increased PMC on the widereconomy and on different tourism markets. A computable general equilibrium model is then used toestimate the economic impacts of the increased charge on different Australian tourism markets e in-bound, outbound and domestic. The implications of the modelling results for the validity of the industrycriticisms of the PMC are discussed. The results confirm that the tourism industry will suffer, though italso indicates that the Australian economy will gain e thus there is a clash between the industry andwider economic interests. The types of issues addressed in this paper can inform policy making regardingthe gainers and losers from departure tax increases in tourism destinations generally.
� 2013 Elsevier Ltd. All rights reserved.
1. Introduction
Australia recently, and controversially, has increased theamount of the Departure Tax (the Passenger Movement Charge orPMC) levied on all travellers leaving Australia. Despite the ongoingconcerns of tourism and transport stakeholders that the PMC iseffectively an export tax that makes Australia a less competitivetourism destination, the government recently announced a 17 percent increase in this tax from Aus$47 to Aus$55 per passenger,1 totake effect from July 1, 2012. The PMC is of particular ongoingconcern to the tourism sector. Australia is regarded already as a
: þ61 2 96631985.
qual to US$1.04.
All rights reserved.
high priced destination. With a high value of the Australian dollarsupported by a prolonged boom in mining exports, and a carbontax/emissions trading scheme which began on July 1 2012, tourismstakeholders have argued that the additional charge will furtherimpact adversely on inbound tourism, and further reduce theeconomic significance and employment potential of the nation’stourism industry.
The tourism industry’s concerns need also to be seen in the lightof the fact that the PMC is also a tax on outbound tourism e indeedfor Australia, outbound tourism is larger, in visitor terms, than in-bound tourism. Acting as a deterrent to outbound tourism, the PMCto an extent will encourage domestic tourism as a substitute. Thetourism industry has not taken much notice of this effect.
This debate is occurring in the context of an ongoing weak-ening in the tourism share of the Australian economy. Tourism
P. Forsyth et al. / Tourism Management 40 (2014) 126e136 127
remains Australia’s largest services export industry, generatingAus$23.7 billion in 2010e11 or 9.0 per cent of total services ex-ports (Australian Bureau of Statistics, 2011). While the industryremains a significant one to Australia, there are concerns that itsshare of global international travel is in decline. Overall, interna-tional arrivals to Australia grew by 0.7 per cent a year over theperiod 2000e2009. This is significantly slower than the previousaverage annual growth rates, 9.4 per cent (1980s) and 9.1 per cent(1990s). Over the past decade, the industry has underperformedagainst the broader Australian economy, with tourism’s share ofGDP decreasing from 3.4 per cent in 2000e01 to 2.4 per cent in2010e11. At the same time, tourism’s share of total Australianexports has fallen, from a peak of nearly 13 per cent in 2003e04 to8.3 per cent in 2008e09 (Tourism Research Australia, 2012).Overall, long-term real average annual growth for total tourismconsumption in Australia is forecast at 1.4 per cent in the period2009e2020, much lower than the thirty year average of 3.2 percent a year, indicating a declining path of tourism share towards2020 (Tourism Research Australia, 2012).
Looked at globally, departure, and more specifically, aviationtaxes have become increasingly widespread in recent years. Euro-pean countries that have imposed aviation taxes include Denmark,Germany, Austria, France, Malta, UK and the Netherlands. SomeAsian countries, e.g. India, have also imposed such taxes, orincreased existing ones (van Egmond & de Jong, 2010). Whatevertheir form, aviation taxes have proved to be controversial. Amidstgreat publicity, the Dutch aviation tax was abandoned in its firstyear of operation (Veldhuis, 2010). A study of the effects of theGerman aviation tax by the German Aerospace Center (DLR)claimed that it reduced Gross Value Added and employment as wellas tax revenues at all levels, from federal, to state and municipality(Berster et al., 2010). Meanwhile, there has been much criticism by,for example by the World Travel and Tourism Council, of the de-cision of the UK government to increase the Air Passenger Duty(APD) again in 2012, with claims of resulting huge losses to tourismand the UK economy (WTTC, 2012a, 2012b).
Although these studies have reinforced criticism of aviationtaxes by tourism stakeholders, the assessment techniques andfindings of these studies can be questionable. While they highlightthe negative effects of aviation taxes on tourism output (and othereconomic variables), they take tourism revenues as a benefit, givingno weight to the costs of providing tourism output. Thus, theyprovide no estimate of the net gains or losses to the economy fromtheir imposition. Each of these studies also employs input-outputanalysis, an approach guaranteed to produce negative results forany tax imposed on the tourism industry (Dwyer, Forsyth, & Spurr,2004; Forsyth, Niemeier, & Dwyer, 2012). These studies do not takeinto account the substitution effect of domestic tourism foroutbound tourism. Moreover, since the different gainers and losersfrom aviation taxes are not sufficiently distinguished in the aboveanalyses, they are of limited value in helping us understand theissues involved in assessing the effects of the increased charge inAustralia as this depends importantly on the balance of the gainsand losses accruing to stakeholders.
The study presented in this paper provides an assessment of theincrease in Australia’s PMC on the Australian economy and on thetourism industry. It has five aims:
� First, to discuss the nature of Australia’s PMC;� Second, to outline the types of industry stakeholder concernsas to the effects of the PMC on tourism, both before and afterthe recent increase;
� Third, to present a framework developed by the authors thatcan be used to distinguish the effects of the increased PMC onthe wider economy and on different tourism markets. This
framework highlights the conflicting interests of the tourismindustry and the broader Australian economy;
� Fourth, using a computable general equilibrium (CGE) model,to estimate the economic impacts, on both the tourism in-dustry and the wider economy, of the increased charge ondifferent tourismmarketse the inboundmarket, the outboundmarket, which has had much less attention from stakeholdersand other researchers; and,
� Fifth, to discuss the implications of the modelling results forthe validity of industry criticisms of the PMC.
This discussion is directly relevant to assessing the effects on thetourism industry and the wider economy of departure taxes thatexist or are being introduced in other countries. It is argued that thetypes of issues addressed in this paper can inform policy makingregarding the gainers and losers from increases in departure oraviation taxes in tourism destinations generally.
2. The Passenger Movement Charge
The PMC is a government charge on passengers departingAustralia, including departing international visitors and Australianresidents, irrespective of whether they intend to return to Australiaor not. It is administered by theAustralianCustoms Service (ACS) andis collected by airlines and shipping companies as part of their tick-eting arrangements on behalf of ACS (Australian Government, 2008).The collected revenue is then remitted to the Australian government.The PMC was set at $47 per passenger since 1 July 2008, but wasincreased to $55 on July 1, 2012.
The PMC was projected to yield $615.47 million in 2010e11(Australian Customs and Border Protection Services, 2011) and isprojected to generate between $800 million and $900 million ingovernment revenues in 2011/12. The increase will take the annualrevenues from the departure tax to over $1billion by 2015/16.
There can be several motivations for a government to impose atax on air passengers. These include: as an environmental charge;to provide funds for specific passenger related services; to raisegeneral government revenues; and to fund specific non-transportinitiatives (Keen & Strand, 2007). The PMC charge contains ele-ments of each of the latter three objectives. Unlike in other coun-tries, such as the UK, the tax has not been regarded as anenvironmental charge. The charge has been mainly justified, in thepast, as a means to recover the costs of border control functionssuch as customs, immigration and quarantine, but recently it hasbecome more of a revenue raising measure. In 2005 the Produc-tivity Commission, a government advisory body, estimated that at arate of $38 in 2002e03 it just covered costs (ProductivityCommission, 2005). Recently, a proportion (10 per cent) of therevenues raised by the increase in PMC has been earmarked forassistance to the tourism industry in the form of additional fundingto Australia’s national tourism organisation, Tourism Australia ($61million over 4 years) to assist with their push into Asia through anAsian Marketing Fund Tourism Australia (2012).
2.1. Industry concerns
Fivemain typesof criticismsof thechargehavebeenvoicedby thetravelling public and the tourism industry in particular. These are:
1. The Australian tourism industry is already heavily taxed. Thekey taxes affecting tourism price competitiveness are the Pas-senger Movement Charge (PMC), visa fees and the Goods andServices Tax (GST). There has been an increasing trend inAustralia to levy increased taxes and charges on internationalvisitors for revenue raising purposes. Tourism generated
P. Forsyth et al. / Tourism Management 40 (2014) 126e136128
approximately $6.9 billion in net federal and state revenue in2009e10, including the GST and other taxes on production, butexcluding the PMC (Australian Bureau of Statistics, 2011). Themost significant increase in taxes on tourism came whenAustralia moved to a Goods and Services (VAT) Tax in 2000.Increases in the PMC and visa fees in the 2008e9 and 2009e10Commonwealth Budgets have resulted in an additional $240.5million tax burden in 2009e10 alone. Tourism is the only sector,other than education, which is subject to GST on its exports.
The results of a recent survey conducted among senior execu-tives of Australian tourism operators reveals significant concernabout the impact of taxes on international travellers, state-basedtaxes and other taxation measures (Tourism and TransportForum, 2011). It is claimed that these undermine investor confi-dence which is essential to achieving sustainable tourism devel-opment (Tourism Research Australia, 2012). Industry stakeholdersbelieve that reform of Australia’s tax system could make tourismmore competitive and create incentives for investment in newtourism product and the refurbishment of existing product.
2. The PMC generates substantial funds for the Government,collecting more than the costs of the border security functions(TTF, 2012a, 2012b e but see Productivity Commission, 2005).The Board of Airline Representatives of Australia (BARA) arguesthat the PMC has become a general revenuemeasure, no longerhypothecated against its original stated purpose of funding theborder agencies at the primary line, including customs andborder protection, quarantine and immigration (Nancarrow,2011). The tourism industry has argued that these activitieshave a public good aspect and should not be subject to userpays (TTF, 2011). The industry position also is that since itgenerates the money, it should reap a significant portion of therewards (BARA, 2012). Only ten per cent of the increase ($61million over four years) will go to the tourism industry, by wayof the new “Asia Tourism Marketing Fund”).
Unfortunately, the issues relating to the surplus generated by thePMC and potential further hypothecation have not been examinedin any detail since the Productivity Commission Report in 2005. TheHenry Report into Australia’s tax system (Commonwealth ofAustralia, 2010) flagged the PMC as a tax ‘to monitor in thefuture’, but to date industry concerns have not been addressed toassess their validity.
3. The PMC is, in effect, an export tax on international visitors, andan import tax imposed on Australian residents. The increase isregarded as particularly discriminatory in respect of short haulorigin markets such as New Zealand, a major source market forAustralia, since the tax comprises a larger share of the total tripexpenditure (TTF, 2012a).
4. The timing of the increase has been questioned. Tourism stake-holders argue that Australia is already a high priced tourismdestination,made evenmore so by a highly valued dollar fuelledbyaminerals export boom.Acarbon taxalsooperates from July 12012, which is projected to further reduce destination pricecompetitiveness (Dwyer, Forsyth, Spurr, & Hoque, 2012; WTTC,2011). According to a peak industry body, tourism exports areparticularly impacted by narrow-based taxes on key tourismservices, such as the PMC, which is expected to have a ‘signifi-cant’ impact on Australia’s international competitiveness (AFTA,2012;ATEC, 2012). Indeed, theTravel&TourismCompetitivenessReport recently ranked Australia 130 out of 140 nations for its airticket taxes (WEF, 2013). The timingof the additional PMC is alsoheld to be detrimental to consolidating tourism from the
emerging markets that are expected to provide Australia’stourists into the future (TTF, 2012b).
5. Several critics of Australia’s PMC have claimed that the failuresof aviation taxes overseas have been ignored (TTF, 2011). Therelevance for Australia of these so called policy failures is,however, not clear. The failed Dutch aviation tax has beenhighlighted as a lesson for Australia. It needs to be recognised,however, that the diversity of transportation options in Europemeans travellers can and do seek out alternatives wheneverone country unilaterally imposes an air passenger tax, a situ-ation very different from Australia which is a remote islandcontinent. Following the introduction of the flight tax in theNetherlands, around 30 per cent of Dutch travellers decided tofly from airports outside the Netherlands to avoid the ticket tax(Gordijn, 2010). Continental European countries that haveinitiated aviation taxes would likely have had more success ifthey had imposed such taxes together. In contrast to the Eu-ropean context, it is easier for larger, more remote countriessuch as Australia to implement an aviation tax that may pro-vide greater benefits to the economy, given that the amount ofcompetition from foreign airports is quite limited.
Two general observations may be made regarding industryconcerns as to the effects of the increased PMC on Australia’stourism industry. One is that a major focus of industry commentaryhas been on the potential adverse effects of the PMC on inboundtourism. However, since the PMC applies to all travel from Australiait will also have consequences for outbound and domestic travel.Given some degree of substitutability between outbound and do-mestic tourism, the increased PMC may be expected to providebenefits for Australia’s domestic tourism. However, there seems tohave been little acknowledgement of the opportunities that theincreased PMC presents for the domestic market.
A second observation regarding the industry focus on the dele-terious effects of the tax increase on inbound tourism is that thereappears to be an implicit assumption that inbound tourismflows areprice elastic. Several commentators refer to the ‘high sensitivity’ ofinternational tourists to increased prices (ATEC, 2012). The greatertheprice elasticity of demand forAustralian tourism, the greaterwillbe the disincentive to visit Australia and the greater the negativeimpacts of the increased PMC on the tourism industry. However, asthe discussion below highlights, contrary to industry stakeholderassumptions, the evidence is that inbound tourism demand fortravel to Australia is relatively price inelastic.
In order to assess the effects of the increased PMC on thetourism industry and the wider economy, we need to consider thechannels through which the increased PMCwill affect each of theserespectively. There are two main channels of influence. One is theadditional tax revenue accruing to Australia associated with thepayment of the PMC by ‘foreigners’. The other relates to the effectsof the increased charge on tourism flows and tourism expenditure.The effects of the increase in the PMC on tourist numbers dependon assumptions about the price elasticity of demand of thosetourism markets affected by the additional tax. The increased PMCmay be expected to affect tourism flows, both inbound andoutbound. In addition, given that domestic tourism is at least apartial substitute for outbound tourism, we can expect tourismflows to also be affected in this market segment.
3. A framework for analysis
There are two main channels through which an increase in thePMC affects tourism and the wider economy.
The tax revenue effect. Two main groups of persons are subject tothe PMC e foreign residents who come to Australia as tourists and
P. Forsyth et al. / Tourism Management 40 (2014) 126e136 129
Australian residents who travel overseas. Under the assumption of agovernment balanced budget, which is currently the policy of bothmajor political parties in Australia over the economic cycle, theadditional tax revenues earned will be spent on publically providedgoods and services. Those tax revenues received from foreign resi-dents will lead to increases in Gross Domestic Product (GDP), GrossNational Income (GNI), employment and economic welfare.
The tourism expenditure effect. Each of three tourismmarkets willexperience a change in numbers and expenditure as a result of theincreased PMC, with consequent impacts on GDP, GNI and employ-ment in both the tourism industry and the wider economy. Thesemarkets are inbound tourism (a likely reduction in numbers andexpenditure), outbound tourism (a likely reduction in outboundnumbers leading to an increase in domestic expenditure) and do-mestic tourism (some increase in numbers and expendituredepending on its substitutability for reduced outbound tourism).
To better understand these types of effects we consider howthey operate within each of three different tourism markets.
3.1. Inbound tourism
Both the tax revenue effect and the tourism expenditure effectare relevant here. Australia gains additional tax revenues from thePMC, but since this pushes up the price of tourism in Australia,there will be a reduction in inbound tourism demand and thuspotentially limit the benefits to the nation from inbound tourism.
With a balanced budget fiscal policy the additional PMC willresult in increased government expenditure with positive eco-nomic impacts on GDP, GNI, employment and economic welfare.Any nation gains from getting residents of other countries to pay itstaxes. As Tisdell (1983) has earlier demonstrated, unlike the tradi-tional outcome of a deadweight loss associated with higher taxes,increasing taxes on international tourism can improve welfare forresidents of a destination e this is a case of “tax exporting”.
On the other hand, the increase in the PMC results in a reductionof inbound tourism reducing the benefits toAustralia fromspendingby this market segment. Associated with the reduced visitation, thetourism industry will lose output, employment and profits as aresult of the additional charge. This will also reduce the revenue tothe government from other taxes levied on tourism (e.g. the Goodsand Services Tax). The impact of inbound tourism has been givenconsiderable attention in CGE studies. In a fully employed economy,an additional $1 of tourism spending will add from $0.05 to $0.15 inGDP, depending on the particular economy (Forsyth, 2006).
If the demand for inbound tourism is price inelastic, with only asmall change in demand in response to the additional PMC, thereduction in visitationwill be relatively small. The greater the priceelasticity of demand, the negative effect on tourism expenditurewill be larger and the less positive will be the effect on tax revenue.
3.2. Outbound tourism and domestic tourism
Australian residents who travel overseas will pay the tax, whichcan be used to lower other taxes or increase public spending in abudget neutrality scenario. Unlike the case for inbound tourism, thetax revenue effect for outbound tourism is not expected to be largefor the Australian economy. On balance, there is no net tax changefrom the perspective of residents providing the government seeksto balance its budget.
The increased PMCwill also deter someAustralian residents fromtravelling overseas. We herein examine the impact of the increasedPMC in two stages: First, the switch from reduced outbound tourismto domestic consumption of goods and services in general is esti-mated. Australian residents will spend less on foreign tourism butthere will be an increase in spending on home goods and services.
This canhave a positive effect onGDP, GNI, andemployment. Second,Australian residents who forego outbound travel because of thehigher PMC, may substitute domestic tourism for other goods andservices.We refer to this as the domestic tourism substitution effect.
The different effects identified above can be summarised asfollows:
Overall effect of changes in the PMC¼ Inbound effectsþOut-bound effectsTotal Inbound Effects¼ Effect on expenditureþ Tax revenueeffectTotal Outbound Effects¼ Effect on expenditureþ Tax revenueeffectsþDomestic Tourism substitution effect (if present)
A priori, it is not clear what the balance of these effects will befor any destination that imposes or increases an aviation tax. Thenet effects will depend on the relative sizes of a country’s inbound,outbound, and domestic tourism industries, existing tax structures,the extent of substitutability between outbound and domestictourism, and the price elasticities of demand of different tourismmarkets. To determine the net effects, economic modelling isrequired.
3.3. The relevance of price elasticity of demand
Underpinning the extent of expenditure effects is the extent towhich tourist numbers from any market segment decrease inresponse to a given change in the PMC. Thiswill depend on the priceelasticity of demand for inbound and outbound tourism. The higherthe price elasticity value, the more responsive are tourism numbersand associated tourism expenditure to a given change in the PMC.
Tourism demand elasticity estimates differ widely in the litera-ture, and there is no accepted value available for thismeasure acrossdifferent visitor markets. Estimates of price elasticities of demandvary depending according to variables such as: the definition ofprice; the form of the model used; the number of explanatory var-iables in the demandmodel; whether prices have been adjusted forexchange rate changes; whether the cost of transportation isincluded in the definition of price; and several other factors (Dwyer,Forsyth, & Dwyer, 2010: pp. 43e44). An early meta-analysis un-dertaken by Crouch (1995) of the results of 80 studies internation-ally found that demand was only somewhat sensitive to price withthe means of own price elasticities ranging between �0.37 and�0.84. The overall mean was �0.63; that is, a 10 per cent change inthe cost of the ground content of a trip to an international destina-tion, results in a 6.3 per cent change in visitation.
Several estimates of the price elasticity of the demand forAustralian tourism have been undertaken over the years (Morley,1998; Seetaram, 2012). However, the most recent estimates of theprice elasticity of demand for Australia consistently indicate thatinbound travel demand is price inelastic in the short run. Carmody(2002) estimated that the overall demand for inbound tourismwas �0.83, or slightly inelastic. Kulendran and Divisekera (2007)using a dynamic error correction model found that the demandfor travel to Australia from the key markets of New Zealand, Japan,UK and USA ranged between�0.15 and�0.96, while Kulendran andDwyer (2009), using cointegration analysis, estimated a rangebetween �0.30 and �0.94 for the same four origin markets.Tourism Research Australia has estimated the price elasticity ofdemand for inbound tourism to be �0.8 (Tourism ResearchAustralia, 2011). Most recently, Seetaram (2012) using a sophisti-cated dynamic panel data cointegration technique and employingthe Kiviet estimation approach, has estimated the price elasticity ofinbound tourist arrivals to be �0.62 in the short run, while in thelong run it is more elastic (�1.90).
P. Forsyth et al. / Tourism Management 40 (2014) 126e136130
On the other hand, the estimation of elasticities associated withoutbound travel has been relatively neglected by researchers. At thepan-national level, estimates show that air travel demand isfairly insensitive to price, with the price elasticities rangingbetween �0.4 and �0.9 (Pearce, 2009, chap. 1.8). Dargay and Hanly(2001) in their study of UK outbound traffic estimated fares elas-ticity of about �0.6. A recent study by Seetaram (2012), using aconstructed destination price competitiveness index, has estimatedthe price elasticity of demand for outbound travel from Australia tobe �0.91 in the short run and �2.4 in the long run.
For present purposes we will assume that the price elasticity ofdemand for Australian tourism, ranges between �0.5 and �1.0, forboth inbound and outbound tourism. This assumption appears tobe broadly consistent with the empirical findings as detailed above.
3.4. Economic impacts of the increased PMC
In the simulationsundertaken for this study, it is assumed that thePMC is fully passed on to travellers (alternative rates of pass-throughcan bemodelled). The simulations suppose a 17% increase in the PMCfrom $47 to $55 per passenger. The simulations proceed by esti-mating how the PMC increasewill affect the cost of a trip to Australia(ground content plus air fare) or of an outbound trip in the case of anAustralian resident. An elasticitymeasure is then applied to estimatehow much tourism expenditure changes, both for outbound andinbound travel. The impacts on the tourism industry and the widereconomy resulting from the increased PMC are then simulated, andthe full changes are summed to determine the net effects.
This study uses a tourism focused CGE model which wasdeveloped under a research project funded by the SustainableTourism Cooperative Research Centre (STCRC) in Australia (Dwyer,Forsyth, Spurr, & Ho, 2003, 2006). The tourism CGE model wasdeveloped on the base of the MMRF model (Adams, 2008) with atourism module explicitly embedded in the core CGE model,particularly in conjunction with the household consumption fordomestic tourism expenditure and exports for inbound tourismexpenditure.
The conventional IO database of a CGE model does not presenttourism expenditure data explicitly, the domestic tourism
IndustryJ1 J2 J3 … Jn Dtour
Value Added P1: Compensation of employees (COE)P2: Gross operating surplus & mixed incomeP3: Net taxes on products P4: Net taxes on productionP6: Imports
T2: Australian Production
T1: Total Intermediate use
C1
C2
Cn
Dtour
ETour
C11
C21....
Cn1
TC1 .. TC3 .....................TCn Tot_Dtour
C22 ...............................C2n
Total
0 0
0
HH1T
HH2T....
HHnT
0
0
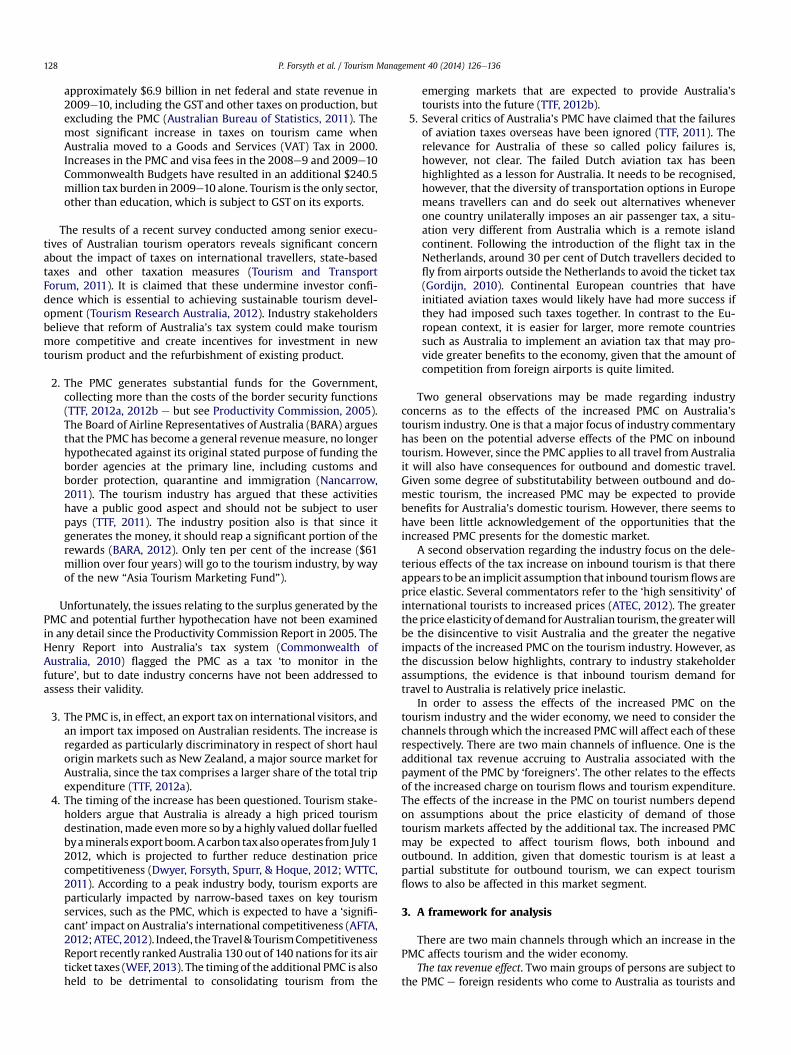
Fig. 1. Database structure of
expenditure is embedded in household final consumption and theoverseas tourism expenditure is included in the export vector. Inother words, final demand data in the CGE database include bothtourism and non-tourism data for the same final demand category.As a result, tourism impact analysis using the conventional CGEdatabase will not be able to capture the impact of tourism on non-tourism. Furthermore, it does not provide easy access to measuretourism impact for scenarios such as an increase in total domestictourism expenditure or decrease in total inbound tourism expen-diture easily.
Given the importance of tourism in an economy, the ability thata CGE model can offer for the impact analysis and the availability ofTSA data, the tourism sector is now explicitly included in thetourism CGE modal database as indicated in Fig. 1. In the TourismCGE database, two new industries Dtour and Etour have beencreated, for domestic tourism and overseas tourism respectively.The final household consumption is decomposed into tourism andnon-tourism parts for each commodity, and the tourism part ismoved to the intermediate quadrant to represent the domestictourism supplier. Similarly elements of Etour are extracted from theexport vector. The tourism sectors Dtour and Etour do not requireprimary inputs. They act as a middle man to select all goods andservices for tourism activity, and then sell all tourism services to thecorresponding tourists (Madden & Thapa, 2000). Dtour is not pur-chased by any users in the economy other than the householdsector, and similarly Etour by the export. These purchases oftourism services are defined as domestic and inbound tourists’consumption respectively. To some extent, the treatment here re-flects exactly how loosely defined the tourism sector is in relationto goods and services in reality.
Apart from the modification of the database, the theoreticalstructure of the CGE core remains unchanged. TheMMRFmodel is aCGE model of all of the Australian State and Territory economieswith supply and demand explicitly captured. Themodel descriptionis well documented in Adams (2008), the main features of theMMRF model include:
� Households maximising utility by choosing the cheapestsource for their purchases;
EtourFinal Demands
HH INV GOV EXPTotal
Supply
HH1NT
HH2NT....
HHnNT
Tot_Dtour
0
E1NT
E2NT....
EnNT
0
Tot_ETour
TS1
TS2....
TSn
Tot_Dtour
Tot_ETour
Tot_ETour C I G E
COEGOSPTAXCTAXM
0 0
0
(Not available)(Not available)
(Not available)
E1T
E2T....
EnT
0
0
the tourism CGE model.
Table
1Effectsof
increa
sedPM
Con
inbo
undan
dou
tbou
ndtourism
expen
diture.
Rev
enueco
llected
from
thePM
C,$
m,2
010e
11Additional
reve
nue
($m)raised
by17
%increa
sein
PMC
Shareof
overseas
arriva
ls,July
2009
eJune20
10
Shareof
overseas
dep
artures,
July
2009
e
June20
10
PMCreve
nuefrom
inbo
undpassenge
rs,
$m
PMCreve
nue
from
outbou
nd
passenge
rs,$
m
Red
uctionin
inbo
und
tourism
expen
diture
Red
uctionin
outbou
nd
tourism
expen
diture
($m)
Ed¼�0
.5Ed
¼�1
.0Ed
¼�0
.5Ed
¼�1
.0
615.47
104.63
0.47
0.53
49.18
55.45
24.59
49.18
27.73
55.46
Dom
esticex
pen
diture
100%
diversion
from
outbou
nd
27.73
55.46
Dom
esticex
pen
diture
50%
diversion
from
outbou
nd
13.87
27.73
Source:
authors’estimates,b
ased
onestimates
ofinbo
undan
dou
tbou
ndtourism
expen
diture,A
ustralia
nBureau
ofStatistics
(201
1)an
dassu
med
values
forprice
elasticity
ofdem
and.R
even
ueco
llected
from
PMCof
$615
.47
millionfrom
Australia
nCustom
san
dBorder
Protection
Services
(201
1,Ta
ble52
,p.2
02).
P. Forsyth et al. / Tourism Management 40 (2014) 126e136 131
� Firms maximising profits by sourcing intermediate inputsfrom the cheapest source;
� Firms also choosing the right mix of labour, capital and land toreduce the cost of primary inputs by a substitution amongthese primary inputs based on individual cost factors;
� Strong responses by firms to large changes in input prices byundertaking technological innovation;
� Domestic producers facing a downward sloping export de-mand curve to reflect an assumption of a small openeconomy;
� Investors being cautious in their investment decisions. Forevery subsequent increment in capital growth, investorsrequire a higher rate of return to supply the same amount ofadditional investment; and
� Investors also minimising their costs by choosing the cheap-est source as do producers, except that investment activitydoes not require primary inputs.
As seen in Fig. 1, the tourism module focuses on the demandside, which provides necessity to analyse impacts on, or changesto, demands for tourism such as this project. Tourism activity isrecognised by inter-state, intra-state, inbound and outboundtourism. While inter-state and intra-state tourism demands aredriven by relative prices and domestic income, inbound tourismdemand is modelled to have a downward sloping demand curveas all other exports.
The model is solved using the GEMPACK software, developedby the Centre of Policy Studies and the Impact Project, MonashUniversity (Harrison & Pearson, 1996).
All simulations assume:
� fixed national employment and flexible real wage� fixed real (international) trade balance and a flexible ex-change rate
� fixed capital stock with flexible rate of return� fixed total investment� government budget neutrality
The closure has a typical assumption of short run for capitalsuch that capital is fixed in a short run. However, the closureexplicitly assumes that the timeframe is not so short that realwage rate could actually adjust to clear the market so that fullemployment could be achieved. In a way, the closure represents amedium run rather than a standard short run or long run closure.
It is useful to distinguish the different economic impacts of thePMC increase which are associated with inbound, outbound anddomestic tourism.
4. Results
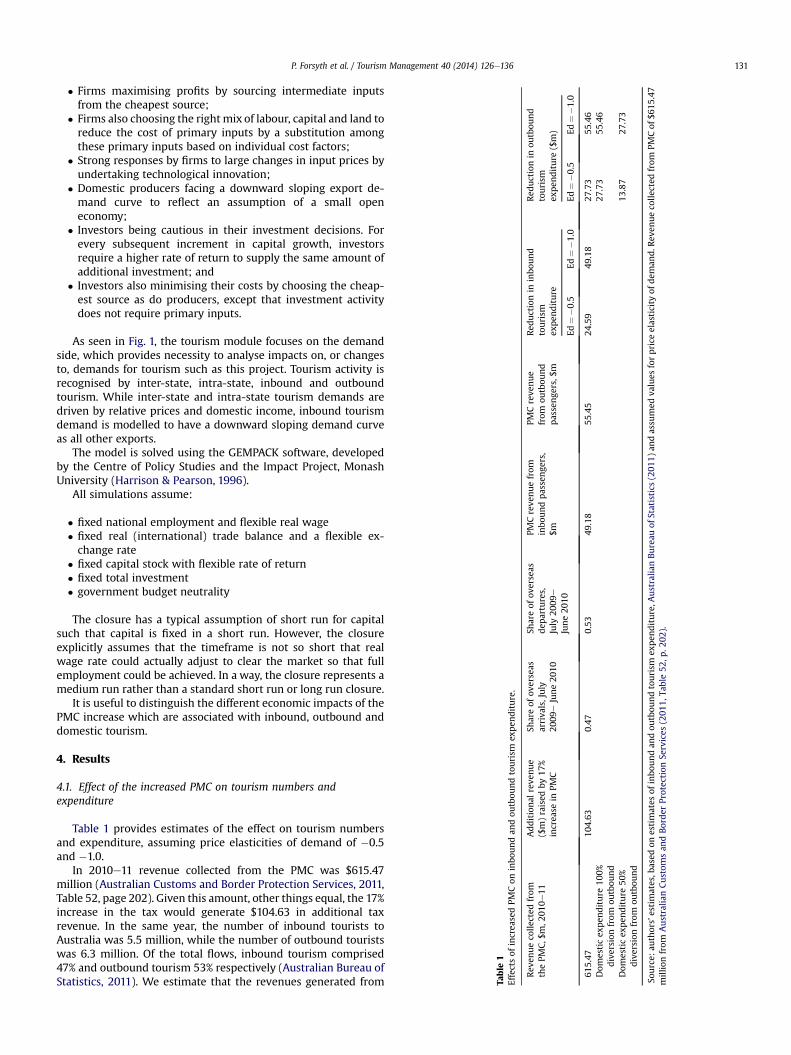
4.1. Effect of the increased PMC on tourism numbers andexpenditure
Table 1 provides estimates of the effect on tourism numbersand expenditure, assuming price elasticities of demand of �0.5and �1.0.
In 2010e11 revenue collected from the PMC was $615.47million (Australian Customs and Border Protection Services, 2011,Table 52, page 202). Given this amount, other things equal, the 17%increase in the tax would generate $104.63 in additional taxrevenue. In the same year, the number of inbound tourists toAustralia was 5.5 million, while the number of outbound touristswas 6.3 million. Of the total flows, inbound tourism comprised47% and outbound tourism 53% respectively (Australian Bureau ofStatistics, 2011). We estimate that the revenues generated from
P. Forsyth et al. / Tourism Management 40 (2014) 126e136132
the increased PMC (the tax revenue effect) are thus $49.18 millioncollected from inbound tourists departing Australia while $55.45million is generated from outbound travel by Australian residents.These are first round effects relate to the direct expenditure only.
The effects of the increased PMC on visitor numbers and theirexpenditure will depend on the price elasticities of demand for in-bound and outbound tourism. Assuming a price elasticity of demandof �0.5, the reduction in tourism expenditure is $24.59 million forinbound tourism(the inboundexpenditure effect) and$27.73millionfor outbound travel (the outbound expenditure effect). If all of thereduction in expenditure onoutbound tourismwere to bediverted tospending on domestic tourism, the domestic tourism expenditureeffect would be $27.73million. Alternatively, if it is assumed that theforegone outbound expenditure is evenly divided between domestictourism and purchases of (non-tourism) goods and services, thedomestic tourism expenditure effect would be $13.87 million.
Assuming a price elasticity of demand of �1.0, the reduction intourism expenditure is $49.18 million for inbound tourism (the in-bound expenditure effect) and $55.46 million for outbound travel(the outbound expenditure effect). If all of the reduction in outboundtourism is diverted to spending on domestic tourism, the domestictourism expenditure effect would be $55.46 million. If it is assumedthat the foregone outbound expenditure is evenly divided betweendomestic tourismandpurchasesof (non-tourism)goodsandservices,the domestic tourism expenditure effect would be $27.73 million.
4.2. Economic impacts of the increased PMC
4.2.1. Inbound tourism effectsTable 2 shows the results of the PMC increase associated with
inbound tourism. The effects are broken up into the impacts ofreduced tourism (expenditure effect inbound) and the impacts ofthe changes in tax revenues (tax revenue effect inbound).
4.2.2. Expenditure effectsThe expenditure effects as listed in Table 2 relate to projections
of the effect of the reduction in inbound tourism on national macrovariables and tourism industry macro variables. As argued above,the rise in the PMC leads to a fall in inbound tourism expenditure of$24.59 million, assuming a price elasticity of demand of �0.5 and$49.18 million using an elasticity measure of �1.0. These amountsare the demand shocks applied to the CGE model to estimate theeconomic impacts of the increased PMC.
The impact on GDP from decreased tourism is �$1.89 millionor �$3.80 million, depending on the assumed value of the priceelasticity of demand for inbound tourism. The impact on GrossNational Income (GNI) is also �$1.89 million or �$3.80 millionaccording to the assumed price elasticity value. GNI is the totalvalue of goods and services producedwithin a country (i.e. its GDP),
Table 2Economic effects of a 17 per cent increase in the PMC e inbound tourism ($million).
National macro variables Expenditure effect: inbound
3 �0.5 3 �1.0
Change in real GDP, $m �1.89 �3.80Change in real GNI, $m �1.89 �3.80Change in economic welfare, $m �1.89 �3.80
Tourism macro variablesChange in real tourism output, $m �22.10 �44.20Change in real tourism GDP, $m �11.62 �23.24Change in tourism employment, persons �172 �344
Tourism macro variables between row 4 and row 5.Source: authors’ estimates.
together with its income received from other countries (notablyinterest and dividends), less similar payments made to othercountries. When foreign residents pay the increased PMC, theproduction of goods and services may stay the same, but the in-come available to the country will go up e the residents will gainfrom the fact that foreigners are paying the tax, not its residents.This effect is captured in GNI.
Neither GDP nor GNI is necessarily a goodmeasure of howmuchbetter off a country is as a result of the increased PMC. The bestindicator of howmuch better or worse off a country is as a result ofa policy change is the change in economic welfare, rather than thechange in GDP, whichmeasures the change in output, or GNI, whichmeasures the change in income. When GDP goes up as a result ofuse of additional factor inputs, there will be additional output, butthere will be an additional cost, since these inputs are not costless.To measure how much better off a country is, one needs a welfaremeasure. The MMRF model does not have an explicit welfaremeasure e however a good proxy for welfare can be developed bysubtracting the cost of the additional inputs from the value of theadditional output (Dixon, 2009). It is also necessary to include anyterms of trade effects e this is done in the welfare measure. In thisstudy, the simulations are for the economy with fixed labour andcapital, and thus GNI and economic welfare are equal (In generalthese are different). This corresponds to a case inwhich there is fullemployment e which is currently the case in Australia.
Table 2 also shows the effects of the increase in PMC on thetourism industry itself. There is a fall in Tourism Output of $22.10million (elasticity of �0.5) or of $44.20 million (elasticity of �1.0).Tourism output is measured at ‘basic prices’, that is, it excludes alltaxes and margins on tourism product. Tourism GDP declines by$11.62 million or $23.24 million. Tourism GDP represents the totalmarketvalueofdomesticallyproducedgoodsandservices consumedby visitors after deducting the cost of goods and services used up inthe process of production. Tourism employment, representing directemployment involved in the production of goods and services, de-clines by 172 or 344 jobs depending on the elasticity value.
4.2.3. Taxation revenue effectsThe increase in the PMC adds to the government’s revenue from
taxation. The additional tax revenue from the increased PMC in-creases Gross Domestic Product (GDP) by $0.83million. Muchmoresubstantial is the income effect-, the increased tax revenue in-creases Gross National Income (GNI) and economic welfare by$49.92 million since non-residents rather than Australians arepaying the tax. As noted, tourism is one of only two export in-dustries (with education), that are subject to Australia’s Goods andServices Tax (GST). As a highly taxed industry the inbound taxrevenue effect may be expected to be large. In contrast, the inboundtax revenue effects resulting from the change in real tourism
P. Forsyth et al. / Tourism Management 40 (2014) 126e136 133
output, real tourism GDP and employment are negative but smallon both elasticity assumptions.
4.2.4. Total inbound effectOverall, there is a negative impact on GDP of �$1.06 million
or �$2.97 million, depending on the assumed elasticity value, and alarge positive impact onGNI and EconomicWelfare of $48.03millionor $46.12million, associatedwith inbound tourism.Australia, overall,gains from increasing the PMC. However, at the industry level,tourism industry output, tourism GDP and tourism employment arereduced, by $22.00 million, $11.57 million and 173 jobs, respectivelyusing an assumed price elasticity of demand of �0.5, and $44.10million, $23.19 million and 346 jobs for an elasticity of �1.0.
4.2.5. Outbound tourism effectsThe increased PMC will reduce outbound tourism by Australian
residents. Some of this reduction will increase the demand fordomestic tourism depending on the extent to which residents re-gard domestic tourism as a close substitute for overseas travel. Toour knowledge no quantitative research has is publicly available onthe degree to which residents of Australia regard a domestic holi-day as a substitute for international travel. The Expenditure effectoutbound, the tax revenue effect outbound and the domestictourism diversion effect are set out in Table 3.
The rise in the PMC leads to a fall in outbound tourism expen-diture of $27.73 million (elasticity of �0.5) or $55.46 million(elasticity of �1.0). The switch in expenditure from outboundtourism to domestic goods and services has a positive impact onGDP, GNI and economic welfare of $1.12 million, assuming the priceelasticity of demand is �0.5, and $2.24m if an elasticity of �1.0 isassumed. This means that an increase in the PMC will discourageoutbound tourism, and that this will be positive for the economy.
A tax revenue effect is present. There is a positive impact on GDP($1.29 million) and other macro indicators due to the switch intaxes. This is essentially a case of the government switching one taxpaid by residents for anothere thus the effect on GNI is the same asthe effect on GDP. In this case, the additional tax has a positiveeffect on GDP.
The reduction in outbound tourism stimulates domestic tourismto some extent. With 100% diversion of outbound tourism to do-mestic tourism, the impacts on national output, tourism GDP andtourism employment are positive on both elasticity assumptions.With only 50% diversion, the tourism impacts are still positivethough smaller. That is, there will be a larger positive effect on GDPand other macro indicators the more residents divert theirspending to domestic tourism rather than goods in general. In fact,when residents spend half or more of their spending on domestictourism rather than goods in general, the positive impact fromreduced outbound tourism is greater than the negative impact from
Table 3Economic effects of the PMC e outbound and domestic tourism ($ millions).
National macro variable Expenditure effect:outbound
Tax revenue effeoutbound
3¼�0.5 3¼�1.0 3¼�0.5 3¼�
Change in real GDP, $m 1.12 2.24 1.29 1Change in real GNI, $m 1.12 2.24 1.29 1Change in economic welfare, $m 1.12 2.24 1.29 1
Tourism macro variableChange in real tourism output, $m �4.36 �8.76 �4.74 �4Change in real tourism GDP, $m �2.30 �4.60 �2.49 �2Change in tourism employment, person �34 �68 �37 �37
Source: authors’ estimates.
reduced inbound tourism. This suggests that the gains to theeconomy from reducing outbound tourism are of a comparableorder of magnitude to the losses to the economy from reducedinbound tourism, as long asmost of the diverted spending goes intodomestic tourism.
Turning to the impact on the tourism industry, there is anegative initial impact (with falls in tourism output, real tourismGDP and tourism employment) since a reduction in outboundtourism reduces demand for before-and-after trip expenditurerelated to outbound activity. Expenditure on outbound tourismwithin Australia is an important component of Internal TourismConsumption, the total value of goods and services consumed byboth resident and non-resident visitors within Australia. In 2010e11, tourism consumption by Australian residents on outbound trips(that is, before-and-after outbound trips) was $7.082 billion, or 18.6per cent of outbound expenditure (Australian Bureau of Statistics,2011).
Tourism output and employment are, on balance, positivelyimpacted by the rise in the PMC (Table 3). The size of the effects ontourism depends on the price elasticity of tourism demand and onthe extent to which domestic tourism is regarded as a good sub-stitute for outbound tourism. In the case where there is full sub-stitution of domestic for outbound tourism, there is a relativelylarge impact on tourism output ($22.75 million e in the �0.5elasticity case), with positive changes also in tourism GDP ($11.96million) and tourism employment (178 jobs). The gains associatedwith the higher assumed elasticity value are greater. Where do-mestic tourism receives only 50 per cent of the foregone outboundtourism, the gains to the industry are halved.
4.3. Overall effect of changes in the PMC
The overall effect from increasing the PMC, through its impactson inbound, outbound and domestic travel, can be summarised.The results in Table 4 assume a price elasticity of demand of �0.5whilst those in Table 5 assume an elasticity of �1.0.
Table 4 shows that with an assumed elasticity of �0.5,depending on the extent of diversion from outbound to domestictourism, the 17 per cent increase in the PMC has a positive impacton GDP ($3.07 million or $2.21 million) but a much greater positiveimpact on GNI and economic welfare ($50.44 million or $49.58million) since the PMC results in foreign tourists paying Australiantaxes.
By contrast, the increase in the PMC has a negative impact onAustralian tourism output, tourism GDP and tourism employment.The losses experienced by the tourism industry depend on thedegree to which domestic tourism is a substitute for outboundtourism. If domestic tourism is regarded as a perfect substitute foroutbound tourism (an extreme case) then after all effects are taken
P. Forsyth et al. / Tourism Management 40 (2014) 126e136134
into account tourism output declines by $8.55 million, tourism realGDP by $4.50 million and tourism employment by 66 full time jobs.Assuming, on the other hand, that only 50 per cent of intendingoutbound tourists switch to domestic tourism as a result of theincreased PMC, the losses to tourism will be greater. On this sce-nario, tourism output declines by $19.93 million, real tourism GDPdeclines by $10.48 million and 155 tourism jobs are lost. Losses tothe tourism industry occur largely because the decline as a result ofreduced inbound travel exceeds the positive effect on domestictourism diverted from outbound travel.
Table 5 shows that the increased PMC has slightly reducedeconomy wide impacts associated with the greater elasticity ofdemand, with real GDP projected to increase by $4.00 million or$2.28 million and real GNI and economic welfare projected to in-crease by $53.09 million or $51.37 million depending on the extentof diversion from outbound to domestic tourism. Again the netpositive impact on the economy as a whole results primarily fromthe tax revenue effect. The same as for the previous table, this effectis sufficient to outweigh other impacts.
There are greater negative impacts on Australian tourism output,tourism GDP and tourism employment for the higher elasticityassumption. Even if domestic tourism gains all of the reducedoutbound tourism expenditure, tourism output declines by $12.30million, tourism real GDP by $6.46million and tourism employmentby 95 full time jobs. These negative results are due primarily to thenegative inbound expenditure effects. Assuming that only 50 percent of intending outbound tourists now switches to domestictourism as a result of the increased PMC, the losses to tourism willbe greater. Tourism output falls by $35.05 million, real tourism GDPby $18.42 million and 273 tourism jobs are lost. Losses to thetourism industry again occur largely because the negative inboundexpenditure effects outweigh the domestic expenditure effects.
5. Discussion
The increased PMC has positive impacts on the Australianeconomy, in terms of GNI and welfare. This is not at all surprising.Because the tax is levied on foreign residents, there is a transfer ofreal resources fromoverseas toAustralia: Australia ismuchbetteroffthrough getting other countries to pay its taxes. Effectively, this is arise in the terms of trade ewhich is reflected more clearly by GNI.
Not surprisingly, a rise in the PMC is negative for Australia’sinbound tourism industry and for outbound tourism. Losses to thetourism industry are greater the less domestic tourism is perceivedto be a good substitute for outbound tourism. The domestic tourismsubstitution effect is positive, as expected. To the extent thatspending on domestic travel may have slightly greater economicimpacts than spending on goods which may be less labour inten-sive than tourism, a switch to domestic tourism may have slightly
Table 4Economic effects of the PMC e inbound, outbound and domestic tourism, 3¼�0.5.
National macro variable Inboundexpenditureeffect
Tax revenueeffect: inbound
Outboundexpenditureeffect
Taxeffe
Change in real GDP, $m �1.89 0.83 1.12Change in real GNI, $m �1.89 49.92 1.12Change in economic welfare, $m �1.89 49,92 1.12
Tourism macro variableChange in real tourism output, $m �22.10 �0.10 �4.36 �Change in real tourism GDP, $m �11.62 �0.05 �2.30 �Change in tourism employment,
person�172 �1 �34 �3
Source: authors’ estimates.
larger impacts than greater spending on non-tourism goods andservices. Sensitivity analysis can of course be undertaken using arange of assumptions about the extent of diversion, in addition tothe 100 per and 50 per cent assumptions employed in this study.However, even assuming complete substitutability the tourismindustry, unambiguously, will be a net loser from the PMC increasetaking into account its negative impacts on both inbound andoutbound tourism.
The present study employs the same values for the price elas-ticity of demand (3¼�0.5, and 3¼�1.0) across all inbound andoutbound markets. Given the likelihood of differences in priceelasticities of demand for visitors from Australia’s different sourcemarkets, any such differences will impact on the numbers of visi-tors from these markets and hence affect the expenditure and taxeffect estimates of the increased PMC on the wider economy andthe tourism industry. Similarly, it is likely that the price elasticitiesof demand for outbound travel differ as between destinations,affecting both the level of outbound tourism and the amount ofdiversion to domestic tourism. At the present time we do not haveuniversally accepted estimates of price elasticities of demand at therequired market segment levels for Australia’s inbound oroutboundmarkets. Notwithstanding this, the framework presentedcan allow for different elasticity measures to be employed for bothinbound and outbound markets. As our knowledge of the relevantelasticities increases, so too can the framework be used to employthis knowledge to estimate the relevant expenditure and tax effectson increases in the PMC.
Two specific industry concerns deserve further analysis. One isthat the PMC itself, as well as increases in it, have a greater pro-portionate effect on total trip expenditure to and from New Zea-land, Australia’s major tourism source market and thus will impactthis market more substantially than other inbound markets. As theTTF has pointed out, the PMC comprises up to 30 per cent of theticket price on some Australia-New Zealand routes (TTF, 2012a).Relevant to this concern there is evidence that the price elasticity ofdemand for tourists from New Zealand is greater than for otherinbound markets (Crouch, Schultz, & Valerio, 1992; Kulendran &Divisekera, 2007; Kulendran & Dwyer, 2009). If so then Australiamay see a greater erosion of visitors from this market (or greaternegative impact on its growth rate) compared to others. The sameas for the other assumptions, the framework lends itself to asensitivity analysis whereby different elasticity measures can beapplied for the New Zealand (or any other) inbound and outboundmarkets to estimate the expenditure and tax effects of the PMCchange.
A second industry concern deserving of further analysis is thatthe increased PMC will particularly hurt those destination regionsthat are most dependent on inbound tourism. It is the internationalcomponent of Australia’s tourism industry that suffers most,
Change in real GDP, $m �3.80 0.83 2.24 1.29 3.44 1.72 4.00 2.28Change in real GNI, $m �3.80 49.92 2.24 1.29 3.44 1.72 53.09 51.37Change in Economic Welfare, $m �3.80 49.92 2.24 1.29 3.44 1.72 53.09 51.37Tourism macro variableChange in real tourism output, $m �44.20 �0.10 �8.76 �4.74 45.50 22.75 �12.30 �35.05Change in real tourism GDP, $m �23.24 �0.05 �4.60 �2.49 23.92 11.96 �6.46 �18.42Change in tourism employment,
person�344 �2 �68 �37 356 178 �95 �273
Source: author estimates.
P. Forsyth et al. / Tourism Management 40 (2014) 126e136 135
including tourism firms most associated with outbound tourism.Within this group of firms, those in remote areas most heavilydependent on inbound tourism will be the major losers. On theother hand, firms that cater primarily to domestic tourists can begainers from the tax. This raises the possibility that specificcompensation or strategic management measures can be devel-oped to support selected sectors of the tourism industry over andabove the 10 per cent share of the latest revenue increase ($61million) which has been earmarked for tourism promotion. Un-fortunately, the increase in the PMC has been undertaken withoutany study of its implications for different tourismmarkets by originor tourism firms by location. While the national CGE modelemployed in this study cannot throw any light on such issues,regional CGE models (Pham, Simmons, & Spurr, 2010) can play auseful role in informing stakeholders of the gains and lossesexperienced by different tourism sectors in regional destinations.
A further question arises regarding the use of the $61 millionfunding allocated to Tourism Australia from the increase in PMCover the next four years. As far as is known, no study has been doneon the most efficient/effective ways of spending the surplus ofrevenue over costs, however there has been research which showsthat additional promotional expenditure is effective in increasingGDP (see Dwyer et al., 2013). Tourism Australia has stated that itwill allocate the additional funds to target high yielding consumersegments in growing, key Asian markets, including existing mar-kets and those with long-term potential. This strategy has the po-tential to overcome the losses that the tourism industryexperiences from the PMC.
6. Conclusions
This study has estimated the impacts of an increase in the PMC,Australia’s departure tax. Impacts were estimated for both theeconomy and the tourism industry specifically.
While there are several effects which work in conflicting di-rections, by far the largest effect is the inbound tax effect. Inretrospect, this is not surprising since a country gains from gettingits visitors to pay its taxes. It should be noted that while an indi-vidual country will gain, the imposition of a tax by a country may,and probably will, be negative for global welfare. Additionally, theimpact of a switch from outbound travel expenditure to domesticspending will be positive, regardless of whether it is to domestictravel or to increased expenditure on other goods and services.
On balance, a tourism industry can gain or lose from a passengertax increase, depending on the price elasticity of the demands forinbound and outbound travel, the balance of inbound andoutbound travel, and on the extent to which domestic tourism is asubstitute for outbound tourism. On the assumptions that under-pinned this study, the tourism industry in Australia is a net loserfrom the increased PMC. As most of the total economic positive
effects accrue to the non-tourism industries, this suggests that thePMC works, in effect, as a transfer payment from tourism to non-tourism industries. This effect is magnified as there is only asmall tourism-specific use of the extra Government revenue benefitderived from the increased taxation earned from non-residents.
The assessments are reliant on a number of key parameters. Inparticular, tourism demand elasticity estimates differ widely in theavailable literature, including for Australia, and there is no acceptedvalue available for this assessment. If there is unemployment or hightourism taxes, the tourism impactswill be larger, inparticular for thecase of inelastic demand for inbound tourism, and the negative ef-fects for the tourism industryof an increase in the PMCwill be larger.The framework proposed enables the sensitivity of the simulationsto elasticity values to be gauged as well as the effects of differentdegrees of substitution from outbound to domestic tourism.
The study throws light on the validity of the concerns of tourismstakeholders on the effects of the increased departure tax. Mostimportantly, it shows that calls for the complete abolition of the PMC(BARA, 2012) reveal a failure to understand that the tax benefits theAustralian economy. While the tourism industry may indeed losefrom the increased PMC, the economy as a whole may gain.
References
Adams, P. (2008). MMRF: Monash multi-regional forecasting model e A dynamicmulti-regional applied general equilibrium model of the Australian economy.Centre of Policy Studies, Monash University.
AFTA. (2012). AFTA urges industry to fight against PMC rise. Thursday, 14 June 2012http://www.etravelblackboard.com/article/132673 Accessed 14.08.12.
ATEC. (June 14, 2012). Managing director’s update. Australian Tourism ExportsCouncil.
Australian Bureau of Statistics [ABS]. (December 2011). Australian national accountstourism satellite account 2010e11. (Cat. no. 5249.0). Canberra http://www.abs.gov.au/.
Australian Customs and Border Protection Services. (2011). Annual report 2010e2011. Canberra: Australian Government.
Australian Government. (2008). Passenger movement charge collection act 1978-C2008C00674. Canberra: Attorney-General’s Department. http://www.comlaw.gov.au/Details/C2008C00674.
BARA. (2012). Government and some tourism groups still eyeing the PMC. AirlineViews Archive. http://www.bara.org.au/baras-voice/bara-newsletter/2010-archive Accessed 11.06.12.
Berster, P., Gelhausen, M., Grimme, W., Kiemel, H., Maertens, S., Pabst, H., et al.(2010). The impacts of the planned air passenger duty in Germany.
Carmody. (2002). The economic value of tourism for Australia: A post-September 2001stock-take&update. Accesseconomics report forAustralianTourist Commission25.
Commonwealth of Australia. (2010). Australia’s future taxation system: Report to thetreasurer. Canberra: Attorney-General’s Department.
Crouch, G. I. (1995). A meta-analysis of tourism demand. Annals of Tourism Research,22(1), 103e118.
Crouch, G. I., Schultz, L., & Valerio, P. (1992). Marketing international tourism toAustralia: a regression analysis. Tourism Management, 13, 196e208.
Dargay, J., & Hanly, M. (2001). The determinants of the demand for international airtravel to and from the UK. Paper presented at the 9th World conference ontransport research.
Dixon, P. (2009). Comments on the productivity commission’s modelling ofthe economy-wide effects of future automotive assistance. Economic Papers, 28,11e18.
Peter Forsyth is Professor of Economics at Monash Uni-versity. His research has been on applied microeconomics,with particular reference to the economics of air transport,tourism economics and of regulation. He has recentlypublished a jointly edited book on Airport Competition theEuropean Experience, Ashgate, 2010. He is a frequentspeaker at the Hamburg Aviation Conference, and in 2005delivered the Martin Kunz Memorial Lecture. Recent workhas involved using computable general equilibriummodels to assess the economic impacts of tourism,including events, and in analysing tourism and aviationpolicy issues.
Larry Dwyer PhD is Professor of Travel and Tourism Eco-nomics in the School of Marketing, Australian School ofBusiness, University of New South Wales. He publisheswidely in the areas of tourism economics, managementand policy, with over 200 publications in internationaljournals, books, government reports, chapters in books,and monographs. He has been awarded numerousresearch grants to contribute to tourism knowledge.
Tien Duc Pham PhD is a manager at Tourism ResearchAustralia (TRA). He is also a researcher at Tourism School,University of Queensland, Australia. His main researchinterests are regional economic modelling includingTourism Satellite Accounts (TSAs). Tien develops TSAs forall states and territories of Australia, published by TRA.
Ray Spurr has held senior positions in the Australiangovernment Ministry of Tourism and in the School ofMarketing, University of New South Wales. His majorresearch interests are in tourism economics and policy.
P. Forsyth et al. / Tourism Management 40 (2014) 126e136136
Dwyer, L., Forsyth, P., & Dwyer, W. (2010). Tourism economics and policy. Clevedon,UK: Channel View Publications.
Dwyer, L., Forsyth, P., Spurr, R., & Hoque, S. (2013). Economic impacts of carbontaxes on the Australian tourism industry. Journal of Travel Research. in press.
Dwyer, L., Forsyth, P., & Spurr, R. (2004). Evaluating tourism’s economic effects: newand old approaches. Tourism Management, 25, 307e317.
Dwyer, L., Forsyth, P., Spurr, R., & Van Ho, T. (2003). Contribution of tourism byorigin market to a state economy: a multi-regional general equilibrium analysis.Tourism Economics, 9(4), 431e448.
Dwyer, L., Forsyth, P., Spurr, R., & Van Ho, T. (2006). Economic effects of the worldtourism crisis on Australia. Tourism Economics, 12(2), 171e186.
van Egmond, S., & de Jong, X. (January 2010). Aviation taxes: The Netherlands is notan island. Utrecht: Capgemini Nederland B.V.
Forsyth, P. (Dec 2006). Martin Kunz memorial lecture. Tourism benefits and aviationpolicy. Journal of Air Transport Management, 3e13.
Forsyth, P., Niemeier, H.-M., & Dwyer, L. (2012).Measuring the economic impact of airpassenger taxes. Mimeo.
Gordijn, H. (2010). The Dutch aviation tax: Lessons for Germany? Netherlands Insti-tute for Transport Policy Analysis (KiM). Paper presented at Infraday-2010,Berlin, 8e9 October.
Harrison, W. J., & Pearson, K. R. (1996). Computing solutions for large generalequilibrium models using GEMPACK. Computational Economics, 9, 83e127.
Keen, M., & Strand, J. (2007). Indirect taxes on international aviation. Fiscal Studies,28, 1e41.
Kulendran, N., & Divisekera, S. (2007). Measuring the economic impact of Australiantourism marketing expenditure. Tourism Economics, 13(2), 261e274.
Kulendran, N., & Dwyer, L. (February 2009). Measuring the return fromAustralian tourism marketing expenditure in Asia. Journal of Travel Research, 47,275e284.
Madden, J. R., & Thapa, P. J. (2000). The contribution of tourism to the New SouthWales economy: A multi-regional general equilibrium analysis. CREA researchmemorandum. Hobart, Tasmania: Centre for Regional Economic Analysis, Uni-versity of Tasmania.
Morley, C. L. (1998). A dynamic international demand model. Annals of TourismResearch, 25, 70e84.
Nancarrow, D. (December 20, 2011). BARA targets passenger movement chargeaviation business Asia Pacific. http://www.aviationbusiness.com.au/news/bara-targets-passenger-movement-charge.
Pearce, B. (2009). What is driving travel demand? Managing travel’s climate impacts.The travel & tourism competitiveness report 2008 (pp. 83e90). World Eco-nomic Forum.
Productivity Commission. (April 2005). Assistance to tourism: Exploratory estimates.Commission research paper. Canberra.
Pham, T. D., Simmons, D. G., & Spurr, R. (2010). Tourism: adapting to climatechange and climate policy [Special issue]. Journal of Sustainable Tourism, 18(3),449e473.
Seetaram, N. (2012). Immigration and tourism demand: empirical evidence fromAustralia. Tourism Management, 33(6), 1535e1543.
Tisdell, C. A. (1983). Public finance and the appropriation of gains from interna-tional tourists: some theory with ASEAN and Australian illustrations. SingaporeEconomic Review, 28, 3e20.
Tourism Australia. (2012). Tourism Australia unveils new marketing push in Asia.Tourism Australia Media Centre. http://www.media.australia.com/enau/mediareleases/default_9065.aspx Accessed 17.08.12.
Tourism Research Australia. (June 2011). Factors affecting the inbound tourism sectore The impact and implications of the Australian dollar. Canberra: Department ofResources, Energy and Tourism, Australian Government.
Tourism Research Australia. (October 2012). State of the industry 2011 tourismresearch Australia. Canberra: Department of Resources, Energy and Tourism,Australian Government.
Tourism and Transport Forum. (September 2011). Taxing times a look at the tax issuesimpacting the tourism, aviation and transport sectors. Sydney: Tourism andTransport Forum.
Tourism and Transport Forum. (May 2012). Submission: Passenger movement chargeamendment bill inquiry. Senate Standing Committee on Legal and ConstitutionalAffairs.
TTF. (2012a). Australian budget to cost kiwis millions. Media release, May 17 http://www.google.com.au/search?hl¼en&source¼hp&q¼AustralianþBudgetþtoþCostþKiwisþMillions&gbv.
TTF. (2012b). Australian tourism facing triple tax burden. Media release, June 6http://www.etravelblackboard.com/article/132438/australian-tourism-facing-triple-tax-burden.
Veldhuis, J. (10 February 2010). The implications of the ticket tax at airports in theNetherlands. GARS workshop. Hamburg: Amsterdam Aviation Economics.
WEF. (2013). The travel & tourism competitiveness report 2013. In J. Blanke, &T. Chiesa (Eds.), Reducing barriers to economic growth and job creation. Geneva:World Economic Forum.
WTTC. (October 13, 2011). Australia’s carbon tax is another cost burden on astruggling industry. News Archive. http://www.wttc.org/news-media/news-archive/2011/wttc-australias-carbon-tax-another-costburden-struggling-indust/.
WTTC. (2012a). The economic case for abolishing APD in the UK. London: WorldTravel and Tourism Council. March.
WTTC. (2012b). Air tax: doing substantial damage to the UK economy. http://www.wttc.org/news-media/news-archive/2012/air-tax-doing-substantial-damage-ukeconomy/.