1
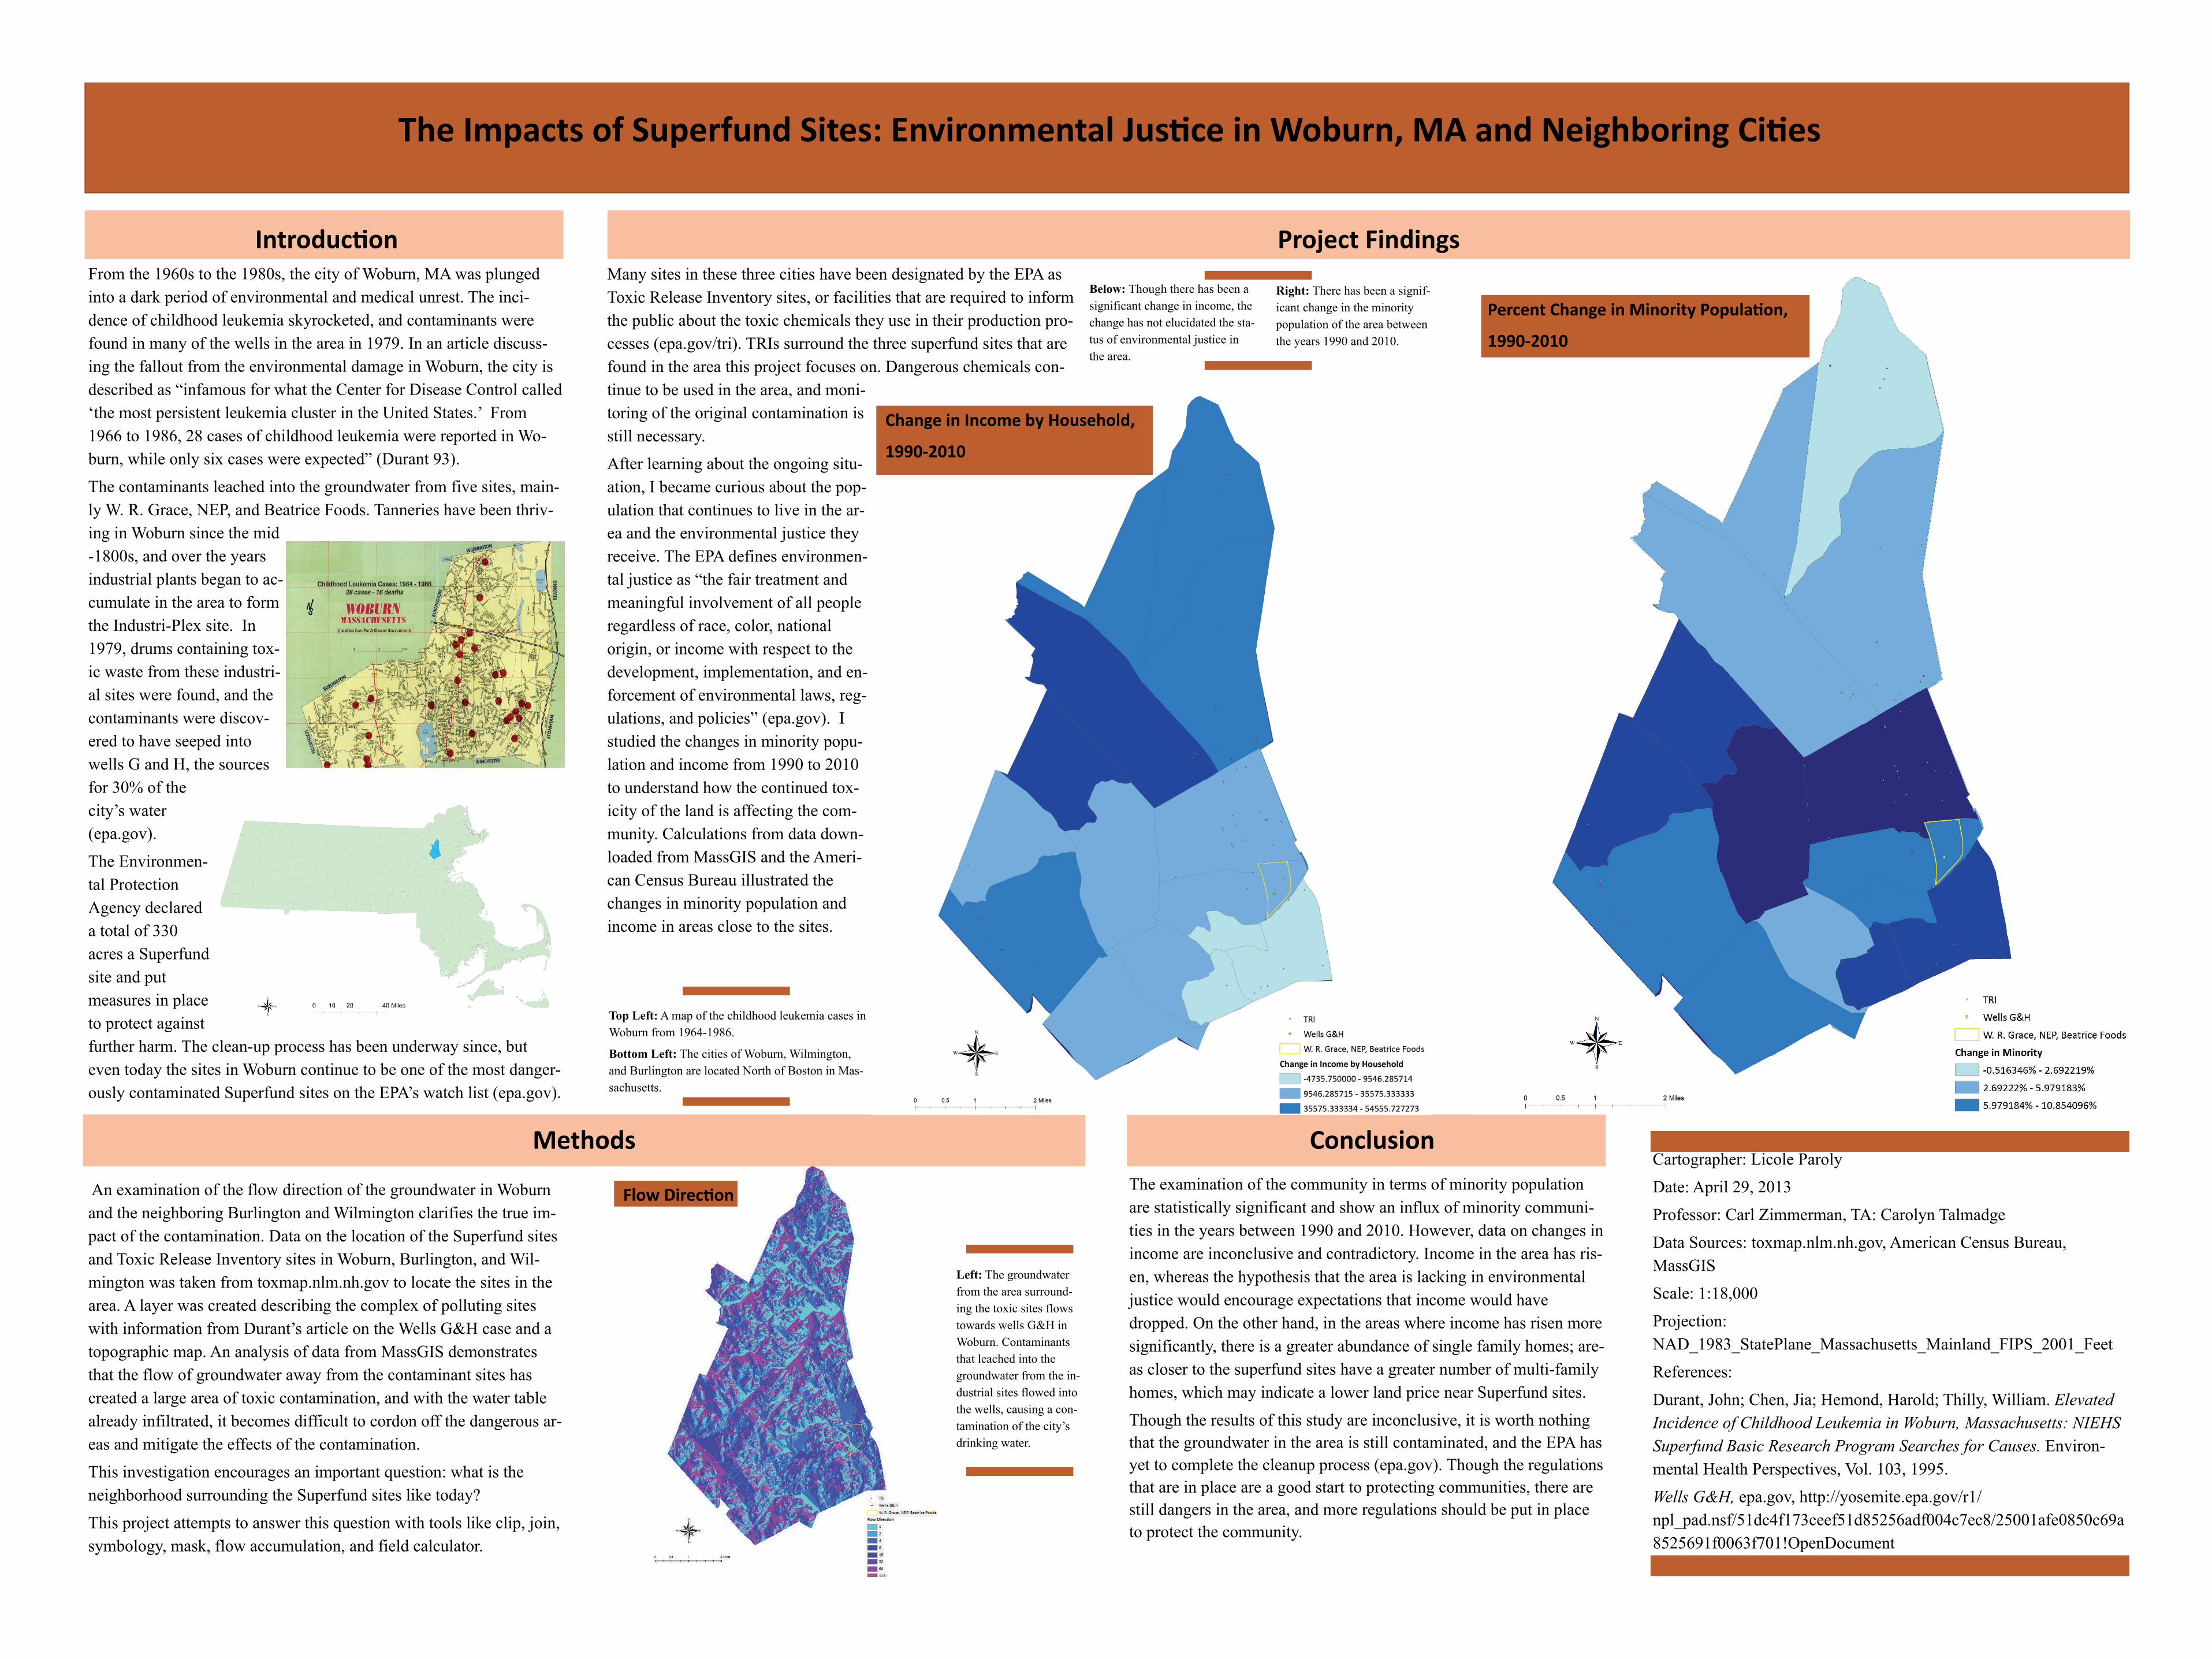
From the 1960s to the 1980s, the city of Woburn, MA was plunged into a dark period of environmental and medical unrest. The inci- dence of childhood leukemia skyrocketed, and contaminants were found in many of the wells in the area in 1979. In an article discuss- ing the fallout from the environmental damage in Woburn, the city is described as “infamous for what the Center for Disease Control called ‘the most persistent leukemia cluster in the United States.’ From 1966 to 1986, 28 cases of childhood leukemia were reported in Wo- burn, while only six cases were expected” (Durant 93). The contaminants leached into the groundwater from five sites, main- ly W. R. Grace, NEP, and Beatrice Foods. Tanneries have been thriv- ing in Woburn since the mid -1800s, and over the years industrial plants began to ac- cumulate in the area to form the Industri-Plex site. In 1979, drums containing tox- ic waste from these industri- al sites were found, and the contaminants were discov- ered to have seeped into wells G and H, the sources for 30% of the city’s water (epa.gov). The Environmen- tal Protection Agency declared a total of 330 acres a Superfund site and put measures in place to protect against further harm. The clean-up process has been underway since, but even today the sites in Woburn continue to be one of the most danger- ously contaminated Superfund sites on the EPA’s watch list (epa.gov). An examination of the flow direction of the groundwater in Woburn and the neighboring Burlington and Wilmington clarifies the true im- pact of the contamination. Data on the location of the Superfund sites and Toxic Release Inventory sites in Woburn, Burlington, and Wil- mington was taken from toxmap.nlm.nh.gov to locate the sites in the area. A layer was created describing the complex of polluting sites with information from Durant’s article on the Wells G&H case and a topographic map. An analysis of data from MassGIS demonstrates that the flow of groundwater away from the contaminant sites has created a large area of toxic contamination, and with the water table already infiltrated, it becomes difficult to cordon off the dangerous ar- eas and mitigate the effects of the contamination. This investigation encourages an important question: what is the neighborhood surrounding the Superfund sites like today? This project attempts to answer this question with tools like clip, join, symbology, mask, flow accumulation, and field calculator. The Impacts of Superfund Sites: Environmental Jus Ɵce in Woburn, MA and Neighboring CiƟes Many sites in these three cities have been designated by the EPA as Toxic Release Inventory sites, or facilities that are required to inform the public about the toxic chemicals they use in their production pro- cesses (epa.gov/tri). TRIs surround the three superfund sites that are found in the area this project focuses on. Dangerous chemicals con- tinue to be used in the area, and moni- toring of the original contamination is still necessary. After learning about the ongoing situ- ation, I became curious about the pop- ulation that continues to live in the ar- ea and the environmental justice they receive. The EPA defines environmen- tal justice as “the fair treatment and meaningful involvement of all people regardless of race, color, national origin, or income with respect to the development, implementation, and en- forcement of environmental laws, reg- ulations, and policies” (epa.gov). I studied the changes in minority popu- lation and income from 1990 to 2010 to understand how the continued tox- icity of the land is affecting the com- munity. Calculations from data down- loaded from MassGIS and the Ameri- can Census Bureau illustrated the changes in minority population and income in areas close to the sites. IntroducƟon Methods Project Findings The examination of the community in terms of minority population are statistically significant and show an influx of minority communi- ties in the years between 1990 and 2010. However, data on changes in income are inconclusive and contradictory. Income in the area has ris- en, whereas the hypothesis that the area is lacking in environmental justice would encourage expectations that income would have dropped. On the other hand, in the areas where income has risen more significantly, there is a greater abundance of single family homes; are- as closer to the superfund sites have a greater number of multi-family homes, which may indicate a lower land price near Superfund sites. Though the results of this study are inconclusive, it is worth nothing that the groundwater in the area is still contaminated, and the EPA has yet to complete the cleanup process (epa.gov). Though the regulations that are in place are a good start to protecting communities, there are still dangers in the area, and more regulations should be put in place to protect the community. Conclusion Cartographer: Licole Paroly Date: April 29, 2013 Professor: Carl Zimmerman, TA: Carolyn Talmadge Data Sources: toxmap.nlm.nh.gov, American Census Bureau, MassGIS Scale: 1:18,000 Projection: NAD_1983_StatePlane_Massachusetts_Mainland_FIPS_2001_Feet References: Durant, John; Chen, Jia; Hemond, Harold; Thilly, William. Elevated Incidence of Childhood Leukemia in Woburn, Massachusetts: NIEHS Superfund Basic Research Program Searches for Causes. Environ- mental Health Perspectives, Vol. 103, 1995. Wells G&H, epa.gov, http://yosemite.epa.gov/r1/ npl_pad.nsf/51dc4f173ceef51d85256adf004c7ec8/25001afe0850c69a 8525691f0063f701!OpenDocument Below: Though there has been a significant change in income, the change has not elucidated the sta- tus of environmental justice in the area. Right: There has been a signif- icant change in the minority population of the area between the years 1990 and 2010. Top Left: A map of the childhood leukemia cases in Woburn from 1964-1986. Bottom Left: The cities of Woburn, Wilmington, and Burlington are located North of Boston in Mas- sachusetts. Left: The groundwater from the area surround- ing the toxic sites flows towards wells G&H in Woburn. Contaminants that leached into the groundwater from the in- dustrial sites flowed into the wells, causing a con- tamination of the city’s drinking water. Flow DirecƟon Change in Income by Household, 1990‐2010 Percent Change in Minority PopulaƟon, 1990‐2010