32
Patrick Daru (ILO) and Eduarda Castel-Branco (ETF) Geneva, 11/05/2017 THE IM (PERFECT) MATCH – ILO INTERNATIONAL CONFERENCE REGIONAL VIEW: ARAB STATES AND CENTRAL ASIA
Patrick Daru (ILO) and Eduarda Castel-Branco (ETF)
Geneva, 11/05/2017
THE IM(PERFECT) MATCH – ILO INTERNATIONAL CONFERENCE
REGIONAL VIEW: ARAB STATES AND CENTRAL ASIA
DO SKILLS MATTER IN THE MENA REGION?
2
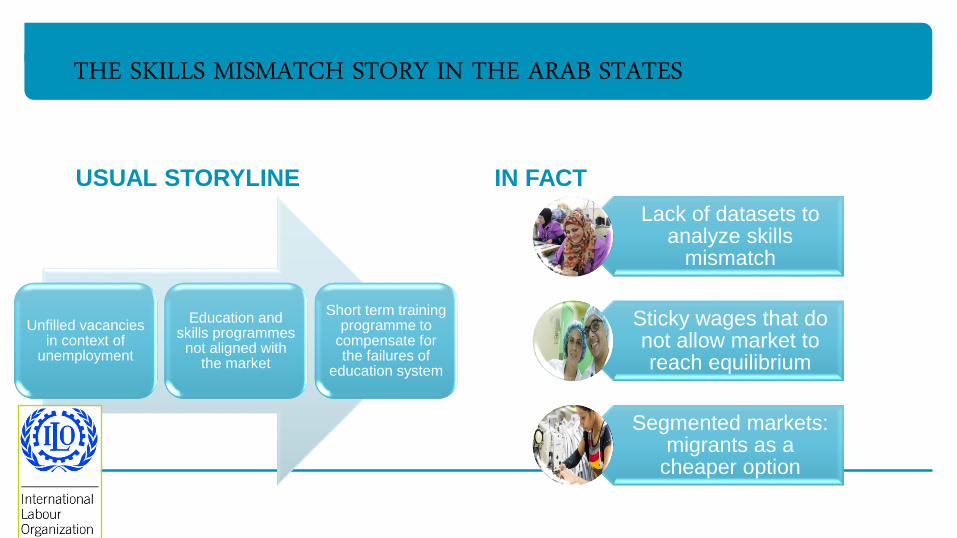
THE SKILLS MISMATCH STORY IN THE ARAB STATES
USUAL STORYLINE
Unfilled vacancies in context of
unemployment
Education and skills programmes
not aligned with the market
Short term training programme to
compensate for the failures of
education system
IN FACT
Lack of datasets to analyze skills
mismatch
Sticky wages that do not allow market to reach equilibrium
Segmented markets: migrants as a
cheaper option
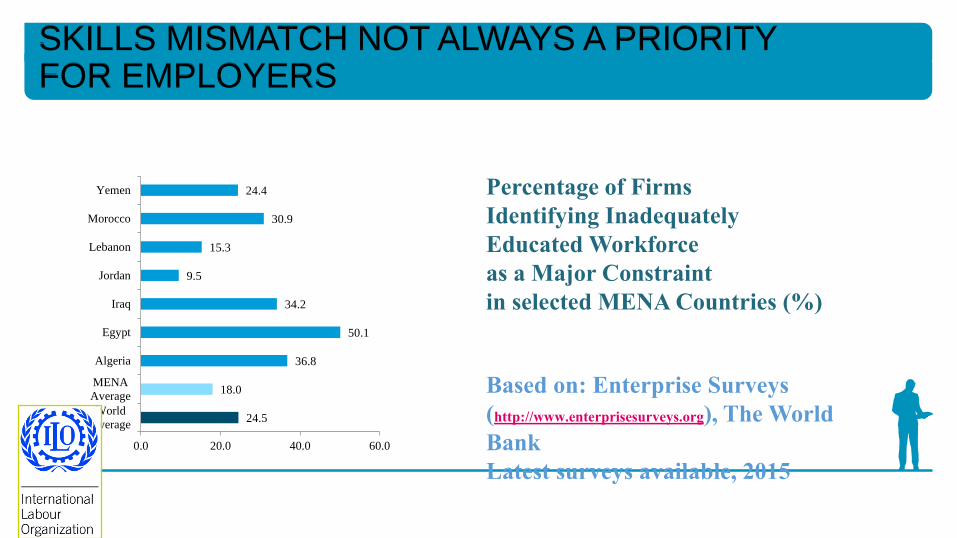
SKILLS MISMATCH NOT ALWAYS A PRIORITY FOR EMPLOYERS
24.5
18.0
36.8
50.1
34.2
9.5
15.3
30.9
24.4
0.0 20.0 40.0 60.0
World
Average
MENA
Average
Algeria
Egypt
Iraq
Jordan
Lebanon
Morocco
Yemen
Based on: Enterprise Surveys
(http://www.enterprisesurveys.org), The World
Bank
Latest surveys available, 2015
Percentage of Firms
Identifying Inadequately
Educated Workforce
as a Major Constraint
in selected MENA Countries (%)

ON THE EMPLOYERS’ SIDE
Employers complain about skills mismatch (not always), and do not train
• 16% Arab Firms train new hires against 36% globally (WB Enterprise Survey)
Skills are not adequately valued
• Wage differentials between most and least educated are the lowest in the world
Short term business vision
• Benefit from laboursurplus in a context of low skilled labourintensive production;
• Longer term investment in business and skills difficult in the context of fragility
Lack of organization of employers
• Impact capacity to structure voice on skills required
• does not prevent the possible poaching by competitors
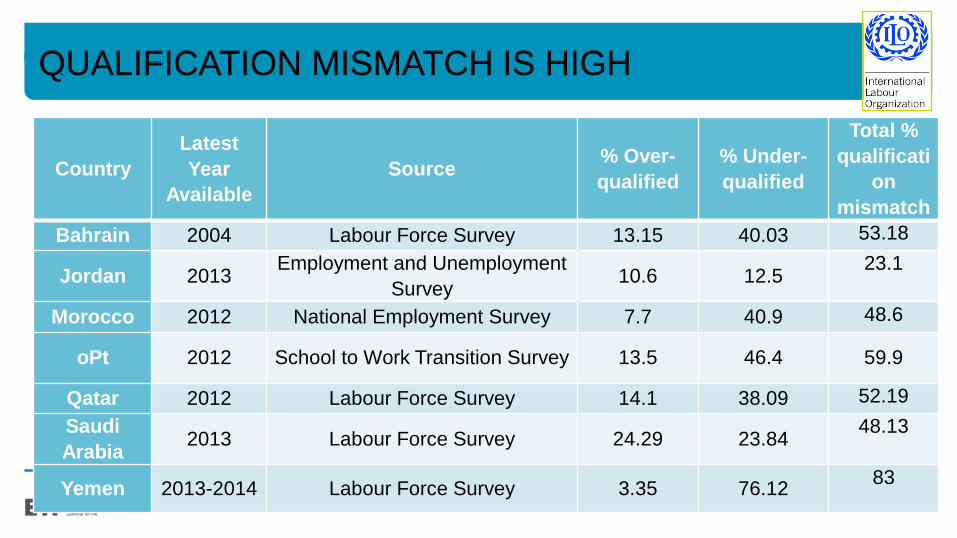
QUALIFICATION MISMATCH IS HIGH
Country
Latest
Year
Available
Source% Over-
qualified
% Under-
qualified
Total %
qualificati
on
mismatch
Bahrain 2004 Labour Force Survey 13.15 40.03 53.18
Jordan 2013Employment and Unemployment
Survey10.6 12.5
23.1
Morocco 2012 National Employment Survey 7.7 40.9 48.6
oPt 2012 School to Work Transition Survey 13.5 46.4 59.9
Qatar 2012 Labour Force Survey 14.1 38.09 52.19
Saudi
Arabia2013 Labour Force Survey 24.29 23.84
48.13
Yemen 2013-2014 Labour Force Survey 3.35 76.1283

YOUNG WORKERS PERCEPTION OF SKILLS MISMATCH
52.2%
34.2%
1.2%
12.4%
Egypt
Adequate Education and
Skills
Over qualified
Under qualified
Don't Know87.6%
8.2%4.1%
Jordan
Adequate Education and Skills
Over qualified
Under qualified
ILO: School to Work Transition Survey, 2012
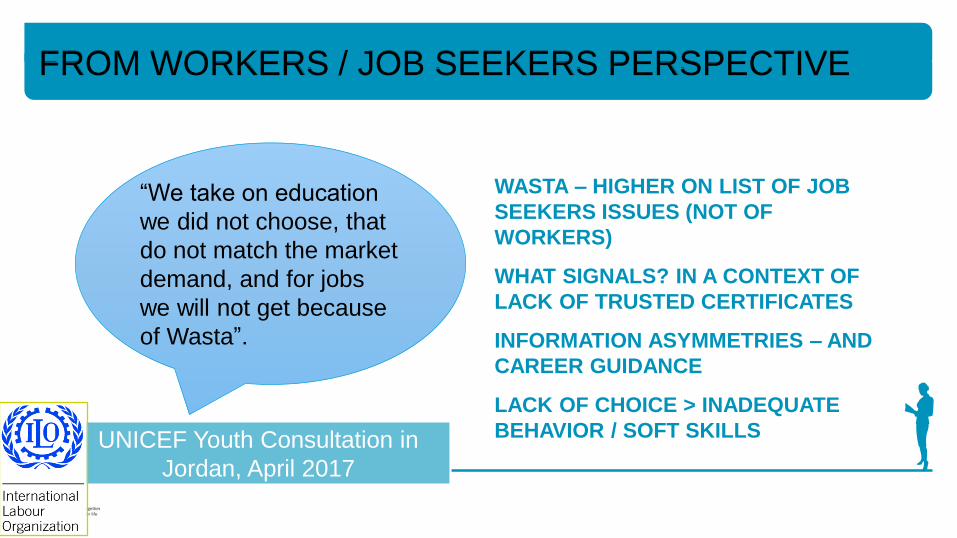
FROM WORKERS / JOB SEEKERS PERSPECTIVE
WASTA – HIGHER ON LIST OF JOB
SEEKERS ISSUES (NOT OF
WORKERS)
WHAT SIGNALS? IN A CONTEXT OF
LACK OF TRUSTED CERTIFICATES
INFORMATION ASYMMETRIES – AND
CAREER GUIDANCE
LACK OF CHOICE > INADEQUATE
BEHAVIOR / SOFT SKILLS
“We take on education
we did not choose, that
do not match the market
demand, and for jobs
we will not get because
of Wasta”.
UNICEF Youth Consultation in
Jordan, April 2017
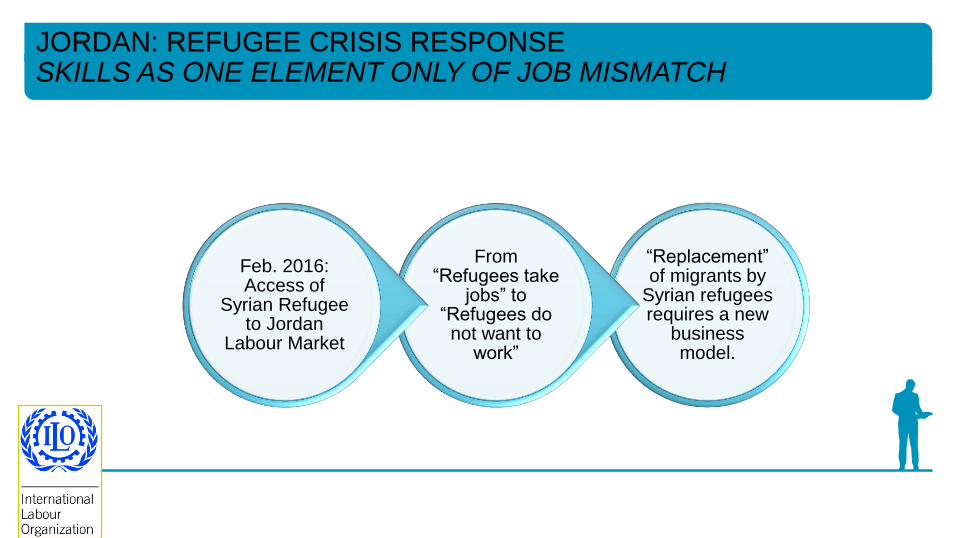
JORDAN: REFUGEE CRISIS RESPONSESKILLS AS ONE ELEMENT ONLY OF JOB MISMATCH
“Replacement” of migrants by
Syrian refugees requires a new
business model.
From “Refugees take
jobs” to “Refugees do not want to
work”
Feb. 2016: Access of
Syrian Refugee to Jordan
Labour Market
10
EASTERN EUROPE AND CENTRAL ASIA
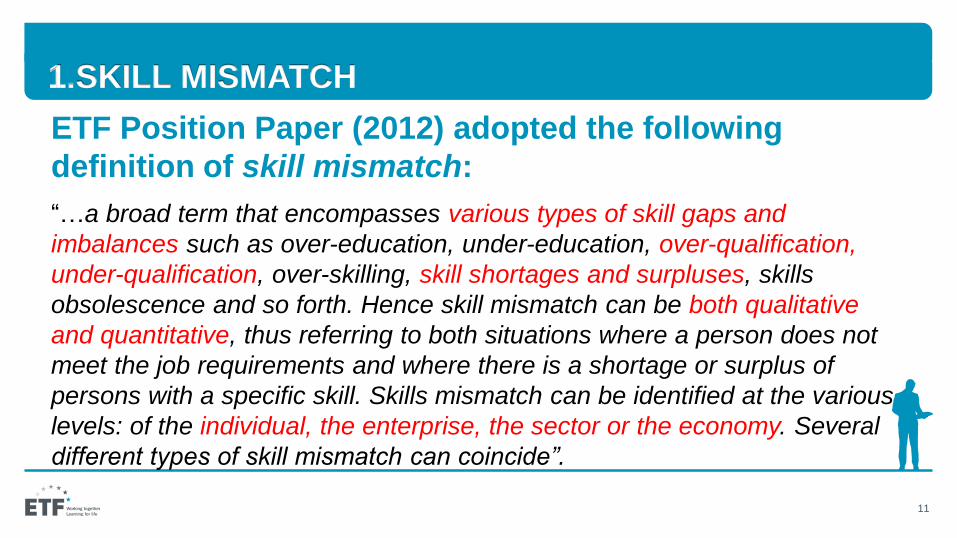
ETF Position Paper (2012) adopted the following
definition of skill mismatch:
“…a broad term that encompasses various types of skill gaps and
imbalances such as over-education, under-education, over-qualification,
under-qualification, over-skilling, skill shortages and surpluses, skills
obsolescence and so forth. Hence skill mismatch can be both qualitative
and quantitative, thus referring to both situations where a person does not
meet the job requirements and where there is a shortage or surplus of
persons with a specific skill. Skills mismatch can be identified at the various
levels: of the individual, the enterprise, the sector or the economy. Several
different types of skill mismatch can coincide”.
11
1.SKILL MISMATCH

12
1.2 SKILL MISMATCH MEASUREMENT IN ETF WORK
Methodology Measures what Strengths/Weaknesse
s
Explored in…
Variance relative rates
(ER, UR)
Dispersion skills.
Magnitude.
Macro. Data avail. MOLD, KAZ, KYR,
Coefficient of variation Dispersion skills.
Magnitude
Macro. Data avail.
Proportion of
unemployed vs employed
Direction mismatch:
which educ levels in
shortage / excess
Macro. Data avail GEORGIA.
MOLD, KAZ, KYR,
Mismatch by occupation Ratio employed
occup/educ: over-,
under-qualificatio
Unemployed pop – not
considered. Data avail
MOLD
Other measures used in ETF analysis: Beveridge curve, relative
wages by educational levels
13
EASTERN EUROPE
ARMENIAAZERBAIJAN
BELARUSGEORGIAMOLDOVAUKRAINE
SOME FIGURES INCLUDE RUSSIAN FEDERATION
14
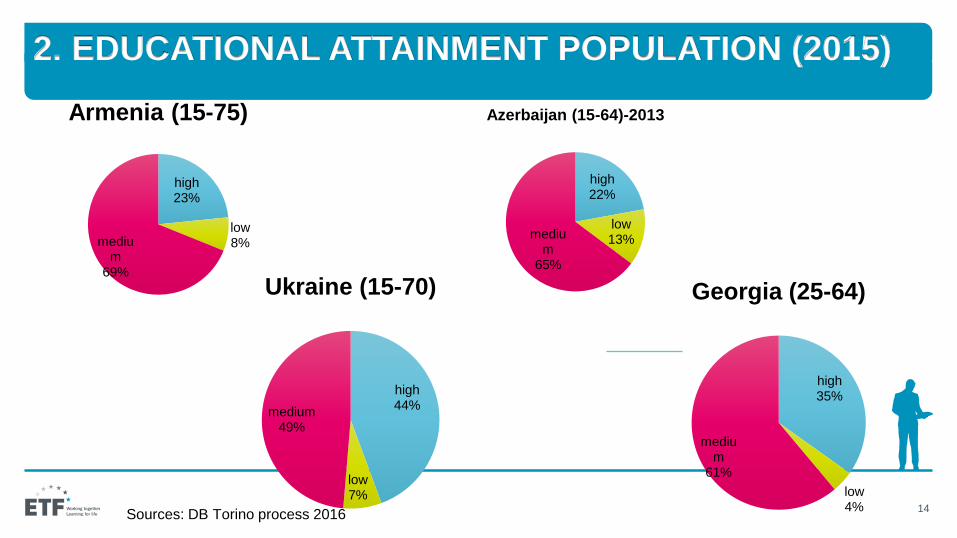
2. EDUCATIONAL ATTAINMENT POPULATION (2015)
high23%
low8%mediu
m69%
Armenia (15-75)
high22%
low13%mediu
m65%
Azerbaijan (15-64)-2013
high44%
low7%
medium49%
Ukraine (15-70)
high35%
low4%
medium
61%
Georgia (25-64)
Sources: DB Torino process 2016

15
EE: YOUTH UNEMPLOYMENT RATE AND PARTICIPATION IN VET (UPPER-SECONDARY LEVEL)
AM
AZ
GE
MD
RU
UA
1020
3040
You
th u
nem
ploy
me
nt r
ate
(%
)
10 20 30 40 50% of VET students in upper secondary education
0
10
20
30
40
50
60
Armenia Azerbaijan Georgia Republic ofMoldova
RussianFederation
Ukraine
Youth unemployment rate (15-24) and % VET students in upper sec education - 2014
VET stud % upper sec Youth UR (15-24)
16
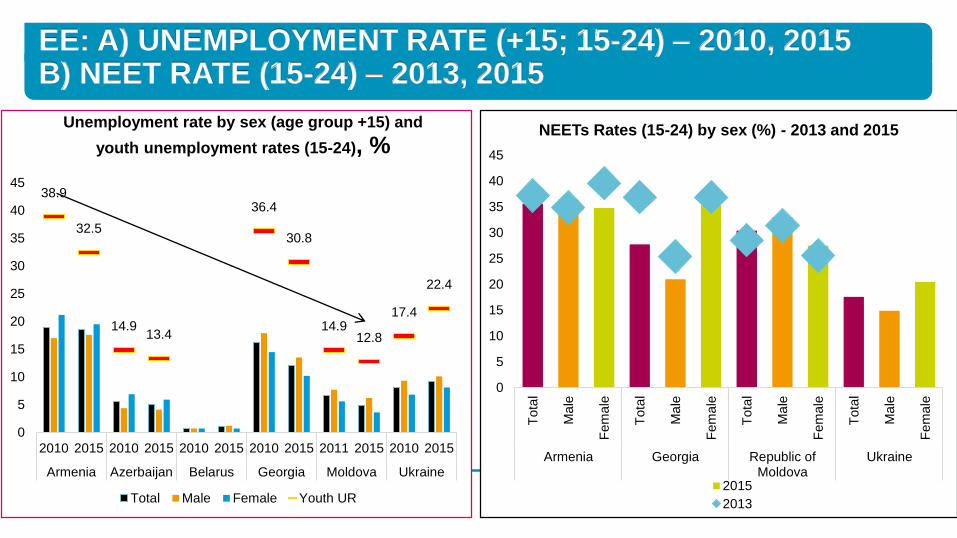
EE: A) UNEMPLOYMENT RATE (+15; 15-24) – 2010, 2015 B) NEET RATE (15-24) – 2013, 2015
38.9
32.5
14.913.4
36.4
30.8
14.912.8
17.4
22.4
0
5
10
15
20
25
30
35
40
45
2010 2015 2010 2015 2010 2015 2010 2015 2011 2015 2010 2015
Armenia Azerbaijan Belarus Georgia Moldova Ukraine
Unemployment rate by sex (age group +15) and
youth unemployment rates (15-24), %
Total Male Female Youth UR
0
5
10
15
20
25
30
35
40
45
Tota
l
Ma
le
Fem
ale
Tota
l
Ma
le
Fem
ale
Tota
l
Ma
le
Fem
ale
Tota
l
Ma
le
Fem
ale
Armenia Georgia Republic ofMoldova
Ukraine
NEETs Rates (15-24) by sex (%) - 2013 and 2015
2015
2013
17
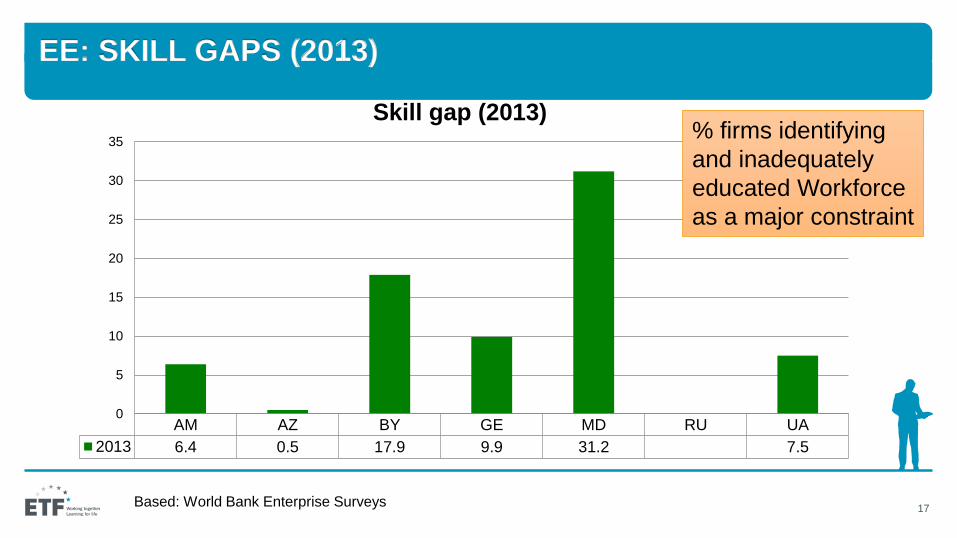
EE: SKILL GAPS (2013)
AM AZ BY GE MD RU UA
2013 6.4 0.5 17.9 9.9 31.2 7.5
0
5
10
15
20
25
30
35
Skill gap (2013)
Based: World Bank Enterprise Surveys
% firms identifying
and inadequately
educated Workforce
as a major constraint
18
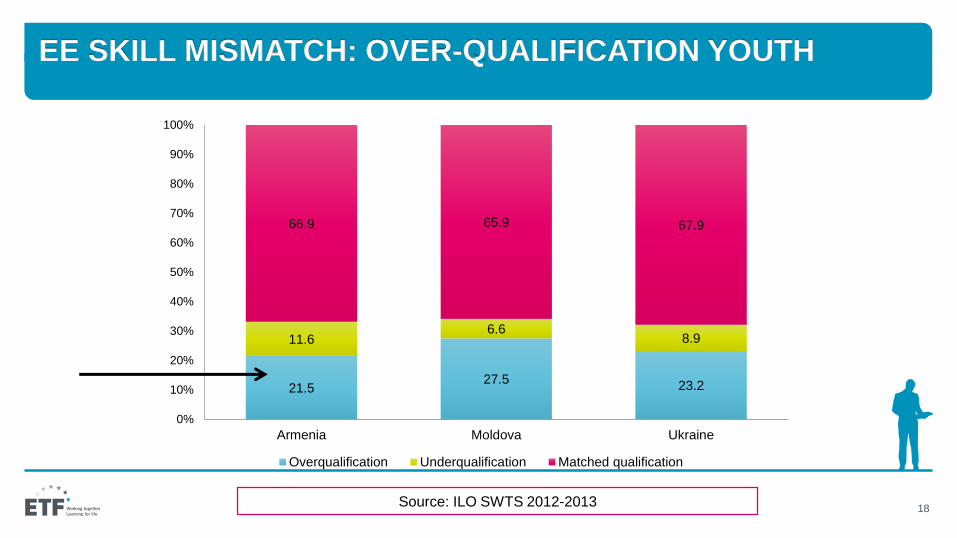
EE SKILL MISMATCH: OVER-QUALIFICATION YOUTH
Source: ILO SWTS 2012-2013
21.527.5
23.2
11.66.6
8.9
66.9 65.9 67.9
0%
10%
20%
30%
40%
50%
60%
70%
80%
90%
100%
Armenia Moldova Ukraine
Overqualification Underqualification Matched qualification
19
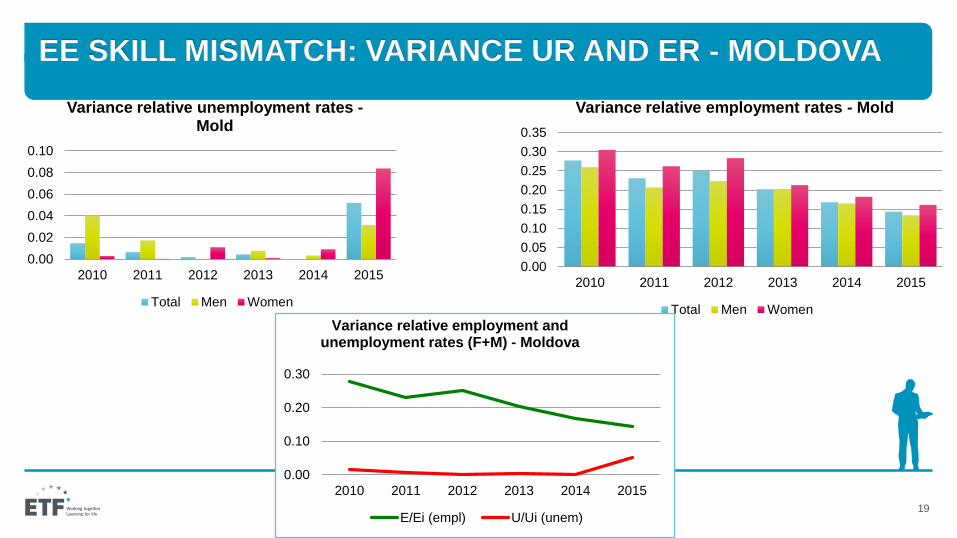
EE SKILL MISMATCH: VARIANCE UR AND ER - MOLDOVA
0.00
0.05
0.10
0.15
0.20
0.25
0.30
0.35
2010 2011 2012 2013 2014 2015
Variance relative employment rates - Mold
Total Men Women
0.00
0.02
0.04
0.06
0.08
0.10
2010 2011 2012 2013 2014 2015
Variance relative unemployment rates -Mold
Total Men Women
0.00
0.10
0.20
0.30
2010 2011 2012 2013 2014 2015
Variance relative employment and unemployment rates (F+M) - Moldova
E/Ei (empl) U/Ui (unem)

20
MOLDOVA: PROPORTION OF UNEMPLOYED VSEMPLOYED BY EDUCATIONAL LEVEL
0.00
0.20
0.40
0.60
0.80
1.00
1.20
1.40
1.60
2010 2011 2012 2013 2014 2015
Proportional mismatch - Moldova
Low Medium High
Levels education - LOW: ISCED 0-2; MED: ISCED 3-4; HIGH: ISCED 5-8
Excess supply of low
skilled labour
Persisting shortage
highly educated but
matched in last 2
years
Medium level
qualifications (VET):
matched; trend
towards shortage
21
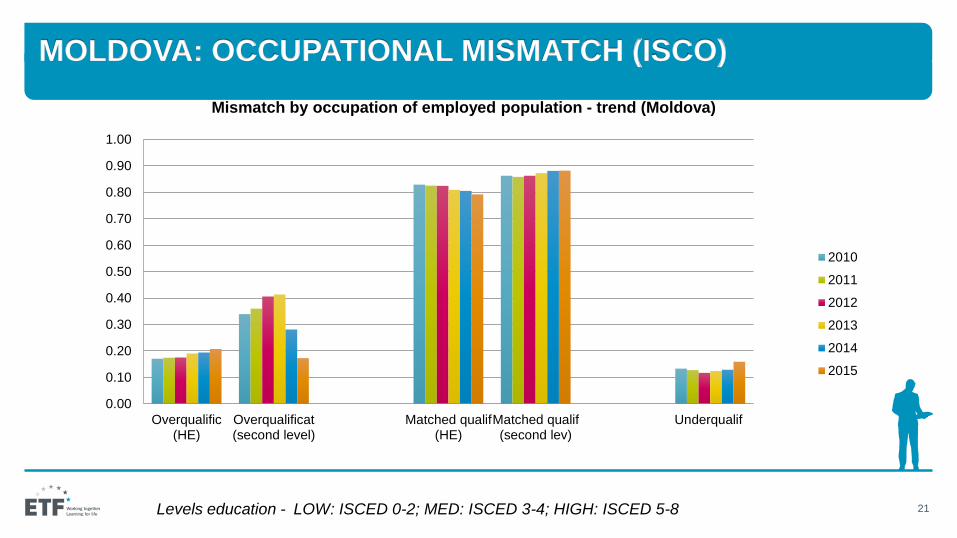
MOLDOVA: OCCUPATIONAL MISMATCH (ISCO)
0.00
0.10
0.20
0.30
0.40
0.50
0.60
0.70
0.80
0.90
1.00
Overqualific(HE)
Overqualificat(second level)
Matched qualif(HE)
Matched qualif(second lev)
Underqualif
Mismatch by occupation of employed population - trend (Moldova)
2010
2011
2012
2013
2014
2015
Levels education - LOW: ISCED 0-2; MED: ISCED 3-4; HIGH: ISCED 5-8

22
GEORGIA: PROPORTION OF UNEMPLOYED VSEMPLOYED BY EDUCATIONAL LEVEL
0
0.2
0.4
0.6
0.8
1
1.2
1.4
1.6
1.8
2009 2010 2011 2012 2013 2014 2015
Proportional mismatch (Women) - Georgia
Primary & less Basic Medium High
0
0.2
0.4
0.6
0.8
1
1.2
1.4
2009 2010 2011 2012 2013 2014 2015
Proportional mismatch - (Men) - Georgia
Primary & less Basic Medium High

23
CENTRAL ASIA
KAZAKHSTANKYRGYZSTAN
TAJIKISTANTURKMENISTAN
UZBEKISTAN
Sources: World Bank
24
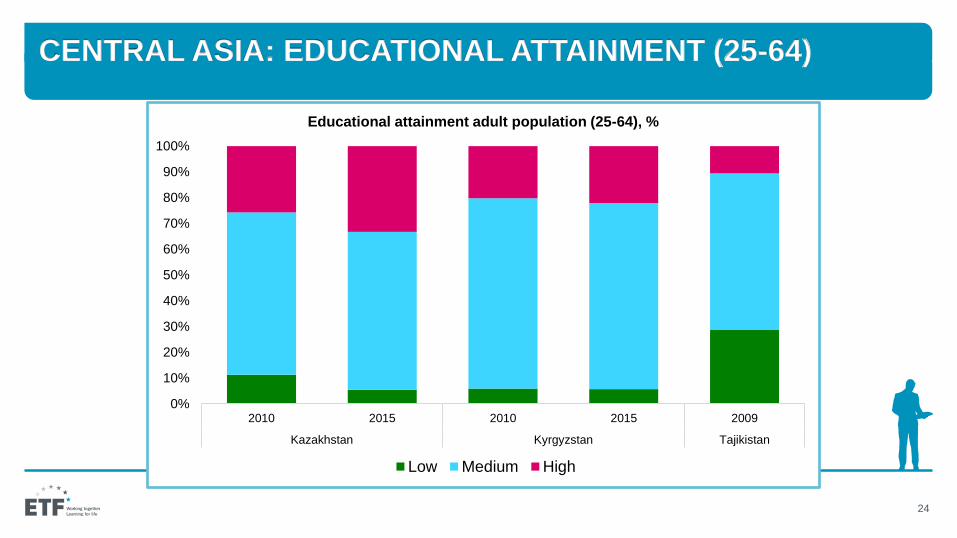
CENTRAL ASIA: EDUCATIONAL ATTAINMENT (25-64)
0%
10%
20%
30%
40%
50%
60%
70%
80%
90%
100%
2010 2015 2010 2015 2009
Kazakhstan Kyrgyzstan Tajikistan
Educational attainment adult population (25-64), %
Low Medium High
25
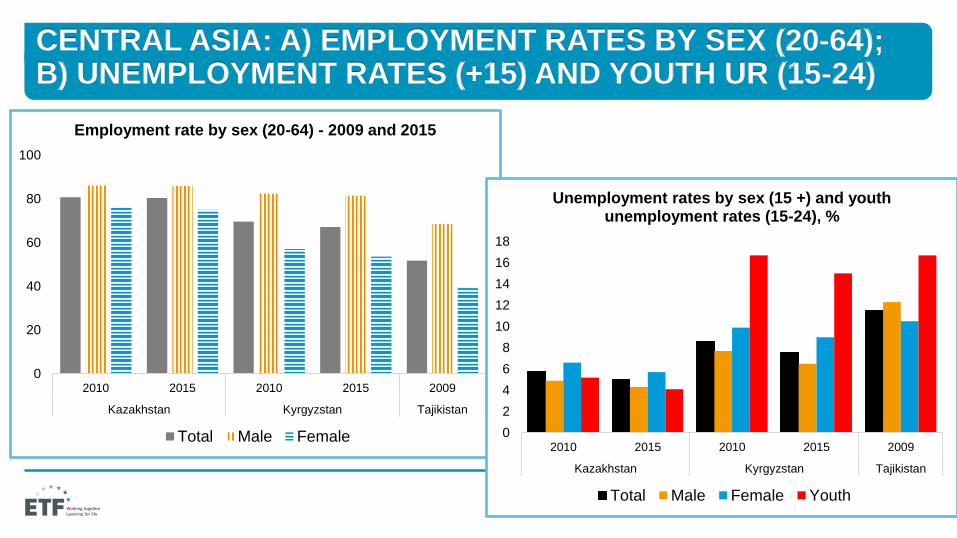
CENTRAL ASIA: A) EMPLOYMENT RATES BY SEX (20-64); B) UNEMPLOYMENT RATES (+15) AND YOUTH UR (15-24)
0
20
40
60
80
100
2010 2015 2010 2015 2009
Kazakhstan Kyrgyzstan Tajikistan
Employment rate by sex (20-64) - 2009 and 2015
Total Male Female 0
2
4
6
8
10
12
14
16
18
2010 2015 2010 2015 2009
Kazakhstan Kyrgyzstan Tajikistan
Unemployment rates by sex (15 +) and youth unemployment rates (15-24), %
Total Male Female Youth

26
CENTRAL ASIA: VET STUDENTS AS % UPPER-SECONDARY BY SEX
0.0
10.0
20.0
30.0
40.0
50.0
60.0
70.0
80.0
90.0
100.0
Kazakhstan Kyrgyzstan Tajikistan Uzbekistan
Students in VET as % upper sec students by sex - 2010, 2015
2010 2015
27
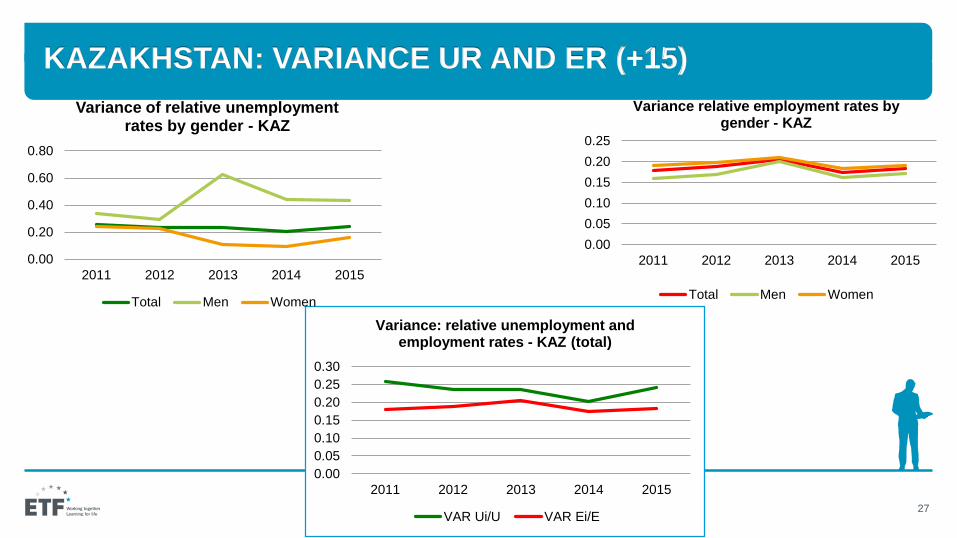
KAZAKHSTAN: VARIANCE UR AND ER (+15)
0.00
0.05
0.10
0.15
0.20
0.25
0.30
2011 2012 2013 2014 2015
Variance: relative unemployment and employment rates - KAZ (total)
VAR Ui/U VAR Ei/E
0.00
0.20
0.40
0.60
0.80
2011 2012 2013 2014 2015
Variance of relative unemployment rates by gender - KAZ
Total Men Women
0.00
0.05
0.10
0.15
0.20
0.25
2011 2012 2013 2014 2015
Variance relative employment rates by gender - KAZ
Total Men Women
28
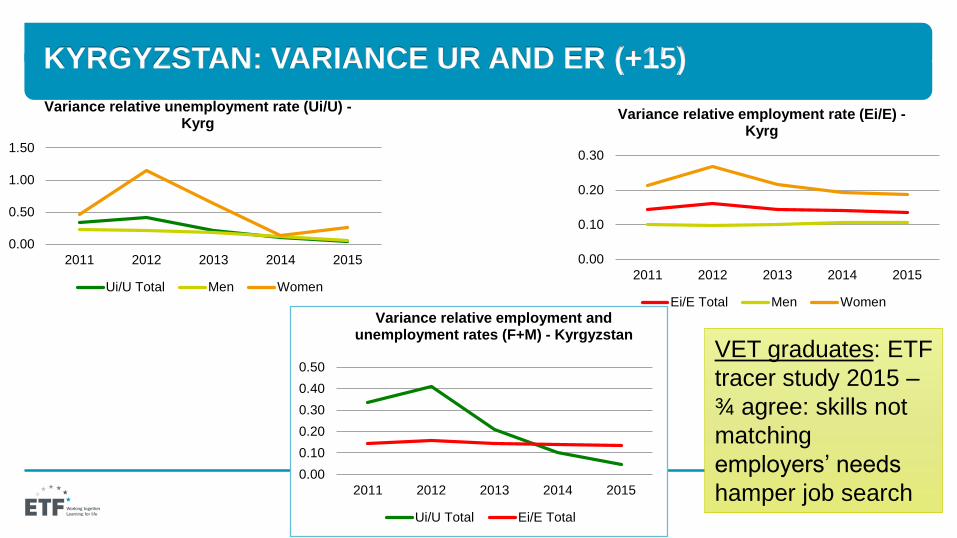
KYRGYZSTAN: VARIANCE UR AND ER (+15)
0.00
0.10
0.20
0.30
0.40
0.50
2011 2012 2013 2014 2015
Variance relative employment and unemployment rates (F+M) - Kyrgyzstan
Ui/U Total Ei/E Total
0.00
0.50
1.00
1.50
2011 2012 2013 2014 2015
Variance relative unemployment rate (Ui/U) -Kyrg
Ui/U Total Men Women
0.00
0.10
0.20
0.30
2011 2012 2013 2014 2015
Variance relative employment rate (Ei/E) -Kyrg
Ei/E Total Men Women
VET graduates: ETF
tracer study 2015 –
¾ agree: skills not
matching
employers’ needs
hamper job search

29
KAZAKHSTAN: PROPORTION OF UNEMPLOYED VSEMPLOYED BY EDUCATIONAL LEVEL
0.00
0.50
1.00
1.50
2.00
2.50
3.00
2011 2012 2013 2014 2015
Proportional mismatch KAZ (total - F+M)
Primary and less Basic Secondary general Initial VET Secondary VET Incomplete higher Higher
30
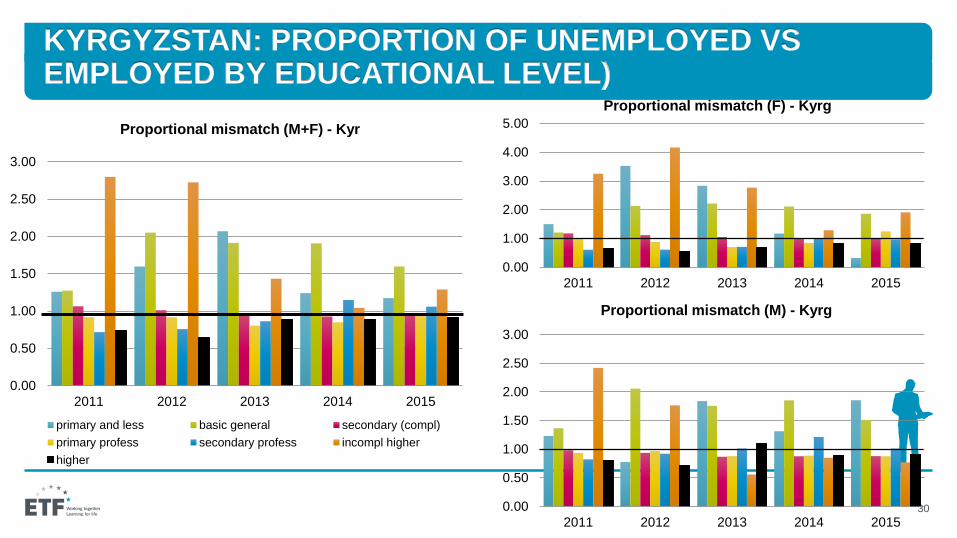
KYRGYZSTAN: PROPORTION OF UNEMPLOYED VSEMPLOYED BY EDUCATIONAL LEVEL)
0.00
0.50
1.00
1.50
2.00
2.50
3.00
2011 2012 2013 2014 2015
Proportional mismatch (M+F) - Kyr
primary and less basic general secondary (compl)
primary profess secondary profess incompl higher
higher
0.00
0.50
1.00
1.50
2.00
2.50
3.00
2011 2012 2013 2014 2015
Proportional mismatch (M) - Kyrg
0.00
1.00
2.00
3.00
4.00
5.00
2011 2012 2013 2014 2015
Proportional mismatch (F) - Kyrg
31
CONCLUSIONS
Concepts and methodologies for skill mismatch measurement: need for
shared views
Better use of available data (in particular: statistical; special surveys; more
qualitative information) to analyse/ measure skill mismatch. Data
inconsistencies to be addressed (e.g.: education)
A simple indicator-based approach to quantifying on-the-job skills mismatch
across countries is likely to be unreliable. Combined analysis results different
methodologies – complementarity angles.
Instead, more careful country-specific analysis is needed to verify the extent
of "genuine" skills mismatch and its drivers to devise adequate policies.
Difficult solely on the basis of employer survey data, to gauge the extent of
genuine skills shortages

THANK YOU


