i The Importance of Innate Resistance Genes in Respiratory Syncytial Virus Replication in Airway Epithelial Cells Thesis submitted in accordance with the requirements of the University of Liverpool for the degree of Master of Philosophy (MPhil) by Louise J Apperley August 2012
Transcript
i
The Importance of Innate
Resistance Genes in
Respiratory Syncytial Virus
Replication in Airway Epithelial
Cells
Thesis submitted in accordance with the requirements of the
University of Liverpool for the degree of Master of Philosophy
(MPhil) by
Louise J Apperley
August 2012
ii
Acknowledgments
Throughout the entirety of my MPhil project, there have been a number of
individuals that provided me with continuous support and encouragement that I
would like to express thanks. I would firstly like to acknowledge the support
from my primary project supervisor Paul McNamara who has helped guide and
review my project over the course of the past year. I am also extremely grateful
for the support and assistance that Brian Flanagan has given me, particularly
with helping me understand my results and findings. I appreciate the time and
patience that both supervisors have given towards my project and am very
thankful for the potential future prospects that they have both provided me
with.
A special thanks goes to Professor R Tripp (University of Georgia, Atlanta) for
providing me with a platform to undertake my study. Without his identification
of selected genes, this study would not be possible. I also greatly appreciate
the protocol and reagents that he has provided for the initial stages of this
project.
A particular thanks also goes to David Fawkner-Corbett for assisting me with
any questions I had regarding the write-up of my project.
I would also like to acknowledge the help given to me by Deborah Howarth
and Caroline Broughton who have mentored and supported my laboratory
work during my time in the Duncan and Apex buildings. Having undertaken this
project with no previous laboratory experience, their patience and assistance
has been invaluable to the success of this project. I also appreciate the help
given to me by Angela Fonceca, who has supported me with my laboratory
work throughout my time at Alder Hey Hospital.
I would finally like to thank the laboratory teams at the Duncan and Apex
buildings as well as the institute staff at Alder Hey Hospital. They made my
time in the laboratories extremely enjoyable and assisted me with the many
queries that I had.
iii
Abstract
Introduction: Respiratory Syncytial Virus (RSV) is a leading cause of lower respiratory symptoms in infants, the elderly and the immunosuppressed worldwide. Approximately 70% of children become infected with RSV during their first year of life, and by the age of three almost all children will have been exposed to the virus. Approximately 2-3% of RSV infected infants require hospital admission. The aims of my MPhil project were as follows:
To determine whether I could ‘knockdown’ using siRNA, the expression of 26 innate resistance genes in airway epithelial cells, previously known to limit influenza..
To determine which genes provide protection against both influenza and RSV, by infecting ‘knockdown’ cultured epithelial cells with RSV, and measuring viral replication and RSV N gene expression.
To further investigate the significance of these results by focusing on three of these genes in more detail.
Methods: SiRNA was used to knockdown genes in A549 cell cultures. They were infected with RSV A2 strain two days after siRNA transfection, and a further two days later, mRNA was extracted and isolated from the cells. These samples were reverse transcribed, and RSV N gene expression analysed through real-time PCR. Further study on genes required the use of antibody staining, fluorescent-labelled RSV and confocal microscopy. Results: Initially, PCR assays were optimised and quantitative, and RSV concentration was standardised. Efficiency of siRNA reagent was proved with gene expression knocked down > 60%. Following RSV infection of these knocked down cultures, 20/26 genes were found to up-regulate RSV N gene expression after their gene expression had been reduced. Two genes (RNF168 and RFFL) caused a large increase in RSV expression after knockdown and so were investigated further as well as, UBE2G2, an associated protein, identified through an online database. Unfortunately, the impressive changes in RSV replication previously seen on knocking down RNF168 and RFFL could not be repeated, and UBE2G2 was found to have little effect on RSV replication. GPR34, which when knocked down caused morphological changes on light microscopy, was also studied further using red fluorescent-labelled RSV and antibodies. This protein was found to be located around the periphery of the cell and possibly around the nucleus, with protein knockdown causing blebbing of the cell membrane. Discussion: This work has shown that 20/26 genes previously reported to offer some protection against influenza, also provide some protection against RSV. These findings further our understanding of the pathogenesis of RSV disease, and highlight possible avenues for future therapeutic research. These might involve increasing expression of these 'innate resistance genes' in the respiratory epithelium.
iv
Abbreviations
AAP - American Academy of Paediatrics
APC - Antigen Presenting Cells
ASC – Antibody Secreting Cells
BSA - Bovine Serum Albumin
CCA - Chimpanzee Coryza Agent
CCR7 - Chemokine (C-C Motif) Receptor 7
CF - Cystic Fibrosis
CHD - Congenital Heart Disease
CLD - Chronic Lung Disease
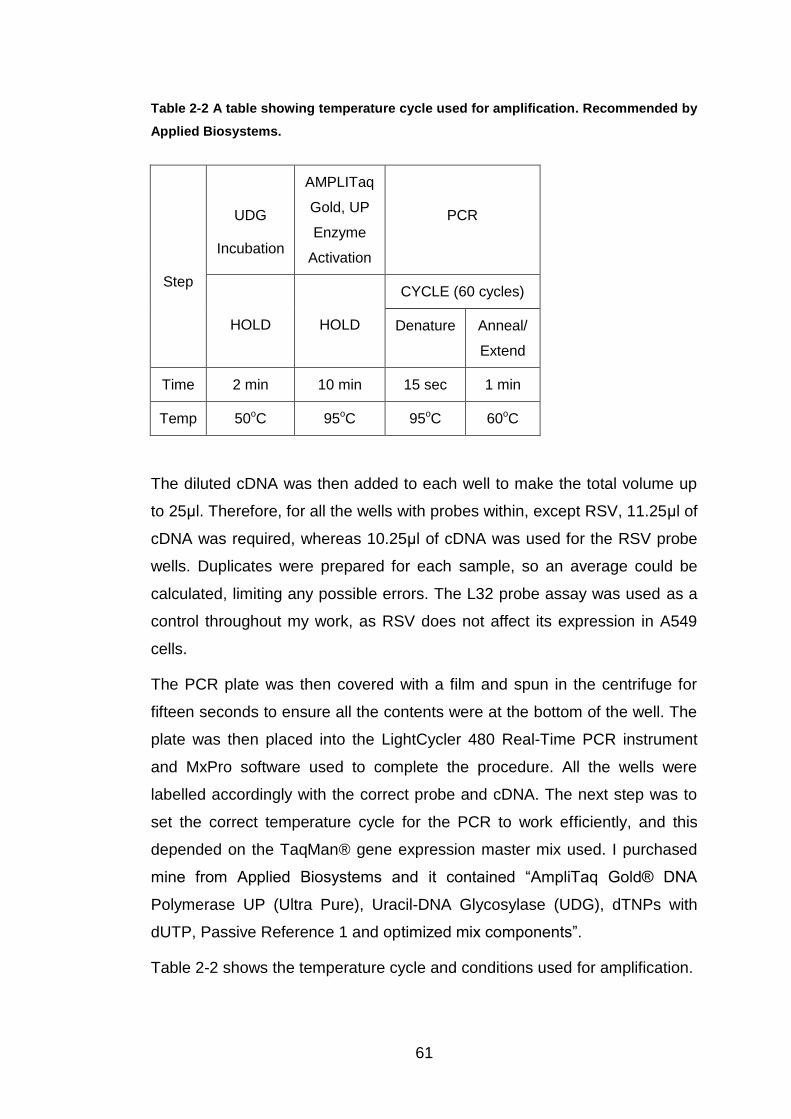
CLR - C-type Lectin Receptors
CNOT4 - CCR4-NOT Transcription Complex, Subunit4
CTL - Cytotoxic T Lymphocyte
CX3CR1 - Chemokine (C-X3-C motif) Receptor 1
CXCR1 - Chemokine (C-X-C motif) Receptor 1
DAMP - Damage-Associated molecular Patterns
DC - Dendritic Cells
DMEM - Dulbecco's Modified Eagle Medium
DNA - Deoxyribonucleic Acid
DSRNA - Double Stranded RNA
ECP - Eosinophil Cationic Protein
FCS - Foetal Calf Serum
GAG - Glycoaminogylcans
GPR34 - G Protein-Coupled Receptor 34
HPA - Health Protection Agency
v
HRH2 - Histamine Receptor H2
HRH4 - Histamine Receptor H4
IFN - Interferon
IFNAR 1 and 2 - Interferon α/β receptor 1 and 2
Ig - Immunoglobulin
IL - Interleukin
IRF - Interferon Regulatory Transcription Factor
ISG - Interferon-Stimulated Gene
JAK1 - Janus Kinase 1
LRR Leucine-Rich Repeat
LRTI - Lower Respiratory Tract Infection
MAP3K1 - Mitogen Activated Kinase Kinase Kinase 1
MARCH6 - Membrane-Associated Ring Finger (C3HC4) 6
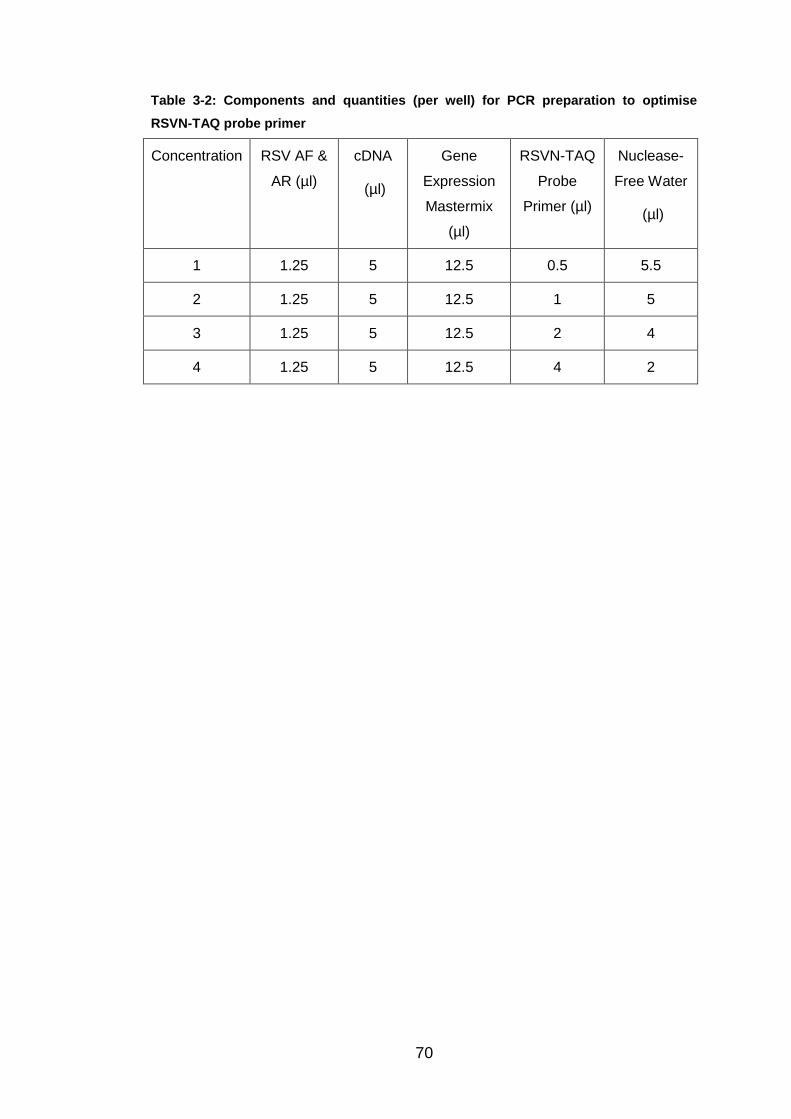
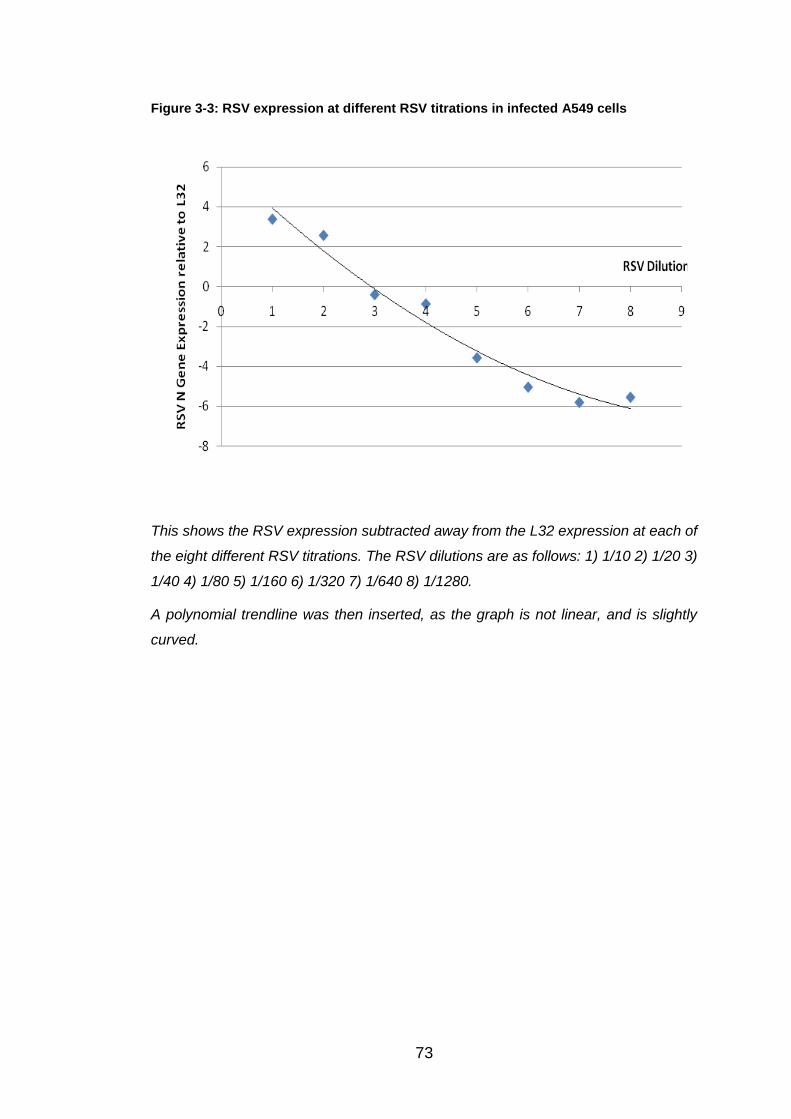
Found on chromosome 5. Serine/Threonine Kinase. Signal transduction. Activated by phosphorylation pathway and requires Mg2+ before it can phosphorylate other proteins.
Phosphatase Family
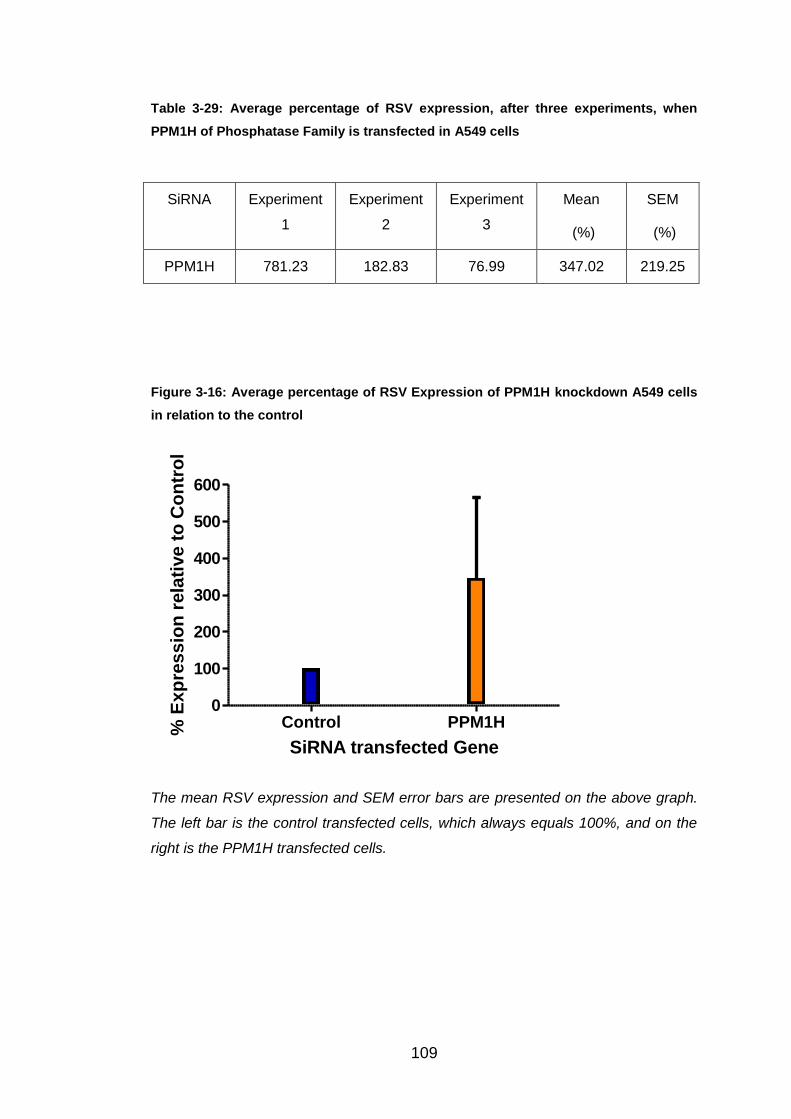
Protein Phosphatase, Mg2+/Mn2+ Dependent, 1H (PPM1H) (112)
Found on chromosome 12. Member of PP2C phosphatase family. Involved in signal transduction.
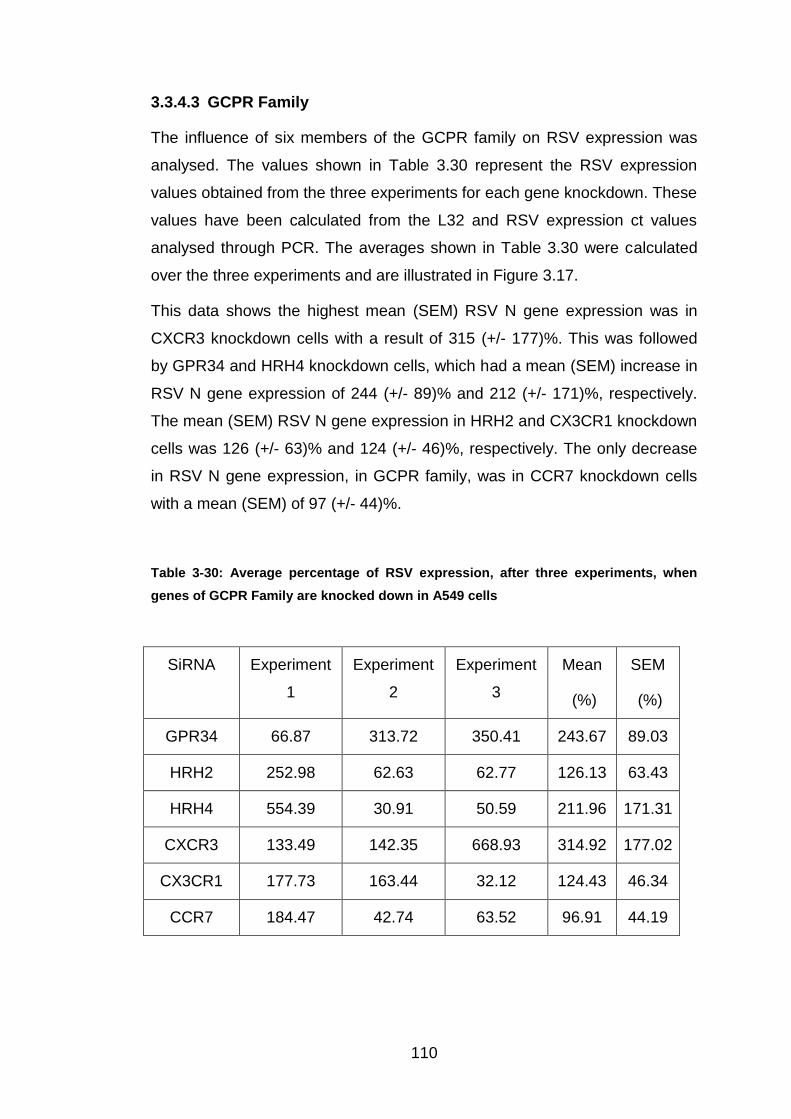
G-Protein Coupled Receptor Family
G Protein-Coupled Receptor 34 (GPR34) (112-115)
Found on X chromosome. Membrane protein. Orphan receptor in rhodopsin-like subset of GPCR family. Triggers intracellular signals through the stimulation of heterotrimeric G proteins. No interactions associated with this protein found.
Histamine Receptor H2 (HRH2) (112)
Found on chromosome 5. Maintains efficient cell growth and development.
HRH4 (112) Found on chromosome 18. Role in inflammation and allergic reactions.
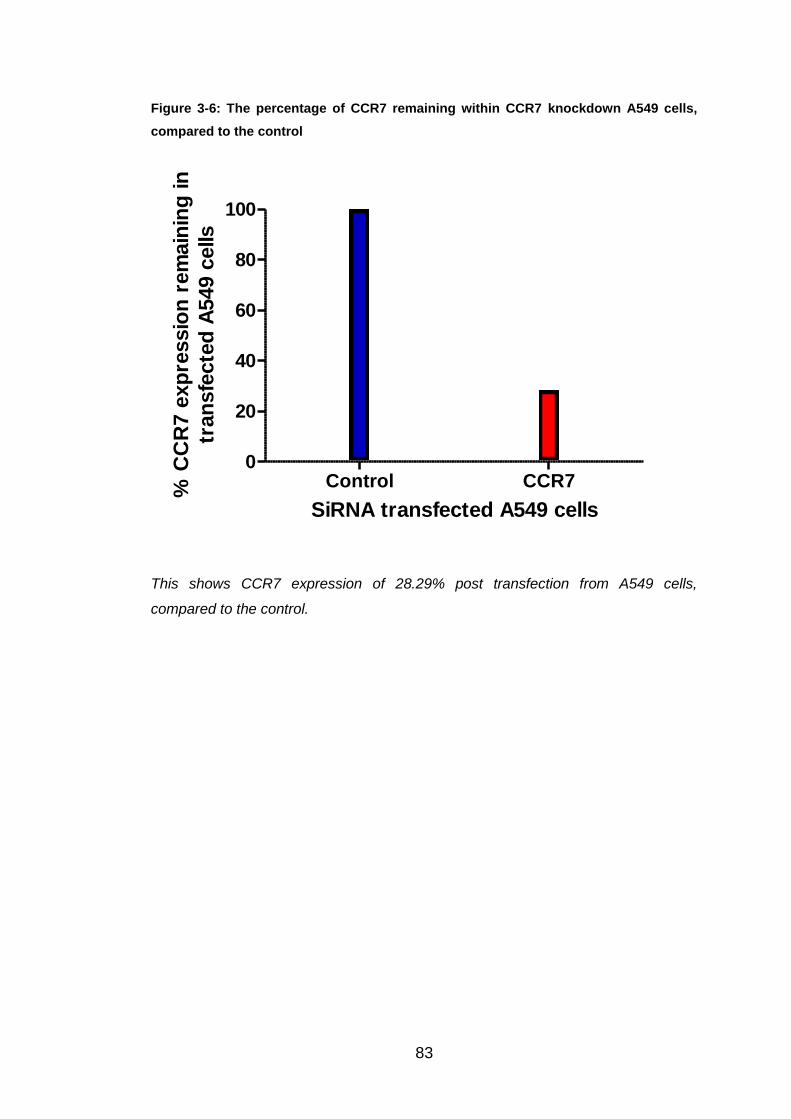
Found on chromosome 17 and located on surfaces of B cells, T cells and DCs. Activated by two ligands: CCL19 and CCL21. Role: migration of immune cells to lymph nodes and development of DCs. RSV-infected CCR7-deficient mice suffered more severe disease, with impaired migration of immune cells and reduced T cell responses.
Chemokine (C-X-C motif) Receptor 3 (CXCR3) (118)
Found on chromosome X and binds to CXCL9, CXCL10 and CXCL11. Leukocyte trafficking and T cell polarisation.
Found on chromosome 3. Unique receptor for chemokine fractalkine (CX3CL1). Ability to bind with RSV G gylcoprotein.
E3 Subset Ubiquitin Ligases
Ring Finger Protein (RNF) 149 and RNF150 (112)
Found on chromosome 2 and 4, respectively. Roles in protein and zinc binding.
RNF168 (119-121) Found on chromosome 3. DNA damage ubiquitin ligase via post-translational modifications and contributes to K63-polyubiquitin chains. Chromatin binding by inducing ubiquitinylation of histones.
42
Membrane-Associated Ring Finger (C3HC4) 6 (MARCH6) (112)
Found on chromosome 5 and confined to the endoplasmic reticulum.
Found on chromosome 7. E3 ubiquitin ligase, containing RING finger domain and 78 N terminal residues essential for interaction with E2 ligase, UBE2D1. Pairing induces protein recognition and ubiquitinylation. Positively up-regulates IFN-γ and IL-4, which stimulates JAK/STAT pathway.
Polycomb Group Finger 5 (PCGF5) (112)
Found on chromosome 10. Role in protein and zinc ion binding.
PHD Finger protein 21A (PHF21A) (112)
Found on chromosome 11 Bind to number of molecules, such as DNA, chromatin and proteins. Suggested roles in RNA transcription prevention, blood coagulation and chromatin modification.
RAD18 Homolog (112, 123, 124) Geng , Williams
Found on chromosome 3. Role in post-replication repair of damaged DNA and regulates ubiquitinylation and chromatin binding.
RUN and FYVE Domain Containing 1 (RUFY1) (112, 125)
Found on chromosome 5 and initially in endosomes. Structure: N-terminal RUN domain and C-terminal FYVE zinc finger domain, connected by two coiled-coil domains. Suggested role in endocytosis.
Topoisomerase I Binding, Arginine/Serine Rich (TOPORS) (112, 126)
Found on chromosome 9. Nuclear protein rich in arginine and serine, consisting of RING-type zinc finger domain. Role: tumour suppressor
Ring Finger and FYVE-like domain containing 1 (RFFL or Rififylin) (112, 127)
Found on chromosome 17. FYVE-like domain (N-terminal); RING finger (C-terminal). Zinc and protein binding.
TRIM 2 (112) *Details about TRIM family below*
Found on chromosome 4 within cytoplasmic filaments. Contains both B-box motifs.
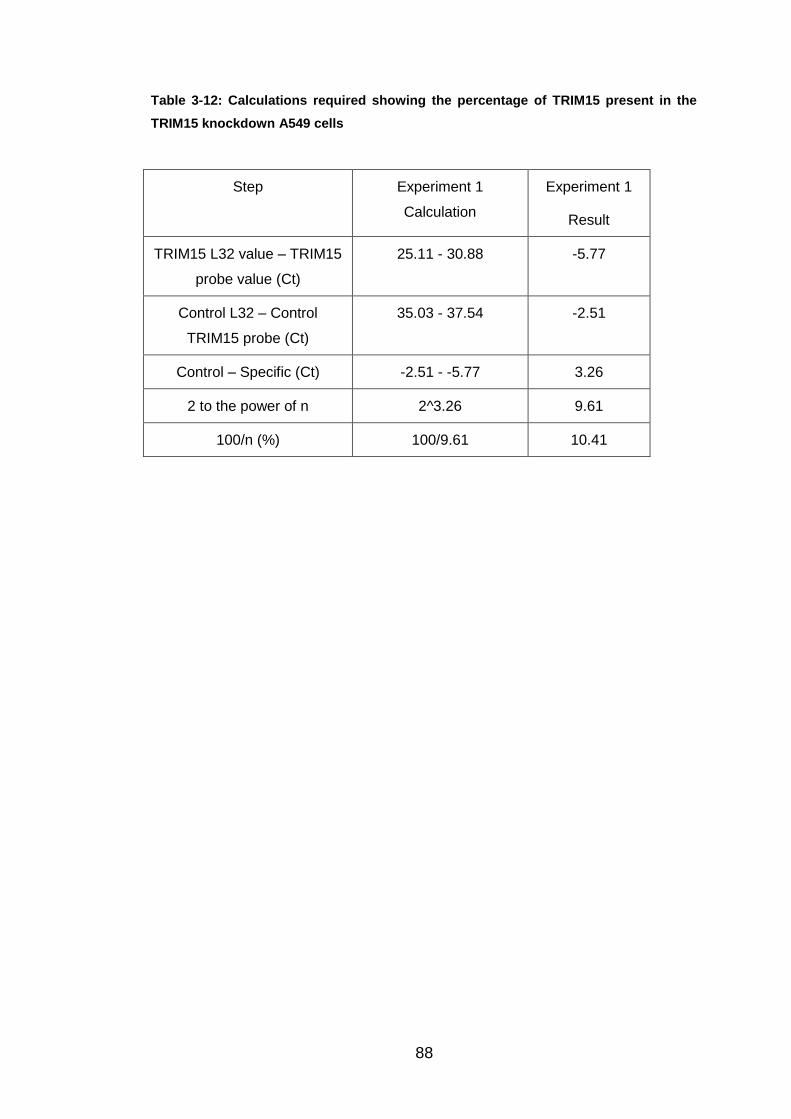
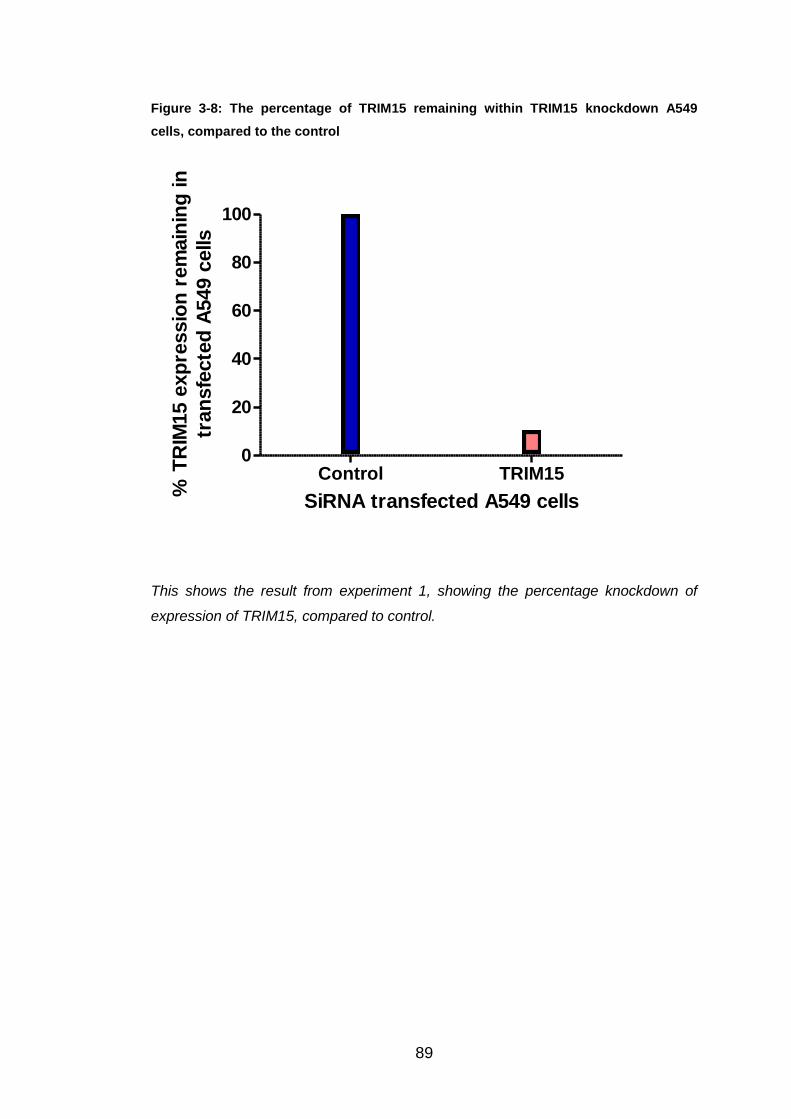
TRIM 15 (112)
Found on chromosome 6 within cellular cytoplasm. Contains both B-box motifs.
TRIM 37 (112) Found on chromosome 17 and contains one B-box motif. Function: genetic mutations and oncogenesis.
TRIM 43 (112)
Found on chromosome 2. Contains common C-terminus SPRY domain.
TRIM 73 (112) Found on chromosome 7.
43
These 26 'innate resistant genes' can be grouped into four families: Kinases
(1 gene), Phosphatase (1 gene), G Protein Coupled receptors (6 genes) and
Ubiquitin E3 Ligases (18 genes). These families are described below, along
with a few of the genes where more published information is available.
1.4.1 Kinase Family
The kinase cascade signals in response to extracellular stimuli and
compromises mitogen activated protein (MAP) kinase (MAPK), MAP kinase
kinase (MAP2K) and MAP kinase kinase kinase (MAP3K). The activated
cascade is involved in a number of cellular activities, such as cell growth,
migration, proliferation, differentiation, apoptosis and signal transduction, and
is regulated through a phosphorylation pathway from MAP3K to MAP2K to
MAPK. In total there are 13 members of the MAPK family, with the first being
discovered in the 1980s (128-131).
The only kinase identified by Prof Tripp was MAP3K1. This serine/ threonine
kinase is located on chromosome 5 and is important in the signal
transduction cascade that involves ERK and JNK pathways. It is triggered by
the phosphorylation pathway, and requires Mg2+ before it can phosphorylate
any other proteins (112).
1.4.2 Phosphatase Family
Protein phosphorylation and de-phosphorylation of both the kinase and
phosphatase families is pivotal for normal cell function and signal
transduction (132). Phosphates can block the phosphorylation relay between
MAP3K and MAP2K, and thus, have the power to alter the MAPK activity
regulating cell proliferation, survival or apoptosis (131, 133).
In total there are three main Phosphatase groups: 1) the Phosphoprotein
phosphatase (PPP) superfamily (including PP1, PP2A and PP2B families); 2)
the Transcription factor II F (TFIIF) superfamily; and 3) the Protein
Similar to Figure 5.5; the top left image is red fluorescence, the top right image is
blue fluorescence, and the third image is the double coloured sample.
147
Figure 5-7: GPR34 antibody staining within a single cell
This shows an A549 cell stained with GPR34 antibody, Texas red secondary and
DAPI. The image has been produced by the confocal microscope.
148
5.4 Discussion
GPR34 is a membrane protein, which causes a response by triggering
intracellular signals through the stimulation of heterotrimeric G proteins. It
was first discovered in 1999, during a search on GenBank for original GPCR
sequences. GPR34 is located on the X chromosome, and has been
preserved for 450 million years, as it has been identified in every vertebrate
species to date. GPR34 is an orphan receptor in the rhodopsin-like subset of
the GPCR family. To date, no interactions have been found associated with
this gene (113-115).
Under light microscopy, GPR34 transfected A549 cells appeared to lose their
normal 'cobblestone' appearance and were more sparse, suggesting that
they are not able to grow at the same rate. The transfected cells were also
more irregular in shape and varied in size. Individually, the cells had
prominent dark cell membranes, with unusual black spots within the
cytoplasm. RSV infection of both transfected and non-transfected cells
resulted in a similar appearance.
Given this phenomenon, red fluorescent-labelled RSV was used to visualise
these morphological changes better and to see whether GPR34 transfection
affected where RSV was located within the infected cell. The images within
this chapter confirm that RSV infection predominantly occurs within the
cytoplasm. In GPR34 transfected cells, the red RSV fluorescence faded
towards the peripheries of the cell, compared to the well-defined membranes
and consistent red colour observed in the non-transfected cells. The
cytoplasm of the knockdown cells also had a speckled appearance, with
black spherical 'outcrops' from the membrane. These blebs may imply that
GPR34 may have a role in maintaining the internal structure of the cell or in
maintaining its membrane integrity. Blebbing is also associated with cellular
apoptosis, and we could be witnessing an accelerated or abnormal apoptotic
process occurring (170).
A GPR34 antibody was also used to investigate the location of the GPR34
protein within non-transfected cells. The red colour was denser around the
cell edges, suggesting the GPR34 was mainly found within the cell
149
membrane. On imaging a single cell, GPR34 protein was shown within the
cell membrane, but also around the nucleus. These findings require
repeating, as this series of experiments was only performed once due to
pressures of time. Given more time, a Z stack would have been performed on
the confocal microscope to determine in 3D where in the cell GPR34 was
located.
Again, given more time, validation of these results could have been done by
examining how GPR34 protein levels changed in transfected and non-
transfected cells using Western blots. Immunoprecipitation, a technique that
allows the isolation of individual proteins or complexes of attached proteins,
could also have been used to determine whether RSV proteins, such as NS1
and NS2, attach to GPR34 protein during infection.
Further work on this protein might include using techniques to increase
cellular GPR34 protein expression to see how this affects cell morphology
and the response to RSV infection. MG-132, a proteasomal inhibitor, works
by preventing protein degradation. It could be used to investigate whether
GPR34 is degraded through the proteasome or not. If this were to be the
case, then GPR34 protein expression as measured by Western Blot would
increase, allowing GPR34 over-expression to be studied. Transfection of
A549 cells with GPR34 might also allow the influence of higher GPR34
expression on RSV infection to be studied. Future MPhil students may
undertake this over the coming year.
150
6 Final Discussion
The main objective of this MPhil thesis was to determine whether 26 innate
resistant genes, previously shown by Prof. Tripp at University of Georgia to
influence Influenza replication, differentially influenced RSV replication in
airway epithelial cells.
This was done by ensuring gene expression knockdown, using siRNA from
Prof. Tripp, was successful in our hands. Gene expression was successfully
knocked down for eight randomly selected genes by at least 70%. This is
either within, or better than, the predicted range of 60-80%. Based on these
studies, the expression for each of the 26 genes given to us by Prof. Tripp
was knocked down in A549 cells, and then infected by RSV. RSV N gene
expression was measured in these cultures two days following initial
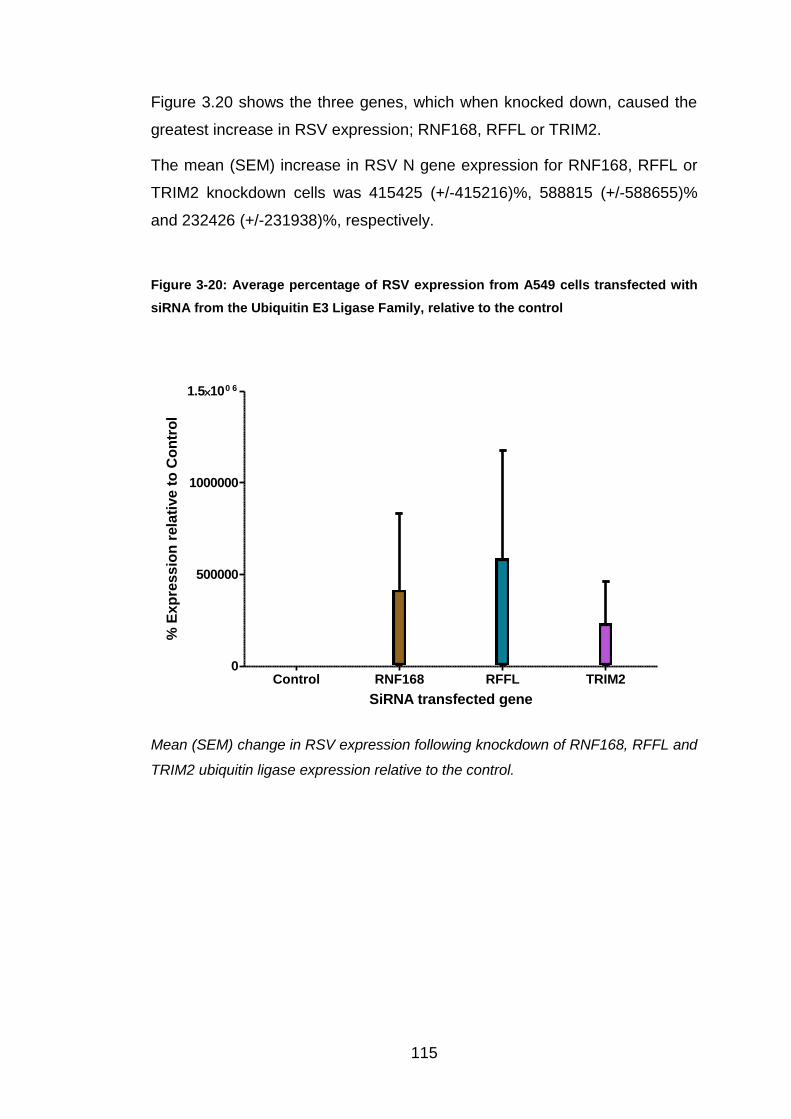
infection. Twenty of the genes were found to up-regulate RSV expression
after knockdown, suggesting that these genes were potentially protective,
whereas six genes reduced RSV activity post siRNA transfection (Figure
3.21).
RFFL and RNF168 were studied further, because knockdown of these genes
caused a many thousand-fold increase in RSV expression. Unfortunately,
when these experiments were repeated (>6 times), these findings could not
be replicated. RNF168 knockdown caused a mean (SEM) RSV N gene
expression of 180 (+/-51)% and RFFL knockdown caused RSV to be similar
to that of the non-transfected control. Using the InnateDB database, UBE2G2
was identified as a common partner for these two E3 ligases and also
TRIM43. UBE2G2 was investigated as it was thought that it might have an
important role in RSV replication by knocking down this gene in epithelial
cells and infecting the subsequent cultures with RSV. To our surprise, this
made little difference to RSV expression, indicating that it probably does not
have a significant role in protecting us against RSV infection.
GPR34 was investigated further because its knockdown caused
morphological changes to occur in epithelial cells that were observable under
the light microscope. Unknown dark membranes and spots within the GPR34
knocked down A549 cells were seen. Red fluorescent-labelled RSV was
151
used to show that blebbing occurred in the siRNA transfected A549 cells, and
a GPR34-antibody showed that this protein was primarily located within the
cell membrane.
Therefore this thesis has succeeded in all of the objectives initially described.
The results, limitations and potential future research ideas for each chapter
are as follows:
6.1 Validation of Innate Resistant Genes in RSV Replication
using SiRNA Transfection
In Chapter 3, the percentage knockdown was shown for a group of randomly
selected genes using siRNA from Prof Tripp. This analysis and calculation
would have to be performed for other genes if future work were to focus on a
particular gene whose knockdown had not been already calculated.
Furthermore, although it is a reasonable presumption that mRNA expression
is a good surrogate for protein expression, given more time, Western blot
analysis could be used to show that protein expression correlated with mRNA
expression.
Chapter 3 also details how the 26 genes that were knocked down influenced
RSV N gene expression following infection. In most of these transfected
RSV-infected cultures, there was considerable variation in RSV expression in
the three experiments undertaken, which made statistical analysis difficult.
Whilst every attempt was made to standardise the reagents and the
knockdown and infection protocol, this variation could have been due to
minor differences between bathes of reagents or virus (although aliquoted).
Minor differences in pipette use or similar technical reasons may also have
contributed. However, also plausible, could be variation in growth rate of
receptor expression, density of cells used or the cell cycle stage of these
cells at either transfection or infection stages of the protocol. Cycle stage is
believed to affect RSV replication and clearly growth rate would influence
viral replication. Similar variability in knockdown levels obtained were seen
using an analogous approach to look at susceptibility to flu virus replication
by R. Tripp (Personal Communicator) who standardised by using a larger
number of replicates.
152
How the results documented in this thesis relate to infants with RSV
bronchiolitis is a reasonable question to ask. These findings further our
understanding of the pathogenesis of RSV disease, and also highlight
avenues for future therapeutic research, which might possibly involve
increasing expression of these ‘innate resistance genes’ in the respiratory
epithelium.
6.2 Further studies of RFFL and RNF168, and identification
of UBE2G2
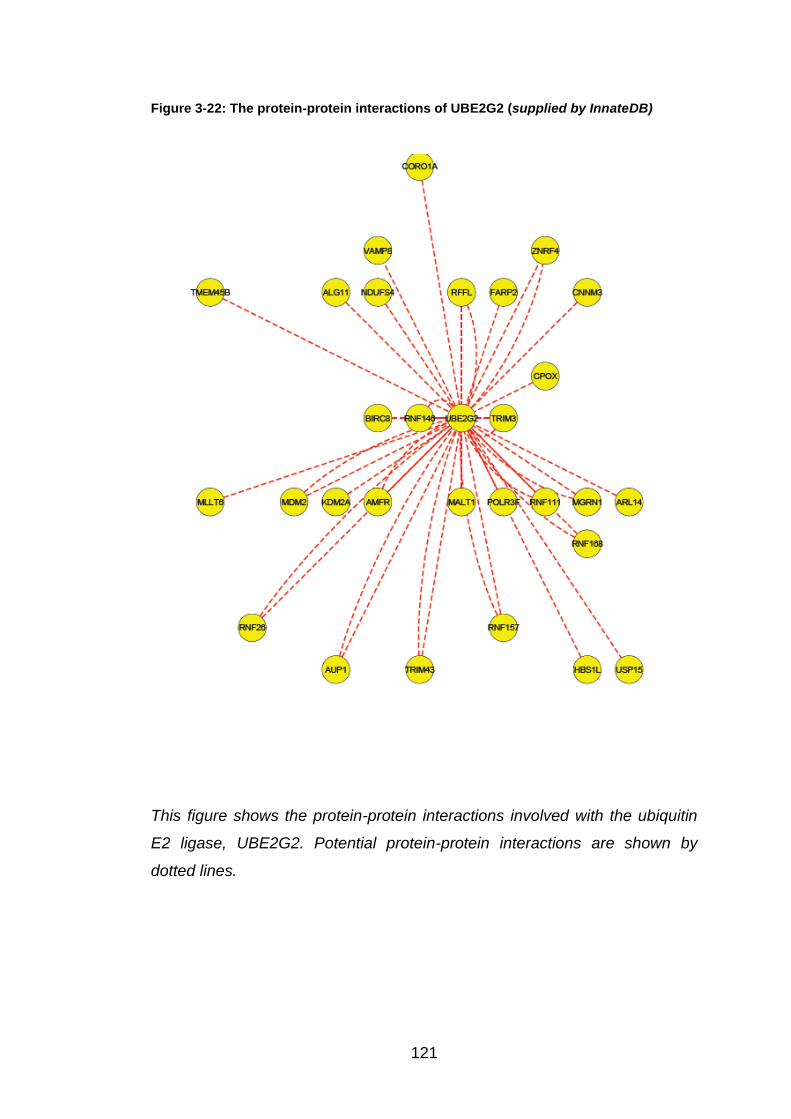
InnateDB is an online database that demonstrates interactions and pathways
between proteins important in innate immunity. This was used to investigate
possible protein-protein interactions possibly relevant to RSV infection.
UBE2G2, an E2 ligase, was identified as a common partner for RNF168,
RFFL and TRIM43 (Figure 3.22). As RNF168 and RFFL knockdown showed
a high increase in RSV N gene activity, and TRIM43 knockdown up-regulated
the RSV expression by over three times the control, it was decided to
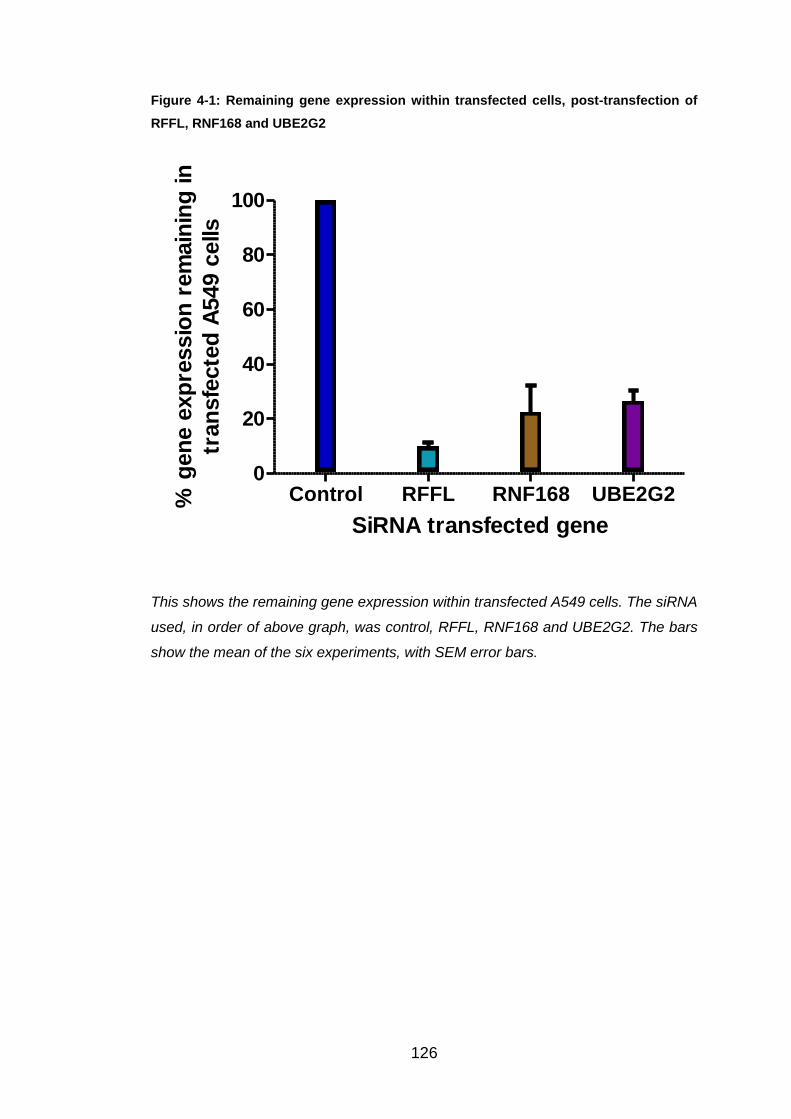
investigate UBE2G2 further. Firstly, efficient knockdown had to be proved
and over six experiments the average gene expression knockdown was
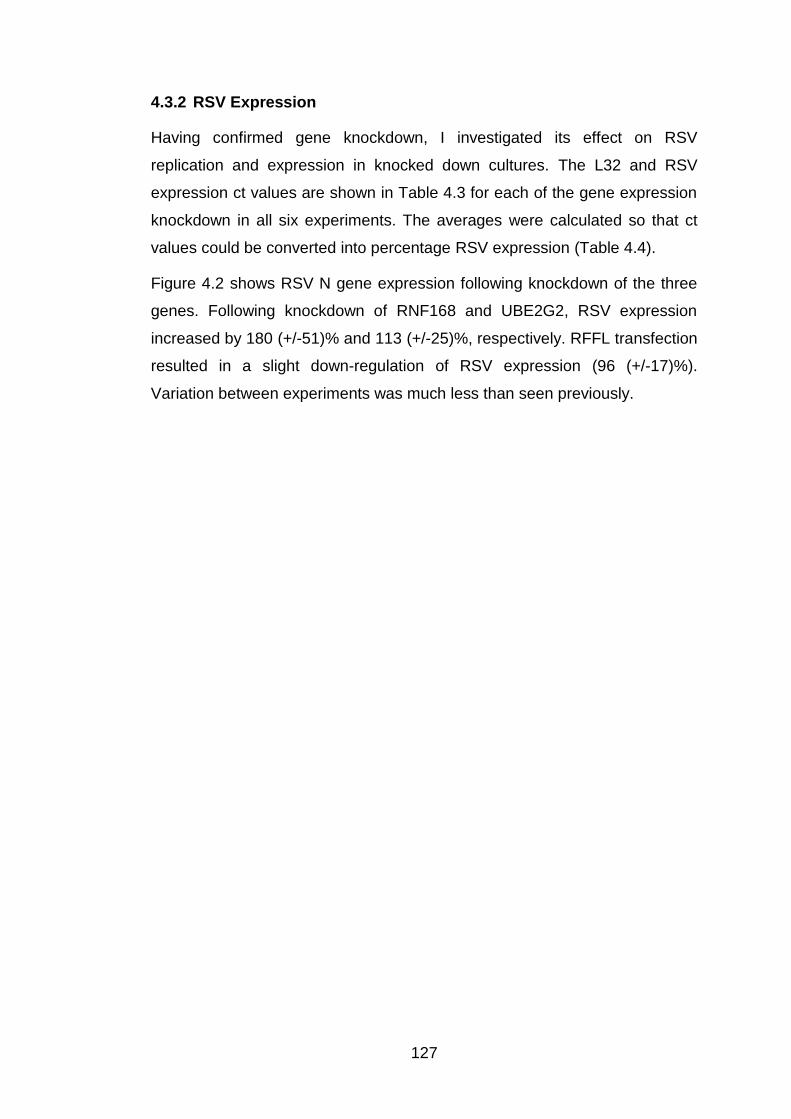
73.40%, easily within the predicted range of 60-80%. Consequently, RSV N
gene expression was analysed, over six experiments, giving an overall
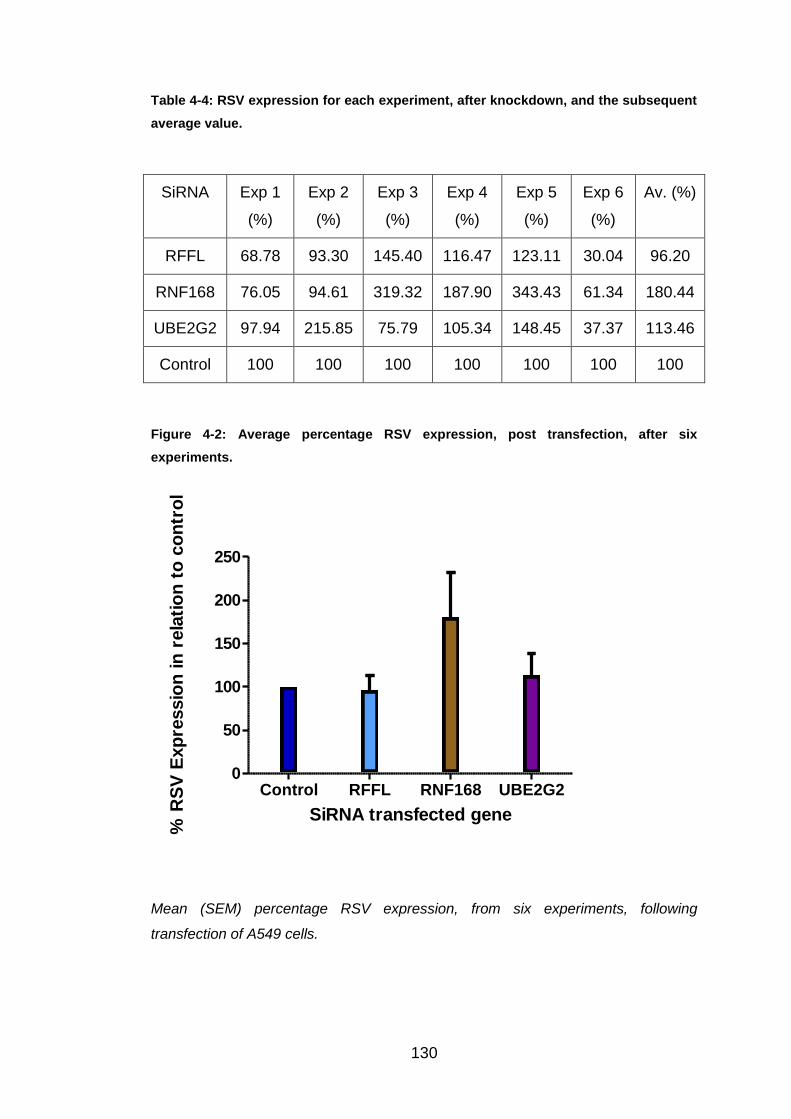
average of 113.46% (Figure 4.2). The variation of this expression was
between 37.37% and 215.85%. Therefore, these results do not support the
suggestion that UBE2G2 could have been a key component of the RSV
pathway. RFFL and RNF168 were also included in these six experiments to
try and prove the high RSV N gene expressions found in the three initial
experiments. Initially knockdown success was proved with the average
knockdown for RNF168 and RFFL being 77.45% and 90.03%, respectively.
After knockdown, neither gene could repeat the previous results. RFFL
knockdown actually caused a slight down-regulation in RSV expression with
an average value of 96.20%, with the value range between 30.04% and
145.40%. Whereas RNF168 knockdown displayed an overall up-regulation in
RSV N gene expression by nearly two fold. Even though this is not close to
the previous result, the result is encouraging and RNF168 has been
153
investigated further (See Section 6.5). Although the experimental number
was increased to n=6 replicates, variability was still observed between the
samples during analysis. As these knockdowns were carried out at the same
time they cannot be as easily explained by differences in reagent stocks or
preparations and the variability seen on different days. The reason for this
remaining variability is difficult to explain unless different number of cells had
perhaps survived transfection and exposure to Dharmafect. There is clearly a
further factor involved. This limitation could be addressed by further
increasing the number of replicated used for each siRNA or protein analysed
giving larger groups for a more robust statistical analysis and/or by employing
a robotic system to ensure standardisation of the time each sample was
exposed to each specific reagent or step during the protocol.
Throughout this MPhil project, A549 cells, an immortalised cell line, were
used to gain results. These are easy to grow, standardised and should
produce results similar to primary cells. Once data has been found though,
the use of A549 cells, bronchial brushings in RSV-infected and healthy
infants should be used to validate the findings. Samples from patients are a
valuable resource, but are not easily accessible in large sample numbers.
6.3 RSV and RNAi
Respiratory viruses have been a popular target for siRNA research, with RSV
being the first of these investigated in this area in 2001.
Reasons why respiratory viruses, especially, are targeted in this up and
coming area of study (105, 106):
1) Many viral sequences have already been identified, easing the
discovery for potential specific sequences.
2) Detailed research has occurred on respiratory viruses and their
optimal conditions for replication are well understood.
3) Unpredictable epidemics can be caused by respiratory viruses, so if
siRNA works therapeutically and the side effects are generally known,
then rapid therapeutic development could occur in emergencies.
154
4) Respiratory viruses are usually targeted by their surface proteins
which are often variable, so specific siRNAs would be much more
reliable.
A common barrier in the production of many medicines, is efficiently and
effectively delivering the agent. As mentioned above, the respiratory
epithelium is the first point of contact for RSV within its host. Inhaled delivery
of siRNA has been a success in targeting this epithelium and then taken up
by the epithelial cells after one dose. Ribavirin is an example of a successful
topically delivered antiviral against RSV (105, 106).
A number of attempts have already been made to find the particular target to
overcome RSV. An intranasal administered siRNA targeting the RSV P gene
was shown to significantly reduce RSV spread within mice models, but
unfortunately this would only defend against one specific strain. When
“knocking out” the RSV NS1 protein the virus is eradicated but mainly by the
immune system and host itself rather than the siRNA. Even though this is
looking promising, it is still unclear about how siRNA could potentially affect
the immune memory response. SiRNAs may also be tolerated by the young,
elderly and immunocompromised, which would be essential for management
against RSV (2, 108).
ALN-RSV01 is another potential siRNA which inhibits RSV N protein
expression. So far in research it has shown encouraging results throughout
murine models with significant lower RSV titres compared to the controls,
and in the 2009 publication DeVincenzo et al announced its safety in healthy
volunteers (105, 106, 171).
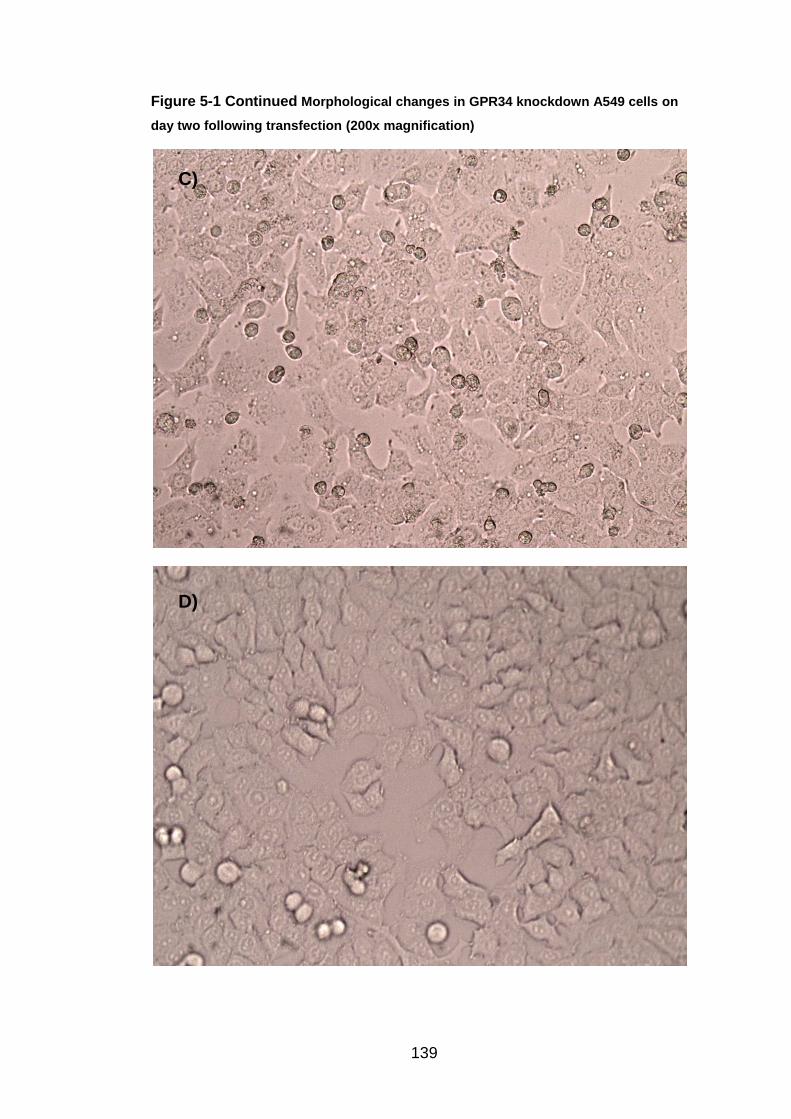
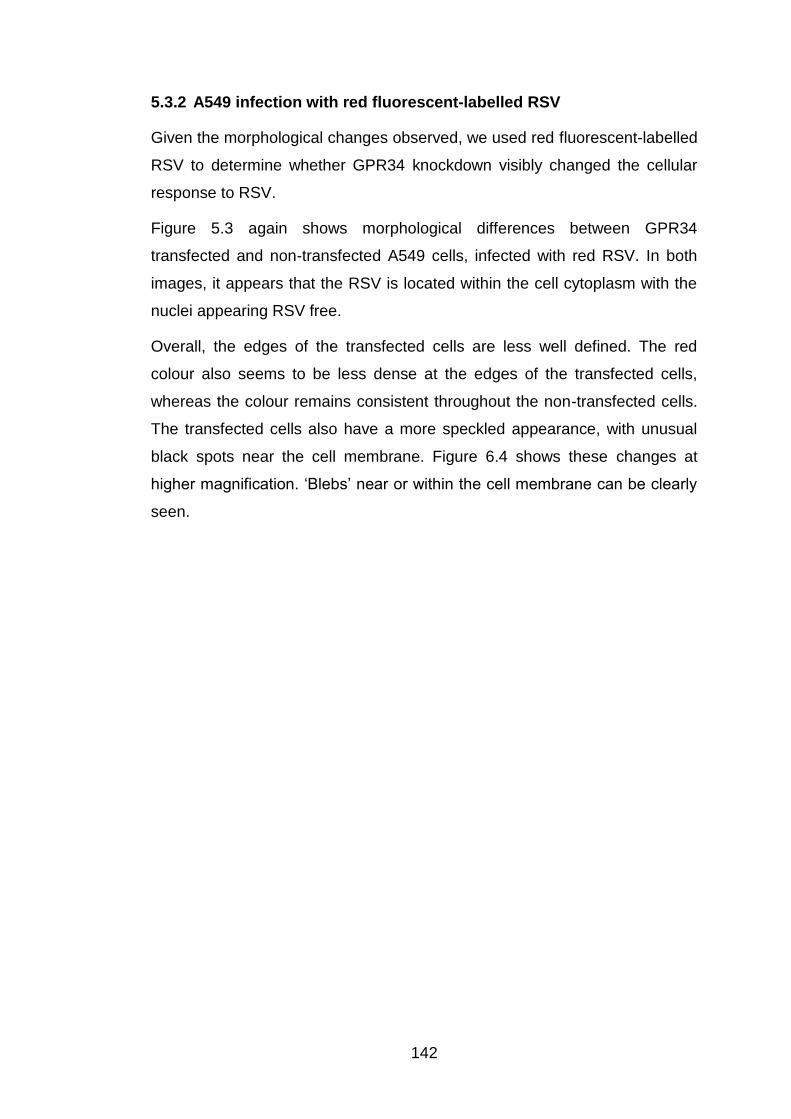
6.4 Morphological changes caused by GPR34
Each day of the siRNA transfection protocol the knockdown A549 cells were
inspected under the light microscope. The only gene resulting in
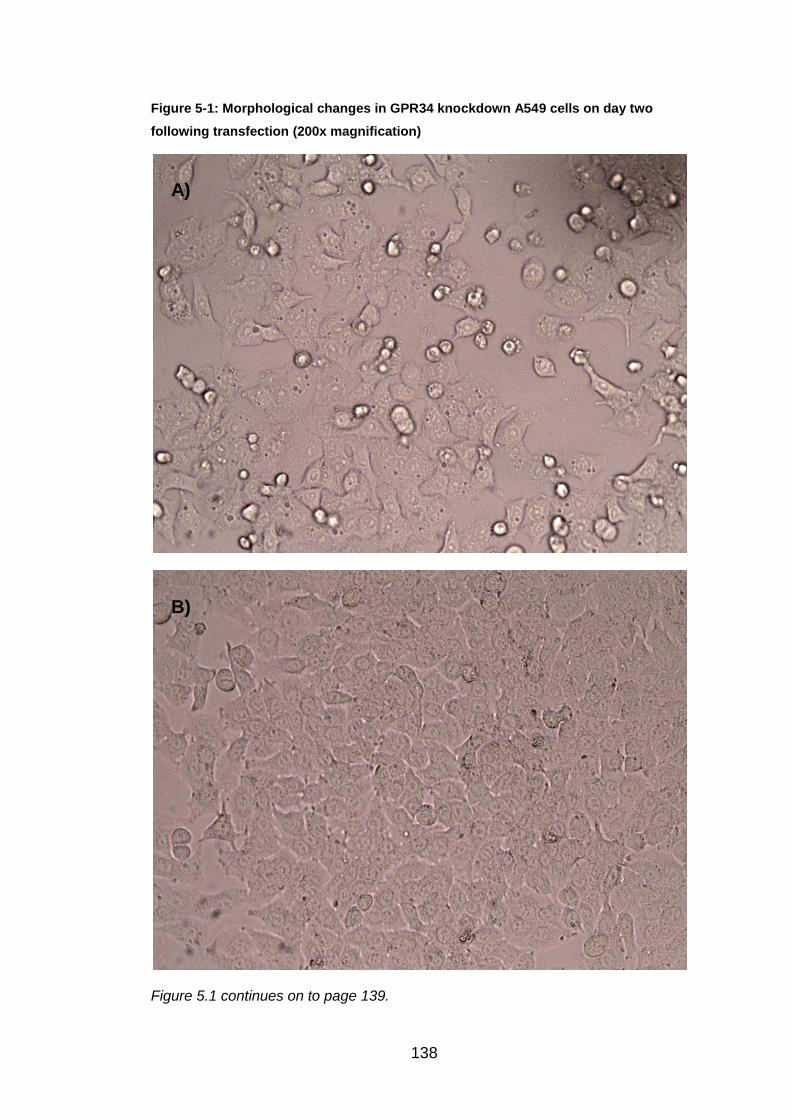
morphological changes after knockdown was GPR34. The images can be
seen, both after transfection, but pre RSV infection in Figure 5.1, and post
RSV infection in Figure 5.2. The morphological changes were more apparent
on day two of the protocol compared to day five. On day two (before RSV
infection), the GPR34 knockdown A549 cells were compared to the non-
155
siRNA transfected A549 cells. The normal "cobblestone" appearance and
efficient growth was shown in the non-transfected A549 cells. The GPR34
knockdown cells had more irregular shapes and sizes than those seen in the
control image. The knockdown cells were not as confluent suggesting that
they were not growing at the same rate to normal. Within the knockdown
cells, dark cell membranes, extracellular projections and black spots could be
seen. On day five (post RSV infection), the GPR34 knockdown cells were
continuing to grow at a slower rate than the non-knockdown cells. They also
appeared darker in colour, more clustered with less defined cellular edges,
compared to the non-transfected cells. The use of red fluorescent-labelled
RSV was utilised to observe these changes further by investigating under the
confocal microscope (Figures 5.3 and 5.4). In the GPR34 knockdown A549
cells, the morphological changes were present as the cells appeared
speckled, with unusual black spots on the membrane, which has been
suggested as blebbing, mainly associated with cellular apoptosis. The RSV
was found within the cell cytoplasm, excluding the nuclei, in A549 cells, but
the red colour became less dense towards the edges of the cells in
knockdown cells, compared to the non-transfected sample. Finally GPR34
was investigated by the use of antibody staining (Figures 5.5 and 5.6).
GPR34 antibody was stained onto A549 cells fixed on microscopic slides.
Cytokeratin antibody was used for the control slide. Cytokeratin is normally
found inside all cells forming a cytoskeleton within the cell, which gives the
cell its shape. Texas red secondary antibody was used, which works by
attaching onto the GPR34 antibody and therefore illustrating the location of
GPR34 in a red colour. This experiment proved that the GPR34 protein is
found mainly in the cell membrane, but occasionally seen within the nuclei.
The results for GPR34 are interesting, but validation of these results and
further techniques are required before it could all be understood.
Whilst focusing on the confocal microscope, a Z stack could be performed
detecting the depth distance that GPR34 is present within A549 cells. Also,
GPR34 knockdown cells could be stained with the GPR34 antibody to prove,
firstly, that the siRNA is knocking out the protein, and secondly, that the
antibody is targeting the correct protein. Western Blot technique could be
156
introduced to focus on protein expression, by confirming that the protein
expression is reduced by siRNA technique and whether there are any normal
changes in GPR34 protein expression over a number of RSV infection time
points. Any up- or down-regulation would be observed at protein level. The
protein is shown up on the Western Blot gel by the use of a GPR34 antibody.
Immunoprecipitation technique may also be used, which is able to isolate
proteins from the cell solution. This would be able to determine whether any
RSV proteins are able to attach onto the GPR34 protein, and are illustrated
through Western Blot. The use of a proteasome inhibitor (MG-132) could also
be utilised. This functions by inhibiting protein degradation to investigate
whether GPR34 is degraded via the proteasome or not. The results are
proven by Western Blot analysis, to show that protein expression has
increased, and should therefore cause a reduction in RSV N gene expression
when analysed by PCR. Another possible way to increase GPR34
expression within the cells is by transfecting GPR34 protein into the cells.
6.5 Further investigations for RNF168
Finally, RNF168 has been investigated further by Dr. B Flanagan (Personal
Communicator) through a number of techniques. The use of Western Blots
have shown that RNF168 protein expression reduces over RSV time points,
and begins to disappear at 24 and 48h post RSV infection. Lilley et al have
investigated the effect of ICP0, a protein of Herpes Simplex Virus Type I, on
RNF168, showing similar results, via Western Blot technique, over an
infection time period. Lilley has also shown that the use of MG-132,
proteasome inhibitor, causes the protein expression of RNF168 to be
increased, resulting in the reappearance of RNF168 on the Western Blot gel
(172, 173). Therefore this suggests that the use of MG-132 may increase
RNF168 expression during RSV infection. Whilst this technique is taking
place, further investigation using the confocal microscope can be done.
Similar to those mentioned for GPR34, a RNF168 antibody could be used to
investigate where RNF168 can be found in the cell, the efficiency of siRNA
knockdown and how RSV infection affects the protein, visibly. SiRNA
knockdown should also be validated through Western Blot to confirm protein
expression is being reduced, and immunoprecipitation could show any
157
association between RNF168 and RSV proteins. Also, through Dr. B
Flanagan, an association between H2A histone and RNF168 has been
found. Through mass spectrometry analysis, H2A histones are shown to be
less ubiquitinated in RSV infection. H2A histones have been found to be
ubiquinated by RNF168 in RSV infection, which induces the recruitment of
DNA repair molecules and enzymes. It is still unclear why this may
advantage RSV infection, as the virus does not enter the nuclei, whereas,
interestingly, ICP0 does (172, 173).
In pharmacology, Bortezomib is the first proteasome inhibitor to become an
intervention available for humans. It is an anti-cancer drug, indicated for
multiple myeloma. This is an interesting concept, because proteasomal
inhibition has been suggested to reduce RSV N gene expression. This
particular intervention would not be suitable obviously due to its cytotoxic
effects and non-specificity, but it is exciting to see an intervention produced
within this area.
158
References
1. González PA, Bueno SM, Riedel CA, Kalergis AM. Impairment of T Cell Immunity by the Respiratory Syncytial Virus: Targeting Virulence Mechanisms for Therapy and Prophylaxis. Current Medicinal Chemistry 2009;16 (34):4609-25.
2. Zhang WL, Tripp RA. RNA Interference Inhibits Respiratory Syncytial Virus Replication and Disease Pathogenesis without Inhibiting Priming of the Memory Immune Response. Journal of Virology 2008;82 (24):12221-31.
3. Zeng RH, Li CX, Li N, Wei L, Cui YX. The role of cytokines and chemokines in severe respiratory syncytial virus infection and subsequent asthma. Cytokine 2011;53 (1):1-7.
4. Habibi MS, Patel S, Openshaw P. Hot topics in the prevention of respiratory syncytial virus disease. Expert Review Of Vaccines 2011;10 (3):291-3.
5. Senft AP, Taylor RH, Lei W, Campbell SA, Tipper JL, Martinez MJ, et al. Respiratory syncytial virus impairs macrophage IFN-alpha/beta- and IFN-gamma-stimulated transcription by distinct mechanisms. American Journal Of Respiratory Cell And Molecular Biology 2010;42 (4):404-14.
6. Graham BS. Biological challenges and technological opportunities for respiratory syncytial virus vaccine development. Immunological Reviews 2011;239 (1):149-66.
7. Barreira ER, Precioso AR, Bousso A. Pulmonary Surfactant in Respiratory Syncytial Virus Bronchiolitis: The Role in Pathogenesis and Clinical Implications. Pediatric Pumonology 2011;46 (5):415-20.
8. Nair H, Verma VR, Theodoratou E, Zgaga L, Huda T, Simões EAF, et al. An evaluation of the emerging interventions against Respiratory Syncytial Virus (RSV)-associated acute lower respiratory infections in children. BMC Public Health 2011;11 Suppl 3:S30-S.
9. Eberle J. A treatise on the diseases and physical education of children. Lippincott. 1857.
10. Adams JM. Primary Virus Pneumonitis with Cytoplasmic Inclusion Bodies. Study of an Epidemic Involving Thirty-Two Infants, with Nine Deaths. Journal of the American Medical Association 1941;116 (10):925-33.
11. Adams J. Primary virus pneumonitisA comparative study of two epidemics. The Journal of Pediatrics (Science Direct) 1942;20 (4):405.
12. Morris JA, Blount RE, Jr, Savage RE. Recovery of Cytopathogenic Agent from Chimpanzees with Coryza. Proceedings of the Society for Experimental Biology and Medicine 1956;92 (3):544-9.
159
13. Chanock R, Roizman B, Myers R. Recovery from infants with respiratory illness of a virus related to Chimpanzee Coryza Agent (CCA). American Journal of Epidemiology 1957;66 (3):281.
14. Chanock RM, Parrott RH, Vargosko AJ, Kapikian AZ, Knight V, Johnson KM. Acute respiratory diseases of viral etiology. IV. Respiratory syncytial virus. American Journal Of Public Health And The Nation's Health 1962;52:918-25.
15. Groothuis JR, Hoopes JM, Jessie VGH. Prevention of serious respiratory syncytial virus-related illness. I: Disease pathogenesis and early attempts at prevention. Advances In Therapy 2011;28 (2):91-109.
16. Oshansky CM, Zhang WL, Moore E, Tripp RA. The host response and molecular pathogenesis associated with respiratory syncytial virus infection. Future Microbiology 2009;4 (3):279-97.
17. Krishnan S, Craven M, Welliver RC, Ahmad N, Halonen M. Differences in Participation of Innate and Adaptive Immunity to Respiratory Syncytial Virus in Adults and Neonates. The Journal of Infectious Diseases 2003;188 (3):433-9.
18. Ruotsalainen M, Piippo-Savolainen E, Hyvärinen MK, Korppi M. Respiratory morbidity in adulthood after respiratory syncytial virus hospitalization in infancy. The Pediatric Infectious Disease Journal 2010;29 (9):872-4.
19. Dawson-Caswell M, Muncie HL, Jr. Respiratory syncytial virus infection in children. American Family Physician 2011;83 (2):141-6.
20. Monick MM, Cameron K, Staber J, Powers LS, Yarovinsky TO, Koland JG, et al. Activation of the epidermal growth factor receptor by respiratory syncytial virus results in increased inflammation and delayed apoptosis. The Journal Of Biological Chemistry 2005;280 (3):2147-58.
21. Villenave R, O'Donoghue D, Thavagnanam S, Touzelet O, Skibinski G, Heaney LG, et al. Differential cytopathogenesis of respiratory syncytial virus prototypic and clinical isolates in primary pediatric bronchial epithelial cells. Virology Journal 2011;8:43-.
22. Johnson TR. Respiratory syncytial virus and innate immunity: a complex interplay of exploitation and subversion. Expert Review of Vaccines 2006;5 (3):371-80.
23. Bersch C. The nose knows: RSV and HRV. MLO: Medical Laboratory Observer 2010;42 (6):10-4.
24. Smyth RL. Innate immunity in respiratory syncytial virus bronchiolitis. Experimental Lung Research 2007;33 (10):543-7.
25. Greenough A. Respiratory syncytial virus infection: clinical features, management, and prophylaxis. Current Opinion In Pulmonary Medicine 2002;8 (3):214-7.
26. Cormier SA, You D, Honnegowda S. The use of a neonatal mouse model to study respiratory syncytial virus infections. Expert Review of Anti-infective Therapy 2010;8 (12):1371-80.
160
27. Crowcroft NS, Zambon M, Harrison TG, Mok Q, Heath P, Miller E. Respiratory syncytial virus infection in infants admitted to paediatric intensive care units in London, and in their families. European Journal Of Pediatrics 2008;167 (4):395-9.
28. Organisation WH. Acute Respiratory Infections - Respiratory syncytial virus and parainfluenza viruses; September 2009; Available from: http://www.who.int/vaccine_research/diseases/ari/en/index2.html.
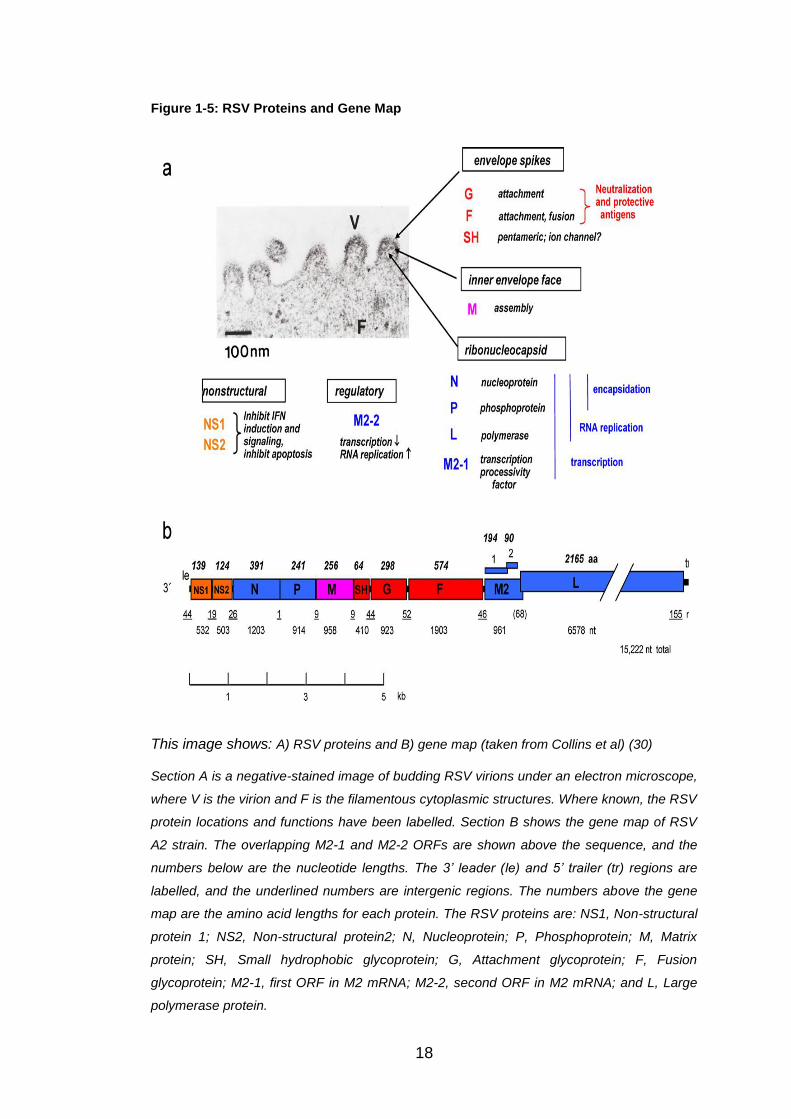
30. Collins PL, Melero JA. Progress in understanding and controlling respiratory syncytial virus: Still crazy after all these years. Virus Research 2011;162 (1/2):80-99.
31. Zuccotti G, Dilillo D, Zappa A, Galli E, Amendola A, Martinelli M, et al. Epidemiological and clinical features of respiratory viral infections in hospitalized children during the circulation of influenza virus A (H1N1) 2009. Influenza and Other Respiratory Viruses 2011;5 (6):R528-R34.
32. Manoha C, Espinosa S, Aho S-L, Huet F, Pothier P. Epidemiological and clinical features of hMPV, RSV and RVs infections in young children. Journal Of Clinical Virology: The Official Publication Of The Pan American Society For Clinical Virology 2007;38 (3):221-6.
33. Meqdam MM, Subaih SH. Rapid detection and clinical features of infants and young children with acute lower respiratory tract infection due to respiratory syncytial virus. FEMS Immunology And Medical Microbiology 2006;47 (1):129-33.
34. Flores P, Rebelo-de-Andrade H, Gonçalves P, Guiomar R, Carvalho C, Sousa EN, et al. Bronchiolitis caused by respiratory syncytial virus in an area of portugal: epidemiology, clinical features, and risk factors. European Journal Of Clinical Microbiology & Infectious Diseases: Official Publication Of The European Society Of Clinical Microbiology 2004;23 (1):39-45.
35. Fitzgerald DA. Viral bronchiolitis for the clinician. Journal of Paediatrics & Child Health 2011;47 (4):160-6.
36. Herranz C, Melero JA, Martínez I. Reduced innate immune response, apoptosis, and virus release in cells cured of respiratory syncytial virus persistent infection. Virology 2011;410 (1):56-63.
37. Yasuno T, Shimizu T, Maeda Y, Yamasaki A, Amaya E, Kawakatsu H. Wheezing illness caused by respiratory syncytial virus and other agents. Pediatrics International 2008;50 (4):500-5.
38. Papenburg J, Boivin G. The distinguishing features of human metapneumovirus and respiratory syncytial virus. Reviews In Medical Virology 2010;20 (4):245-60.
39. Stein RT, Sherrill D, Morgan WJ, Holberg CJ, Halonen M, Taussig LM, et al. Respiratory syncytial virus in early life and risk of wheeze and allergy by age 13 years. Lancet 1999;354 (9178):541-5.
40. Sigurs N, Gustafsson PM, Bjarnason R, Lundberg F, Schmidt S, Sigurbergsson F, et al. Severe respiratory syncytial virus bronchiolitis in infancy and asthma and allergy at age 13. American Journal of Respiratory & Critical Care Medicine 2005;171 (2):137-41.
41. Feltes TF, Sondheimer HM, Tulloh RMR, Harris BS, Jensen KM, Losonsky GA, et al. A Randomized Controlled Trial of Motavizumab Versus Palivizumab for the Prophylaxis of Serious Respiratory Syncytial Virus Disease in Children With Hemodynamically Significant Congenital Heart Disease. Pediatric Research 2011;70 (2):186-91.
42. Sow FB, Gallup JM, Krishnan S, Patera AC, Suzich J, Ackermann MR. Respiratory syncytial virus infection is associated with an altered innate immunity and a heightened pro-inflammatory response in the lungs of preterm lambs. Respiratory Research 2011;12.
43. Krilov LR, Palazzi DL, Fernandes AW, Klein RW, Mahadevia PJ. Prevalence of respiratory syncytial virus (RSV) risk factors and cost implications of immunoprophylaxis to infants 32 to 35 weeks gestation for health plans in the United States. Value In Health: The Journal Of The International Society For Pharmacoeconomics And Outcomes Research 2010;13 (1):77-86.
44. Weisman LE. Populations at risk for developing respiratory syncytial virus and risk factors for respiratory syncytial virus severity: infants with predisposing conditions. The Pediatric Infectious Disease Journal 2003;22 (2 Suppl):S33.
45. Lanari M, Silvestri M, Rossi GA. Respiratory syncytial virus risk factors in late preterm infants. Journal of Maternal-Fetal & Neonatal Medicine 2009;22:102-7.
46. Groothuis J, Makari D, Hoopes JM. RSV risk: understanding RSV-related hospitalization of high-risk infants. Managed Care 2009;18 (10):1-9.
47. Colin AA, McEvoy C, Castile RG. Respiratory morbidity and lung function in preterm infants of 32 to 36 weeks' gestational age. Pediatrics 2010;126 (1):115-28.
48. Todd FE, Roberg KA, Welliver RC. Preventing RSV Infection in At-risk Infants: Current and Emerging Strategies. Pediatric Nursing 2010:3-14.
49. Kristensen K, Stensballe LG, Bjerre J, Roth D, Fisker N, Kongstad T, et al. Risk factors for respiratory syncytial virus hospitalisation in children with heart disease. Archives of Disease in Childhood 2009;94 (10):785-9.
50. Alexander PMA, Eastaugh L, Royle J, Daley AJ, Shekerdemian LS, Penny DJ. Respiratory syncytial virus immunoprophylaxis in high-
162
risk infants with heart disease. Journal of Paediatrics & Child Health 2012;48 (5):395-401.
51. Bloemers BLP, Broers CJM, Bont L, Weijerman ME, Gemke R, van Furth AM. Increased risk of respiratory tract infections in children with Down syndrome: the consequence of an altered immune system. Microbes and Infection 2010;12 (11):799-808.
52. Giebels K, Marcotte JE, Podoba J, Rousseau C, Denis MH, Fauvel V, et al. Prophylaxis against respiratory syncytial virus in young children with cystic fibrosis. Pediatric Pulmonology 2008;43 (2):169-74.
53. Ebbert JO, Limper AH. Respiratory syncytial virus pneumonitis in immunocompromised adults: clinical features and outcome. Respiration; International Review Of Thoracic Diseases 2005;72 (3):263-9.
54. Zhang L, Mendoza-Sassi RA, Wainwright C, Klassen TR. Nebulized hypertonic saline solution for acute bronchiolitis in infants. Cochrane Database of Systematic Reviews 2008 (4).
55. Gadomski AM, Brower M. Bronchodilators for bronchiolitis. Cochrane Database Of Systematic Reviews (Online) 2010 (12):CD001266.
56. Hartling L, Bialy LM, Vandermeer B, Tjosvold L, Johnson DW, Plint AC, et al. Epinephrine for bronchiolitis. Cochrane Database Of Systematic Reviews (Online) 2011 (6):CD003123.
57. Spurling GK, Doust J, Del Mar CB, Eriksson L. Antibiotics for bronchiolitis in children. Cochrane Database Of Systematic Reviews (Online) 2011 (6):CD005189.
58. Kapikian AZ, Mitchell RH, Chanock RM, Schvedoff RA, Stewart CE. An epidemiologic study of altered clinical reactivity to respiratory syncytial (RS) virus infection in children previously vaccinated with an inactivated RS virus vaccine. American Journal of Epidemiology 1969;89 (4):405-21.
59. Health RCoPaC. SIGN: Bronchiolitis in Children; 2006; Available from: http://www.rcpch.ac.uk/sites/default/files/asset_library/Research/Clinical%20Effectiveness/Endorsed%20guidelines/Bronchiolitis%20in%20Children%20%28SIGN%29/Bronchiolitis%20quick%20reference%20guide.pdf.
60. AAP. Summary of 2009 AAP Recommendations for RSV Prophylaxis of High-Risk Infants and Children. 2009.
61. Martinez I, Lombardia L, Herranz C, Garcia-Barreno B, Dominguez O, Melero JA. Cultures of HEp-2 cells persistently infected by human respiratory syncytial virus differ in chemokine expression and resistance to apoptosis as compared to lytic infections of the same cell type. Virology 2009;388 (1):31-41.
62. Wertz GW, Moudy RM. Antigenic and genetic variation in human respiratory syncytial virus. Pediatric Infectious Disease Journal 2004;23:S19-S24.
64. El Omari K, Dhaliwal B, Ren J, Abrescia NGA, Lockyer M, Powell KL, et al. Structures of respiratory syncytial virus nucleocapsid protein from two crystal forms: details of potential packing interactions in the native helical form. Acta Crystallographica: Section F (International Union of Crystallography - IUCr) 2011;67 (10):1179-83.
65. McNamara PS, Smyth RL. The pathogenesis of respiratory syncytial virus disease in childhood. British Medical Bulletin 2002;61:13-28.
66. Bermingham A, Collins PL. The M2-2 Protein of Human Respiratory Syncytial Virus Is a Regulatory Factor Involved in the Balance between RNA Replication and Transcription. Proceedings of the National Academy of Sciences of the United States of America 1999;96 (20):11259-64.
67. Swedan S, Andrews J, Majumdar T, Musiyenko A, Barik S. Multiple functional domains and complexes of the two nonstructural proteins of human respiratory syncytial virus contribute to interferon suppression and cellular location. Journal Of Virology 2011;85 (19):10090-100.
68. Swedan S, Musiyenko A, Barik S. Respiratory Syncytial Virus Nonstructural Proteins Decrease Levels of Multiple Members of the Cellular Interferon Pathways. Journal of Virology 2009;83 (19):9682-93.
69. Elliott J, Lynch OT, Suessmuth Y, Qian P, Boyd CR, Burrows JF, et al. Respiratory syncytial virus NS1 protein degrades STAT2 by using the elongin-cullin E3 ligase. Journal of Virology 2007;81 (7):3428-36.
70. Ramaswamy M, Shi L, Varga SM, Barik S, Behlke MA, Look DC. Respiratory syncytial virus nonstructural protein 2 specifically inhibits type I interferon signal transduction. Virology 2006;344 (2):328-39.
71. McLellan JS, Yang YP, Graham BS, Kwong PD. Structure of Respiratory Syncytial Virus Fusion Glycoprotein in the Postfusion Conformation Reveals Preservation of Neutralizing Epitopes. Journal of Virology 2011;85 (15):7788-96.
72. Day ND, Branigan PJ, Liu C, Gutshall LL, Luo J, Melero JA, et al. Contribution of cysteine residues in the extracellular domain of the F protein of human respiratory syncytial virus to its function. Virology Journal 2006;3:34-.
73. Minor RAC, Limmon GV, Miller-DeGraff L, Dixon D, Andrews DMK, Kaufman RJ, et al. Double-stranded RNA-activated protein kinase regulates early innate immune responses during respiratory syncytial virus infection. Journal Of Interferon & Cytokine Research: The Official Journal Of The International Society For Interferon And Cytokine Research 2010;30 (4):263-72.
74. Volz T, Kaesler S, Biedermann T. Innate immune sensing 2.0 - from linear activation pathways to fine tuned and regulated innate immune networks. Experimental Dermatology 2012;21 (1):61-9.
164
75. Ciechanover AJ, Sznajder JI. Innate and adaptive immunity: the 2011 Nobel Prize in Physiology or Medicine. American Journal Of Respiratory And Critical Care Medicine 2011;184 (11):i-ii.
76. Cooper MA, Colonna M, Yokoyama WM. Hidden talents of natural killers: NK cells in innate and adaptive immunity. EMBO Reports 2009;10 (10):1103-10.
77. Netea MG, Quintin J, van der Meer JWM. Trained immunity: a memory for innate host defense. Cell Host & Microbe 2011;9 (5):355-61.
78. Valen G. Innate immunity and remodelling. Heart Failure Reviews 2011;16 (1):71-8.
79. Akira S. Innate immunity and adjuvants. Philosophical Transactions Of The Royal Society Of London. Series B, Biological Sciences 2011;366 (1579):2748-55.
80. Van Kaer L, Parekh VV, Wu L. Invariant natural killer T cells: bridging innate and adaptive immunity. Cell And Tissue Research 2011;343 (1):43-55.
81. Paust S, Senman B, von Andrian UH. Adaptive immune responses mediated by natural killer cells. Immunological Reviews 2010;235 (1):286-96.
82. Journo C, Mahieux R. HTLV-1 and Innate Immunity. Viruses (1999-4915) 2011;3 (8):1374-94.
83. Unterholzner L, Bowie AG. The interplay between viruses and innate immune signaling: Recent insights and therapeutic opportunities. Biochemical Pharmacology 2008:589-602.
84. Yoboua F, Martel A, Duval A, Mukawera E, Grandvaux N. Respiratory Syncytial Virus-Mediated NF-kappa B B p65 Phosphorylation at Serine 536 Is Dependent on RIG-I, TRAF6, and IKK beta. Journal of Virology 2010;84 (14):7267-77.
85. Kurt-Jones EA, Popova L, Kwinn L, Haynes LM, Jones LP, Tripp RA, et al. Pattern recognition receptors TLR4 and CD14 mediate response to respiratory syncytial virus. Nature Immunology 2000;1 (5):398-401.
86. Rallabhandi P, Phillips RL, Boukhvalova MS, Pletneva LM, Shirey KA, Gioannini TL, et al. Respiratory Syncytial Virus Fusion Protein-Induced Toll-Like Receptor 4 (TLR4) Signaling Is Inhibited by the TLR4 Antagonists Rhodobacter sphaeroides Lipopolysaccharide and Eritoran (E5564) and Requires Direct Interaction with MD-2. Mbio 2012;3 (4).
87. Rudd BD, Burstein E, Duckett CS, Li X, Lukacs NW. Differential Role for TLR3 in Respiratory Syncytial Virus-Induced Chemokine Expression. Journal of Virology 2005;79 (6):3350-7.
88. Nairn R, Helbert M. Immunology for medical students. 2nd ed. Philadelphia: Mosby; 2007.
89. Mailaparambil B, Jochum J, Forster J, Heinze J, Krueger M, Heinzmann A. Polymorphisms of interferons and their receptors in
165
the genetics of severe RSV-associated diseases. Archives of Virology 2008;153 (11):2133-7.
90. Oshansky CM, Krunkosky TM, Barber J, Jones LP, Tripp RA. Respiratory syncytial virus proteins modulate suppressors of cytokine signaling 1 and 3 and the type I interferon response to infection by a toll-like receptor pathway. Viral Immunology 2009;22 (3):147-61.
91. Rudd BD, Luker GD, Luker KE, Peebles RS, Lukacs NW. Type I interferon regulates respiratory virus infected dendritic cell maturation and cytokine production. Viral Immunology 2007;20 (4):531-40.
92. Krishnan S, Halonen M. Suppression of Innate Immune Cytokines and Interferon Regulatory Factor-1 by Endogenous Interferon-Alpha in Response to Respiratory Syncytial Virus in Neonate Mononuclear Cells. Immunological Investigations 2007;36 (4):441-56.
93. Spann KM, Tran K-C, Bo C, Rabin RL, Collins PL. Suppression of the Induction of Alpha, Beta, and Gamma Interferons by the NS1 and NS2 Proteins of Human Respiratory Syncytial Virus in Human Epithelial Cells and Macrophages. Journal of Virology 2004;78 (8):4363-9.
94. Ling Z, Tran KC, Teng MN. Human respiratory syncytial virus nonstructural protein NS2 antagonizes the activation of beta interferon transcription by interacting with RIG-I. Journal Of Virology 2009;83 (8):3734-42.
95. Bataki EL, Evans GS, Everard ML. Respiratory syncytial virus and neutrophil activation. Clinical & Experimental Immunology 2005;140 (3):470-7.
96. Reed JL, Brewah YA, Delaney T, Welliver T, Burwell T, Benjamin E, et al. Macrophage impairment underlies airway occlusion in primary respiratory syncytial virus bronchiolitis. Journal of Infectious Diseases 2008;198 (12):1783-93.
97. Pribul PK, Harker J, Wang B, Wang H, Tregoning JS, Schwarze J, et al. Alveolar macrophages are a major determinant of early responses to viral lung infection but do not influence subsequent disease development. Journal Of Virology 2008;82 (9):4441-8.
98. Tripp RA, Moore D, Jones L, Sullender W, Winter J, Anderson LJ. Respiratory syncytial virus G and/or SH protein alters Th1 cytokines, natural killer cells, and neutrophils responding to pulmonary infection in BALB/c mice. Journal of Virology 1999;73 (9):7099-107.
99. Jianou Qiao, Ang Li, Xianquia Jin. TSLP from RSV-stimulated rat airway epithelial cells activates myeloid dendritic cells. Immunology & Cell Biology 2011;89 (2)231-238
100. Walsh EE, Falsey AR. Humoral and Mucosal Immunity in Protection from Natural Respiratory Syncytial Virus Infection in Adults. The Journal of Infectious Diseases 2004;190 (2):373-8.
101. Haynes LM, Tonkin J, Anderson LJ, Tripp RA. Neutralizing anti-F glycoprotein and anti-substance P antibody treatment effectively
166
reduces infection and inflammation associated with respiratory syncytial virus infection. Journal of Virology 2002;76 (14):6873-81.
102. Lee FEH, Falsey AR, Halliley JL, Sanz I, Walsh EE. Circulating Antibody-Secreting Cells during Acute Respiratory Syncytial Virus Infection in Adults. Journal of Infectious Diseases 2010;202 (11):1659-66.
103. DiNapoli JM, Murphy BR, Collins PL, Bukreyev A. Impairment of the CD8+ T cell response in lungs following infection with human respiratory syncytial virus is specific to the anatomical site rather than the virus, antigen, or route of infection. Virology Journal 2008;5:105-.
104. Miyairi I, DeVincenzo JP. Human genetic factors and respiratory syncytial virus disease severity. Clinical Microbiology Reviews 2008;21 (4):686-703.
105. DeVincenzo JP. Harnessing RNA interference to develop neonatal therapies: From Nobel Prize winning discovery to proof of concept clinical trials. Early Human Development 2009;85 (10):S31-S5.
106. DeVincenzo JP. RNA interference strategies as therapy for respiratory viral infections. The Pediatric Infectious Disease Journal 2008;27 (10 Suppl):S118-S22.
107. Barik S, Bitko V. Prospects of RNA interference therapy in respiratory viral diseases: update 2006. Expert Opinion On Biological Therapy 2006;6 (11):1151-60.
108. Alvarez R, Elbashir S, Borland T, Toudjarska I, Hadwiger P, John M, et al. RNA Interference-Mediated Silencing of the Respiratory Syncytial Virus Nucleocapsid Defines a Potent Antiviral Strategy. Antimicrobial Agents and Chemotherapy 2009;53 (9):3952-62.
109. Vig K, Lewis N, Moore EG, Pillai S, Dennis VA, Singh SR. Secondary RNA structure and its role in RNA interference to silence the respiratory syncytial virus fusion protein gene. Molecular Biotechnology 2009;43 (3):200-11.
110. Trehan S, Sharma G, Misra A. siRNA: Sojourn from Discovery to Delivery Challenges and Clinics. Systematic Reviews in Pharmacy 2010;1 (1):1-16.
111. Horn T, Sandmann T, Boutros M. Design and evaluation of genome-wide libraries for RNA interference screens. Genome Biology 2010;11 (6).
112. InnateDB. InnateDB: Systems Biology of the Innate Immune Response; 2012 [cited 2012 March].
113. Marchese A, Sawzdargo M, Nguyen T, Cheng R, Heng HHQ, Nowak T, et al. Discovery of three novel orphan G-protein-coupled receptors. Genomics 1999;56 (1):12-21.
114. Liebscher I, Müller U, Teupser D, Engemaier E, Engel KMV, Ritscher L, et al. Altered Immune Response in Mice Deficient for the G Protein-coupled Receptor GPR34. Journal of Biological Chemistry 2011;286 (3):2101-10.
167
115. Engemaier E, Römpler H, Schöneberg T, Schulz A. Genomic and supragenomic structure of the nucleotide-like G-protein-coupled receptor GPR34. Genomics 2006;87 (2):254-64.
116. Sluijs KFvd, Obregon C, Geiser TK, Mühlemann K, Nicod LP. Monocyte differentiation toward regulatory dendritic cells is not affected by respiratory syncytial virus-induced inflammatory mediators. American Journal Of Respiratory Cell And Molecular Biology 2011;44 (5):655-64.
117. Kallal. The Role of CC chemokine Receptors 6 and 7 in the Immune Response to Respiratory Syncytial Virus. 2010-06-03T15:41:41Z; 2010.
118. Booth V, Keizer DW, Kamphuis MB, Clark-Lewis I, Sykes BD. The CXCR3 Binding Chemokine IP-10/CXCL10: Structure and Receptor Interactions. Biochemistry 2002;41 (33):10418.
119. Ramachandran S, Chahwan R, Nepal RM, Frieder D, Panier S, Roa S, et al. The RNF8/RNF168 ubiquitin ligase cascade facilitates class switch recombination. Proceedings of the National Academy of Sciences of the United States of America 2010;107 (2):809-14.
120. Pinato S, Scandiuzzi C, Arnaudo N, Citterio E, Gaudino G, Penengo L. RNF168, a new RING finger, MIU-containing protein that modifies chromatin by ubiquitination of histones H2A and H2AX. BMC Molecular Biology 2009;10:55-.
121. Chaurushiya MS, Lilley CE, Aslanian A, Meisenhelder J, Scott DC, Landry S, et al. Viral E3 ubiquitin ligase-mediated degradation of a cellular E3: viral mimicry of a cellular phosphorylation mark targets the RNF8 FHA domain. Molecular Cell 2012;46 (1):79-90.
122. Dominguez C, Bonvin A, Winkler GS, van Schaik FMA, Timmers HTM, Boelens R. Structural model of the UbcH5B/CNOT4 complex revealed by combining NMR, mutagenesis, and docking approaches. STRUCTURE 2004;12 (4):633-44.
123. Geng L, Huntoon CJ, Karnitz LM. RAD18-mediated ubiquitination of PCNA activates the Fanconi anemia DNA repair network. The Journal Of Cell Biology 2010;191 (2):249-57.
124. Williams SA, Longerich S, Sung P, Vaziri C, Kupfer GM. The E3 ubiquitin ligase RAD18 regulates ubiquitylation and chromatin loading of FANCD2 and FANCI. Blood 2011;117 (19):5078-87.
125. Yang J, Kim O, Wu J, Qiu Y. Interaction between tyrosine kinase Etk and a RUN domain- and FYVE domain-containing protein RUFY1. A possible role of ETK in regulation of vesicle trafficking. The Journal Of Biological Chemistry 2002;277 (33):30219-26.
126. Chakarova CF, Khanna H, Shah AZ, Patil SB, Sedmak T, Murga-Zamalloa CA, et al. TOPORS, implicated in retinal degeneration, is a cilia-centrosomal protein. Human Molecular Genetics 2011;20 (5):975-87.
127. Coumailleau F, Das V, Alcover A, Raposo G, Vandormael-Pournin S, Le Bras S, et al. Over-expression of rififylin, a new RING finger and FYVE-like domain-containing protein, inhibits recycling from the
168
endocytic recycling compartment. Molecular Biology of the Cell 2004;15 (10):4444-56.
128. Johnson NL, Gardner AM, Diener KM, Lange-Carter CA, Gleavy J, Jarpe MB, et al. Signal transduction pathways regulated by mitogen-activated/extracellular response kinase kinase kinase induce cell death. The Journal Of Biological Chemistry 1996;271 (6):3229-37.
129. Li M, Liu J, Zhang CY. Evolutionary History of the Vertebrate Mitogen Activated Protein Kinases Family. PLOS One 2011;6 (10).
130. Pazdrak K, Olszewska-Pazdrak B, Liu TS, Takizawa R, Brasier AR, Garofalo RP, et al. MAPK activation is involved in posttranscriptional regulation of RSV-induced RANTES gene expression. American Journal of Physiology-Lung Cellular and Molecular Physiology 2002;283 (2):L364-L72.
131. Lu G, Wang Y. Functional Diversity of Mammalian Type 2C Protein Phosphatase Isoforms: New Tales from an old family. Clinical & Experimental Pharmacology & Physiology 2008;35 (2):107-12.
132. Dai JF, Zhang JY, Sun YQ, Wu QH, Sun LY, Ji CN, et al. Characterization of a novel human protein phosphatase 2C family member, PP2C kappa. International Journal of Molecular Medicine 2006;17 (6):1117-23.
133. Shreeram S, Bulavin DV. PPM1H--new kid on the block. Cancer Biology & Therapy 2008;7 (2):293-4.
134. Markovic D, Challiss RAJ. Alternative splicing of G protein-coupled receptors: physiology and pathophysiology. Cellular And Molecular Life Sciences: CMLS 2009;66 (20):3337-52.
135. Cobanoglu MC, Saygin Y, Sezerman U. Classification of GPCRs Using Family Specific Motifs. IEEE-ACM Transactions on Computational Biology and Bioinformatics 2011;8 (6):1495-508.
136. Thomas LH, Friedland JS, Sharland M. Chemokines and their receptors in respiratory disease: a therapeutic target for respiratory syncytial virus infection. Expert Review of Anti-Infective Therapy 2007;5 (3):415-25.
137. Wellendorph P, Bräuner-Osborne H. Molecular basis for amino acid sensing by family C G-protein-coupled receptors. British Journal Of Pharmacology 2009;156 (6):869-84.
138. Urwyler S. Allosteric modulation of family C G-protein-coupled receptors: from molecular insights to therapeutic perspectives. Pharmacological Reviews 2011;63 (1):59-126.
139. Schulz A, Schöneberg T. The structural evolution of a P2Y-like G-protein-coupled receptor. The Journal Of Biological Chemistry 2003;278 (37):35531-41.
140. Lim HD, de Graaf C, Jiang W, Sadek P, McGovern PM, Istyastono EP, et al. Molecular determinants of ligand binding to H4R species variants. Molecular Pharmacology 2010;77 (5):734-43.
141. Dunford PJ, O'Donnell N, Riley JP, Williams KN, Karlsson L, Thurmond RL. The histamine H4 receptor mediates allergic airway
169
inflammation by regulating the activation of CD4+ T cells. Journal Of Immunology (Baltimore, Md.: 1950) 2006;176 (11):7062-70.
142. Roe MFE, Bloxham DM, Cowburn AS, O'Donnell DR. Changes in helper lymphocyte chemokine receptor expression and elevation of IP-10 during acute respiratory syncytial virus infection in infants. Pediatric Allergy and Immunology 2011;22 (2):229-34.
143. Liu G-Y, Kulasingam V, Alexander RT, Touret N, Fong AM, Patel DD, et al. Recycling of the membrane-anchored chemokine, CX3CL1. The Journal Of Biological Chemistry 2005;280 (20):19858-66.
144. Zhang YH, Luxon BA, Casola A, Garofalo RP, Jamaluddin M, Brasier AR. Expression of respiratory syncytial virus-induced chemokine gene networks in lower airway epithelial cells revealed by cDNA microarrays. Journal of Virology 2001;75 (19):9044-58.
145. Becker Y. Respiratory syncytial virus (RSV) evades the human adaptive immune system by skewing the Th1/Th2 cytokine balance toward increased levels of Th2 cytokines and IgE, markers of allergy - a review. Virus Genes 2006;33 (2):235-52.
146. Harcourt J, Alvarez R, Jones LP, Henderson C, Anderson LJ, Tripp RA. Respiratory syncytial virus G protein and G protein CX3C motif adversely affect CX3CR1 (+) T cell responses. Journal of Immunology 2006;176 (3):1600-8.
147. Cepika A-M, Gagro A, Bace A, Tjesic-Drinkovic D, Kelecic J, Baricic-Voskresensky T, et al. Expression of chemokine receptor CX3CR1 in infants with respiratory syncytial virus bronchiolitis. Pediatric Allergy And Immunology: Official Publication Of The European Society Of Pediatric Allergy And Immunology 2008;19 (2):148-56.
148. Amanatidou V, Sourvinos G, Apostolakis S, Tsilimigaki A, Spandidos DA. T280M variation of the CX3C receptor gene is associated with increased risk for severe respiratory syncytial virus bronchiolitis. Pediatric Infectious Disease Journal 2006;25 (5):410-4.
150. Tripp RA, Jones LP, Haynes LM, Zheng H, Murphy PM, Anderson LJ. CX3C chemokine mimicry by respiratory syncytial virus G glycoprotein. Nature Immunology 2001;2 (8):732.
151. Tripp RA, Dakhama A, Jones LP, Barskey A, Gelfand EW, Anderson LJ. The G glycoprotein of respiratory syncytial virus depresses respiratory rates through the CX3C motif and substance P. Journal Of Virology 2003;77 (11):6580-4.
152. Harcourt JL, Karron RA, Tripp RA. Anti-G Protein Antibody Responses to Respiratory Syncytial Virus Infection or Vaccination Are Associated with Inhibition of G Protein CX3C-CX3CR1 Binding and Leukocyte Chemotaxis. The Journal of Infectious Diseases 2004;190 (11):1936-40.
170
153. Viswanathan K, Fruh K, DeFilippis V. Viral hijacking of the host ubiquitin system to evade interferon responses. Current Opinion in Microbiology 2010;13 (4):517-23.
154. Spratt DE, Wu K, Kovacev J, Pan Z-Q, Shaw GS. Selective Recruitment of an E2∼Ubiquitin Complex by an E3 Ubiquitin Ligase. Journal of Biological Chemistry 2012;287 (21):17374-85.
155. Komander D, Rape M. The ubiquitin code. Annual Review Of Biochemistry 2012;81:203-29.
156. Özkan E, Yu H, Deisenhofer J. Mechanistic Insight into the Allosteric Activation of a Ubiquitin-Conjugating Enzyme by RING-Type Ubiquitin Ligases. Proceedings of the National Academy of Sciences of the United States of America 2005;102 (52):18890-5.
157. Gao G, Luo H. The ubiquitin–proteasome pathway in viral infections. Canadian Journal of Physiology & Pharmacology 2006;84 (1):5-14.
158. Uchil PD, Quinlan BD, Wai-Tsing C, Luna JM, Mothes W. TRIM E3 Ligases Interfere with Early and Late Stages of the Retroviral Life Cycle. PLoS Pathogens 2008;4 (2):0001-13.
159. McNab FW, Rajsbaum R, Stoye JP, O’Garra A. Tripartite-motif proteins and innate immune regulation. Current Opinion in Immunology 2011;23 (1):46-56.
160. Nisole S, Stoye JP, Saïb A. TRIM family proteins: retroviral restriction and antiviral defence. Nature Reviews. Microbiology 2005;3 (10):799-808.
161. Ozato K, Shin D-M, Chang T-H, Morse HC, 3rd. TRIM family proteins and their emerging roles in innate immunity. Nature Reviews. Immunology 2008;8 (11):849-60.
162. Munir M. TRIM Proteins: Another Class of Viral Victims. Science Signaling 2010;3 (118).
163. Sardiello M, Cairo S, Fontanella B, Ballabio A, Meroni G. Genomic analysis of the TRIM family reveals two groups of genes with distinct evolutionary properties. BMC Evolutionary Biology 2008;8:225-.
164. Towers GJ. The control of viral infection by tripartite motif proteins and cyclophilin A. Retrovirology 2007;4:40-10.
165. Dorak MT. Real-time PCR [electronic book] / M. Tevfik Dorak (ed.): New York : Taylor & Francis, c2006.; 2006. (BIOS advanced methods).
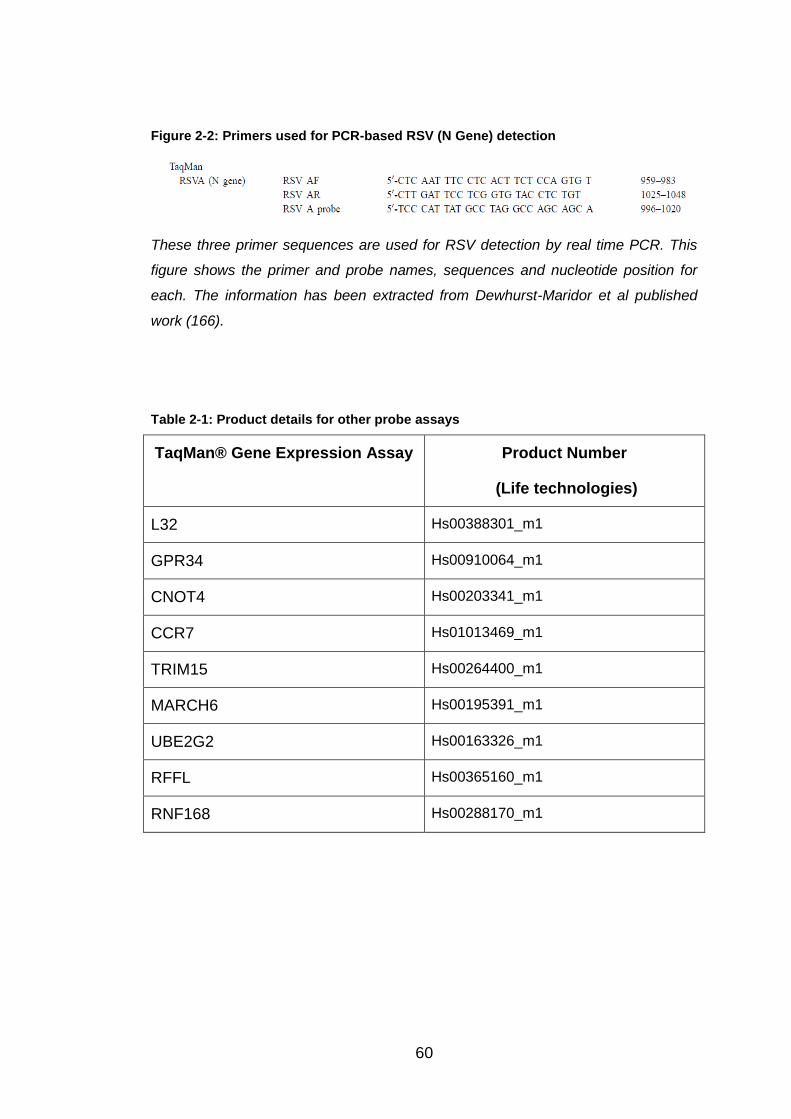
166. Dewhurst-Maridor G, Simonet V, Bornand JE, Nicod LP, Pache JC. Development of a quantitative TaqMan RT-PCR for respiratory syncytial virus. Journal of Virologic Methods 2004;120 (1):41-9.
167. Ju TT, Bocik W, Majumdar A, Tolman JR. Solution structure and dynamics of human ubiquitin conjugating enzyme Ube2g2. Proteins-Structure Function and Bioinformatics 2010;78 (5):1291-301.
168. Bocik WE, Sircar A, Gray JJ, Tolman JR. Mechanism of Polyubiquitin Chain Recognition by the Human Ubiquitin Conjugating Enzyme Ube2g2. Journal of Biological Chemistry 2011;286 (5):3981-91.
169. Arai R, Yoshikawa S, Murayama K, Imai Y, Takahashi R, Shirouzu M, et al. Structure of human ubiquitin-conjugating enzyme E2 G2
170. Norman LL, Bruges J, Sengupta K, Sens P, Aranda-Espinoza H. Cell Blebbing and Membrane Area Homeostasis in Spreading and Retracting Cells (Retracted article. See vol. 99, pg. 2715, 2010). Biophysical Journal 2010;99 (6):1726-33.
171. DeVincenzo J, Lambkin-Williams R, Wilkinson T, Cehelsky J, Nochur S, Walsh E, et al. A randomized, double-blind, placebo-controlled study of an RNAi-based therapy directed against respiratory syncytial virus. Proceedings of the National Academy of Sciences of the United States of America 2010;107 (19):8800-5.
172. Lilley CE, Chaurushiya MS, Boutell C, Landry S, Suh J, Panier S, et al. A viral E3 ligase targets RNF8 and RNF168 to control histone ubiquitination and DNA damage responses. The EMBO Journal 2010;29 (5):943-55.
173. Lilley CE, Chaurushiya MS, Boutell C, Everett RD, Weitzman MD. The Intrinsic Antiviral Defense to Incoming HSV-1 Genomes Includes Specific DNA Repair Proteins and Is Counteracted by the Viral Protein ICP0. PLoS Pathogens 2011;7 (6):1-12.