Triple-tubed rotary core (HQ3 or PQ3) drilling is the most widely used method to obtain high-quality core and
engineering properties of the rock mass where the pit wall or stopes will be excavated. It is not the purpose
of this paper to detail geotechnical core logging procedures, but the following parameters are suggested to
characterise the rock mass and calculate rock mass indices: downhole start and end depths, total core
recovery and core loss, rock quality designation (RQD) measured with reference to natural defects, lithology,
weathering, rock strength, number of open discontinuities, number of joint sets, characteristic joint
roughness, infill thickness and type, alteration for fabric and joints, observations concerning weak structure
and conditions, and any additional observations or comments.
Geotechnical logging can be undertaken on different interval length bases. Some organisations prefer logging
core on a metre-by-metre basis, or on a drilling run basis; others prefer core to be logged on a geotechnical
interval basis, where the core is divided into geotechnically similar intervals based on rock type, weathering,
fracture frequency, and joint infill characteristics. The adopted interval length depends on the variation in
the rock masses encountered, and the standard operating procedures and validation processes in place.
For design purposes, logging on geotechnical intervals is the considered approach as it accounts for weak
zones by treating them separately. This approach is followed by the authors.
Core logging should be undertaken at the drill rig to ensure that the core is as close as possible to its original
state and to avoid disturbance by transportation. If this is not possible, weaker drill runs should be rolled
from barrel splits into PVC splits before being placed into core trays, to avoid disturbance of the materials
before logging is done at the core yard.
2.2 Structural logging
The purpose of structural logging of oriented core is to provide reliable information concerning the nature
and orientation of discontinuity sets within a rock mass. Natural discontinuities include (but are not limited
to) joints, faults, bedding, and foliation, which all need to be clearly identified within the drillcore alongside
their orientation and characteristics.
Suggested data to be recorded for each discontinuity include the following: downhole depth, structure type,
alpha and beta measurements, and reliability of the orientation line for the core run. Shape (planar,
undulating, stepped, irregular), roughness (slickensided, smooth, slightly rough, rough, very rough), infill type
and infill thickness, joint wall alteration, and any additional observations should also be recorded.
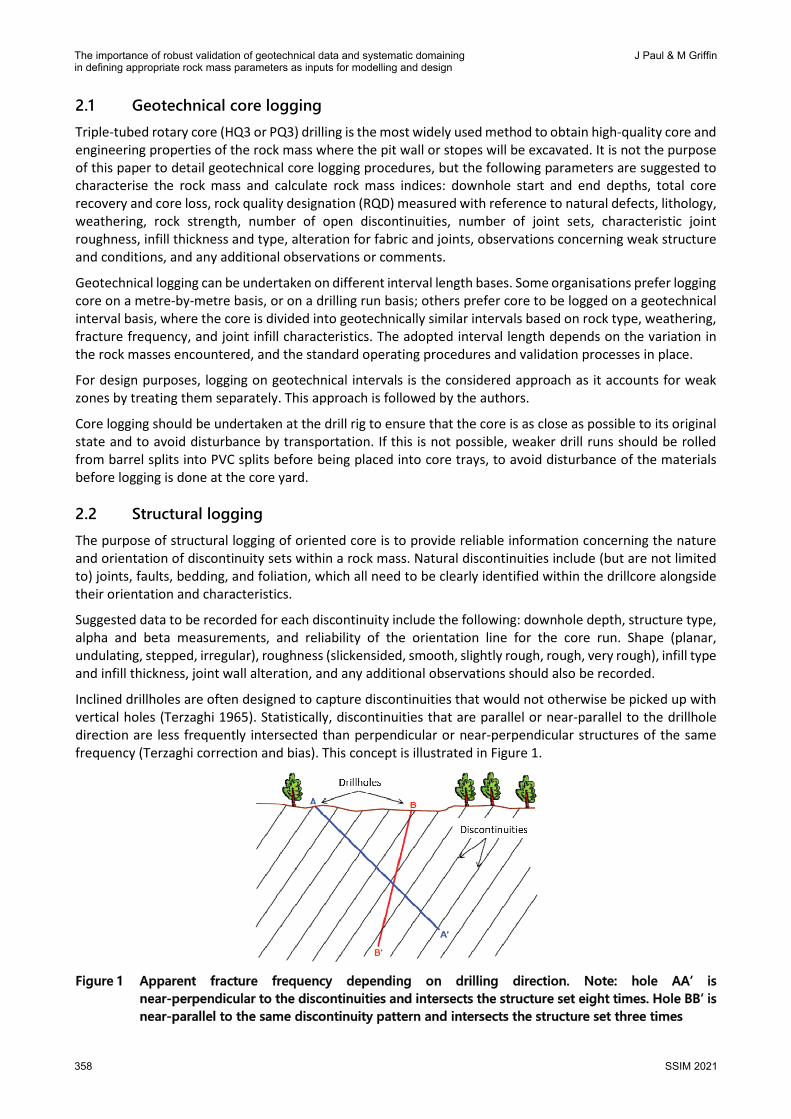
Inclined drillholes are often designed to capture discontinuities that would not otherwise be picked up with
vertical holes (Terzaghi 1965). Statistically, discontinuities that are parallel or near-parallel to the drillhole
direction are less frequently intersected than perpendicular or near-perpendicular structures of the same
frequency (Terzaghi correction and bias). This concept is illustrated in Figure 1.
Figure 1 Apparent fracture frequency depending on drilling direction. Note: hole AA’ is
near-perpendicular to the discontinuities and intersects the structure set eight times. Hole BB’ is
near-parallel to the same discontinuity pattern and intersects the structure set three times
The importance of robust validation of geotechnical data and systematic domainingin defining appropriate rock mass parameters as inputs for modelling and design
J Paul & M Griffin
358 SSIM 2021
The core is oriented at the drill rig by means of one of the available orientation tools allowing alpha and beta
angles to be measured during logging, which can then be converted into in situ dip and dip directions using
a conversation calculation. In areas of friable material, physical orientation of the drillcore can be problematic
(or even unsuccessful), resulting in intervals of the drillhole not being oriented or having a low-reliability
orientation line, thus leading to the orientation of structures being of low confidence.
2.3 Geological units
For a green fields site, geological units should be identified at the exploration stage by an experienced site
geologist, who should provide a crib sheet. This will be a project-specific document that should include all of
the known lithologies encountered and their geological descriptions, including typical and unique
characteristics, maximum assumed thickness, and coloured core photographs to illustrate the described
units. Projects at various stages of development may have more detailed studies on geology that can be
referred to.
2.4 Logging template
Some companies use a complex database for their logging systems with fixed formats that are deliberately
inflexible, to avoid basic errors like typos or invalid entries. This offers some instantaneous checks for the
logger to flag errors or inconsistencies; for example, if an RQD value entry is greater than 100% or if a depth
(from) does not correspond to the end depth of the previous interval. There are dropdown lists providing
options to select rock type, infill minerals and so on.
Other companies choose to adopt a simpler logging template such as a spreadsheet for data entry. This
approach offers more flexibility but can cause more issues and additional validation work. If a company
chooses this option, the professional in charge of developing the template should ensure that in-house
validation tests are implemented to allow some instantaneous checks, for the logger to identify errors.
A good practice is to have the rock mass classification indices directly calculated in the template sheet, and
have a good range of them, for instance, RMR89, RMR90, geological strength index (GSI), Q (or Q'). This could
assist and lead the logger to adjust some logged parameters if the calculated rock mass indices do not seem
to adequately represent the core conditions.
2.5 Sampling
A geotechnical laboratory testing program is essential to determine the rock properties of different materials
encountered, for use in modelling and design.
Geotechnical samples should be taken to ensure that representative samples of all major geological units are
collected. Samples should be selected carefully and wrapped specifically to maintain their in situ properties,
and then transported carefully to an approved laboratory for testing. Care should be taken when selecting
samples; they need to be of a minimum dimension for specific testing to be undertaken. As a rule of thumb,
the length/diameter ratio’s acceptable range is as follow: 1.8 < L/D ratio < 3, in accordance with international
best practice International Standards for Rock Mechanics (ISRM) suggested methods (Hatheway 2009). Also,
selected samples need to be cylindrical, with a smooth core surface and free of vughs or open defects and
preferably free of healed defects.
2.6 Field testing
Geotechnical field testing can be undertaken to provide additional data, such as point load testing (PLT).
Undertaking PLT in the field is a useful and economical tool to augment field strength estimates (Thomas
2014) and increase the opportunity for data comparison with laboratory data and field estimated strength
(FES) values in order to define most appropriate intact rock strength values. Appropriate specific conversion
factors (K) should be carefully selected to derive UCS values (UCS = (K) x Is50 - where Is50 is the point load
strength index normalised to 50 mm diameter core), correlated where possible with laboratory UCS testing.
Constructing geotechnical models
SSIM 2021 359
Although a value of K of 24 is generally quoted (Bieniawski 1975), Bowden et al. (1998) note that the
relationship is variable and appears to be strength dependent. They suggest K should be determined on a
site-by-site basis and that quoted values should not be relied upon (Thomas 2014).
Although widely used, various authors have highlighted a number of limitations of the PLT including
unreliable results at low strengths (less than 25 MPa), scatter of results, and potential influence of anisotropy
resulting in failure trough planes of weakness (Thomas 2014). These issues can be reduced when using the
standard test method published by ISRM (ISRM 1985).
Other field testing includes in situ rock bulk density, hydrogeological testing such as Packer testing, and
pumping tests or installation of vibrating wire and standpipe piezometers, which provide crucial input
parameters for design work.
2.7 Other field investigations
Geotechnical mapping is often undertaken as part of geotechnical investigations to collect continuous
geotechnical data for undisturbed materials with the purpose of building/adjusting the structural model of a
project. There are different types of mapping including window mapping, scanline mapping, cell mapping,
and ground blockiness index mapping, which, depending on the stage of the project, can only be done on
outcrops if at exploration stage or as the pit/stopes develop on the actual mined faces.
Photogrammetry investigations are also a good option to capture structural data on a large-scale without
access restriction issues; they allow assessment of structure orientation, dominance, persistence and
spacing, based on produced 3D images of the photographed objects (pit walls/stopes). This is also a good
tool for operational support and monitoring of slope/stope performances as they develop.
Acoustic/optical televiewer (ATV/OTV) surveys are also often recommended in a drilling program to increase
the volume of and confidence in the structural data. The reliability of ATV/OTV orientation data is generally
higher than that of physical logging data, although discontinuity conditions can only be reliably discerned
from physical logging. ATV surveys improve the quality of the structural data and provide an additional, more
accurate dataset of structure orientations. This is particularly pertinent in zones of low confidence in core
orientation or poor core recovery.
2.8 Challenges
2.8.1 Importance of well-qualified personnel collecting data
Challenges are often faced at the data collection stage. Drilling and core logging quality can be inadequate,
resulting in the acquisition of poor geotechnical data. Selection of a properly experienced drilling contractor
and adherence to appropriate quality assurance/quality control contract procedures is important and is the
responsibility of the project owner (Read 2013).
An additional concern related to a lack of experience for loggers is that many mine site geotechnical engineers
have been educated as mining engineers or sometimes as civil engineers, not geological engineers
(engineering geologists). Some loggers have geological backgrounds and little rock mechanics background,
so even if they are trained to undertake geotechnical logging, their lack of understanding of the mechanical
behaviour of the rock mass makes it difficult for them to collect the most meaningful data.
2.8.2 Geotechnical parameters difficult to assess/log
Apart from issues related to the level of experience of the person doing the logging, some parameters
inherent to geotechnical logging can be difficult to log (even more so if the logger is inexperienced).
2.8.2.1 Field estimated strength
FES can occasionally be difficult to assess. First, there are many scales available which, despite having
similarities, do present differences in the description of the field assessments and in the boundaries of the
The importance of robust validation of geotechnical data and systematic domainingin defining appropriate rock mass parameters as inputs for modelling and design
J Paul & M Griffin
360 SSIM 2021
intact rock strength classes (Thomas 2014). There are several classifications available, such as the ISRM,
national standards (British or Australian), or best practice (US Army Corps of Engineers; Geological Society of
London). Consequently, it can be confusing for the logger to use a classification they are not familiar with,
causing potential mistakes in the FES, especially in very weak or very strong units. Again, a logger with
experience will be more at ease to assess appropriately the FES.
Second, the difficulty of logging a parameter such as strength is that, while there are field classifications
available for the logger, the descriptions are not always suitable for the rocks assessed. Care must be taken
when the rocks exhibit micro defects or anisotropy such as foliation. The selection of core samples for the
FES assessment depends on the encountered rock mass. If micro defects are numerous and small, and
inherent to a specific rock mass domain, the FES assessment should be undertaken on core samples exhibiting
these. There should be no further adjustment of strength as the micro defects are already taken into
consideration (Jakubec 2013). If, however, the micro defects are not typical of a domain, the selected core
samples for testing shouldn’t exhibit these micro defects. In the case of an anisotropic bedded rock mass, the
selected samples would most likely display foliation. The FES should be estimated with caution. If the sample
breaks along a bedding plane, the FES might need to be upgraded to define the appropriate intact rock
strength (IRS) (see Section 4.3.1).
2.8.2.2 Weathering
Weathering is another example of complexity in the logging process. Weathering descriptions differ across
guidelines and are often generic or broad. As such, they can be misleading; for example, highly weathered
materials are not necessarily disintegrated to a soil. In line with best practice, core logging of weathering
recognises the assessment of both intact rock and the rock mass (intact rock plus fractures).
Figure 2 illustrates highly weathered rock core that is not decomposed to a soil; its texture is still visible.
Figure 2 Highly weathered core with preserved rock texture
At sites of known weathering, it may be appropriate to adopt a site-specific approach to weathering. The IRS
(R0 to R6) is combined with the proportion of various-strength materials and the fabric observations to
determine the overall engineering weathering class (1 to 6). The adopted approach is a more objective
approach to weathering identification as it combines two largely objective measurements, i.e. the strength
of the intact material and the percentage of core recovery. The method also ensures a higher degree of
repeatability across a team of logging engineers with different experience.
2.8.2.3 Difficulties in logging soils to soil-like materials
The authors would define a material as ‘soil’ when it is logged with soil strength codes (S1 to S6) and as
soil-like when logged as R0 (extremely weak). Very weak materials are logged as R1. Logging soils to soil-like
materials is difficult and different interpretations have been observed by the authors in the datasets they
reviewed as detailed:
• A high defect count (number of natural open defects) and a high joint set number (four or five),
presumably to generate a low calculated rock mass classification value, and RQD = 0.
Constructing geotechnical models
SSIM 2021 361
• A low (or even zero) defect count and a low set number (as few joints could be positively identified
in such materials), with RQD equal to 100% resulting in a rock mass classification index that is too
high and not reflective of the actual encountered material.
First comment is the relevance of using RQD to characterise such materials. RQD is aiming at characterising
sound rocks. Pieces of core that are not ‘hard and sound’ should not be counted for the RQD even though
they possess the requisite 100 mm length (Deere & Deere 1988). The assessment of soundness is not well
defined though. Some would base their judgement on weathering, some on strength or both can also be
considered, and the threshold might also be different from a professional to another. The highly weathered
materials shouldn’t categorically be considered as ‘non-sound’ rocks as the highly weathered materials are
not necessarily weathered to soil-like materials (see Section 2.8.2.2). The authors suggest assessing the
soundness of a material, considering both the FES and weathering of a material, FES usually prevailing. As a
common practice, materials with strength equal or lower than R1 are usually attributed a zero RQD.
The second aspect is that rock mass classification indices are not designed to be assigned to soil and soil-like
materials and these should be characterised differently, using laboratory results (triaxial testing and direct
shear testing (DST)) for example (Warren et al. 2015). So, the attribution of RQD values becomes less
important because these materials should not be characterised with rock mass rating (RMR) indices.
Judgement needs to be made for the characterisation of very weak materials (R1), as these materials still
have their texture but are often highly weathered. In previous project experience, the authors have often
defined these materials with a zero RQD but with RMR indices as structures could often be identified and
characterised.
2.8.2.4 Rock quality designation
As explained in Section 2.8.2.3, the use of RQD as a parameter in Bieniawski’s RMR (RMR89) system presents
some challenges but RQD is important to be captured adequately because this is an input that accounts for
20% in the RMR89 calculation and is also a direct input in Q calculation. It is highly subjective and often
inconsistent, so it must always be used with engineering judgement that takes proper account of the
geological characteristics of the rock mass being classified (Read & Stacey 2009).
One of the important sources of error that specifically detracts from RQD’s usefulness as a parameter, as
reported by Brown (2003) and Hack (2002), is the arbitrary and abrupt boundary of 100 mm of unbroken
rock. Small difference in joint spacing can produce large differences in the RQD value. A rock mass with joint
spacing of 9 cm has an RQD of 0%. In comparison, a rock mass with joint spacing of 11 cm has an RQD of
100%. Hence, it is important to carefully identify the natural defects and not overestimate the count by
considering mechanical breaks. Otherwise, the RQD resulting would be underestimated.
It is often difficult to distinguish natural open defects from drilling-induced breaks, but several criteria can help
to correctly classify defects, such as mineral coating or the profile of the defect surface. In case of doubts, the
authors would suggest logging a break as natural but also advice against logging all the breaks as natural, as it
will be too conservative. The RMR system relies largely on the identification of natural open structures, which
account for 70–80% of the total RMR rating (when adding up the ratings obtained from RQD, discontinuity
spacing and characterisation), so it is crucial that artificial breaks are discarded from the logging process.
Another aspect mentioned by Brown (2003) and Hack (2002) is the fact that the RQD is also biased by the
orientation of the drillhole with respect to the joint orientation (Read & Stacey 2009).
3 Data validation
It is important to undertake robust validation of data, focusing on identifying limitations or apparent
inconsistencies and assessing the sufficiency of the data for rock mass and rock fabric characterisation. This
characterisation is used to derive input properties to use in subsequent geotechnical modelling and for design
purposes. Validation should be undertaken on logging data including geotechnical and structural data, and
field testing and laboratory results.
The importance of robust validation of geotechnical data and systematic domainingin defining appropriate rock mass parameters as inputs for modelling and design
J Paul & M Griffin
362 SSIM 2021
3.1 Geotechnical logging data
Some common visible errors or inconsistencies observed in geotechnical logging databases include:
• Incorrectly entered parameters or typographical errors.
• Undefined logging codes.
• Parameters outside logical ranges.
• Missing values.
• Inconsistencies between different parameters.
Observations, tools, and suggestions have been developed by the authors to identify these errors in order to
assess and improve datasets. These are described in the following subsections.
3.1.1 Simple data checks for incorrect parameters
Validation checks should be implemented to identify any typographical errors or logging codes that are not
defined in the logging template/manual. Data entry values should not be outside the typical range for each
of the main input parameters for various rock mass classification calculations. When an ‘error’ is highlighted,
the raw data should be left as originally logged and the parameters amended/modified in newly created
columns. Examples of simple checks include:
• The interval length should be checked against core recovery and core loss, assuming an interval
could not have a recovery greater than 100%.
• RQD values should not be greater than 100%.
• RQD values for weak materials (or soils) with a hardness (FES) of R1 or below are recommended to
be set to 0%.
3.1.2 Validation check: discontinuity spacing and rock quality designation
One of the standard data checks performed is to plot RQD against joint spacing, as there should be a
reasonable correlation between these two parameters. The authors suggest using the published Bieniawski
graph (Bieniawski 1979) (RQD versus discontinuity spacing), which shows the range of joint spacing values
expected for the logged RQD. Figure 3 shows an example of the correlation between RQD and discontinuity
spacing data for a particular project. Points falling outside accepted typical average range (red curves) may
be considered as outliers.
Figure 3 Correlation between joint spacing and rock quality designation
The authors suggest producing a graph like that shown in Figure 3 for each hole during logging, to check if
the RQD and defect spacing being logged are appropriate and consistent between loggers.
Constructing geotechnical models
SSIM 2021 363
The person in charge of the data validation should also produce such a graph for each hole and check the
intervals falling outside the typical curve. These intervals should be flagged and verified by core photo
examination/photologging.
3.1.3 Validation check: defect count and defect set number (number 0.5 to 5)
Checks can also be implemented between joint set number (0 to 5: 0 for massive and 5 for crushed or soil)
and defect count (number of natural open defects) for an extra level of validation. Joint set number is not an
input for the RMR calculation but is for Q calculation. Figure 4 shows areas of inconsistency between defect
count and joint set number, reported for a particular project, indicated by red rectangles where many natural
defects have been logged but a low set number has been assigned, or few defects have been recorded but a
high set number has been assigned. This is especially evident at the extremities. Some of the cases highlighted
in red correspond to the cases mentioned in Section 2.8.2.3. In this project, for example, one logger had
logged soil-like materials with a high defect count but with a set number of 0 or 1; another logger had logged
the soil-like materials with a low defect count but with a set number of 4 or 5. This illustrates the importance
of consistency between logging practices. As mentioned earlier, the soil-like materials are not suggested to
be characterised with rock mass classifications anyway so these inconsistencies were not crucial. For the
other inconsistencies reported at extremities, validation through comparison with the RQD or joint spacing
should help identify the inappropriate parameters. Alternatively, core photo examination is also an option.
Figure 4 Comparison between defect count and joint set number
3.1.4 Validation check: rock quality designation and field estimated strength
Weak materials with an FES below 5 MPa are sometimes given an RQD, which is incorrect practice as this
parameter is not suitable for characterisation of very weak to soil-like materials. As such, RQD values are
suggested to be changed to zero for materials with an FES of R1 or lower.
3.1.5 Validation check: weathering and field estimated strength
An extremely or highly weathered interval is not expected to be strong or very strong. Fresh materials are
also rarely extremely weak or are not soil strength materials unless they are highly altered.
Core photos can be examined to assess the logged weathering and compare it with the logged strength. The
parameters can then be amended after core examination.
It is important to remember that core photos can be deceptive for gauging strength and weathering so although
a material may look discoloured/weathered, it could have retained its strength and textural properties.
3.1.6 Missing data
Another aspect to consider while reviewing datasets is missing data. Many of the datasets received from
mining companies have missing logging geotechnical parameters that are necessary for calculating the rock
The importance of robust validation of geotechnical data and systematic domainingin defining appropriate rock mass parameters as inputs for modelling and design
J Paul & M Griffin
364 SSIM 2021
mass classification system indices (values), which in turn are used to derive the input properties for stability
assessments and numerical modelling. If such parameters are missing, rock mass classification indices cannot
be calculated for that interval, so there is a risk that the rock mass is characterised only some of the time.
Options to address this include either relogging/photologging to capture missing data or using assumptions.
3.1.7 Review versus assumptions
When a parameter is missing, or when an inappropriate parameter has been identified, it is possible to
amend it through relogging or by core photo examination. However, some parameters such as FES or defect
infill characteristics (infill type, roughness and infill thickness) cannot be obtained through examination of
core photographs. These infill parameters require examination of actual cores, remembering that core
deteriorates with time, and strength is affected by the degradation process. In some cases, core photographs
might not be available or do not represent the recovered core run.
When inconsistencies have been highlighted and two parameters are involved, for example, between RQD
and joint spacing, it is possible to amend the reported inconsistencies after comparison with core
photographs. However, this is not always possible, depending on the involved parameters and the extent of
weathering. As discussed in Section 3.1.5, assessments of photographs need to be made cautiously.
Sometimes a scope of work excludes photologging of individual intervals, or the data are so numerous that
it becomes impractical to review individual intervals. In these instances, assumptions can be used to amend
inappropriate (outlier) values or to capture originally missing parameters.
If one of the two parameters is observed as being incorrect, it is reasonable to assume the other parameter
is correct and fit for use. For example, FES can be correlated to rock type and weathering, and defect
conditions can be based on typical infill conditions observed from existing data, correlated with lithologies.
3.1.8 Data status
As mentioned previously, the authors suggest creating additional columns and using different coloured cells
for amended data but retaining the raw data in the original columns for reference. Further, creating
additional columns for each main geotechnical parameter is suggested, to provide the status of the
considered parameter and indicate if an interval has a value for the geotechnical parameter considered.
Particular cases are suggested as follows:
• The mention of ‘Value’ indicates that the parameter considered has a value based on the raw data.
• The mention of ‘Value revised by core examination’ indicates that a value was amended/assumed
by photologging.
• The mention of ‘Value based on assumptions’ indicates that the parameter has a value
derived/assumed based on representative values.
• The mention of ‘Missing value’ indicates that the parameter is missing (no assumption was made
or photologging undertaken to amend/capture this parameter).
• The mention of ‘Literature’ indicates that in the absence of raw data or derived values, the
parameter has been estimated from literature (published or in-house site reporting) values or
similar site values.
The clean amended data can be used to calculate rock mass classification values for each geotechnical
interval (see Section 4.1). Summaries and charts can be produced considering the amended dataset or just
the raw data, allowing analysis of the impact of the validation on the summary rock classification values.
Constructing geotechnical models
SSIM 2021 365
3.2 Structural data
Structural data provide key inputs for slope designs because they form the basis of kinematic analyses, which
allow the determination of the main failure mechanisms. Structural data can be obtained from different
sources, as detailed in the previous sections.
After the collection of structural data onsite, data are collated and stereonets of structural data are
generated. Stereonets are analysed to identify structural domains (sets), which are used for batter kinematic
failure assessment and stability analyses. This allows for optimum batter/berm configurations to be
identified.
If ATV/OTV data are available, part of the validation work includes the reconciliation of these data against
the physical structural logging data. Occurrence of structures and major sets, their depths, the
aperture/thicknesses of these structures, type of defects, and orientation of defects should all be compared.
As part of this comparison, core photos should be examined and compared with the downhole ATV/OTV
log/image. Stereonet plots should be compiled for logging data versus ATV/OTV data.
Figures 5 and 6 show examples of correlation between physical logging and ATV interpretation.
Figure 5 Correlation between a fault zone identified during core logging and the same one observed on
the acoustic televiewer (ATV) log and optical televiewer (OTV) image. Depth and thickness are
matching
Figure 6 Stereonet correlation between acoustic televiewer (ATV) and logging data. Foliation orientation
is similar between the two data sources
The importance of robust validation of geotechnical data and systematic domainingin defining appropriate rock mass parameters as inputs for modelling and design
J Paul & M Griffin
366 SSIM 2021
Mapping data should also be reconciled with structural data obtained from logging. The main structural set
orientations and defect conditions (infill and roughness) should be compared between the two data sources.
3.3 Laboratory testing results
3.3.1 Testing required
Laboratory strength tests should include a diverse set of test types and a minimum number of samples for
each test to provide an understanding of the data reliability and variability.
A minimum number of samples for compression testing (uniaxial or triaxial), direct shear and/or tensile
strength tests should be taken per rock type in accordance with ISRM suggested methods (Hatheway 2009).
Selected samples should show a range of weathering grades, alteration, and anisotropic features.
3.3.2 Laboratory results validation
It is not the purpose of this paper to go in details into the analysis and interpretation of laboratory results, but
a few aspects in the validation of laboratory results are mentioned below. Samples before testing which show
irregular core surfaces or exhibit vughs or defects should be cautiously considered. Samples which are not
within the acceptable length/diameter ratio (1.8 < L/D ratio < 3) should also be used with caution (Hatheway
2009). Particular attention should be given to the mode of failure and to the aspect of the failure surface.
Examining the photos before and after a test can give important insight on the validity of the test performed.
The results provided by the laboratory should not always be used as provided, but analysed, validated, and
amended, if necessary. In some cases, laboratory testing results do not reflect the expected behaviour of the
tested samples, and such results may be required to be discarded. For example, in foliated samples, failure
could occur along a foliation plane so the resulting unconfined compressive strength provided by the
laboratory does not reflect the IRS of the sample and this value may not be considered for direct use in
assessing the input properties. It is important that the professional analysing the laboratory results uses their
engineering judgement to analyse the validity of a test result and discard inappropriate results.
In another example related to triaxial testing, the peak selected by the laboratory for deriving the properties
may be considered inappropriate by the expert completing the design, and a different interpretation then
applied to obtain the input parameters required. When validating triaxial data, it is a good practice to check
the different diagrams and charts produced by the laboratory, i.e. the Mohr circle diagram, the stress path
diagrams, and the deviator stress versus strain diagram to help select and derive the peak values for
appropriate properties.
Saw cut results also need to be validated as they are often reported with cohesion, which is inappropriate,
so these results should be used with caution or reinterpreted.
4 Rock mass domaining
It is not the purpose of this paper to describe the domaining process in full detail. Rather, the authors
emphasise the importance of a systematic approach to understand data reliability and variability.
4.1 Classification systems
Using consolidated geotechnical logging data, rock mass classification system indices (values) are calculated
for each geotechnical interval.
Several rock mass classification system indices can be calculated for each interval (where the required input
parameters are available), as detailed in the following sections. For open pit studies, Bieniawski’s RMR
(RMR89), Laubscher’s RMR (RMR90), and GSI are commonly used. For underground rock masses, Q and GSI
are most commonly used, with RMR89 used as a supporting classification system.
Constructing geotechnical models
SSIM 2021 367
4.1.1 RMR89 (Bieniawski 1989)
RMR89 values are calculated from the following geotechnical parameters: IRS, RQD, joint spacing (Js), joint
condition, and groundwater.
4.1.2 RMR90 (Laubscher 1990)
RMR90 values are calculated from the following parameters: either option A (IRS, fracture frequency per
metre (ff/m), and joint condition) or option B (IRS, RQD, joint spacing and joint condition).
4.1.3 Mining rock mass rating
To simulate the response of a rock mass in a mining environment, percentage adjustments are applied to
RMR values to obtain mining rock mass rating (MRMR) values. Using the MRMR classification
(Laubscher 1990), as adapted for slope design (Haines et al. 1991), provides a means to assess indicative
overall slope angles.
4.1.4 Geological strength index
Hoek (1994) and Hoek et al. (1995) introduced the GSI as a tool for collecting field information. The GSI
classification was set up to address the two principal factors considered to have important influences on the
mechanical properties of a rock mass: the structure (or blockiness) and the condition of the joints.
GSI can be used to estimate the Hoek–Brown constants mi and s, and these are defined by the Hoek and
Brown criterion. GSI can be used to derive uncertain parameters from empirical equations given by Hoek et
al. (2013).
4.1.5 Q′ index (Norwegian Geotechnical Institute 2015)
The Q-system expresses the quality of the rock using a logarithmic scale, on which design and support
recommendations for underground excavations can be based. Q' (Q prime) describes the rock mass in terms
of the joint spacing, number of sets and defect roughness, and infill or alteration.
4.2 Domaining process
Following the data validation stage is the domaining process, which involves data interpretation. The data
collected in the field from different sources are collated, validated, and interpreted to define the geotechnical
model. This model is an amalgamation of the structural, geological, hydrogeological, and rock mass models.
Typically, the level of confidence associated with each component varies. Depending on the project stage
and geotechnical environment, the relative importance of each component also varies.
During the domaining process, data reliability and variability need to be assessed. To produce a robust
dataset, various scenarios should be tested and compared.
Data reliability should be assessed by asking some key questions, assuming logging data validation was
undertaken:
• Should drillholes with a low volume of original logging data be incorporated in the assessment?
• Should the data from such drillholes be incorporated with or without the assumptions made?
• How much do the rock mass indices vary with and without consideration of the assumptions made
to replace the original missing parameters?
Data variability raises another series of questions:
• Which drillholes should be used for the characterisation of underground infrastructure or for
analysis of a particular pit wall?
• Should the data be domained geographically, or just by main rock type or weathering?
The importance of robust validation of geotechnical data and systematic domainingin defining appropriate rock mass parameters as inputs for modelling and design
J Paul & M Griffin
368 SSIM 2021
• Should this specific unit be treated as a separate lithology/domain?
• Is this unit weaker than, or behaving differently to, the broader rock type?
• Should this highly permeable or highly altered zone or this major structure be domained separately
in any numerical analyses?
• Is there an actual 3D shape interpretation for this unit or for this major structure to use as a material
boundary in any numerical analyses?
To answer these questions, the data need to be analysed considering different scenarios or datasets. Then,
by comparing the rock mass classification values for each scenario tested, final domains can be defined.
Once rock mass domains are defined, properties are derived for each domain based on the logging data
analyses and laboratory testing results.
4.3 Rock mass model
4.3.1 Intact rock strength
Intact rock is defined as rock that contains no apparent structural defects. The IRS may be assessed based on
the FES, laboratory UCS tests, and PLT results. The FES values are determined for an interval during logging,
while PLT and UCS data are measured for individual samples (i.e. they are point data). Based on the FES, UCS,
and PLT values, a suitable single IRS value may be selected using engineering judgement for the
assessed material.
Length-weighted mean values should be determined for the FES. Length-weighted means are calculated by
multiplying the representative value (in this case the FES) for each interval by the interval length, summing
these values for all intervals, and then dividing the sum by the total length of all intervals.
Challenges are encountered in the characterisation of the IRS, especially for anisotropic rock masses.
• The FES can be wrongly assessed on site by the logger. While there are ISRM field test guidelines
available for the logger, the descriptions are not always suitable for some rocks, such as for
anisotropic rocks (see Section 2.8.2.1).
• Samples can break along foliation planes, resulting in low UCS values that are not representative of
the IRS. Those UCS values may need to be discarded for direct use in assessing the input properties
for stability analyses.
• Regarding PLT, correlation factors (see Section 2.6) may not always be reliable for obtaining
corresponding UCS values, for the same reasons as explained earlier.
4.3.2 Defect shear strength
Discontinuity shear strength is needed for discrete structures that could have an impact on slope stability.
The shear strength of the bedding planes may be critically important, especially when the stability of pit walls
is expected to be structurally controlled by bedding planes within banded rock. Defect characteristics such
as surface roughness, infill type, infill thickness, and joint alteration control discontinuity shear strength.
These parameters recorded during field logging should be analysed for all stratigraphic units, differentiating
certain stratigraphic units. Typically, the joint roughness coefficient and the joint wall compressive strength
data are summarised for use in Barton–Bandis analyses to estimate the shear strength of discontinuities with
the use of a suitably constructed tilt table.
In the first instance, shear strength parameters can be determined:
• Directly from laboratory DST and saw cut testing.
• Semi-quantitatively via a combination of laboratory testing and discontinuity logging parameters.
Constructing geotechnical models
SSIM 2021 369
The Mohr–Coulomb and Barton–Bandis criteria are widely used to estimate discontinuity shear strength.
4.3.3 Rock mass shear strength
Rock mass shear strength parameters can be determined using different failure criteria.
4.3.3.1 Hoek–Brown criterion
The generalised Hoek–Brown failure criterion for rock masses is widely accepted and used around the world
(latest version is Hoek & Brown 2019). It is typically applied to characterise stronger discontinuous rock
masses. Consequently, it is only applicable to consideration of larger inter-ramp slopes and overall pit slopes.
Input parameters for the generalised Hoek–Brown criterion are as follows:
• Intact rock properties, comprising UCS and material constant for intact rock (mi).
• Broken rock parameters, comprising GSI and disturbance factor (D).
• Maximum horizontal stress.
Yet, there are challenges associated with this criterion on the selection of appropriate values.
How to select appropriate GSI values
The primary option is to use the RMR89 classification converted to GSI (RMR-5) for rock mass ratings greater
than 23 (Hoek & Brown 1997). On occasion, it may be possible to estimate the GSI from high-quality
core photographs.
Another option is to rearrange the correlations suggested by Hoek et al. (2013) based on the RMR89, Q,
One of the challenges for engineers is choosing appropriate mi values. It is not the purpose of this paper to
discuss the selection of meaningful values. Three methods are commonly used for estimating the
Hoek–Brown constant mi: regression analysis, guidelines, and the R index. The choice of method depends on
the quantity and quality of data. If no data are available, literature values (Cai 2010) should be adopted
with care.
How to select appropriate D values
The disturbance factor (D) reflects the effect of relaxation and blasting on the slope. Guidance for selection
of an appropriate D value should follow the guidelines by Hoek (2012).
4.3.3.2 Mohr–Coulomb criterion
For weaker materials such as detrital materials, for which the Hoek–Brown failure criterion is not considered
applicable, the Mohr–Coulomb criterion is usually applied and triaxial test results are used to derive the
Mohr–Coulomb strength parameters (c and ϕ).
4.3.3.3 Other empirical criteria
Other criteria such as the Call et al. (2000) approach is not recommended due to being poorly adopted in the
international mining sector and their complex data requirements.
5 Conclusion
Data validation is essential because design confidence relies on the properties derived from analysis of
various types of acquired data. There are no shortcuts that replace working systematically through robust
validation and detailed domaining processes to ensure the reliability and variability of data are well
The importance of robust validation of geotechnical data and systematic domainingin defining appropriate rock mass parameters as inputs for modelling and design
J Paul & M Griffin
370 SSIM 2021
understood. Breaking this daunting task down into manageable steps and asking key questions about the
data makes it a more sustainable and rewarding task.
Acknowledgement
The authors are grateful to the many current and former colleagues who have participated in interesting
discussions on the validation of geotechnical data issues over the years. They are too many to list individually,
but cover the full spectrum of industry, consulting, and university. They are all known and appreciated.
References
Bieniawski, ZT 1975, ‘The point-load test in geotechnical practice’, Engineering Geology, vol. 9, pp. 1–11.
Bieniawski, ZT 1979, ‘The geomechanics classification in rock engineering applications’, Proceedings of the 4th Congress of
International Society of Rock Mechanics, volume 2, Balkema, Rotterdam, pp. 41–48.
Bieniawski, Z 1989, Engineering Rock Mass Classifications: A Complete Manual for Engineers and Geologists in Mining, Civil, and
Petroleum Engineering, John Wiley & Sons, Hoboken.
Bowden, AJ, Lamont-Black, J & Ullyott, S 1998, ‘Point load testing of weak rocks with particular reference to chalk’, Quarterly Journal
of Engineering Geology and Hydrogeology, vol. 31, pp. 95–103.
Brown, ET 2003, Block Caving Geomechanics, Julius Kruttschnitt Mineral Research Centre, University of Queensland, Brisbane.
Cai, M 2010, ‘Practical estimates of tensile strength and Hoek–Brown strength parameter mi of brittle rocks’, Rock Mechanics and
Rock Engineering, vol. 43, no. 2, pp. 167–184.
Call, RD, Cicchini, PF, Ryan, TM, & Barkley, RC 2000, ‘Managing and analysing overall pit slopes’, in WA Hustrulid (ed.), Slope Stability
in Surface Mining, Society for Mining, Metallurgy and Exploration, Littleton, pp. 39–46.
Deere, DU & Deere, DW 1988, ‘The rock quality designation (RQD) index in practice,’ in L Kirkaldie (ed.), Rock Classification Systems
for Engineering Purposes, ASTM STP 984, American Society for Testing and Materials, Philadelphia, pp. 91–101.
Fillion, MH & Hadjigeorgiou, J 2016, ‘Implications of collecting additional data for slope design in an open pit operation’, Journal of
the Southern African Institute of Mining and Metallurgy, vol. 116, no. 5, pp. 357–366.
Hack, R 2002, ‘An evaluation of slope stability classification’, Proceedings of Eurock 2002, International Society for Rock Mechanics
and Rock Engineering, Lisbon, pp. 3–21.
Haines, A, Terbrugge, PJ, & Carrieri, G 1991, ‘Preliminary estimation of rock slope stability using rock mass classification systems’,
Proceedings of the 7th ISRM Congress, International Society for Rock Mechanics and Rock Engineering, Lisbon, vol. 30, issue 3,
https://doi.org/10.1016/0148-9062(93)92931-f
Hatheway, AW 2009, ‘The complete ISRM suggested methods for rock characterisation, testing and monitoring; 1974–2006’,
Environmental and Engineering Geoscience, vol. 15, no. 1, pp. 47–48.
Hoek, E 1994, ‘Strength of rock and rock masses’, ISRM News Journal, vol. 2, no. 2, pp. 4–16.
Hoek, E, Kaiser, PK & Bawden, WF 1995, Support of Underground Excavations in Hard Rock, Balkema, Rotterdam.
Hoek, E & Brown, ET 1997, ‘Practical estimates or rock mass strength’, International Journal of Rock Mechanics & Mining Science,
vol. 34, no. 8, pp. 1165–1186.
Hoek, E 2012, Blast Damage Factor D, https://www.rocscience.com/documents/pdfs/rocnews/winter2012/Blast-Damage-Factor-D-
Hoek.pdf
Hoek, E, Carter, TG & Diederichs, MS 2013, ‘Quantification of the geological strength index chart’, Proceedings of the 47th US Rock
Mechanics/Geomechanics Symposium, American Rock Mechanics Association, Alexandria.
Hoek, E & Brown, ET 2019, ‘The Hoek–Brown failure criterion and GSI–2018 edition’, Journal of Rock Mechanics and Geotechnical
Engineering, vol. 11, no. 3, pp. 445–463.
ISRM 1985, ‘Suggested method for determining point load strength’, International Journal Rock Mechanics & Mining Science, vol. 22,
pp. 51–60.
Jakubec, J 2013, 'Role of defects in rock mass classification', in Y Potvin & B Brady (eds), Ground Support 2013: Proceedings of the
Seventh International Symposium on Ground Support in Mining and Underground Construction, Australian Centre for
Geomechanics, Perth, pp. 337–344.
Laubscher, DH 1990, ‘A geomechanics classification system for the rating of rock mass in mine design’, Journal of the Southern African
Institute of Mining and Metallurgy, vol. 90, no. 10, pp. 257–273.
Norwegian Geotechnical Institute 2015, Q-system Quick Reference 2015, Norwegian Geotechnical Institute, Oslo.
Read, J & Stacey, P 2009, Guidelines for Open Pit Slope Design, CSIRO Publishing, Collingwood.
Read, JRL 2013, 'Data gathering, interpretation, reliability and geotechnical models', in PM Dight (ed.), Slope Stability 2013:
Proceedings of the 2013 International Symposium on Slope Stability in Open Pit Mining and Civil Engineering, Australian Centre
for Geomechanics, Perth, pp. 81–89, https://doi.org/10.36487/ACG_rep/1308_0.5_Read
Terzaghi, RD 1965, ‘Sources of error in joint surveys’, Géotechnique, vol. 15, no. 3, pp. 287–304.
Thomas, RD 2014, Characterizing intact rock strength using field estimates and the point load index test’, Proceedings of the 48th US
Rock Mechanics/Geomechanics Symposium, American Rock Mechanics Association, Alexandria.
Constructing geotechnical models
SSIM 2021 371
Warren, SN, Kallu, RR & Barnard, CK 2015, ‘Correlation of the rock mass rating system (RMR) to the unified soil classification system
(USCS) for geotechnical characterization of very weak rock masses’, Proceedings of the 49th US Rock
Mechanics/Geomechanics Symposium, American Rock Mechanics Association, Alexandria.
The importance of robust validation of geotechnical data and systematic domainingin defining appropriate rock mass parameters as inputs for modelling and design