20
The importance of scholarly information in the research process Endre Béky Account Manager ELSEVIER B.V. Date: April 14, 2009
| Date post: | 25-Dec-2015 |
| Category: |
Documents |
| Upload: | cecil-higgins |
| View: | 213 times |
| Download: | 0 times |

The importance of scholarly information in the research process
Endre BékyAccount ManagerELSEVIER B.V.
Date: April 14, 2009

2
Dissemination, by scientific publishers, of high quality scientific output across the globe is a crucial part of research
In recent years the move from paper to electronic content delivery has drastically changed researchers time-spending
Researchers are able to spend significantly less time on searching for relevant content and at the same time have access to a wider range of content
At the same time the increase of usage clearly positively affects the quantity and quality of scientific output
Comparing macro-economic and demographic data with the uptake of usage and scientific output enables decision-makers to analyze the productivity and efficiency of their investments
Elsevier has invested heavily in the increase of productivity and efficiency of researchers all over the world through the ScienceDirect platform, Scopus and many other highly specialized products
Introduction
Introduction

3
Solicit and manage
submissionsManage peer
review
Production
Publish and disseminate
Edit and prepare
Archive and promote
• 1,000 new editors per year• 18 new journals per year
• >500,000+ article submissions per year
• 200,000 referees• 1 million referee reports
per year
• 7,000 editors• 70,000 editorial board
members• 6.5 million author/publisher
communications per year
• >250,000 new articles produced per year• 180 years of back issues scanned, processed and data-tagged
• 10 million researchers• 4,500+ institutions• 180+ countries• >300 million+
downloads per year• 2.5 million print pages
per year
• 8 million articles now available
• Organise editorial boards• Launch new specialist
journals
• 40%-90% of articles rejected
Introduction
Elsevier is the leading S&T publisher with a market share of 20-25%

4
Author Gateway and Elsevier Editorial
Systems$15 million
eJournal BackfileseReference Works
$40 million
Production Tracking System$5 million
ScienceDirect ScopusScirus
eNewsletters and alerts >$200 million
Estimated cumulative investment since 2000
Electronic Warehouse$15 million
Introduction
Elsevier invests significantly to service its Academic, Government and Corporate clients in the most efficient way
Solicit and manage
submissionsManage peer
review
Production
Publish and disseminate
Edit and prepare
Archive and promote
• Organise editorial boards• Launch new specialist
journals
5
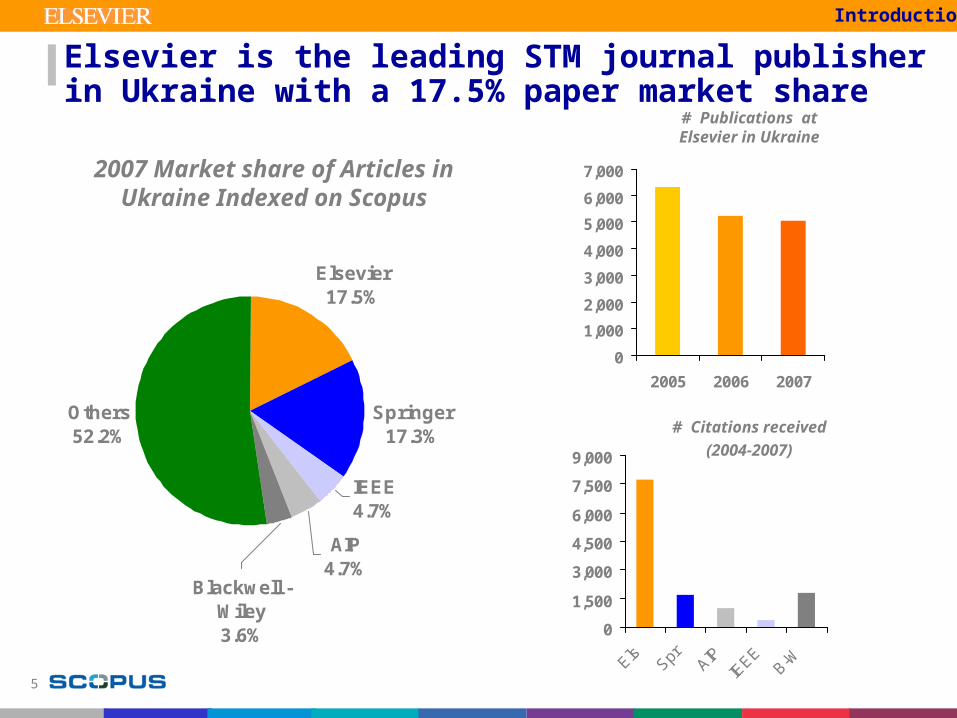
Elsevier is the leading STM journal publisher in Ukraine with a 17.5% paper market share
Introduction
Elsevier17.5%
Springer17.3%
IEEE4.7%
AIP4.7%
Others52.2%
Blackwell -Wiley3.6%
2007 Market share of Articles in Ukraine Indexed on Scopus
0
1,500
3,000
4,500
6,000
7,500
9,000
ElsSpr AIP
IEEE
B-W
# Citations received
(2004-2007)
0
1,000
2,000
3,000
4,000
5,000
6,000
7,000
2005 2006 2007
# Publications at Elsevier in Ukraine

6
Assets/ Assets/ LaboratoriesLaboratories
Access to Access to ContentContent
Resources/ Resources/ ResearchersResearchers
High Performance
ResearchEngine
The training and Physical The training and Physical fitness of the athletefitness of the athlete
(Indicated by demographic data)
A good position A good position at the startat the start
(Research performance indicators)
The Quality of The Quality of your shoesyour shoes
(Elsevier provides high quality access)
Introduction
Research is like running a marathon…

7
Macro-economics
Haile finishing first in the 2007 marathon of Berlin in a new world-record of 2 hours 4 minutes and 26 seconds
Haile GebrselassieBorn: 18-04-1973Nat.: Ethiopian
The training and physical fitness of the athlete

8
0 20 40 60 80
Ukraine
Hungary
Czech Republic
Spain
United Kingdom
Population(X Mio) Growth rate
0.3%
0.1%
-0.1%
-0.3%
-0.7%
0 10000 20000 30000
R&D Spend(X Mio $) (%) of GDP
1.7%
1.1%
1.4%
1.0%
1.1%
0 500 1000 1500 2000 2500
Ukraine
Hungary
Czech Republic
Spain
United Kingdom
GDP (PPP)(X Bln $) Growth rate
2.8%
3.9%
6.4%
3.9%
7.1%
0 50 100 150 200
# of researchers(X Thousand)
(%) of total population
0.27%
0.26%
0.24%
0.16%
- %
Macro-economics
Source: CIA world book of facts 2007, UNESCO, All values are against GDP(PPP)
Economic growth in Ukraine is above UK, however R&D Spendand # of researchers can be improved
9
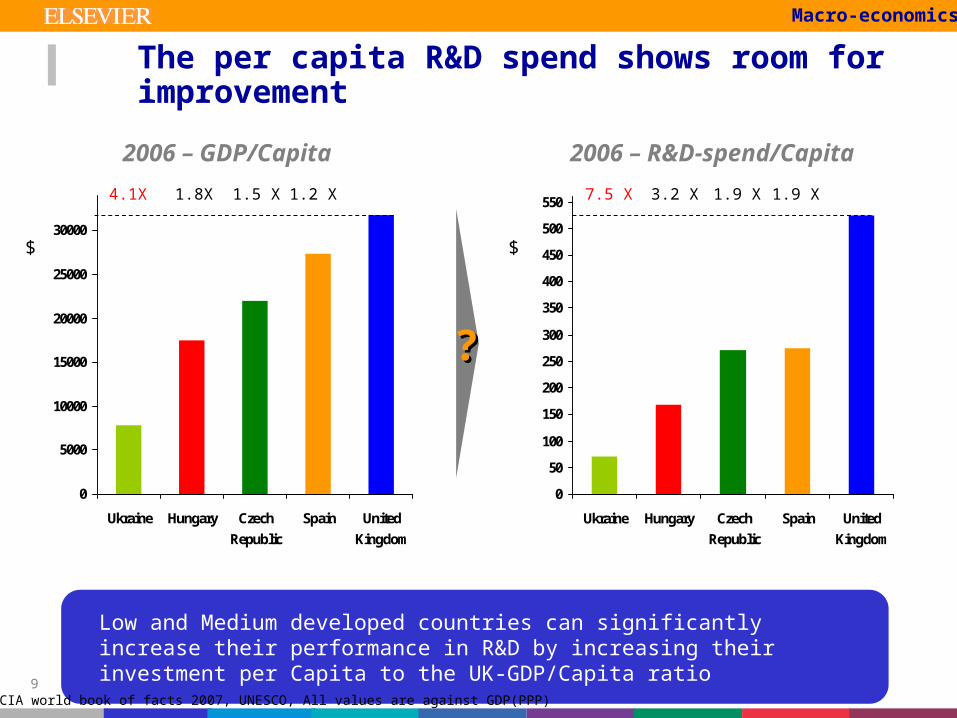
Low and Medium developed countries can significantly increase their performance in R&D by increasing their investment per Capita to the UK-GDP/Capita ratio
0
50
100
150
200
250
300
350
400
450
500
550
Ukraine Hungary Czech
Republic
Spain United
Kingdom
2006 – R&D-spend/Capita
$
0
5000
10000
15000
20000
25000
30000
Ukraine Hungary Czech
Republic
Spain United
Kingdom
2006 – GDP/Capita
1.5 X1.8X4.1X
$
1.2 X
Source: CIA world book of facts 2007, UNESCO, All values are against GDP(PPP)
??
Macro-economics
1.9 X3.2 X7.5 X 1.9 X
The per capita R&D spend shows room for improvement

10 UK
Ukraine
US
Hungary
Spain
Czech Republic
comparing countries research performance
To win a marathon a good position at the start is crucial

11
0
1
29
55
0
9
43
167
0
0
2
1
050100150200
Ukraine
Hungary
Czech Republic
Spain
United Kingdom
United States
# of Universities in theTimes top 200
# of Universities in theShanghai Jiao TongUniversity top 500
0
1
57
0
42
166
0
0
32
2
1
9
0 50 100 150 200
Ukraine
Hungary
Czech Republic
Spain
United Kingdom
United States
Hungary
Ukraine
Spain
CzechRepublic
United Kingdom
United States
2006 2007
comparing countries research performance
International rankings still show a huge lead for UK and US universities

12
Article output market shares derived from
Ukraine share of articles indexed on Scopus has declined to 0.34 % while neighbours share has grown, a trend shared by UK and US
0.4%
7.6%
26.1%
0.46%
2.2%
0.46%0.34%
0.4%0.53%
2.5%
7.4%
24.9%
0.0%
5.0%
10.0%
15.0%
20.0%
25.0%
30.0%
Urkraine Hungary CzechRepublic
Spain UK US
'96-'01'02-'06
Average share of articles published worldwide
comparing countries research performance
The UK and US contribute 32.3% of world articles but representing only 5.5% of the world population
Average Growth ’96-’01 ’02-’06
Ukraine 3.3% -2.1%
Hungary 2.8% 5.2%
Czech Republic 5.2% 7.2%
Spain 4.2% 8.7%

13Source: www.basf.com
comparing countries research performance
The quality of your shoes

14
comparing countries research performance
To win in R&D, Elsevier provides the best equipment

15
0
200
400
600
800
1.000
1.200
1.400
1.600
1.800
2.000
1996 1997 1998 1999 2000 2001 2002 2003 2004 2005 2006 2007
# ar
ticl
es p
ub
lish
ed /
Mio
In
hab
itan
ts
0
50
100
150
200
250
300
350
400
450
500
Du
izen
den
FT
A d
ow
nlo
ads
/ M
io I
nh
abit
ants
Spain Articles Published UK Articles Published Spain SD Usage UK SD Usage
comparing countries research performance
Electronic access to large volumes of content has significant influenceon the article output growth of countries worldwide

16
0
200
400
600
800
1,000
1,200
1996 1997 1998 1999 2000 2001 2002 2003 2004 2005 2006 2007
# ar
ticl
es p
ub
lish
ed /
Mio
In
hab
itan
ts
0
50
100
150
200
250
Th
ou
san
ds
FT
A d
ow
nlo
ads
/ M
io I
nh
abit
ants
Spain Articles Published Ukraine Republic Articles published Spain SD Usage Ukraine Republic SD Usage
comparing countries research performance
The rapidly increasing usage of SD further explains the sharp increasein # of articles published Meant for whitepaper

17
0
100
200
300
400
500
600
700
800
900
1,000
1996 1997 1998 1999 2000 2001 2002 2003 2004 2005 2006 2007
# ar
ticl
es p
ub
lish
ed /
Mio
In
hab
itan
ts
0
20
40
60
80
100
120
140
160
Th
ou
san
ds
FT
A d
ow
nlo
ads
/ M
io I
nh
abit
ants
Czech Republic Articles published Hungary Articles published Ukraine Republic Articles published
Czech Republic SD Usage Hungary SD Usage Ukraine Republic SD Usage
comparing countries research performance
The rapidly increasing usage of SD further explains the sharp increasein # of articles published

18
0
1
2
3
4
5
6
7
1996 1997 1998 1999 2000 2001 2002 2003 2004 2005 2006
Ind
exed
art
icle
ou
tpu
t (1
996
= 1
)
Poland Articles Published China Articles Published UK Articles Published
2.3x faster growth
comparing countries research performance
1.9x faster growth
4.5x faster growth
• Historically UK has large access-levels to content, making the transition from paper to electronic small in terms of additional availability
• In Poland the transition from paper to electronic content opened up access to a much larger volume of content
• In China the amount of content available before the launch of SD was insignificant compared to the amount available today
Low development
countries
High development
countries
Access growth
accelerator
Developing countries have a larger benefit from electronic access tohigh quality content than developed countries

19
Basketball
Running
Golf
Which shoes to wear?

Thank You


