The Influence of Product Liability on Vertical Product Differentiation Florian Baumann * Tim Friehe † Alexander Rasch ‡ September 21, 2015 Abstract This paper explores the impact of product liability on vertical product differen- tiation when product safety is perfectly observable. In a two-stage competition, duopolistic firms are subject to strict liability and segment the market such that a low-safety product is marketed at a low price to consumers with relatively small harm levels whereas the safer product is sold at a high price to consumers with high levels of harm. Firms’ expected liability payments are critically influenced by how the market is segmented, creating a complex relationship between product liability and product differentiation. We vary the liability system’s allocation of losses be- tween firms and consumers. Shifting more losses to firms increases the safety levels of both products, but decreases the degree of product differentiation. Some shift- ing of losses is always socially beneficial, but the optimum may require that some compensable losses stay with the consumers. Keywords: product liability, accident, harm, imperfect competition, product safety, vertical product differentiation. JEL classification: D43, K13, L13. * Duesseldorf Institute for Competition Economics (DICE), University of Duesseldorf, Universi- taetsstrasse 1, 40225 Duesseldorf, Germany. E-mail: [email protected]. † University of Marburg, Public Economics Group, Am Plan 2, 35037 Marburg, Germany. CESifo, Munich, Germany. E-mail: [email protected]. ‡ Duesseldorf Institute for Competition Economics (DICE), University of Duesseldorf, Universi- taetsstrasse 1, 40225 Duesseldorf, Germany. E-mail: [email protected]. We are grateful for comments received from Christian Gollier, Jurjen Kamphorst, Xingyi Liu, Abrah- man Wickelgren, Tobias Wenzel, and participants at workshops in Amsterdam, Mannheim, Munich, and Rotterdam. 1
Transcript
The Influence of Product Liabilityon Vertical Product Differentiation
Florian Baumann∗ Tim Friehe† Alexander Rasch‡
September 21, 2015
Abstract
This paper explores the impact of product liability on vertical product differen-tiation when product safety is perfectly observable. In a two-stage competition,duopolistic firms are subject to strict liability and segment the market such thata low-safety product is marketed at a low price to consumers with relatively smallharm levels whereas the safer product is sold at a high price to consumers with highlevels of harm. Firms’ expected liability payments are critically influenced by howthe market is segmented, creating a complex relationship between product liabilityand product differentiation. We vary the liability system’s allocation of losses be-tween firms and consumers. Shifting more losses to firms increases the safety levelsof both products, but decreases the degree of product differentiation. Some shift-ing of losses is always socially beneficial, but the optimum may require that somecompensable losses stay with the consumers.
∗Duesseldorf Institute for Competition Economics (DICE), University of Duesseldorf, Universi-taetsstrasse 1, 40225 Duesseldorf, Germany. E-mail: [email protected].†University of Marburg, Public Economics Group, Am Plan 2, 35037 Marburg, Germany. CESifo,
Munich, Germany. E-mail: [email protected].‡Duesseldorf Institute for Competition Economics (DICE), University of Duesseldorf, Universi-
taetsstrasse 1, 40225 Duesseldorf, Germany. E-mail: [email protected] are grateful for comments received from Christian Gollier, Jurjen Kamphorst, Xingyi Liu, Abrah-man Wickelgren, Tobias Wenzel, and participants at workshops in Amsterdam, Mannheim, Munich, andRotterdam.
1
1 Introduction
1.1 Motivation and main results
Product liability makes manufacturers of defective products liable for harm caused to
their consumers. Product liability has gained major importance in the USA and increas-
ingly does so in Europe (e.g., Lovells 2003). Controversies about its use and potential
excessiveness receive attention in the media and in academia (Polinsky and Shavell 2010a,
2010b, Goldberg and Zipursky 2010). Polinsky and Shavell (2010a) argue that there are
three main benefits of product liability, namely, improvements in product safety, induce-
ment of better consumer purchase decisions by causing product prices to reflect risks, and
the compensation of victims of product-related accidents. At the same time, however,
the authors point out that the high transaction costs associated with product liability
will make its use unwarranted for products for which other mechanisms (e.g., reputation)
work towards achievement of the same benefits.
This paper analyzes the influence of product liability on the incentives for vertical
product differentiation, thereby exploring potential social benefits and costs of product
liability not dealt with in the literature heretofore. In our set-up, two firms sell their
products with different risk attributes to consumers with heterogeneous harm levels. The
risk attributes of the products that firms commit to in a first stage are observed perfectly
by consumers. Price competition takes place in stage 2 for given safety levels. Like, for
example, Daughety and Reinganum (2006), we assume that compensation is determined
by the tort system and not by contracting between firms and consumers. Firms are
subject to strict liability with incomplete compensation of victims of product-related
accidents.1 In practice, the divergence of the level of total accident losses and the level
of compensation may be traced back to, for instance, non-pecuniary harm components,
harm components which are difficult to evaluate or to foresee, statutorily established
limits on awards, or uncompensated litigation costs (see, e.g., Endres and Ludeke 1998,
Posner 1998, Shavell 2004).2 In the spirit of Daughety and Reinganum (1995), we vary
1Strict liability is the basic principle of the European Directive on Product Liability (85/374/EEC),for example, and assumed in most contributions to the literature such as Daughety and Reinganum (1995,2006, 2008).
2Following the practical importance of incomplete compensation of victims of product-related acci-dents, contributions to the literature on product liability usually assume that firms and consumers bearsome losses when an accident occurs (e.g., Daughety and Reinganum 2006, 2008).
2
the liability system’s allocation of losses between injurers and victims and trace out the
implications for accident risk, the level of product differentiation with respect to product
safety, the intensity of price competition, and welfare.
In our set-up, firms compete in both prices and safety, always covering the full market.
In equilibrium, there will be a firm offering a risky product at a low price and a high-safety
firm asking for a high price. In the presence of product liability, when choosing price and
safety levels, firms must bear in mind that their expected compensatory payments are
critically influenced by which consumers they attract. For example, an increase in the
low-safety firm’s market share implies that the expected liability per consumer increases
for both the low-safety firm and the high-safety one. This increase results for both firms
because the consumers switching from the high-safety firm to the low-safety one repre-
sent the consumers with the highest (lowest) harm level out of the pool of consumers
of the low-safety (high-safety) firm. This makes the interaction of product liability and
product differentiation complex and distinguishes our analysis from previous contribu-
tions on endogenous quality differentiation. In order to highlight the importance of the
linkage between decision variables and expected liability for our main results, we analyze
an alternative scenario in which firms’ expected liability in the event of an accident is not
responsive to changes in price and safety levels in Section 6.
We find that shifting losses to firms has sizable efficiency consequences. Without
product liability, the equilibrium level of product differentiation exceeds the first-best
level; the low safety level falls short of the socially optimal low safety level and the
high safety level exceeds its socially optimal counterpart. Shifting losses to firms induces
both firms to increase their safety investments in a way that decreases the level of product
differentiation. Whereas the increase in the low-safety firm’s care level is socially desirable,
the even higher care investment by the high-safety firm is inefficient. In our framework,
the equilibrium degree of product differentiation exceeds the second-best level for any
allocation of accident losses between firms and consumers.
The fact that shifting more losses to firms changes equilibrium safety in our setup
stands in a sharp contrast with the irrelevance result from the literature on product li-
ability when (homogeneous) consumers are perfectly informed about both the level of
safety and the level of losses (see, e.g., the survey by Daughety and Reinganum 2013). In
our context, the simple intuition that shifting losses to firms always makes products safer
3
applies, which was denied for the standard framework (e.g., Shavell 1980). The expla-
nation for our finding runs as follows. Firms design the products’ safety characteristics
with strategic motives, the marginal consumer, and a firm-specific average consumer in
mind. Shifting more losses to firms makes safety less important for consumers, causing
a reallocation of consumers to the low-safety firm such that both firms face an average
and marginal consumer with a higher harm level (all else equal), and a moderation of
the importance of the strategic motives. Both implications cause higher safety by the
low-safety firm and in consequence also higher safety by the high-safety firm.
With regard to prices set in stage 2, we find that firms’ expected liability influences
competition asymmetrically. This results from the relevance of prices for firms’ expected
liability payments. Whereas the low-safety firm faces an additional marginal benefit from
increasing its price (as a higher price and the resulting decrease in demand lowers its
expected liability per consumer), the high-safety firm experiences an additional marginal
cost from increasing its price. Bearing a lower share of losses, consumers care less about
the difference in safety and more about the price difference. This implies a more intense
price competition and lower mark-ups for firms, ceteris paribus. However, whereas the
high-safety firm’s mark-up clearly falls in equilibrium, the asymmetric impact of product
liability on firms’ pricing decisions may result in a higher mark-up for the low-safety firm.
How the change in the allocation of accident losses translates into price variations is also
influenced by the change in firms’ expected costs, consisting of safety investments and
expected harm. Shifting more losses to firms entails that the low-safety firm attracts a
greater share of consumers because the surcharge for the additional safety investment by
the high-safety firm and cross-subsidization of high-harm individuals is worthwhile only
for consumers with sufficiently high own levels of harm. Similarly, allocating a greater
share of accident losses to firms changes firms’ profits asymmetrically.
Perhaps surprisingly, even though the low-safety firm’s market share exceeds one half,
the split of consumers is not biased enough when compared to the second-best segmen-
tation of the market for given equilibrium levels of product safety. This is a result of the
low-safety firm charging a higher mark-up than the high-safety firm.
Importantly, it is not only firms that are asymmetrically affected when a greater share
of expected accident losses is imposed on them. In fact, when the importance of product
liability is increased, some types of consumers may gain whereas others lose. The intuition
4
for this result is straightforward. In response to greater expected liability payments, the
low-safety firm responds by increasing the level of safety and possibly the price. These
changes may indeed be detrimental to consumers with low levels of harm, when the
increase in safety does not compensate the increase in the level of the price. We find that
it is possible that even the totality of consumers is worse off after an increase in the firms’
share of losses.
When assessing the overall effect using a utilitarian welfare function, we find that
allocating more losses to firms is socially optimal in most (that is, not all) scenarios,
while allocating some losses to firms is always socially optimal. In our analysis, we thus
establish that efficiency hinges upon the share of losses borne by firms. Interestingly, in
some circumstances, it is socially desirable to cap the losses borne by firms. With regard
to the impact of different components of welfare, it may be that the increase in welfare
results from firms gaining profits and consumers losing utility, that is, very counterintuitive
distributional consequences may result from a greater reliance on product liability.
Our paper contributes to the literature in the following ways (see Section 1.2 for a
discussion of the relationship to the literature): in a market with imperfect competition,
we identify the influence of product liability on the degree of product differentiation as an
important area to be included in the discussion of the pros and cons of product liability.
We establish that the use of either no liability or strict liability is of critical importance
to welfare even when consumers perfectly observe the level of safety and their level of
harm. We vary the liability system’s allocation of losses in a model of vertical product
differentiation and detail the implications for accident risk, product differentiation, price
competition, and welfare.
1.2 Related literature
Our work studies the interaction of product liability and vertical product differentia-
tion. Accordingly, our paper can be related to contributions on product liability and the
industrial-organization literature on endogenous product differentiation.
There is a vast literature on product liability, surveyed by Daughety and Reinganum
(2013) and Geistfeld (2009), for example. The standard set-up considers perfectly com-
petitive firms, identical risk-neutral consumers, as well as care costs and expected harm
that are constant per unit of output. It delivers the result that strict liability and no
5
liability are equally efficient when consumers are perfectly informed about care and do
not misperceive risk (e.g., Hamada 1976, Shavell 1980). In our set-up, the extent to
which product liability is made use of has important efficiency implications even when
we maintain the assumptions regarding consumer information. The early literature has
argued that misperceptions of risk make liability of the firm desirable relative to no li-
ability (e.g., Shavell 1980, Polinsky and Rogerson 1983). Endres and Ludecke (1998)
analyze the implications of consumers’ misperceptions when the product is supplied by
a monopolist offering variants of the product with different safety features in order to
induce self-selection of consumers with varying harm levels. In our analysis, the products
with different safety attributes are supplied by two imperfectly competitive firms and
delivered to consumers without misperceptions about product risk. With regard to the
second informational assumption—observability of product safety—, many contributions
to the literature consider the possibility that consumers are unable to perfectly observe
risk attributes of products, exploring the outcomes that result with signaling or disclosure
(e.g., Daughety and Reinganum 1995, 2008).
More related to our study, Daughety and Reinganum (2006) analyze a scenario in
which perfectly informed consumers are served by horizontally differentiated firms en-
gaging in Cournot competition and consumers are only incompletely compensated by
firms in the event of an accident.3 Firms commit to safety in the first stage and choose
quantity in stage 2. Daughety and Reinganum compare the market equilibrium when
symmetric firms are subject to strict liability with the outcome that results when a plan-
ner can choose product safety taking the implications on the Cournot competition as
given. Their study delivers a host of interesting findings—inter alia—about the effects
of changes in the number of firms or the substitutability of products. In contrast, we
focus on price competition between two vertically differentiated firms and compare dif-
ferent allocations of losses between firms and consumers achieved by the liability system.
The low-safety firm and the high-safety firm are asymmetric due to the different types of
consumers served. Nevertheless, there are a number of commonalities with Daughety and
Reinganum (2006), for example, the fact that firms consider a “business stealing” effect
when determining safety, that the safety choice is not independent of the firm’s decision
3Their model also permits vertical differentiation by different levels of safety investments, but theyfocus on symmetric equilibria where firms choose the same level of safety. Their model is also used toconsider third-party victims, something we abstract from in the present contribution.
6
about output, that both firms and harmed victims always bear some costs resulting from
a product-related accident, and that safety is a durable attribute committed to on an
earlier stage in comparison to output/prices.
Another related recent paper is Choi and Spier (2014) building on Ordover (1979). In
that paper, perfectly competitive firms choose precautions facing consumers with either
a high or a low accident probability, where safety is firms’ private information and risk
type is consumers’ private information. When contracts comprise a price and stipulated
damages to be paid in the event of an accident, firms have an incentive to lower the latter
to screen risk types, providing a welfare rationale for mandatory product liability. We do
not consider two contract components that would allow for a screening of consumer types.
Instead, in our setup, firms understand that the price and safety levels imply an allocation
of consumers to firms, allowing them to anticipate their respective average consumers in
equilibrium.
The present analysis responds to Oi (1973), who discusses the scenario of consumers
with heterogeneous harm levels when the safety levels of products may differ, and foresees
the extreme case that strict liability of firms will eliminate product differentiation when
there is full compensation and no possibility of price discrimination. We analyze the
endogenous safety choice of two firms which compete in prices when consumers cannot
be fully compensated, such that consumers with a high level of harm continue to strictly
prefer a safer product to another one, when all else is held equal. Whether or not, by
extension of Oi’s argument, a marginal shift of expected losses from consumers to firms
lowers the degree of product differentiation is of key interest in the present contribution.
While our results support the hypothesis of product liability diminishing the degree of
product differentiation, we point out the rather complex implications of product liability
for efficiency and welfare in a setting with vertical product differentiation.
We next address the relationship of our paper to the industrial-organization literature
on vertical product differentiation. Vertical product differentiation between competing
firms is studied in the seminal article by Shaked and Sutton (1982). There, firms first
choose their quality level before they compete in prices. In line with our results, the
authors show that firms decide to offer different levels of quality in order to mitigate the
intensity of price competition in the second stage.4 This allows firms to increase their
4Motta (1993) shows that this also holds when firms compete in quantities instead of prices.
7
profits.
In the present paper, we investigate how product liability influences firms’ product
differentiation in an imperfectly competitive market. In contrast, the preceding industrial-
organization literature on vertical product differentiation has focused on minimum-standard
requirements as the policy instrument of choice (Ronnen 1991, Crampes and Hollander
1995).5 A robust result in this literature is that the use of a mildly restrictive minimum
quality standard leads to an increase in the profits of the low-quality firm whereas the
high-quality firm always loses profits when a quality standard is imposed. With respect to
consumer surplus, Crampes and Hollander (1995) show for a fully covered market that all
consumers gain from the introduction of a minimum-standard requirement if the response
of the high-quality firm to the quality choice of its rival is weak. If the response is strong,
those consumers who have only weak preferences for quality are worse off. Turning to
welfare, the authors show that welfare increases if the quality response by the high-quality
firm is less than the increase in quality by the low-quality firm (i.e., if the introduction of
the standard reduces the level of product differentiation) despite the lower profits for the
high-quality firm and the potential loss in surplus for some consumers.
Our analysis highlights the similarities and differences between the results obtained
from using either product liability as a policy instrument or a minimum-standard re-
quirement. Paralleling the case of an increasingly strict minimum-standard requirement,
allocating a greater share of losses to firms subject to product liability reduces the dif-
ference in the products’ risk attributes and thereby shifts consumer attention to prices.
However, due to the rather complex interaction of product liability and product differ-
entiation, the welfare effects of resulting changes in market shares and safety levels are
less clear-cut when compared to the case with a minimum quality standard. In addition,
there is an important difference between product liability and minimum quality stan-
dards: if firms have to compensate a larger share of losses, this reduces their scope for
vertical differentiation because consumers perceive products as more similar even when
holding the difference in care levels constant (i.e., differences in safety are less important
for consumers). In contrast, the use of or change in the level of a minimum-standard
requirement does not influence consumers’ perception of quality differences. In addition,
5Note that both contributions differ in their assumptions on the quality cost; whereas Ronnen (1991)assumes a quality-dependent fixed cost, Crampes and Hollander (1995) investigate the case where firms’unit costs increase in quality.
8
the minimum-standard requirement effectively determines safety of the low-safety firm
whereas product liability does not similarly restrict the firms’ choice set. In the remain-
der of the paper, we will repeatedly highlight differences between product liability and
minimum-standard requirements.
1.3 Plan of the paper
Section 2 presents the model used for our analysis. Section 3 derives the socially optimal
allocation as a benchmark for the market outcome analyzed in Section 4. In Section 5, the
influence of product liability on the market equilibrium (e.g., product differentiation) and
welfare is explained. Section 6 varies some of our assumptions, thereby highlighting the
importance of firms’ taking account of how price and safety levels influence their expected
compensatory payments for the working of product liability in our main analysis. Section
7 concludes.
2 The model
We consider a market with two firms competing in prices and safety for the demand of
a continuum of consumers whose mass is normalized to one. Both firms and consumers
are risk-neutral. Each firm sells one variety of the good traded in the market and each
consumer buys one unit from either one of the two firms. With regard to the consumption
features, consumers value both varieties according to the parameter v which is assumed to
be large enough to ensure full market coverage in equilibrium. The two product varieties
may differ with respect to product safety, that is, the observable firm-specific probability
of a product-related accident. Firms commit to a specific level of product safety which
may be influenced by using better inputs or a more advanced technology, for example.
Consumers differ with respect to the level of total (expected) harm h incurred in the event
of an accident, where h is uniformly distributed on the interval [h, h + 1], 1/4 ≤ h ≤ 1.6
Consumers may differ with respect to their level of harm for several reasons. For example,
the level of harm could be a function of consumer-specific characteristics such as wealth,
professional status, health, and so on. Some consumers’ susceptibility to greater harm
could be due to prior exposure (as in the case of mercury, for example). Firms cannot
6It is standard to assume that the heterogeneity is due to a parameter with a uniform distribution onan interval with unit length (see, e.g., Kuhn 2007). For a different approach, see Wauthy (1996).
9
observe the specific level of harm when selling the product to a consumer and we do not
consider contract schemes that allow firms to screen consumer types.7 Our assumptions
are reasonable in mass markets, for example, where products are distributed through
retailers.
Strict product liability makes firms liable for the harm suffered by their consumers. In
this regard, we assume that only βh is principally compensable, where 0 < β < 1. This
may be due to the fact that only a share β of the harm is verifiable (since this part involves
goods with a market price readily available), whereas share 1−β is not verifiable. The non-
verifiable part may be due to, for example, the unobservability of emotional attachment
to property destroyed in the product-related accident or individual-specific disutility from
requiring medical treatment or engaging in litigation after the accident. The commonly
assumed divergence of the level of total losses incurred in the event of an accident and
the level of compensation may also be traced back to litigation costs under the American
rule (e.g., Daughety and Reinganum 2006). Since only expected values are essential in
our analysis, another interpretation is that β is the probability of receiving compensation
and 1− β the one of receiving no compensation (as a result of difficulties in establishing
causation, for instance). The level of β is common knowledge.
For most practical scenarios, policy decisions about statutory caps, for example, deter-
mine the level of compensation actually due in the event of an accident. Similarly, when
part of the accident loss is due to property damage, arriving at a more or less accurate
estimate of the property value is often difficult and can be guided by policy decisions
about what kinds of references may be used and what kinds of evidence are admissible
before court to inform about the level of the loss (e.g., Kaplow and Shavell 1996). Sim-
ilar issues may arise in the context of temporary or permanent physical harm and lost
earnings. The generosity of different legal regimes with respect to pain and suffering is
a case-in-point (e.g., Shavell 2004). In order to take this into account, we explore the
implications of varying the allocation of compensable losses between firms and consumers
by using a policy variable γ, 0 ≤ γ ≤ 1. In other words, the level of compensation
transferred from the liable firm to the harmed consumer is γβh, such that setting γ = 1
implies that all compensable losses on the part of consumers are actually compensated by
firms. Variations in the level of γ may also be interpreted in terms of the ease of receiving
7For an analysis along these lines, see Choi and Spier (2014).
10
compensation, for example, by changing the burden of proof. In contrast to β which we
assume to be not malleable and representing the possibility that some immanent issues
make perfect compensation infeasible, the level of γ is a parameter that is adjustable and
follows from public policy decisions. For the agents in the model, the product of βγ, that
determines the share of losses compensated, is key to economic decision making.8
With xi, xi ∈ [0, 1], denoting the firm’s product safety features, production costs of
firm i are given by ax2i /2, a ≥ 2. The probability of a product-related accident is defined
by 1 − xi. In the rest of the paper, firms’ labels are chosen (without loss of generality)
such that firm 1 is the low-safety firm and firm 2 the high-safety one (i.e., that x1 ≤ x2).
In addition to production costs, per-unit costs of firm i also comprise expected liability
payments, which are critically influenced by which consumers firm i serves (in a way made
precise below).
In our analysis, we focus on a pure-strategy equilibrium and for that reason impose
a parameter restriction that rules out so-called leapfrogging incentives first discussed in
Motta (1993). Whereas leapfrogging is not an issue in Motta (1993), the cost asymmetry
imposed by the different levels of average compensable consumer harm may make it
profitable for the high-safety firm to deviate by choosing a safety level below the low-
safety firm’s safety level in our set-up. This incentive is for a given level of compensation
(i.e., for a given level of β) and a given location of the range of harm levels (i.e., for a given
h) stronger the higher the level of the marginal costs of safety. Ruling out leapfrogging
incentives can thus be stated as a cap on these. Appendix A shows that it is sufficient to
make the following assumption.
Assumption 1 It holds that η = a− h ≤ 1/β − 1/6.
In Appendix A, we also demonstrate that this restriction implies that the second-order
conditions and the requirement that both firms are active also hold.
In the analysis described in the body of the paper, we focus on the case where the
high-safety firm’s safety level is weakly less than one (as the accident probability is defined
as 1− x2). This is true whenever Assumption 2 holds which is, however, not necessary to
obtain our qualitative findings.
8We thus could define βγ = µ for the following analysis. However, we prefer to represent the limitedability to principally compensate consumers with the parameter β on the one hand and the policy decisionwith γ that may come from [0, 1] on the other.
11
0.0 0.2 0.4 0.6 0.8 1.0
1.0
1.2
1.4
1.6
1.8
2.0
β
η
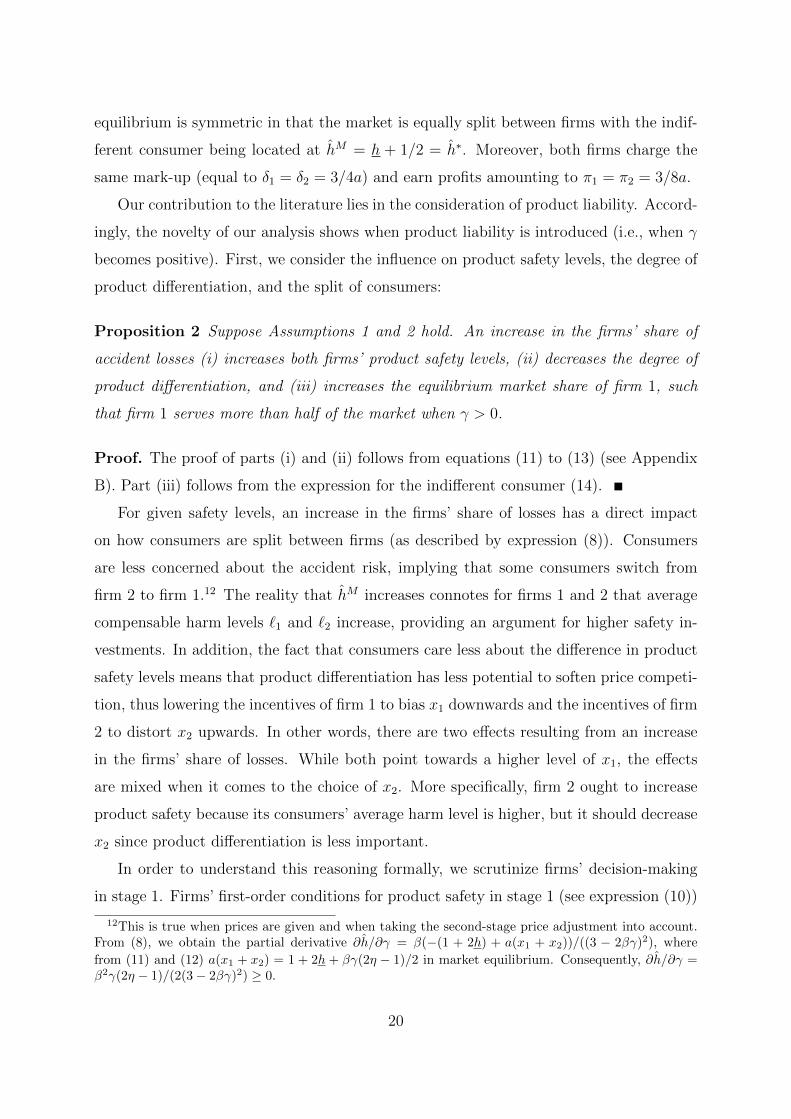
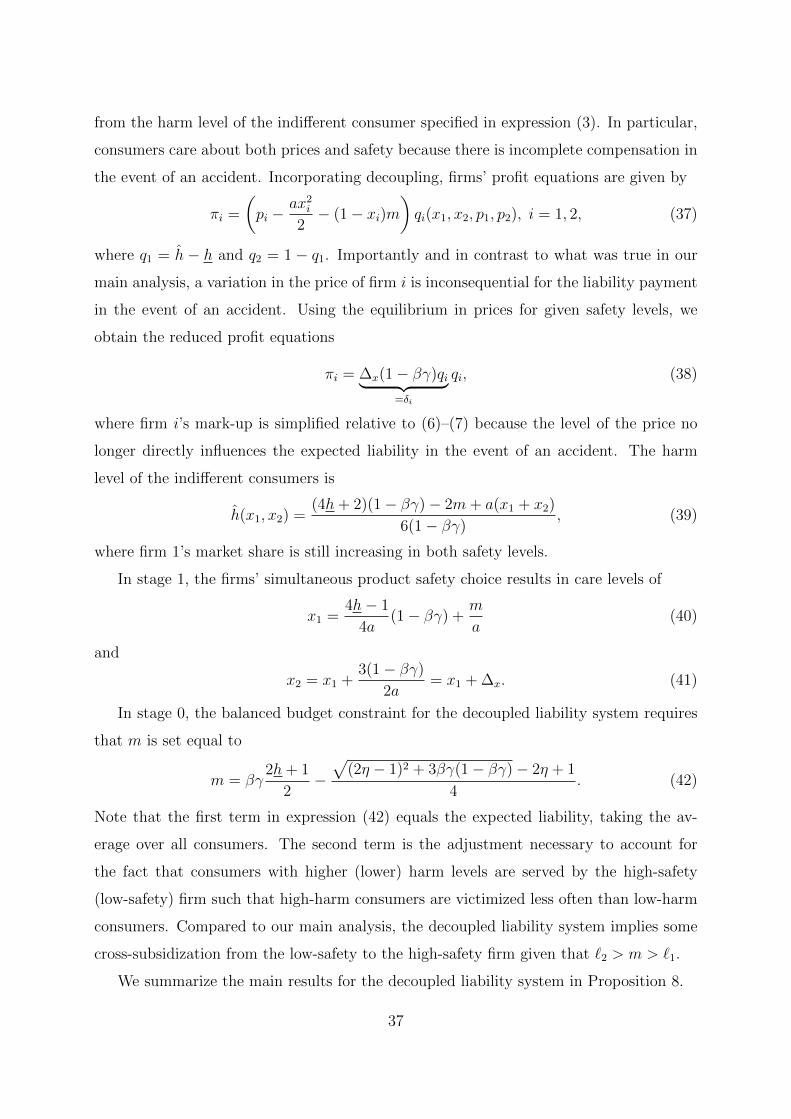
Figure 1: Combinations of β and η analyzed in the body (light-grey area) or in AppendixD (dark-grey and black areas) of the paper
Assumption 2 It holds that η ≥ 5/4 + β/(4(4− 3β)).
In Appendix D, we establish that our key results continue to hold when Assumption 2
is not fulfilled. Figure 1 summarizes the parameter combinations that are analyzed in
the body of the paper (light-grey area), that are analyzed in Appendix D (dark-grey
and black areas), and that are not considered to allow us to abstract from leapfrogging
complications (white area).
The timing of events is as follows. In stage 1, firms simultaneously choose levels of
product safety. In stage 2, with common knowledge about safety levels, firms simulta-
neously set prices and then consumers decide from which firm to buy. Finally, accidents
occur according to the accident risks of firms 1 and 2, and compensatory payments man-
dated by the liability regime are transferred.
12
3 Benchmark: First-best safety levels and split of
consumers
We start our analysis by deriving the first-best levels of product safety and the socially
optimal split of consumers as a benchmark. For this, we identify the safety levels x1 and
x2, and the allocation of consumers to firms 1 and 2 that maximize social welfare defined
as the sum of producer and consumer surplus. Given a fully covered market and the
uniform gross benefit from products v, the maximization of social welfare is tantamount
to minimizing total social costs SC, consisting of production costs and expected harm.
If a social planner finds it optimal that firms 1 and 2 differentiate their products by
choosing different safety levels (x1 < x2), it is clear that the products of the low-safety
firm should be allocated to consumers with low levels of harm and vice versa. Denote by
h the harm level of the consumer who separates the population such that consumers with
h ≤ h obtain the product from firm 1 and consumers with h > h receive the product of
firm 2. Social costs can be stated as
SC =(h− h
)(ax212
+ (1− x1)h+ h
2
)+(h+ 1− h
)(ax222
+ (1− x2)h+ h+ 1
2
)(1)
where (h + h)/2 and (h + h + 1)/2 represent the average expected harm of consumers
served by firm 1 and firm 2, respectively.
The analysis of the first-order conditions yields the conclusion that the socially optimal
level of safety of firm i minimizes the sum of precaution costs and expected losses suffered
by consumers of firm i. The first-best split of consumers is attained when the marginal
saving in production costs from reallocating consumers from firm 2 to firm 1 (i.e., ax22/2−
ax21/2) is equal to the marginal increase in expected accident costs (i.e., (x2 − x1)h).
Our findings for the first-best allocation are summarized in the following lemma:
Lemma 1 The socially optimal safety levels are x∗1 = (4h+ 1)/4a and x∗2 = (4h+ 3)/4a,
implying the socially optimal degree of product differentiation ∆∗x = x∗2 − x∗1 = 1/2a. The
market is segmented such that consumers with harm level h ≤ (>)h∗ = h+ 1/2 obtain the
product from firm 1 (firm 2).
Proof. The first-order conditions for x1 and x2 of the minimization problem according
to (1) result in x1 = (h+ h)/2a and x2 = (h+ h+ 1)/2a. Inserting these values into the
13
first-order condition for h, we obtain after collecting terms
− 2(h+ h) + 1
8a+
h
2a= 0
which leads to the results stated in Lemma 1.
The social planner uses product differentiation to account for consumers’ heterogeneity
regarding the level of harm in a product-related accident. Optimal safety levels increase
with the average level of harm (reflected by the minimum harm level h) and decrease in
the costs of safety a. The socially optimal level of product differentiation decreases in
the costs of safety and is independent of the harm levels. The socially optimal split of
consumers is such that each firm serves half of the market.
In the next section, we address the outcome that results under decentralized decision-
making by firms potentially subject to strict product liability.
4 The market equilibrium
In this section, we derive the market equilibrium using backward induction. Accordingly,
we start our analysis in stage 2 in which firms simultaneously set prices for given levels
of product safety. Next, we analyze firms’ decisions regarding product safety in stage 1.
4.1 Stage 2: Price competition
We start by analyzing price competition between firms 1 and 2 for given product safety
levels. For this, we derive the demand of firm i as a function of price and safety levels.
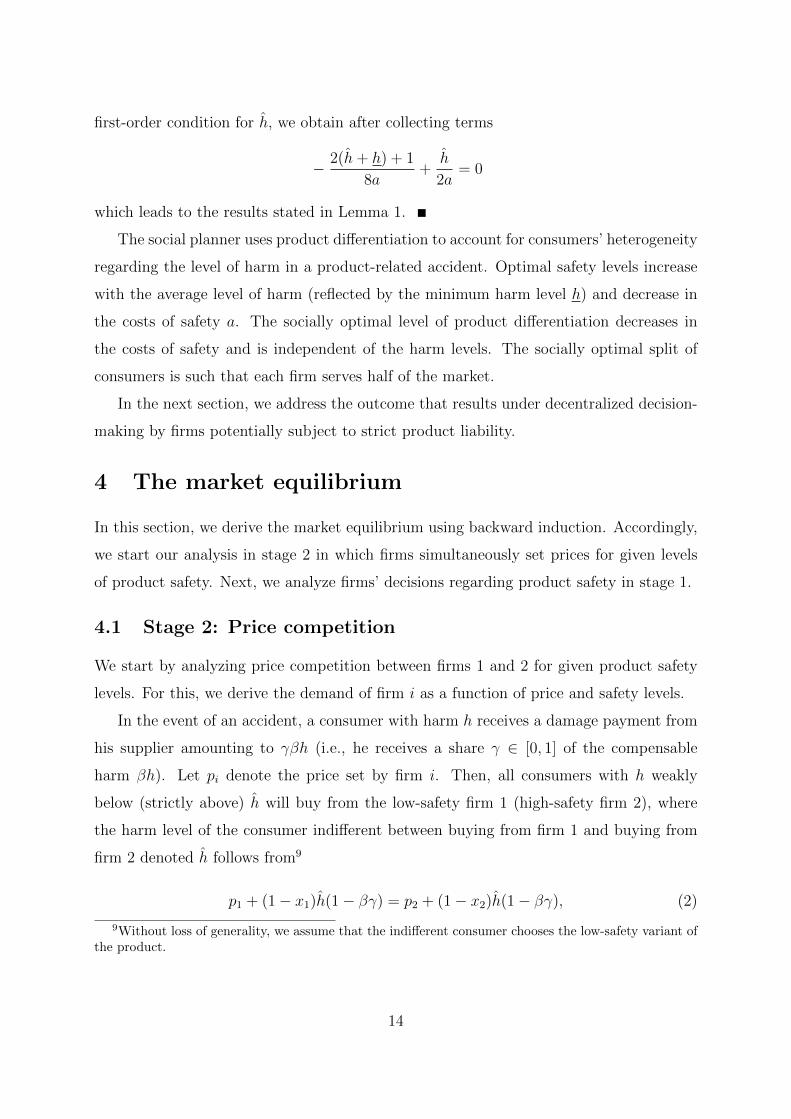
In the event of an accident, a consumer with harm h receives a damage payment from
his supplier amounting to γβh (i.e., he receives a share γ ∈ [0, 1] of the compensable
harm βh). Let pi denote the price set by firm i. Then, all consumers with h weakly
below (strictly above) h will buy from the low-safety firm 1 (high-safety firm 2), where
the harm level of the consumer indifferent between buying from firm 1 and buying from
firm 2 denoted h follows from9
p1 + (1− x1)h(1− βγ) = p2 + (1− x2)h(1− βγ), (2)
9Without loss of generality, we assume that the indifferent consumer chooses the low-safety variant ofthe product.
14
such that
h(x1, x2, p1, p2) =p2 − p1
(1− βγ)∆x
(3)
when ∆x = x2 − x1 > 0. In that case, firm 1 serves consumers with h ∈ [h, h] and firm
2 serves those with h ∈ (h, h + 1], such that q1 = h − h and q2 = h + 1 − h refer to the
demand of firm 1 and firm 2, respectively. Equation (3) highlights that consumers care
about prices, but discount a positive price difference by the difference in product safety to
the extent that consumers remain uncompensated. Accordingly, the responsiveness of the
firms’ market shares to changes in price levels is critically determined by the difference in
product safety levels (i.e., the extent of product differentiation) and the specifics of the
liability regime (represented by the level of γ). When ∆x = 0, all consumers would buy
the cheaper product. When ∆x = 0 and p1 = p2, all consumers are indifferent between
the two products and we assume that they are randomly allocated to firms.
Firm i’s profit equation can be written as
πi =
(pi −
ax2i2− (1− xi)γ`i(x1, x2, p1, p2)
)︸ ︷︷ ︸
=:δi
qi(x1, x2, p1, p2), i = 1, 2 (4)
where `1 = β(h+ h)/2 and `2 = β(h+ h+ 1)/2 represent expected compensable harm in
the event of a product-related accident for consumers of firm 1 and firm 2, respectively.
The term in parentheses corresponds to the mark-up δi charged by firm i.
Profit maximization with respect to prices yields the first-order conditions
∂πi∂pi
= qi + δi∂qi∂pi− (1− xi)γ
∂`i∂pi
qi = 0, i = 1, 2 (5)
which highlight a particularity of the relationship between vertical product differentiation
and product liability. The first two effects in expression (5) are well-known: charging a
higher price increases the firm’s profits due to the higher profit margin for all units sold
but induces some consumers to change their supplier. The third term is a novel aspect
resulting from firms’ liability. It measures the impact of a marginal increase in the price
level on the firm’s expected liability (due to the implied change in the firm’s clientele).
Whereas the loss of firm-specific demand due to an increase in the own price level is the
same for firms 1 and 2 the change in the firm’s expected liability due to an increase in
the own price level is asymmetric such that ∂`1/∂p1 < 0 < ∂`2/∂p2. The intuition for the
latter result is as follows: whereas firm 1 loses consumers with the highest expected harm
15
when raising its price – thereby depressing the average harm of the consumers served by
firm 1 – firm 2 loses consumers with the lowest expected harm. More generally speaking,
shifting demand towards firm 1 implies a higher expected liability for both firm 1 and
firm 2.
Solving for equilibrium prices, we obtain the equilibrium mark-ups
δ1(x1, x2) =q1(x1, x2)
(∆x (1− βγ) +
βγ(1− x1)2
)(6)
δ2(x1, x2) =q2(x1, x2)
(∆x (1− βγ)− βγ(1− x2)
2
). (7)
Both firms charge a mark-up on their average costs per unit produced.10 For both firms,
the mark-up at stage 2 depends positively on the own market share (i.e., qi) and the degree
of product differentiation (i.e., ∆x weighted by the share of non-compensated harm). In
contrast, the additional direct influence of the liability parameter γ (the second term in
parentheses) is asymmetric, increasing firm 1’s mark-up and decreasing firm 2’s mark-up.
The intuition lies with the additional effect of price increases on profits described above
which leads firm 1 to charge relatively higher prices.
With price levels given by the sum of production costs, expected liability payments,
and the mark-up, the harm level of the indifferent consumer results as
h(x1, x2) =2(1 + 2h) (1− βγ) + a (x1 + x2)
2(3− 2βγ). (8)
Interestingly, an increase in firm 2’s product safety induces a lower market share for firm
2 even though the direct effect via the accident probability attracts additional consumers
(see expression (3)). That is the adjustment in prices dominates the latter influence.
Having derived firm i’s profit-maximizing price and its market share as a function of
safety levels alone, we can state the (reduced) profit equation as a function of safety levels
only
πi = δi(x1, x2)qi(x1, x2), i = 1, 2 (9)
where δi(x1, x2) refers to the mark-up of firm i (explicated in expressions (6) and (7),
respectively), and where firm i’s demand is given by qi(x1, x2) and is derived using ex-
pression (8).
10If ∆x = 0, given the constant production costs per unit, the only possible equilibrium is the Bertrandoutcome p1 = p2 = ax21/2 + βγ(1− x1)(n+ 1/2) where βγ(1− x1)(n+ 1/2) is the expected compensableharm per consumer who select randomly between firms. The mark-up is equal to zero.
16
This concludes our analysis of the second stage. Next, we turn to stage 1 in which
firms simultaneously determine their product-safety levels.
4.2 Stage 1: Product safety
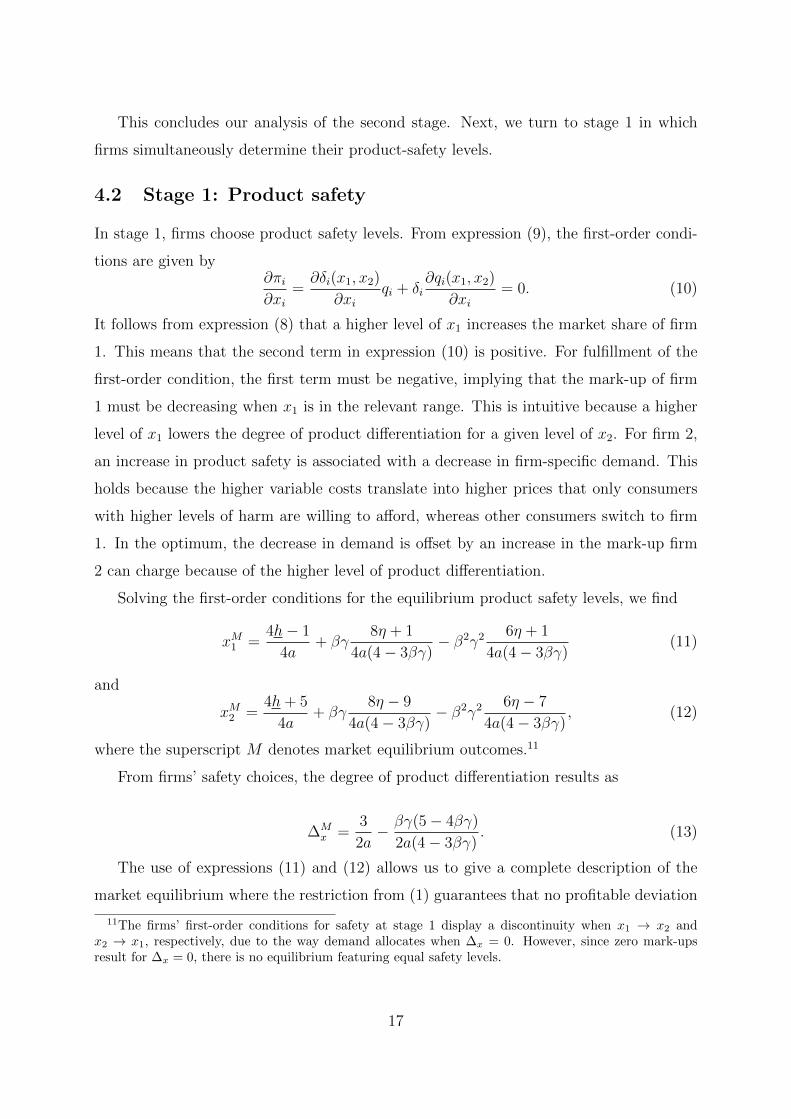
In stage 1, firms choose product safety levels. From expression (9), the first-order condi-
tions are given by∂πi∂xi
=∂δi(x1, x2)
∂xiqi + δi
∂qi(x1, x2)
∂xi= 0. (10)
It follows from expression (8) that a higher level of x1 increases the market share of firm
1. This means that the second term in expression (10) is positive. For fulfillment of the
first-order condition, the first term must be negative, implying that the mark-up of firm
1 must be decreasing when x1 is in the relevant range. This is intuitive because a higher
level of x1 lowers the degree of product differentiation for a given level of x2. For firm 2,
an increase in product safety is associated with a decrease in firm-specific demand. This
holds because the higher variable costs translate into higher prices that only consumers
with higher levels of harm are willing to afford, whereas other consumers switch to firm
1. In the optimum, the decrease in demand is offset by an increase in the mark-up firm
2 can charge because of the higher level of product differentiation.
Solving the first-order conditions for the equilibrium product safety levels, we find
xM1 =4h− 1
4a+ βγ
8η + 1
4a(4− 3βγ)− β2γ2
6η + 1
4a(4− 3βγ)(11)
and
xM2 =4h+ 5
4a+ βγ
8η − 9
4a(4− 3βγ)− β2γ2
6η − 7
4a(4− 3βγ), (12)
where the superscript M denotes market equilibrium outcomes.11
From firms’ safety choices, the degree of product differentiation results as
∆Mx =
3
2a− βγ(5− 4βγ)
2a(4− 3βγ). (13)
The use of expressions (11) and (12) allows us to give a complete description of the
market equilibrium where the restriction from (1) guarantees that no profitable deviation
11The firms’ first-order conditions for safety at stage 1 display a discontinuity when x1 → x2 andx2 → x1, respectively, due to the way demand allocates when ∆x = 0. However, since zero mark-upsresult for ∆x = 0, there is no equilibrium featuring equal safety levels.
17
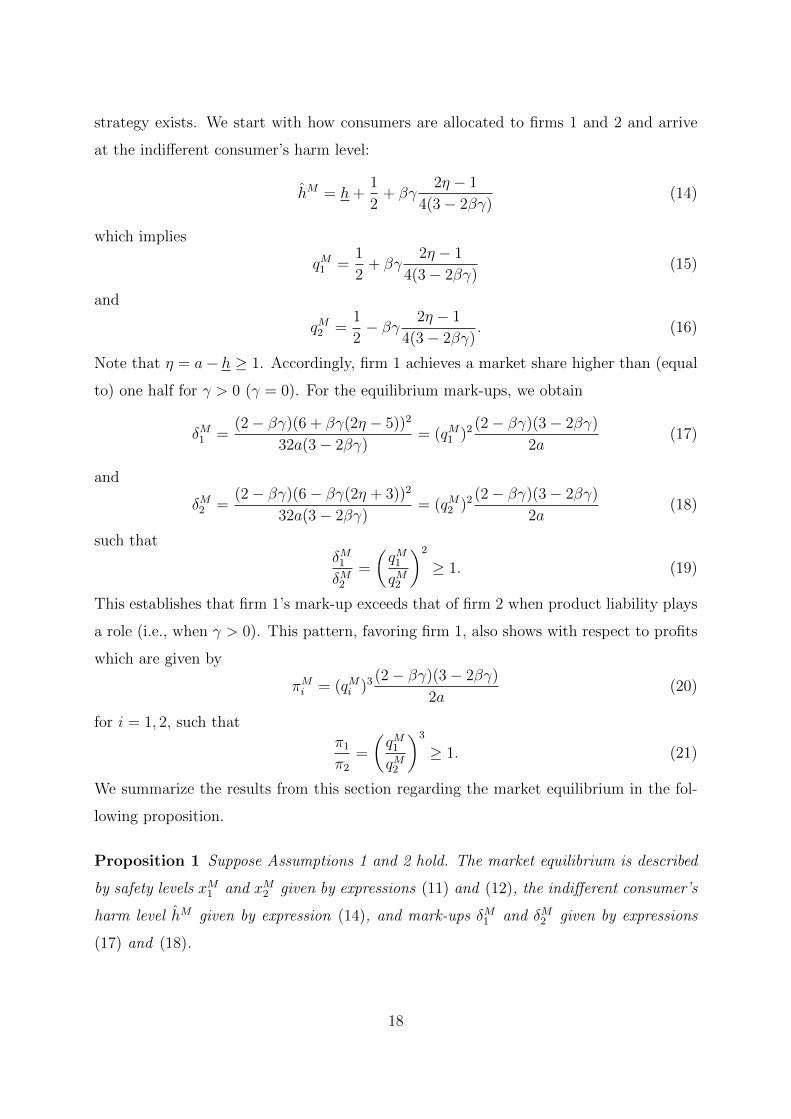
strategy exists. We start with how consumers are allocated to firms 1 and 2 and arrive
at the indifferent consumer’s harm level:
hM = h+1
2+ βγ
2η − 1
4(3− 2βγ)(14)
which implies
qM1 =1
2+ βγ
2η − 1
4(3− 2βγ)(15)
and
qM2 =1
2− βγ 2η − 1
4(3− 2βγ). (16)
Note that η = a− h ≥ 1. Accordingly, firm 1 achieves a market share higher than (equal
to) one half for γ > 0 (γ = 0). For the equilibrium mark-ups, we obtain
δM1 =(2− βγ)(6 + βγ(2η − 5))2
32a(3− 2βγ)= (qM1 )2
(2− βγ)(3− 2βγ)
2a(17)
and
δM2 =(2− βγ)(6− βγ(2η + 3))2
32a(3− 2βγ)= (qM2 )2
(2− βγ)(3− 2βγ)
2a(18)
such thatδM1δM2
=
(qM1qM2
)2
≥ 1. (19)
This establishes that firm 1’s mark-up exceeds that of firm 2 when product liability plays
a role (i.e., when γ > 0). This pattern, favoring firm 1, also shows with respect to profits
which are given by
πMi = (qMi )3(2− βγ)(3− 2βγ)
2a(20)
for i = 1, 2, such that
π1π2
=
(qM1qM2
)3
≥ 1. (21)
We summarize the results from this section regarding the market equilibrium in the fol-
lowing proposition.
Proposition 1 Suppose Assumptions 1 and 2 hold. The market equilibrium is described
by safety levels xM1 and xM2 given by expressions (11) and (12), the indifferent consumer’s
harm level hM given by expression (14), and mark-ups δM1 and δM2 given by expressions
(17) and (18).
18
Proof. The proof follows from the discussion above.
Having derived the market equilibrium, we can move on to our main research interest,
that is, how incentives for product differentiation are shaped by product liability in our
framework.
5 Product liability, market equilibrium, and welfare
In this section, we assess the implications of product liability for the market equilibrium
and explore both welfare and distributional consequences of different allocations of acci-
dent losses between firms and consumers. Specifically, we investigate the repercussions of
product liability by describing the effects of an increase in the firms’ share of compensable
harm γ. In Section 5.1, we start with the comparative-statics properties of the market
equilibrium before turning to welfare considerations in 5.2.
5.1 Product liability and market equilibrium: comparative-staticsresults
As a first step, we suppose that firms are not subject to strict product liability (i.e., we
set γ = 0) and compare the market equilibrium with the first-best benchmark derived in
Section 3.
Lemma 2 Suppose Assumptions 1 and 2 hold. Without product liability, the market
equilibrium displays an excessive degree of product differentiation with suboptimal product
safety investments by firm 1 and supraoptimal product safety investments by firm 2. Both
firms serve one half of the market, charge symmetric mark-ups, and earn the same level
of profits.
Proof. The proof follows from Lemma 1 and Proposition 1. From expressions (11)
and (12), equilibrium care levels amount to xM1 = (4h − 1)/4a = x∗1 − 1/2a and xM2 =
(4h + 5)/4a = x∗2 + 1/2a, highlighting the divergence of equilibrium safety and first-best
safety levels.
In order to soften price competition, firms choose a socially excessive degree of product
differentiation with the low-safety firm offering a variety with lower than first-best safety
and the high-safety firm offering a variety with higher than first-best safety. The market
19
equilibrium is symmetric in that the market is equally split between firms with the indif-
ferent consumer being located at hM = h + 1/2 = h∗. Moreover, both firms charge the
same mark-up (equal to δ1 = δ2 = 3/4a) and earn profits amounting to π1 = π2 = 3/8a.
Our contribution to the literature lies in the consideration of product liability. Accord-
ingly, the novelty of our analysis shows when product liability is introduced (i.e., when γ
becomes positive). First, we consider the influence on product safety levels, the degree of
product differentiation, and the split of consumers:
Proposition 2 Suppose Assumptions 1 and 2 hold. An increase in the firms’ share of
accident losses (i) increases both firms’ product safety levels, (ii) decreases the degree of
product differentiation, and (iii) increases the equilibrium market share of firm 1, such
that firm 1 serves more than half of the market when γ > 0.
Proof. The proof of parts (i) and (ii) follows from equations (11) to (13) (see Appendix
B). Part (iii) follows from the expression for the indifferent consumer (14).
For given safety levels, an increase in the firms’ share of losses has a direct impact
on how consumers are split between firms (as described by expression (8)). Consumers
are less concerned about the accident risk, implying that some consumers switch from
firm 2 to firm 1.12 The reality that hM increases connotes for firms 1 and 2 that average
compensable harm levels `1 and `2 increase, providing an argument for higher safety in-
vestments. In addition, the fact that consumers care less about the difference in product
safety levels means that product differentiation has less potential to soften price competi-
tion, thus lowering the incentives of firm 1 to bias x1 downwards and the incentives of firm
2 to distort x2 upwards. In other words, there are two effects resulting from an increase
in the firms’ share of losses. While both point towards a higher level of x1, the effects
are mixed when it comes to the choice of x2. More specifically, firm 2 ought to increase
product safety because its consumers’ average harm level is higher, but it should decrease
x2 since product differentiation is less important.
In order to understand this reasoning formally, we scrutinize firms’ decision-making
in stage 1. Firms’ first-order conditions for product safety in stage 1 (see expression (10))
12This is true when prices are given and when taking the second-stage price adjustment into account.From (8), we obtain the partial derivative ∂h/∂γ = β(−(1 + 2h) + a(x1 + x2))/((3 − 2βγ)2), where
from (11) and (12) a(x1 + x2) = 1 + 2h + βγ(2η − 1)/2 in market equilibrium. Consequently, ∂h/∂γ =β2γ(2η − 1)/(2(3− 2βγ)2) ≥ 0.
20
anticipate how price competition will unfold in stage 2 and can be rearranged as best-
response functions, that is, functions that yield the profit-maximizing level of product
safety of firm i for a given safety level of firm j. Specifically, we obtain
xBR1 =4(h− 1) + 2βγ(3 + η − βγ) + a(2− 3βγ)x2
3a(2− βγ)(22)
xBR2 =4(h+ 2) + 2βγ(η + βγ − 4) + a(2− 3βγ)x1
3a(2− βγ). (23)
The best-response functions have a positive slope, indicating strategic complementarity
between firms’ product safety levels. Matching our preceding informal arguments, an
increase in the level of γ shifts xBR1 outwards, that is, makes it privately optimal for firm
1 to choose a higher product safety level for any x2.13 The shift of firm 2’s best-response
function prescribes higher or lower x2 depending on the level of x1.14 However, the shift
of firm 1’s reaction function implies that firm 2’s safety level will move into the direction
of higher safety on firm 2’s new reaction function; the new equilibrium will display higher
safety levels for both firms.
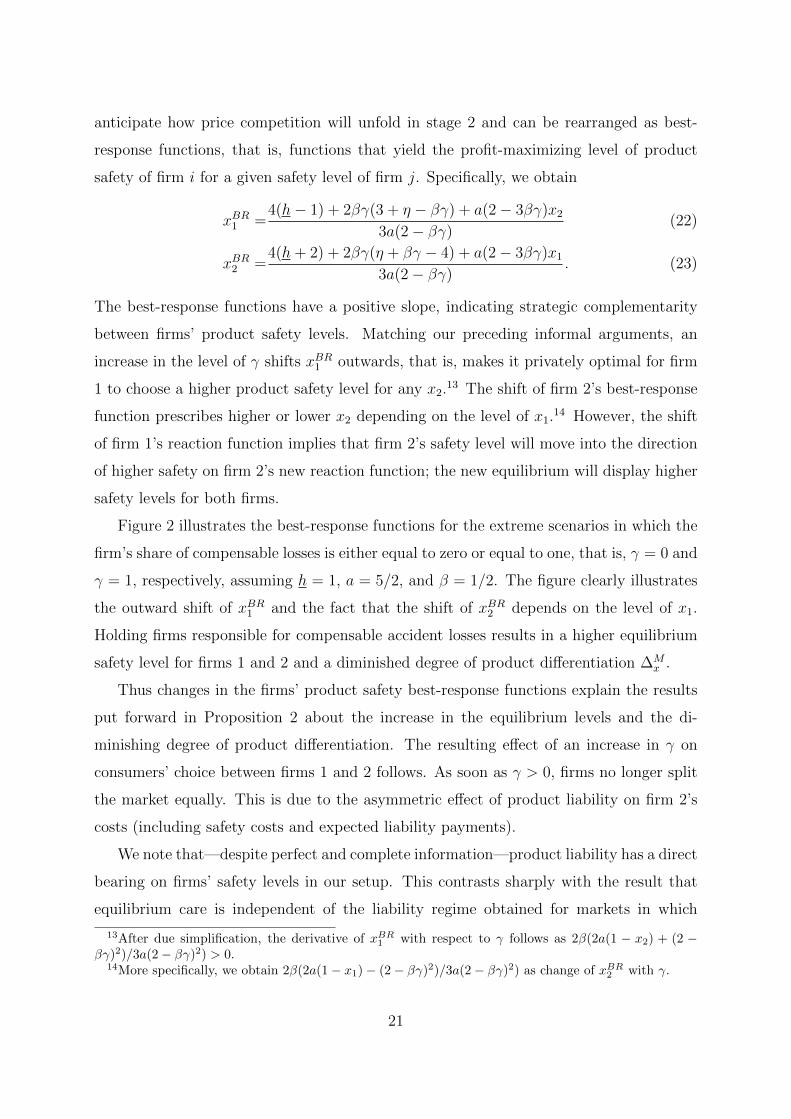
Figure 2 illustrates the best-response functions for the extreme scenarios in which the
firm’s share of compensable losses is either equal to zero or equal to one, that is, γ = 0 and
γ = 1, respectively, assuming h = 1, a = 5/2, and β = 1/2. The figure clearly illustrates
the outward shift of xBR1 and the fact that the shift of xBR2 depends on the level of x1.
Holding firms responsible for compensable accident losses results in a higher equilibrium
safety level for firms 1 and 2 and a diminished degree of product differentiation ∆Mx .
Thus changes in the firms’ product safety best-response functions explain the results
put forward in Proposition 2 about the increase in the equilibrium levels and the di-
minishing degree of product differentiation. The resulting effect of an increase in γ on
consumers’ choice between firms 1 and 2 follows. As soon as γ > 0, firms no longer split
the market equally. This is due to the asymmetric effect of product liability on firm 2’s
costs (including safety costs and expected liability payments).
We note that—despite perfect and complete information—product liability has a direct
bearing on firms’ safety levels in our setup. This contrasts sharply with the result that
equilibrium care is independent of the liability regime obtained for markets in which
13After due simplification, the derivative of xBR1 with respect to γ follows as 2β(2a(1 − x2) + (2 −
βγ)2)/3a(2− βγ)2) > 0.14More specifically, we obtain 2β(2a(1− x1)− (2− βγ)2)/3a(2− βγ)2) as change of xBR
2 with γ.
21
10
1
0
x1
x2
xBR1 (γ = 0)
xBR1 (γ = 1)
xBR2 (γ = 0)
xBR2 (γ = 1)
Figure 2: Firms’ product safety best-response functions under no compensation (γ = 0)and full compensation (γ = 1) for h = 1, a = 5/2, and β = 1/2.
consumers share the same level of harm (see, e.g., Shavell 1980). In the present framework,
shifting losses to firms lowers firms’ incentives to aim at product differentiation because its
pacifying influence on price competition becomes weaker. Instead, firms’ safety levels are
increasingly shaped by how they relate to total expected costs (including their production
costs and expected consumer harm).
Before we turn to the influence of the share of accident losses borne by firms on
mark-ups, let us briefly highlight an important difference between product liability and
minimum quality standards. Under the latter, a low-quality firm must increase its quality
level to abide by the higher minimum quality standard. In contrast, under product liability
with a higher compensatory mandate, the low-safety firm is free to consider balancing the
higher liability payments by shifting its focus more on low-harm consumers (through an
even lower safety level). Our findings show that this is not optimal for the low-safety
firm. In our analysis, we find a positive relationship between the firms’ share of losses
and safety choices, respectively. In other words, the pattern we find for equilibrium safety
levels under product liability bears some resemblance with that obtained for a minimum-
quality standard. Nevertheless, the mechanism at work is quite different.
Proposition 3 Suppose Assumptions 1 and 2 hold. An increase in the firms’ share of
22
accident losses (i) decreases firm 2’s mark-up, whereas the mark-up of firm 1 may increase
or decrease, and (ii) increases the relative mark-up of firm 1.
Proof. The proof follows from equations (17) to (19) in combination with Proposition 2.
The fact that safety becomes less important for consumers shifts demand towards the
low-safety firm. This makes firm 1 want to increase its price (see the first term in (5)). In
addition, firm 1 tolerates consumers shifting to firm 2 to a greater extent due to the higher
expected liability (see the third term in (5)). Firm 2’s lower demand and higher expected
liability makes a lower p2 optimal for firm 2, for the same reasons. In addition, both firms
consider the fact that demand is more elastic when γ is raised. In addition to the effects
just described, it is clear that the smaller degree of product differentiation makes price
competition fiercer, again resulting in downward pressure on mark-ups. In summary, the
high-safety firm will lower its mark-up in response to an increase of the firms’ share of
accident losses, whereas the low-safety firm may even increase its mark-up (but only if
the overall gain in demand of the firm dominates the direct and indirect effects of the
lower level of product differentiation).
The above considerations have a direct impact on the firms’ expected profit levels
which is summarized in the following proposition:
Proposition 4 Suppose Assumption 1 and inequality (2) hold. An increase in the firms’
share of accident losses (i) decreases firm 2’s profits, whereas firm 1’s profit level may
increase or decrease, and (ii) increases the relative profit of firm 1.
Proof. The proof follows from expressions (20) and (21) in combination with Proposition
2.
The results described in Propositions 3 and 4 make clear that allocating more accident
losses to firms harms the high-safety firm and has an ambiguous impact on the low-safety
firm. This asymmetry parallels the repercussions of an increase in the minimum quality
standard. It is a robust result in the literature that the high-quality firm suffers from
a tightening of the minimum quality standard (Ronnen 1991, Crampes and Hollander
1995).15 As is the case for a higher share of accident losses borne by firms in our setup,
15The intuition is that the stricter minimum quality standard serves as a commitment device for thelow-quality firm not to lower its quality and induces the high-quality firm to set an even higher quality
23
the picture is less clear with respect to the profit implications of a stricter minimum
quality standard for the low-quality firm because it may or may not benefit from a stricter
standard (Ronnen 1991, Crampes and Hollander 1995).
The analysis in this section has established that allocating a greater share of accident
losses to firms lowers the accident risk associated with consuming either variety of the
good. Whether or not these changes are welfare-improving will be discussed in the next
section in which we also relate to distributional implications.
5.2 Product liability, welfare, and distributional effects
In the previous section, we have described how the levels of endogenous variables and
firms’ payoffs in equilibrium change when the firms’ share of accident losses (i.e., the level
of γ) is raised. In many circumstances, it is realistic to assume that policy makers take
how competition unfolds as a given and seek welfare improvements by influencing the
circumstances under which firms compete. In the present setting, it is thus interesting
to explore how welfare responds to changes in the level of γ. In practice, legislators can
determine what kinds of harm have to be compensated in principle and what references
may be used to measure the value of the compensable harm.
When the policy maker influences the outcome indirectly with only one instrument,
namely, the liability system’s allocation of losses, the first-best level of welfare will not be
attainable. The variables that are relevant to welfare are the safety levels implemented by
firms 1 and 2, and the segmentation of consumers. In other words, there are three policy
targets. Remember that our focus on a fully covered market implies that the volume of
trade is not affected by changes in the level of γ, implying that price levels are directly
relevant only with regard to distributional effects and the allocation of consumers to firms.
In the following sections, we first concentrate on the effects of the policy instrument
on overall welfare, i.e., the sum of social costs. Afterwards, we consider distributional
effects with regard to consumers with heterogeneous harm levels and with respect to the
population of consumers on the one hand and firms on the other.
to differentiate itself from the low-quality firm. This lowers the market share of the high-quality firm,meaning that the low-quality firm enjoys some sort of first-mover advantage. This commitment aspectis not present in our analysis. However, given that the low-safety firm has an incentive to increase itssafety level, the implication for the high-safety firm is the same: it makes a lower profit.
24
5.2.1 Implications of increasing the firms’ share of losses for social costs
The benevolent policy maker chooses the level of his only policy instrument, namely, the
liability system’s allocation of losses, in order to minimize the level of social costs defined
by
SCM =(hM − h
)(a(xM1 )2
2+ (1− xM1 )
h+ hM
2
)
+(h+ 1− hM
)(a(xM2 )2
2+ (1− xM2 )
h+ hM + 1
2
), (24)
taking into account how privately optimal decisions by firms and consumers depend on
the level of γ (i.e., hM = hM(γ) and xMi = xMi (γ), i = 1, 2). It is clear from (24) that the
allocation of accident losses between firms and consumers bears no direct implication for
the level of social costs such that its only role is in guiding private decisions.
The marginal change in the level of social costs in response to an increase in γ is given
by
dSCM
dγ=dhM
dγ
(hM(xM2 − xM1 )−
a((xM2 )2 − (xM1 )2
)2
)︸ ︷︷ ︸
=:A
+dxM1dγ
(hM − h
)(axM1 −
h+ hM
2
)︸ ︷︷ ︸
=:B
+dxM2dγ
(h+ 1− hM
)(axM2 −
h+ 1 + hM
2
)︸ ︷︷ ︸
=:C
,
(25)
where xMi and hM are increasing in γ (see Proposition 2). The total marginal effect in
expression (25) is composed of three different terms: term A indicates the change in social
costs due to the reallocation of consumers from firm 2 to firm 1, terms B and C describe
the changes in social costs that result from the change in care levels for given firm-specific
demand levels. These implications will be discussed in turn.
When γ > 0, the market is not split equally between firms 1 and 2 which, however,
is a characteristic of the first-best allocation. Instead, more consumers buy from firm 1.
However, given that equilibrium product safety levels differ from socially optimal care
levels, the first-best split of consumers may not be second best. Given xM1 and xM2 (as in
expressions (11) and (12)), we use term A in expression (25) to derive that the second-best
25
level for the harm level of the indifferent consumer hSB is
hSB = h∗ + βγ2η − 1
4(26)
which indeed exceeds the first-best level when γ > 0. Comparing the harm level of the
indifferent consumer in the market equilibrium hM , from expression (14), with the one in
the second-best allocation, we arrive at
hM − hSB =−βγ(1− βγ)(2η − 1)
2(3− 2βγ)≤ 0. (27)
This connotes that the benevolent policy maker would like to allocate even more consumers
to firm 1, given the safety levels that result in equilibrium. In other words, the influence
that the liability system’s allocation of losses bears on how consumers are split up between
firms suggests raising the share γ to one.16
The terms B and C indicate whether the privately optimal safety levels fall short of
or exceed what the policy maker would implement given the market equilibrium split of
consumers hM . For γ = 0, we have established that the market equilibrium features an
excessive degree of product differentiation, coming about via xM1 < x∗1 and xM2 > x∗2.
For γ > 0, the first-best safety levels may not be socially optimal for the allocation of
consumers to firms described by hM . From expression (25), the second-best levels of care
xSBi for the given split of consumers described by hM result as
xSBi = x∗i +βγ(2η − 1)
8a(3− 2βγ), (28)
where ∆SBx = 1/2a = ∆∗
x. For γ > 0, the second-best safety levels exceed the first-best
care levels because both firms serve consumers with higher expected harm levels (due to
hM > h∗). Comparing the product safety levels in the market equilibrium with the ones
in the second-best allocation, we arrive at
xM1 − xSB1 = −6− βγ(6η + 1)
12a− βγ (6(η − 1) + 18η(1− βγ) + 5βγ)
24(3− 2βγ)(4− 3βγ)< 0 (29)
and
xM2 − xSB2 =1
2a+βγ(η − 5/4− βγ
4(4−3βγ)
)(5− 4βγ)
4a(3− 2βγ)> 0, (30)
16However, note that term A is equal to zero when γ = 0 because the market equilibrium segmentationof consumers is second best in that scenario, meaning that this effect cannot rationalize the marginalintroduction of product liability.
26
where the signs follow from Assumption 2. The equilibrium degree of product differen-
tiation exceeds the second-best level for all levels of γ. This is intuitive because firms’
decision-making is still influenced by the desire to soften price competition. Firm 1’s
safety choice falls short of the second-best safety level. Accordingly, term B in expression
(25) is negative since an increase in firm 1’s safety level is cost justified in that it reduces
the expected harm of firm 1’s consumers by more than it increases production costs. In
other terms, the influence that the liability system’s allocation of losses bears on firm 1’s
safety level also suggests raising γ to one. At the same time, firm 2’s safety level is exces-
sive compared to the second-best safety level xSB2 . Term C is positive since a decrease in
firm 2’s safety expenditures would result in a decrease in precaution costs that more than
offsets the increase in expected harm given the allocation of consumers to firms. This
argues against a high liability parameter γ.
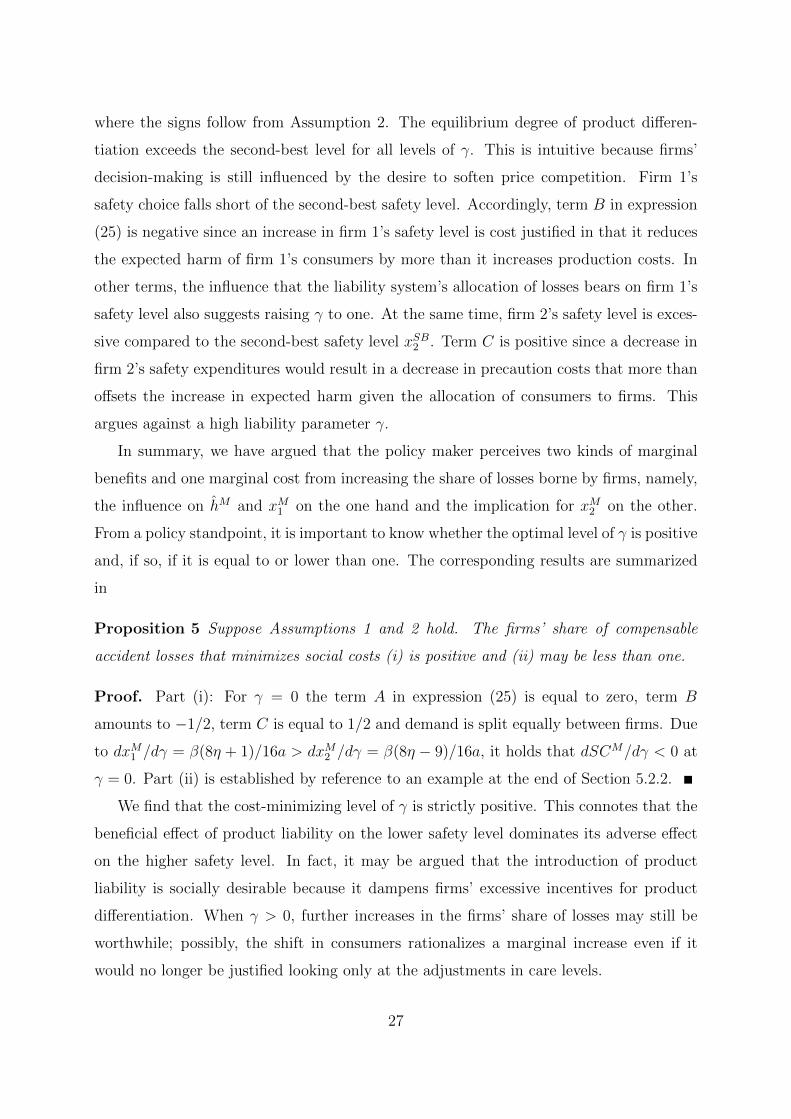
In summary, we have argued that the policy maker perceives two kinds of marginal
benefits and one marginal cost from increasing the share of losses borne by firms, namely,
the influence on hM and xM1 on the one hand and the implication for xM2 on the other.
From a policy standpoint, it is important to know whether the optimal level of γ is positive
and, if so, if it is equal to or lower than one. The corresponding results are summarized
in
Proposition 5 Suppose Assumptions 1 and 2 hold. The firms’ share of compensable
accident losses that minimizes social costs (i) is positive and (ii) may be less than one.
Proof. Part (i): For γ = 0 the term A in expression (25) is equal to zero, term B
amounts to −1/2, term C is equal to 1/2 and demand is split equally between firms. Due
to dxM1 /dγ = β(8η + 1)/16a > dxM2 /dγ = β(8η − 9)/16a, it holds that dSCM/dγ < 0 at
γ = 0. Part (ii) is established by reference to an example at the end of Section 5.2.2.
We find that the cost-minimizing level of γ is strictly positive. This connotes that the
beneficial effect of product liability on the lower safety level dominates its adverse effect
on the higher safety level. In fact, it may be argued that the introduction of product
liability is socially desirable because it dampens firms’ excessive incentives for product
differentiation. When γ > 0, further increases in the firms’ share of losses may still be
worthwhile; possibly, the shift in consumers rationalizes a marginal increase even if it
would no longer be justified looking only at the adjustments in care levels.
27
Importantly, the optimal value of γ may be lower than one for certain parameter
constellations. This finding is interesting particularly since there is a non-compensated
share of harm 1−β by assumption even when γ = 1. From our discussion of the different
marginal effects, it is clear that scenarios featuring a cost-minimizing level of γ less than
one must be such that firm 2’s deviation from the second best regarding the safety choice
bears heavily on the level of social costs. This will result, for example, when the marginal
safety cost parameter a is high. However, the fact that the inappropriate safety choice of
firm 2 is relevant only to a relatively small set of consumers at high levels of γ, shifting all
of the compensable losses to firms minimize social costs in the bulk of scenarios. However,
this qualification is not necessarily applicable when the share of compensable losses (i.e.,
β) is low, because the high-safety product variety remains of interest for many consumers
in that scenario. We will continue to discuss this aspect at the end of Section 5.2.2 where
we provide results for a specific example. The example illustrates that it is most likely
for a value of γ < 1 to maximize welfare when a high level of a is combined with a low
level of β.
5.2.2 Implications of increasing the firms’ share of losses for consumer surplusand total profits
The analysis in the preceding section has described how a change in the liability system’s
allocation of losses influences the level of social costs, proxying welfare by the sum of
producer and consumer surplus. In many circumstances, policy makers have other ob-
jectives in mind when making decisions on public policy. For example, with regard to
competition policy, it is argued for many jurisdictions that antitrust policy concentrates
on the implications for consumer surplus.17 To follow along these lines, we will explore
how changes in the level of γ influence consumer surplus.
An individual consumer (with expected harm h) who purchases the good from firm i
enjoys utility equal to
U = v − (pMi + (1− xMi )h(1− βγ)), (31)
17Salop (2010) comments on the evidence which concludes that the consumer standard is indeed theone legislated by US Congress in adopting the Sherman Act. Moreover, from a normative point of view,he points out that the consumer standard is better than a total welfare standard for achieving the goalsof antitrust legislation. Lyons (2003) notes, in the context of merger policy, that most major competitionauthorities apply a consumer welfare standard.
28
where it clearly shows that in the event of an accident the level of harm is relevant to the
consumer’s well-being only to the extent that the harm is not compensated (measured by
1− βγ). A marginal increase in the firms’ share of losses from product-related accidents
influences the utility of a consumer who does not switch suppliers as follows
dU
dγ= −dp
Mi
dγ+ βh(1− xMi ) +
dxMidγ
h(1− βγ). (32)
Any increase in the price lowers the amount of money available for alternative uses.
However, the consumer benefits from a higher level of γ due to the direct effect on the
level of losses that remain with the consumer and the indirect effect on firm i’s level of
safety. It is important to note that the price of the good need not increase when γ is
raised even though both the costs of precaution and expected liability payments of firm i
increase. This is due to the fact that mark-ups change as well (see expressions (17) and
(18)). In such a scenario, the consumer is unambiguously made better off by an increase in
the level of losses borne by firms. However, this will also occur when prices increase with γ
as long as the two marginal benefits are sufficiently high. Breaking up the variation in the
price level into its different components (according to pMi = a(xMi )2/2+γ(1−xMi )`i+δMi ),
we can rewrite the change in utility as
dU
dγ= (1− xMi )
(βh− `i − βγ
dhM
dγ
1
2
)+((1− βγ)h+ γ`i − axMi
) dxMidγ− dδMi
dγ. (33)
In our setup, shifting losses to firms has real consequences. In the standard product
liability framework with homogeneous consumers and perfect information, such conse-
quences are absent (see, e.g., Hamada 1976, Shavell 2004). In the latter scenario, neither
mark-ups nor safety levels are influenced by the design of the liability regime. Further-
more, a consumer’s harm level equals average expected harm, and the advantage of a
higher compensation in the event of an accident is just offset by the increase in prices
reflecting the increase in firms’ liability costs. Contrary to that, in our setup, the liability
system has a direct bearing on mark-ups (i.e., dδMi /dγ ≶ 0), increases safety levels (i.e.,
dxMi /dγ > 0), and changes firms’ expected liability payments by reallocating consumers
from firm 2 to firm 1 (i.e., dhM/dγ > 0). Moreover, the direct change in firms’ per-
unit costs does not cancel out with the direct benefit for consumers from higher damages
payments for each single consumer (i.e., βh 6= `i for most consumers).
In expression (33), a higher level of expected harm makes it more likely that the
consumer benefits from a change in the liability system’s allocation of losses because a
29
higher level of h magnifies a part of the marginal benefits resulting from an increase in
the level of γ without similar implications for the marginal costs therefrom. This also
implies that a consumer of firm i with harm level h + ε, ε > 0, will always benefit from
the change in the allocation of losses when the consumer of firm i with harm level h does
so. For concreteness, we consider the utility implications of introducing product liability
(i.e., the value of expression (33) at γ = 0) for the consumers at both ends of the harm
interval h = h and h = h+ 1. We obtain
dUh=hdγ|γ=0 = β
69− 40η
64aQ 0 (34)
anddUh=h+1
dγ|γ=0 = β
29 + 40η
64a> 0. (35)
In other words, starting to shift some of the compensable accident losses to firms is nec-
essarily increasing the utility of individuals with very high levels of harm. The benefit
accruing from the higher product safety level dominates any price increase. Firms’ prices
reflect average damages payments in the event of an accident as a cost component. Ac-
cordingly, high risk consumers benefit from a cross-subsidization by low-risk consumers
of the same firm, dampening potential price increases. In contrast, individuals with low
levels of harm will benefit from introducing product liability only when η = a − h is
sufficiently small (implying that the additional care costs must be small enough or that
even the lowest harm level must be sufficiently high).
This finding may be compared to the related result from the scenario in which a
minimum-safety requirement is introduced. In that case, the combination of both a
minimum-standard requirement only slightly above the level chosen by the low-safety
firm in the unregulated equilibrium and a modest response of the high-safety firm can
assure that all consumers benefit from the policy (see Crampes and Hollander 1995). In
our setting, a similar result is possible for the introduction of product liability.
In summary, we assert that
Proposition 6 Suppose Assumptions 1 and 2 hold. The marginal introduction of product
liability (i) benefits consumers with a very high harm level (i.e., h ≈ h+ 1) and (ii) may
harm or benefit consumers with lower harm levels.
Proof. Follows from the discussion above.
30
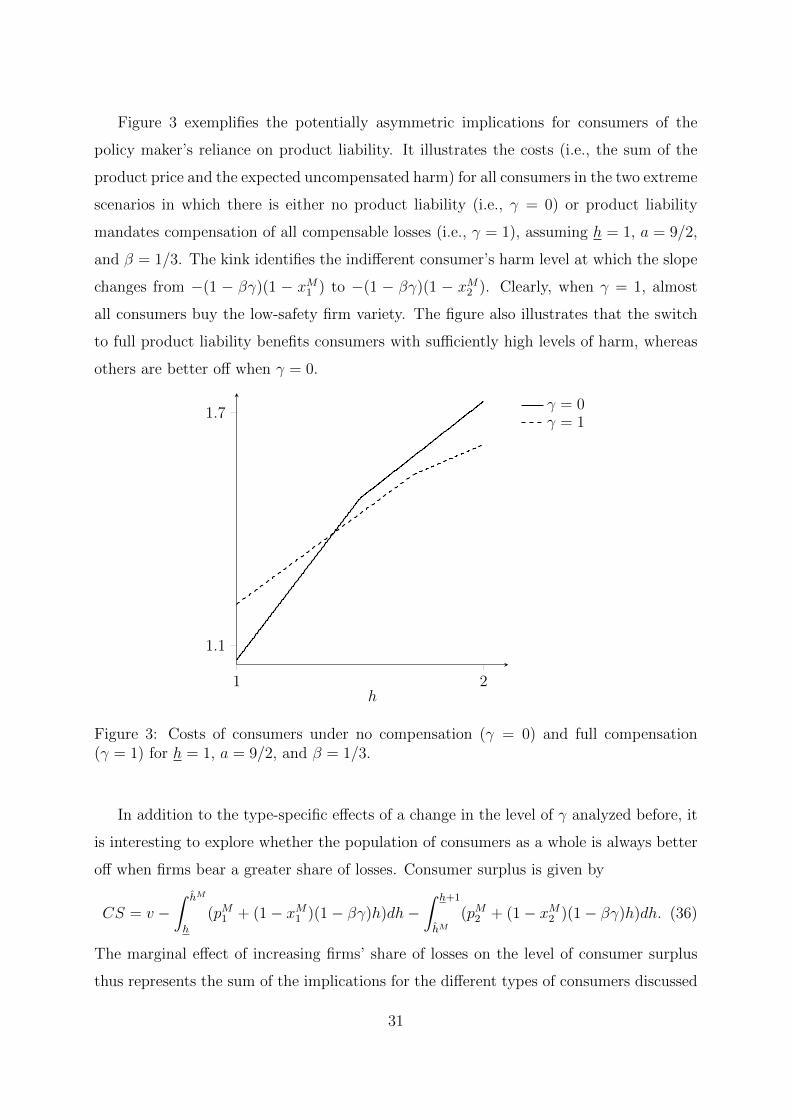
Figure 3 exemplifies the potentially asymmetric implications for consumers of the
policy maker’s reliance on product liability. It illustrates the costs (i.e., the sum of the
product price and the expected uncompensated harm) for all consumers in the two extreme
scenarios in which there is either no product liability (i.e., γ = 0) or product liability
mandates compensation of all compensable losses (i.e., γ = 1), assuming h = 1, a = 9/2,
and β = 1/3. The kink identifies the indifferent consumer’s harm level at which the slope
changes from −(1 − βγ)(1 − xM1 ) to −(1 − βγ)(1 − xM2 ). Clearly, when γ = 1, almost
all consumers buy the low-safety firm variety. The figure also illustrates that the switch
to full product liability benefits consumers with sufficiently high levels of harm, whereas
others are better off when γ = 0.
1 2
1.1
1.7
h
γ = 0γ = 1
Figure 3: Costs of consumers under no compensation (γ = 0) and full compensation(γ = 1) for h = 1, a = 9/2, and β = 1/3.
In addition to the type-specific effects of a change in the level of γ analyzed before, it
is interesting to explore whether the population of consumers as a whole is always better
off when firms bear a greater share of losses. Consumer surplus is given by
CS = v −∫ hM
h
(pM1 + (1− xM1 )(1− βγ)h)dh−∫ h+1
hM(pM2 + (1− xM2 )(1− βγ)h)dh. (36)
The marginal effect of increasing firms’ share of losses on the level of consumer surplus
thus represents the sum of the implications for the different types of consumers discussed
31
above. The additional effect via the increase in the harm level of the indifferent consumer
is equal to zero. Since some consumers may very well be worse off after a marginal increase
in γ as argued above, dCS/dγ may sum over positive and negative terms. Again, it is of
key interest whether we can make statements about the change in consumer surplus as
well as profits for the introduction of product liability (i.e., an increase in γ at γ = 0) and
when completing the shifting of compensable losses (i.e., at γ = 1).
Proposition 7 Suppose Assumptions 1 and 2 hold. An increase in the firms’ share of
accident losses γ (i) increases consumer surplus and decreases total profits at γ = 0 and
(ii) may increase or decrease consumer surplus and total profits at γ = 1.
Proof. The first part follows from the evaluation of the derivative of CS with respect
to the firms’ share of accident losses at γ = 0 (which gives 33β/32a) and the evaluation
of the derivative of πM1 + πM2 with respect to the firms’ share of accident losses at γ = 0
(which gives −7β/8a). Part (ii) is established by reference to an example at the end of
this section.
Proposition 5 established that the marginal introduction of product liability is socially
desirable. Proposition 7 explains that this is due to the increase in consumer surplus
dominating the decrease in total profits. This gain for consumers follows from the fact
that the excessive degree of product differentiation is attenuated by the introduction of
product liability, bringing about fiercer price competition. However, for marginal increases
in the firms’ share of losses starting from γ > 0, it is no longer assured that consumers
as a whole benefit. With respect to total profits, the market dominance of the low-safety
firm (due to the cost asymmetry implied by product liability) can eventually bring about
an increase in total profits.
We conclude this section by presenting some numerical illustrations to convey an idea
of the different possible patterns for the variables of interest. For this, we assume h = 1
and consider the scenarios (S1) a = 5/2 and β = 1/2, (S2) a = 9/2 and β = 1/3,
and (S3) a = 9 and β = 1/10 such that the cost of safety is increasing when the share
of compensable harm is decreasing. We are interested in the distributional and welfare
patterns that emerge when we vary the allocation of losses between firms and consumers
(i.e., when we increase γ). To make the scenarios easily comparable even though the
different parameter configurations create distinct levels of variables, we present normalized
32
levels for the variables of interest, using the level of the variable at hand evaluated at
γ = 0 for normalization. Our main interest is with the impact of the level of γ on profits,
consumer surplus, and social costs.
Figure 4 illustrates how the level of costs borne by consumers is influenced by the
shifting of accident losses towards firms. In scenario (S1), consumers are positively affected
by any marginal increase in the firms’ share of accident losses. In scenario (S2), the level
of costs borne by consumers first decreases and then increases, never to reach the original
level again. To be precise, the level of γ that is optimal for consumers in the second
scenario is interior at γ ≈ .55. For scenario (S3), the level of γ that minimizes the costs
borne by consumers (i.e., maximizes consumer surplus) is reached already at γ ≈ .33. In
other words, the implications of increasing the firms’ share of losses soon start to lower
the utility of the mass of consumers; note that at γ = 1 costs are even higher than for
γ = 0 in scenario (S3). However, it must be remembered that there are asymmetric effects
on different types of consumers (according to the personal level of harm). For example,
consumers with h ≈ h + 1 benefit from an increase in the level of γ for all levels of the
firms’ share of accident losses.
10.88
1
γ
S1S2S3
Figure 4: Costs borne by consumers as a function of γ in our three scenarios.
Figure 5 illustrates how the normalized sum of profits is affected by the shifting of
accident losses towards firms. In scenario (S1), the sum of profits is decreasing everywhere
33
in the level of the firms’ share of accident losses. In contrast, in scenarios (S2) and (S3),
we find that firm 1 benefits, whereas firm 2 suffers from the change in the liability regime.
Our analysis has established that product liability drives a wedge between the outcome
attained by firms 1 and 2. The positive effect on firm 1’s profits actually dominates the
adverse effect on firm 2’s profits in scenario (S3) such that the sum of profits is absolutely
higher when γ = 1.
1
1.1
γ
πM 1
+πM 2
S1S2S3
Figure 5: Sum of profits of firms 1 and 2 as a function of γ in our three scenarios.
Finally, we address in which way the sum of profits and consumer surplus combine to
determine the social welfare implications of different liability regimes. For scenario (S1),
we have asserted that consumers benefit, while firms suffer from any marginal increase
in the level of γ. Figure 6 shows that shifting all compensable losses onto firms clearly
increases social welfare. The same conclusion is reached in scenario (S2); however, in this
scenario, it must be acknowledged that marginal increases in the level of γ are appreciated
only by firm 1, whereas firm 2 and, ultimately, the population of consumers is worse off.
In other words, increasing the level of γ after reaching γ ≈ .55 is, ultimately, efficiency-
enhancing, but gains are concentrated on firm 1. In scenario (S3), we find that the cost-
minimizing level of the firms’ share of losses is less than one. In fact, the cost-minimizing
level is γ ≈ .68. For higher levels of γ, the additional costs imposed on consumers are no
longer offset by the increase in the sum of profits.
34
1
0.98
1
γ
S1S2S3
Figure 6: Social costs as a function of γ in our three scenarios.
The discussion in this section has shown that product liability may involve intricate
distributional effects between consumers as well as between consumers and producers.
While it is intuitive that consumers with the highest level of harm are likely to benefit
from the increase in product safety induced by stricter product liability, it is interesting
that we find that consumers with low harm levels may likewise benefit from some shifting
of accident losses. This is perhaps surprising because the price increase that consumers
with low harm levels have to tolerate partly cross-subsidizes other consumer types (since
firms price in light of the expected liability of its average consumer). The intuition for
this possibility relates to the increase in the fierceness of price competition between firms.
With an increase in γ, any difference in firms’ safety levels becomes less important for
consumers that give greater concern to price differences. Consequently, firms have weaker
incentives to differentiate their products when they are subject to product liability in the
first place. However, this advantageousness at the limit does not necessarily generalize
to marginal increases in γ up to one. The fact that the sum of profits may eventually
increase with γ shows that the asymmetry between firms introduced by product liability
may finally dampen the direct effect of fiercer price competition and may even lead to a
fall in consumer surplus.
35
6 Extension: Decoupling firms’ liability payments and
consumers’ damages awards
In this section, we briefly compare our findings to those from a scenario in which damages
obtained by consumers and firms’ liability payments are decoupled.18 This chapter serves
two purposes. Most importantly, the analysis serves as a contrast to our main results,
highlighting the role of the responsiveness of firms’ expected liability to variations in prices
and safety levels. The decoupling of damages received by consumers and firms’ liability
payments cuts the direct link between prices and safety choices on the one hand and
expected liability payments in the event of an accident on the other. We will establish
that this cut implies that the equilibrium remains symmetric even in the presence of
product liability and that an increase in γ leads to a reduction of the high-safety firm’s
care level (whereas it led to an increase in our main analysis). In addition, the results
are interesting in their own right because of the importance of liability insurance and the
observation that insurance companies often lump different kinds of risks (in our case the
low-safety firm and the high-safety one) together (see, e.g., Wagner 2006).19
We specify decoupling by assuming that consumers receive a type-specific damages
payment in the event of a product-related accident that is equal to γβh, while each
firm pays a uniform amount m in the event of an accident to fund paying out harmed
consumers. A balanced budget rule applies such that firms’ expected payments are equal
to the expected outlays to consumers. The payment firms have to make in the event
of an accident is based on rational expectations (i.e., it is determined in expectation
of the market equilibrium). Our decoupling institution bears resemblance to product
liability insurance with some experience-rating because the firms’ liability payments are
proportional to the number of accidents.
The timing is as follows: in stage 0, the amount m payable in the event of an accident
is determined. As before, firms choose their product safety levels in stage 1 and price
competition unfolds in stage 2.
When firms compete in prices in stage 2, firm-specific demand continues to follow
18Polinsky and Che (1991) provide a seminal contribution on decoupling the award to the plaintiff fromthe payment made by the defendant.
19Decoupling is observed, for example, in the realm of medical malpractice (see, e.g., Danzon 2000) orcomes in the form of management and professional liability insurance.
36
from the harm level of the indifferent consumer specified in expression (3). In particular,
consumers care about both prices and safety because there is incomplete compensation in
the event of an accident. Incorporating decoupling, firms’ profit equations are given by
πi =
(pi −
ax2i2− (1− xi)m
)qi(x1, x2, p1, p2), i = 1, 2, (37)
where q1 = h − h and q2 = 1 − q1. Importantly and in contrast to what was true in our
main analysis, a variation in the price of firm i is inconsequential for the liability payment
in the event of an accident. Using the equilibrium in prices for given safety levels, we
obtain the reduced profit equations
πi = ∆x(1− βγ)qi︸ ︷︷ ︸=δi
qi, (38)
where firm i’s mark-up is simplified relative to (6)–(7) because the level of the price no
longer directly influences the expected liability in the event of an accident. The harm
level of the indifferent consumers is
h(x1, x2) =(4h+ 2)(1− βγ)− 2m+ a(x1 + x2)
6(1− βγ), (39)
where firm 1’s market share is still increasing in both safety levels.
In stage 1, the firms’ simultaneous product safety choice results in care levels of
x1 =4h− 1
4a(1− βγ) +
m
a(40)
and
x2 = x1 +3(1− βγ)
2a= x1 + ∆x. (41)
In stage 0, the balanced budget constraint for the decoupled liability system requires
that m is set equal to
m = βγ2h+ 1
2−√
(2η − 1)2 + 3βγ(1− βγ)− 2η + 1
4. (42)
Note that the first term in expression (42) equals the expected liability, taking the av-
erage over all consumers. The second term is the adjustment necessary to account for
the fact that consumers with higher (lower) harm levels are served by the high-safety
(low-safety) firm such that high-harm consumers are victimized less often than low-harm
consumers. Compared to our main analysis, the decoupled liability system implies some
cross-subsidization from the low-safety to the high-safety firm given that `2 > m > `1.
We summarize the main results for the decoupled liability system in Proposition 8.
37
Proposition 8 Suppose Assumptions 1 and 2 hold and that a decoupled liability system
applies.
(i) The market is split equally between firms for all levels of γ (i.e., the harm level of the
indifferent consumer is hMD = h + 1/2 = h∗). Both firms charge the same mark-up on
variable costs, δMDi = 3(1 − βγ)2/4a, and obtain the same level of profits πi = δMD
i /2,
i = 1, 2; mark-ups and profits are continuously decreasing in the liability parameter γ.
(ii) Firms’ product safety levels are xMD1 and xMD
2 resulting from expressions (40) and
(41) in combination with (42), where product safety of the low-safety (high-safety) firm
increases (decreases) in the liability parameter γ. The degree of product differentiation
∆MDx decreases with γ.
Proof. See Appendix C.
The results from this section contrast in several ways with the findings from our main
analysis. First, under a decoupled liability system, the market equilibrium is symmetric
in shares, mark-ups, and profits for all levels of the firms’ share of losses. In contrast,
in the main part of the paper, product liability brought about an asymmetry in shares,
mark-ups, and profits. Second, in the extension presented in this section, less concern of
consumers for differences in safety due to higher compensation had the intuitive result
of intensifying price competition and thereby reducing firms’ profits. In contrast, in the
main part of the paper, even though an increase in the level of γ shifted importance from
any difference in safety levels to the difference in price levels, it was possible that firm 1’s
profits and possibly even the sum of profits increase when γ is marginally raised. Finally,
the product-safety level of the high-safety firm declines with the firms’ share of losses in the
model with decoupled liability; this bears out the intuition from the standard literature
on vertical differentiation. In contrast, the product-safety level of the high-safety firm
increases in our main analysis in response to a higher level of γ.
In summary, this extension highlights that consideration of the reality that firms’
price-setting and product safety choices determine the clientele, which in turn determine
the firms’ expected liability payments, brings about unique and previously unexplored
implications of product liability for product differentiation in equilibrium.
38
7 Conclusions
Firms’ incentives for product design are shaped by both market forces and anticipated
implications regarding product liability. When a product-related accident is more detri-
mental for some consumers than for others, varieties of the good with different risk at-
tributes will evolve from the firms’ strategic market interaction, catering to consumers
with different harm characteristics. This paper provides an analysis of the interaction
between product liability and vertical product differentiation in a duopoly in which firms
first commit to product safety and then compete in prices. Starting from an equilibrium
in which firms have no legal obligation to compensate product-related losses at which
product differentiation is excessive, we trace out the implications of raising the firms’
shares of compensable accident losses for accident risk, product differentiation with re-
spect to product safety, the intensity of price competition, and welfare. We establish
that since firms’ actions bear not only on their mark-ups and demand levels but also on
their expected liability, an intricate relationship between product liability and product
differentiation exists.
Our results show that allocating more losses to firms entails that both product vari-
eties become safer but less differentiated. Moreover, in our framework in which consumers
are perfectly informed about the level of harm and the level of product safety, there are,
nevertheless, real consequences from changing the allocation of losses between consumers
and firms. These changes increases welfare defined as the sum of consumer and pro-
ducer surplus in most but, interestingly, not in all cases. Shifting losses to firms benefits
consumers with high levels of harm, while possibly lowering the well-being of low-harm
consumers. Similarly, shifting responsibility for losses incurred in the event of an accident
to firms has asymmetric repercussions for different types of firms. This fact may even
threaten the industry structure as a duopoly (since the market share of the high-safety
firm is diminishing with the firms’ share of losses) and will have important implications
when the political economy of product liability is considered. Our analysis clarifies that
product liability changes the market outcome of an industry with vertical product differ-
entiation via different channels than minimum-safety requirements, which are the most
prominent policy intervention in markets with vertical product differentiation.
The present analysis studies the influence of product liability on vertical product dif-
39
ferentiation, an important aspect that was neglected in the literature heretofore. We hope
that our analysis stimulates further investigations. In some models of vertical product
differentiation, market coverage is incomplete. We conjecture that this will bring about
additional effects of product liability because we have shown that it is high-harm con-
sumers who benefit from shifting more losses to firms. As a result, in such a setting,
allocating more losses to firms is likely to increase the volume of sales. Furthermore, one
may consider the scenario in which the quality costs (at least partly) represent fixed costs
(e.g., product design). In this case, additional complications may arise from the fact that
average production costs decrease in firm output. Other interesting avenues for further
research concern consumer information. One natural extension is the scenario in which
some or all consumers are not fully informed about their expected harm levels at the time
of purchase. Moreover, consumers may not be able to perfectly judge the safety features of
the products they buy. In this scenario, firms’ incentives for signaling or costly disclosure
would be possible avenues of future research.
References
Choi, A., and K. Spier, 2014. Should Consumers Be Permitted to Waive Products Liabil-
ity? Product Safety, Private Contracts, and Adverse Selection. Journal of Law, Economics
& Organization 30, 734-766.
Crampes, C., and A. Hollander, 1995. Duopoly and Quality Standards. European Eco-
nomic Review 39, 71–82.
Danzon, P.M., 2000. Liability for Medical Malpractice. In: Culyer, A.J. and J.P. New-
house, Handbook of Health Economics, Volume 1B, Elsevier. 1339-1404.
Daughety, A., and J. Reinganum, 1995. Product Safety: Liability, R&D, and Signaling.
American Economic Review 85, 1187-1206.
Daughety, A., and J. Reinganum, 2006. Markets, Torts and Social Inefficiency. Rand
Journal of Economics 37, 300-23.
Daughety, A., and J. Reinganum, 2008. Products Liability, Signaling and Disclosure.
Journal of Institutional and Theoretical Economics 164, 106-26.
Daughety, A., and J. Reinganum, 2013. Economic Analysis of Products Liability: Theory.
In: Arlen, J.H., Research Handbook on the Economics of Torts, Edward Elgar.
40
Endres, A., and A. Ludecke, 1998. Incomplete Strict Liability: Effects on Product Dif-
ferentiation and Information Provision. International Review of Law and Economics 18,
511–528.
Geistfeld, M., 2009. Products Liability. In: Faure, M., Tort Law and Economics, Edward
Elgar.
Goldberg, J.C.P., and B.C. Zipursky, 2010. The Easy Case for Products Liability Law:
A Response to Professors Polinsky and Shavell. Harvard Law Review 123, 1919–1948.
Hamada, K., 1976. Liability Rules and Income Distribution in Product Liability. Ameri-
can Economic Review 66, 228-234.
Kaplow, L., and S. Shavell, 1996. Accuracy in the Assessment of Damages. Journal of
Law and Economics 39, 191-210.
Kuhn, M., 2007. Minimum Quality Standards and Market Dominance in Vertically Dif-
ferentiated Duopoly. International Journal of Industrial Organization 25, 275-290.
Lovells, 2003. Product Liability in the European Union—A Report for the European
Commission.
Lyons, B.R., 2003. Could Politicians Be More Right Than Economists?—A Theory of
Merger Standards. EUI Working Paper RSC No. 2003/14.
Motta, M., 1993. Endogenous Quality Choice: Price and Quantity Competition. Journal
of Industrial Economics 41, 113–131.
Oi, W.Y., 1973. The Economics of Product Safety. Bell Journal of Economics and Man-
agement Science 4, 3–28.
Ordover, J.A., 1979. Products Liability in Markets with Heterogeneous Consumers. Jour-
nal of Legal Studies 8, 505-525.
Polinsky, A.M., and Y.K. Che, 1991. Decoupling Liability: Optimal Incentives for Care
and Litigation. Rand Journal of Economics 22, 562-570.
Polinsky, A.M., and W. Rogerson, 1983. Products Liability, Consumer Misperceptions,
and Market Power. RAND Journal of Economics 14, 581–589.
Polinsky, A.M., and S. Shavell, 2010a. The Uneasy Case for Product Liability. Harvard
Law Review 123, 1437–1492.
Polinsky, A.M., and S. Shavell, 2010b. A Skeptical Attitude About Product Liability
Is Justified: A Reply to Professors Goldberg and Zipursky. Harvard Law Review 123,
1949–1968.
41
Posner, R., 1998. Economic Analysis of Law. Aspen Publishers.
Differentiating (11) with respect to γ and collecting terms, we obtain
∂xM1∂γ
= β8η + (6η + 1) [4− 8γβ + 3γ2β2]
4a (4− 3γβ)2
= β8η + (6η + 1) [4(1− γβ)2 − γ2β2]
4a (4− 3γβ)2
= β6η(1− γ2β2) + (2η − γ2β2) + (6η + 1)4(1− γβ)2
4a (4− 3γβ)2,
where all terms are positive due to a ≥ 2, 1 ≥ h ≥ 1/4, 1 > β > 0, 1 > γ ≥ 0.
Next, differentiating (12) with respect to γ and collecting terms, we obtain
∂xM2∂γ
= β8(η − 1) + (6η − 7) [4− 8γβ + 3γ2β2]
4a (4− 3γβ)2
= β8(η − 1) + (6η − 7) [4(1− γβ)2 − γ2β2]
4a (4− 3γβ)2
= β(2η − 1) + (6η − 7) [4(1− γβ)2 + (1− γ2β2)]
4a (4− 3γβ)2,
where all terms are positive due to the lower bound stated in assumption A1 (i.e., η ≥ 5/4),
and a ≥ 2, 1 > β > 0, 1 > γ ≥ 0.
Finally, differentiating (13) and collecting terms, we obtain
∂∆x
∂γ=
2β
a (4− 3γβ)2[−5 + 8γβ − 3γ2β2
]=
−2β
a (4− 3γβ)2[4(1− γβ)2 + (1− γ2β2)
]which is negative due to a ≥ 2, 1 > β > 0, 1 > γ ≥ 0.
C Proof of Proposition 8
Inserting (40) and (41) into (39), we immediately obtain
hMD =(4h+ 2 = (1− βγ)− 2m+ (2h+ 1)(1− βγ) + 2m
6(1− βγ)= h+
1
2.
Firms’ price mark-ups in equilibrium result as (see (38))
δMDi = ∆x(1− βγ)qi =
3(1− βγ)2
4a,
45
wheredδMD
i
dγ= −3β
3(1− βγ2a
< 0.
Furthermore, from (40) and (42)
dxMD1
dγ= −β 4h− 1
4a+ β
2h+ 1
2a− 3β(1− 2βγ)
8a√
(2η − 1)2 + 3βγ(1− βγ)
=3β
8a
(2− 1− 2βγ√
(2η − 1)2 + 3βγ(1− βγ)
)> 0.
Finally,
dxMD2
dγ=dxMD
1
dγ− 3β
2a
=3β
8a
(−2− 1− 2βγ√
(2η − 1)2 + 3βγ(1− βγ)
)< 0.
D The model for η < 5/4 + β/(4(4− 3β))
In the main part of this study, the market equilibrium has been established for the case of
an interior solution for the firms’ safety levels which required the lower bound η = a−h ≥
5/4 +β/(4(4−3β)) = ηu. In this appendix, for completeness, we describe how the results
generalize for lower values of η in which event a corner solution for the safety level of
the high-safety firm can emerge (i.e. xM2 → 1) due to either lower costs of safety (lower
values of a) or higher expected harm levels (higher values of h). We continue to restrict
attention to the parameter space allowing a pure-strategy equilibrium, i.e. η < 1/β−1/6.
In addition, according to our assumptions, the natural lower bound on η is given by η → 1
for a = 2 and h = 1. Note, that even in this case firm 2’s first-best safety level stays well
below one and amounts to x∗2 = 7/8 < 1 (see Lemma 1).
Market equilibrium: Given the equilibrium at the price-setting stage, the equilib-
rium safety choices of firms are described by20
∂π1∂x1
= 0 and∂π2∂x2≥ 0,
∂π2∂x2
(x2 − 1) = 0
conveying the idea of a possible corner solution for firm 2’s safety choice. Denoting the
equilibrium levels by xMi , i = 1, 2 to distinguish results from the main analysis, we obtain
xM1 = min
[xM1 ,
2h+ a− 2
3a+ βγ
2
3a
](43)
20In our application, the lower bound of x1 → 0 is never binding.
46
and
xM2 = min[xM2 , 1
]. (44)
The equilibrium care levels result in the indifferent consumer being located at
hM = min
[hM , h+
1
2+
4η − 5 + 2βγ
6(3− 2βγ)
]. (45)
With demand given by qM1 = hM − h and qM2 = h + 1 − hM , the equilibrium mark-ups
amount to
δM1 =
{δM1 if xM2 = xM2(2−βγ)(η+1−βγ)2
9a(3−2βγ)if xM2 = 1
(46)
and
δM2 =
{δM2 if xM2 = xM22(1−βγ)(7−2η−4βγ)(η+1−βγ)
9a(3−2βγ)if xM2 = 1
. (47)
Each firms profits equals qiδi.
Note that for 5/4 < η < ηu, xM2 < (=) 1 for low (high) values of γ. When η ≤ 5/4, it
holds that xM2 = 1 results for every value of γ ∈ [0, 1].
In contrast to our analysis of the model in the main part of the paper (see Lemma 2),
when γ = 0 and η < 5/4 we find that the equilibrium is not symmetric regarding profits
and market shares. Instead, the high-safety firm earns higher profits than the low-safety
firm and serves more than half of the market. The asymmetry is due to the fact that
the boundary on safety allows the high-safety firm to commit to refraining from further
increasing its care level.
Comparative statics of the market equilibrium: Referring to equations (43)
to (44), we observe that xM1 and hM both increase in the liability parameter γ, implying
a lower product differentiation and a higher market share for firm 1. The results are thus
in line with those presented in Proposition 2 with the exceptions that firm 2’s safety level
can no longer increase after reaching the boundary of 1 and that firm 1’s market share
may be lower than one half for η < 5/4 even for positive values of γ.
Next, from (46) and (47), we establish that both equilibrium mark-ups decrease in the
level of firms’ liability γ for η < ηu.21 For the high-safety firm, this confirms the result
presented in Proposition 3, whereas for firm 1, the ambiguity regarding the mark-up is
21The corresponding calculations for this and the following results are rather tedious and omitted hereto save space. All proofs are available on request from the authors.
47
resolved in this parameter range. In line with Proposition 3, the relative mark-up of the
low-safety firm increases in γ.
Likewise, as described in Proposition 4, the high-safety firm’s profits decrease and the
relative profit of the low-safety firm increases in γ when η < ηu. A difference emerges
only in that the low-safety firm’s profit is also strictly decreasing in γ for the low values
of η considered here.
Welfare and distributional effects: In Proposition 5, we present results about the
firms’ share of compensable losses that is socially optimal. When η < ηu, it continues to
be the case that the marginal introduction of firms’ liability is always welfare-increasing.
In contrast to the main part, the optimal extent of firms’ liability is always given by the
corner solution γ = 1. This is due to the fact that the adverse effect of shifting more losses
to firms – the increase in the already excessive high safety level – is either less important
because the cost parameter a is relatively low (when 5/4 < η < ηu) or nonexistent (when
η < 5/4).
The results mentioned in Proposition 7 are confirmed in that the marginal introduction
of firms’ liability increases consumer surplus at the expense of firms’ profits. The results
are no longer ambiguous for the marginal change when γ → 1. In fact, consumer surplus
increases in γ whereas firms’ profits decrease in γ.
We also find that the results presented in Proposition 6 are robust to the consideration
of smaller levels of η. High-harm consumers gain from the introduction of firms’ liability
is confirmed. Now, in contrast to the analysis for interior safety levels, that is also