63
1 The Indian Hotels Company Limited Analyst Meet Results for the Year ended March 31, 2016 May 19, 2016

1
The Indian Hotels Company Limited
Analyst Meet
Results for the Year ended March 31, 2016
May 19, 2016

2
These presentations may contain forward-looking statements within the meaning ofapplicable securities laws. Similarly, statements that describe our business strategy, outlook,objectives, plans, intentions or goals also are forward-looking statements
Forward-looking statements are not guarantees of future performance and involve risks anduncertainties and other factors that may cause actual results to differ materially from thoseanticipated at the time the forward-looking statements are made. Future results,performance and achievements may be affected by general economic conditions, regulatoryenvironment, business and financing conditions, foreign exchange fluctuations, cyclicalityand operating risks associated with the hospitality industry and other circumstances anduncertainties.
Although we believe the expectations reflected in such forward looking statements arebased upon reasonable assumptions, we can give no assurance that our expectations will beattained or that results will not materially differ. We undertake no obligation to publiclyupdate or revise any forward-looking statement, whether as a result of new information,future events or otherwise
Please visit our corporate website www.tajhotels.com for previous investorcommunications
Disclaimer

3
Presenter Panel
Rakesh Sarna - Managing Director & CEO
Anil P. Goel - Executive Director & CFO
Chinmai Sharma – Chief Revenue Officer

4
Outline of Presentation
Industry Trends
New Inventory – Taj Group
Sales & Marketing Initiatives
Financial Results - Standalone & Consolidated
Treasury
Other Update

5
Industry Trends
Global outlook
International travel and tourism arrivals grew by 4.4% to reach a total of 1,184 million in 2015,
50 million more than in 2014.
Strong growth in Americas (+5%), Asia Pacific (+5%), Europe (+5%), the Middle East (+3%),
whilst limited data available for Africa points to a (3%) decrease in that market
The total contribution of Travel & Tourism to GDP was 9.8% of GDP in 2015,and is forecast to
rise by 3.5% in 2016, according to WTTC’s latest analysis
As per WTTC Travel & Tourism sector generated US $7.2 trillion (9.8% of global GDP) supported
284 million jobs.
Over the next ten years, travel and tourism is anticipated to contribute US$ 11.0 trillion in GDP to
the world economy, and will support 370 million jobs worldwide.
Source : WTTC, UNWTO
6
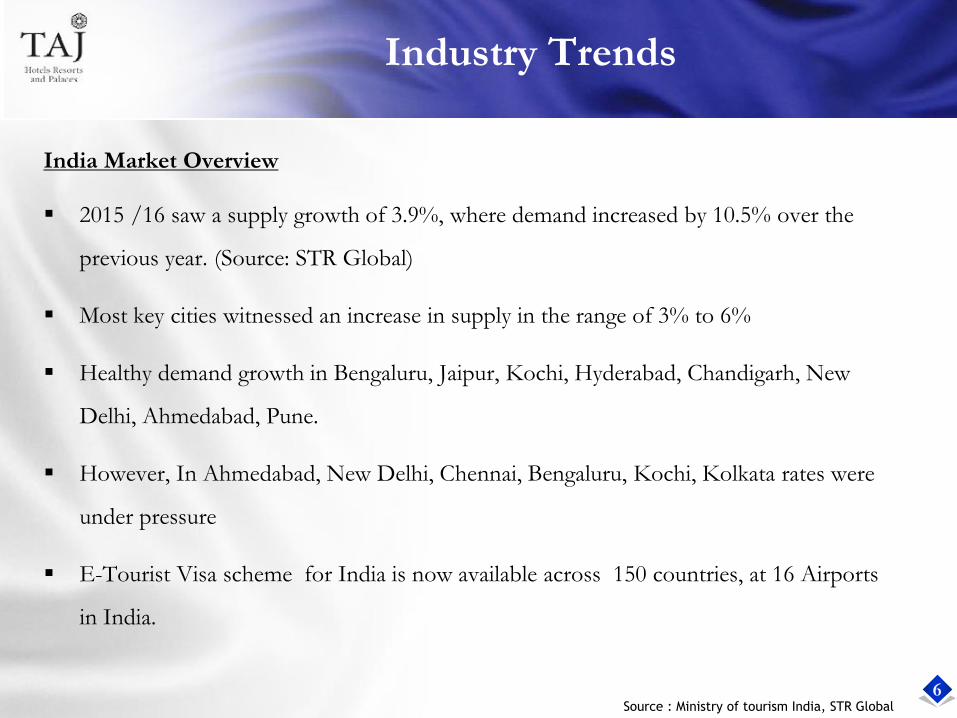
Industry Trends
India Market Overview
2015 /16 saw a supply growth of 3.9%, where demand increased by 10.5% over the
previous year. (Source: STR Global)
Most key cities witnessed an increase in supply in the range of 3% to 6%
Healthy demand growth in Bengaluru, Jaipur, Kochi, Hyderabad, Chandigarh, New
Delhi, Ahmedabad, Pune.
However, In Ahmedabad, New Delhi, Chennai, Bengaluru, Kochi, Kolkata rates were
under pressure
E-Tourist Visa scheme for India is now available across 150 countries, at 16 Airports
in India.
Source : Ministry of tourism India, STR Global
7
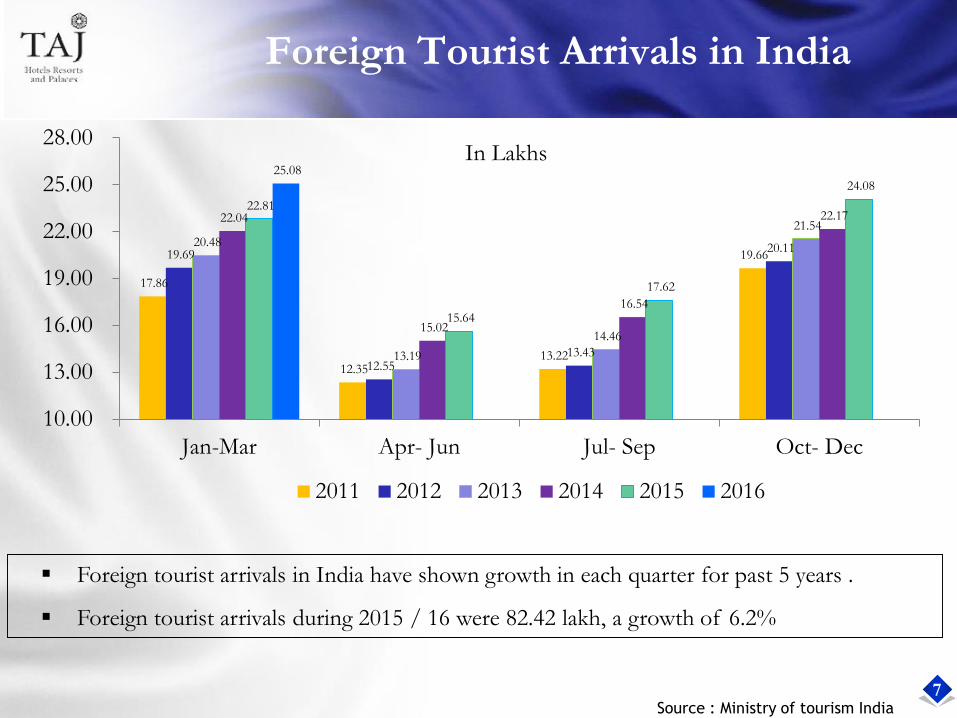
Foreign Tourist Arrivals in India
17.86
12.35 13.22
19.66 19.69
12.55 13.43
20.11 20.48
13.19
14.46
21.54 22.04
15.02
16.54
22.17 22.81
15.64
17.62
24.08
25.08
10.00
13.00
16.00
19.00
22.00
25.00
28.00
Jan-Mar Apr- Jun Jul- Sep Oct- Dec
2011 2012 2013 2014 2015 2016
In Lakhs
Foreign tourist arrivals in India have shown growth in each quarter for past 5 years .
Foreign tourist arrivals during 2015 / 16 were 82.42 lakh, a growth of 6.2%
Source : Ministry of tourism India
8
India Hotel Performance – Key cities
2015 / 16
•There has been an overall 3.9% increase in Supply in 2015 /16 as compared to the same
period last year.
•Demand growth has been 10.5% for this period However, the supply / demand gap is still
significant in most cities, impacting ARRs
Source : STR Global
3.9%
2.0%2.8%
3.7% 3.6%
8.2%
3.4%
5.3%
4.0% 3.6%4.3%
3.0%
10.5%
4.1%
7.4%6.7%
12.3% 12.3% 12.6%
11.4%
13.5%
11.9%
17.2%
9.9%
0%
2%
4%
6%
8%
10%
12%
14%
16%
18%
20%Supply Demand Scenario
Supply % Change Demand % Change
9
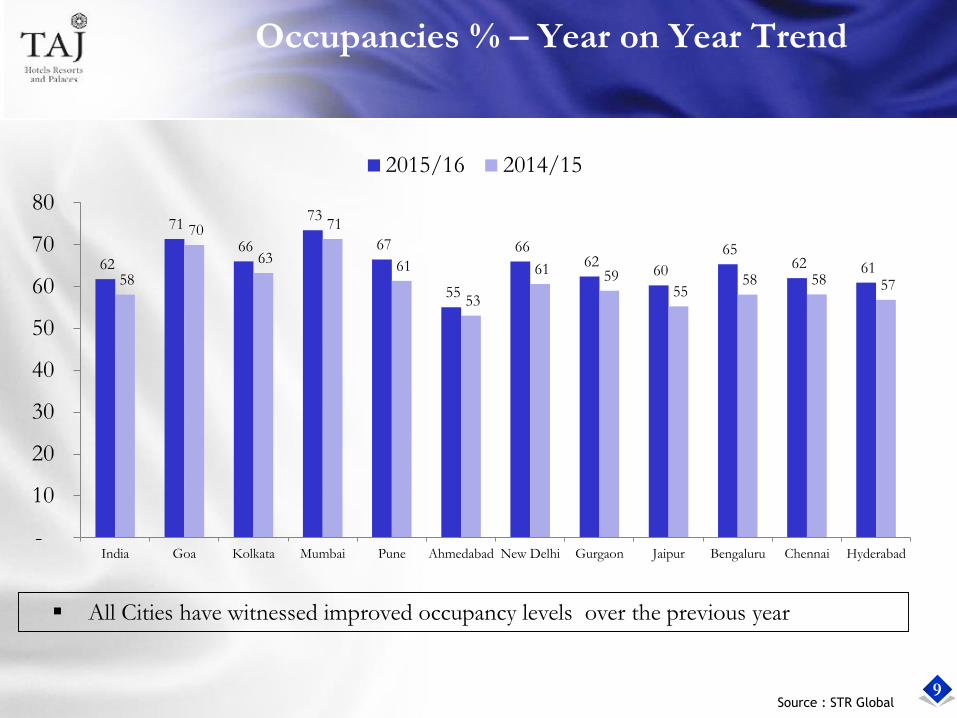
Occupancies % – Year on Year Trend
All Cities have witnessed improved occupancy levels over the previous year
62
71
66
73
67
55
66 62
60
65 62 61
58
70
63
71
61
53
61 59 55
58 58 57
-
10
20
30
40
50
60
70
80
India Goa Kolkata Mumbai Pune Ahmedabad New Delhi Gurgaon Jaipur Bengaluru Chennai Hyderabad
2015/16 2014/15
Source : STR Global
10
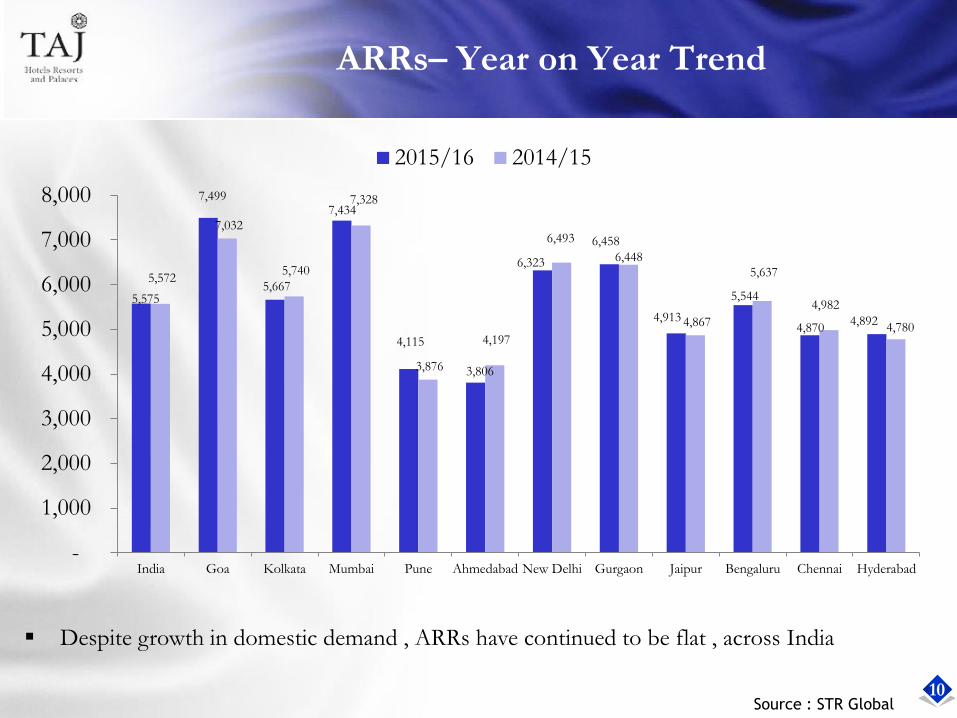
ARRs– Year on Year Trend
5,575
7,499
5,667
7,434
4,115
3,806
6,323
6,458
4,913
5,544
4,870 4,892
5,572
7,032
5,740
7,328
3,876
4,197
6,493
6,448
4,867
5,637
4,982
4,780
-
1,000
2,000
3,000
4,000
5,000
6,000
7,000
8,000
India Goa Kolkata Mumbai Pune Ahmedabad New Delhi Gurgaon Jaipur Bengaluru Chennai Hyderabad
2015/16 2014/15
Despite growth in domestic demand , ARRs have continued to be flat , across India
Source : STR Global
11
Taj Group
New Inventory in the pipeline

12
66 9962 76 82 88 103 107 112 118 125 131 136
Taj Group Inventory

13
Taj Group Inventory
Brand Distribution
Brands Domestic International Total
No of
Hotels
Inventory No of
Hotels
Inventory No of
Hotels
Inventory
20 3,415 10 1849 30 5,264
35 4,946 5 575 40 5,521
31 2,596 1 208 32 2,804
34 3,170 - - 34 3,170
Total 120 14,127 16 2,632 136 16,759

14
Hotels Opened In 2015/16
Hotel Company Rooms
TAJ
Taj Downtown, Dubai Management Contract 296
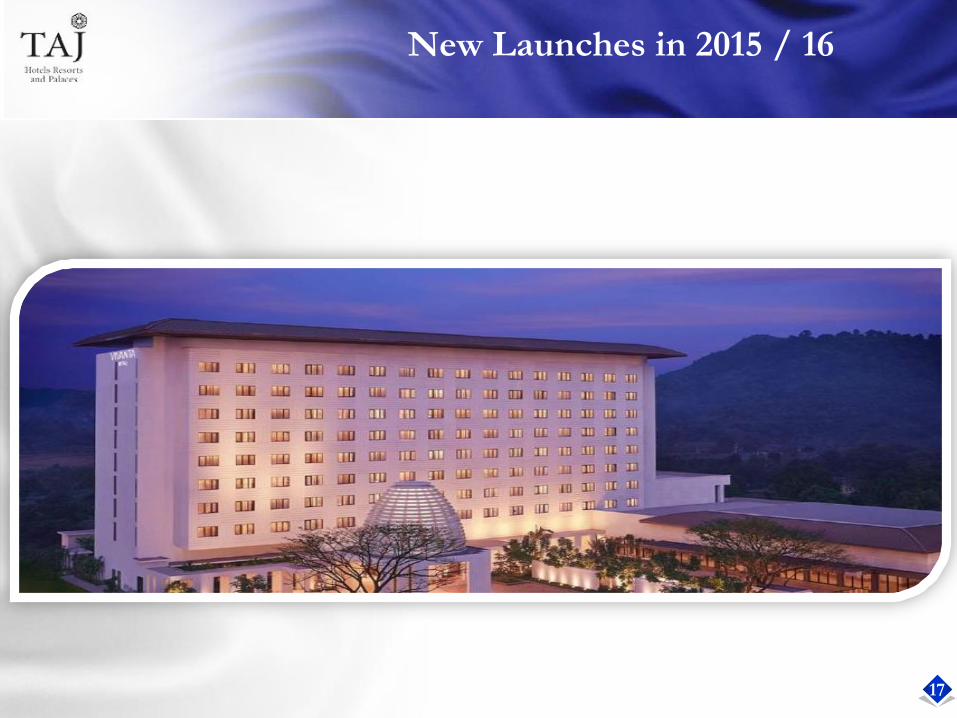
Taj Bangalore Hotel , Bangalore Management Contract 154
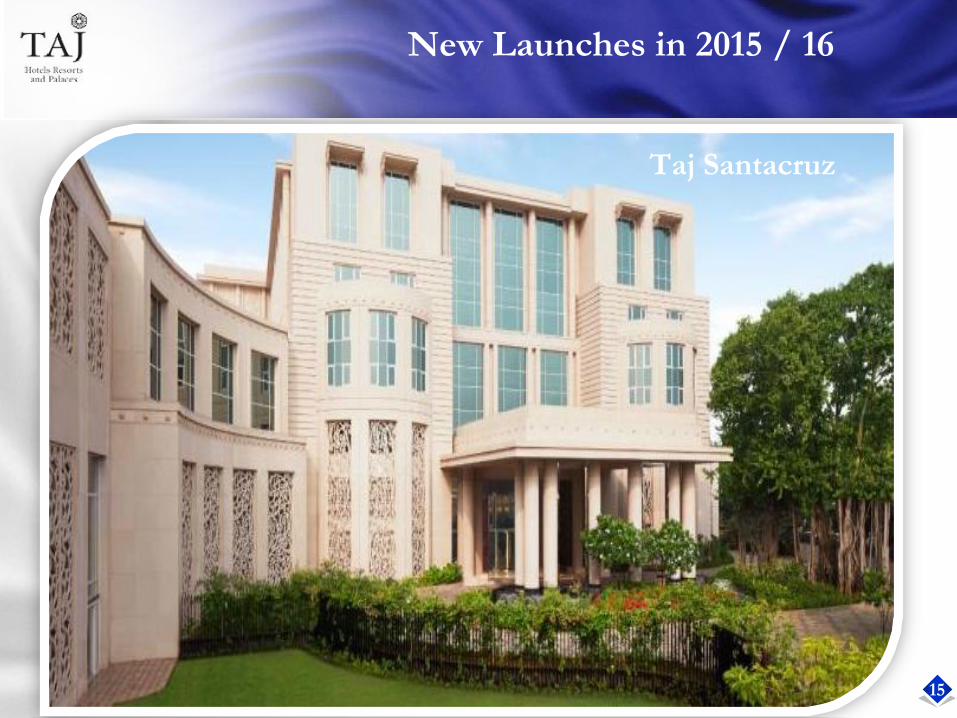
Taj Santacruz Hotel, Mumbai Taj GVK 283
Vivanta
Vivanta by Taj, Guwahati IHCL 150
Gateway
Gateway Hotel, Nashik (Expansion) Piem Hotels 78
Gateway Hotel, Hinjewadi, Pune Management Contract 150
Gateway Hotel ,Ajmer Management Contract 81
Ginger
Ginger Udayee, Tirupati Roots Corporation 119
Total 8 Hotels 1423
15
New Launches in 2015 / 16
Taj Santacruz

16
New Launches in 2015 / 16
Taj Bangalore
17
New Launches in 2015 / 16
Taj Santacruz Taj Bangalore
VBT Guwahati

18
New Launches in 2015 / 16
Taj Safaris-Meghauli Serai

19
New Launches in 2015 / 16
Gateway Hotel, Hinjewadi

20
New Launches in 2015 / 16
Taj Safaris-Meghauli Serai
Gateway Hotel, Hinjewadi
The Gateway Resort, Ajmer
21
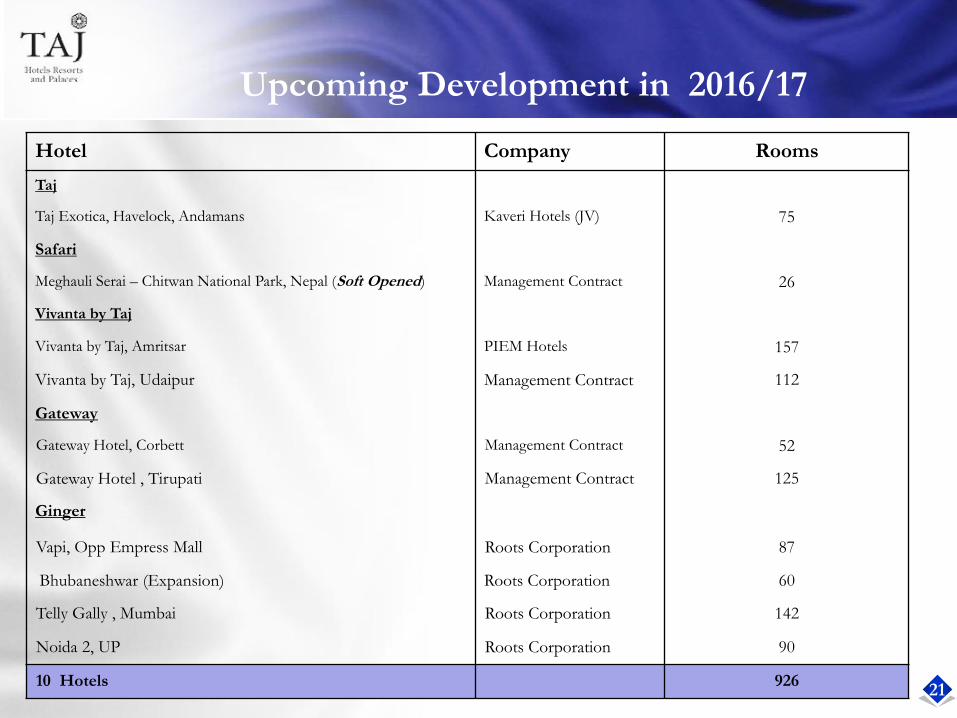
Upcoming Development in 2016/17
Hotel Company Rooms
Taj
Taj Exotica, Havelock, Andamans Kaveri Hotels (JV) 75
Safari
Meghauli Serai – Chitwan National Park, Nepal (Soft Opened) Management Contract 26
Vivanta by Taj
Vivanta by Taj, Amritsar PIEM Hotels 157
Vivanta by Taj, Udaipur Management Contract 112
Gateway
Gateway Hotel, Corbett Management Contract 52
Gateway Hotel , Tirupati Management Contract 125
Ginger
Vapi, Opp Empress Mall Roots Corporation 87
Bhubaneshwar (Expansion) Roots Corporation 60
Telly Gally , Mumbai Roots Corporation 142
Noida 2, UP Roots Corporation 90
10 Hotels 926

22
Sales & Marketing Initiatives

23
Update on Key Projects
Standardized Opera PMS rollout
IDEAS Revenue Management System installation at key hotels
Moved to a single GDS code “TJ”
Loyalty program revamped
Focus on Analytics and Business Intelligence
Digital Platforms

24
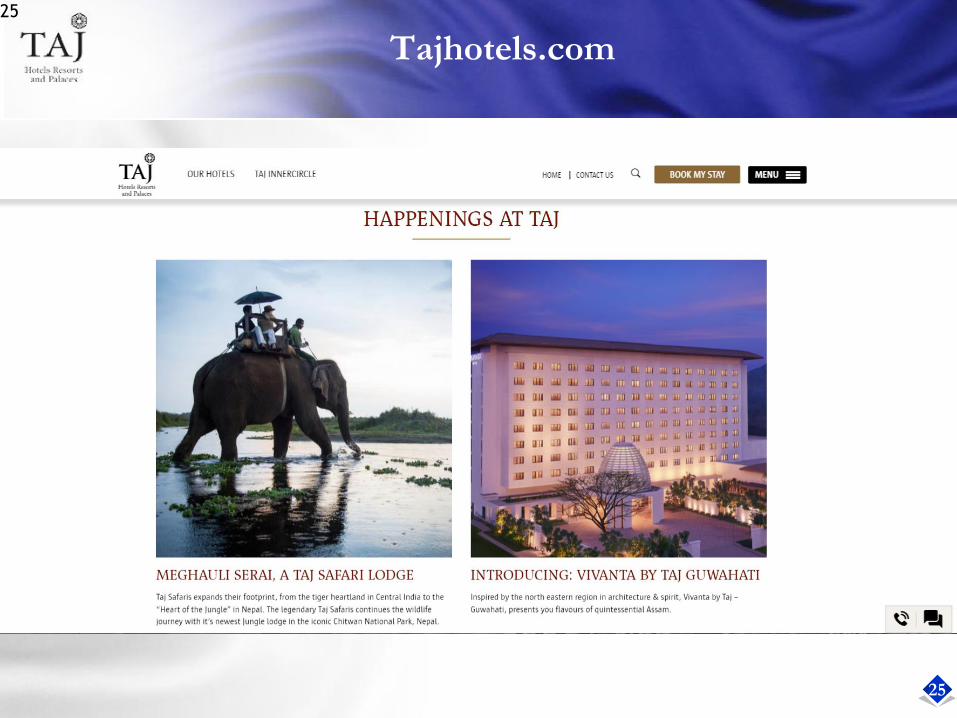
New website launched in March, 2016
Our goal is to close the gap between the wonderful hotel experiences and the online user experiences across all devices and platforms
25
Tajhotels.com25

26
Tajhotels.com
Authentic and unbiased Guest reviews

27
Sep Oct Nov Dec Jan Feb Mar
Desktop & Mobile Bookings
2014-15 2015-16
Digital Transformation

28
PR & Media Outreach
Global Communications
• Brand building efforts in UK, US, MENA and South East Asia
• CNN interview with Mr. Sarna – Quest Means Business segment – 3.45 minutes on prime time television
aired worldwide in January, 2016
• CNN Business Traveller show – Interview with Chinmai / Tajness / Umaid Bhawan Palace – 7 minutes with
repeats aired in March, 2016

29
COVER STORIES

30
28% in followers
42% in followers
267% in followers
Social Media Footprint- 2015 / 16 vs. 2014/15

31
Few of Our Esteemed Guests
PM Shinzo Abe HH Al Nahyan
President Ameenah Gurib-Fakim
Premier Kathleen Waynne Duke & Duchess of CambridgePresident AtambayevPM John Key
Make in India Week - Mumbai
Sheikh Hamad
Morgan Freeman
President Francois Hollande
32
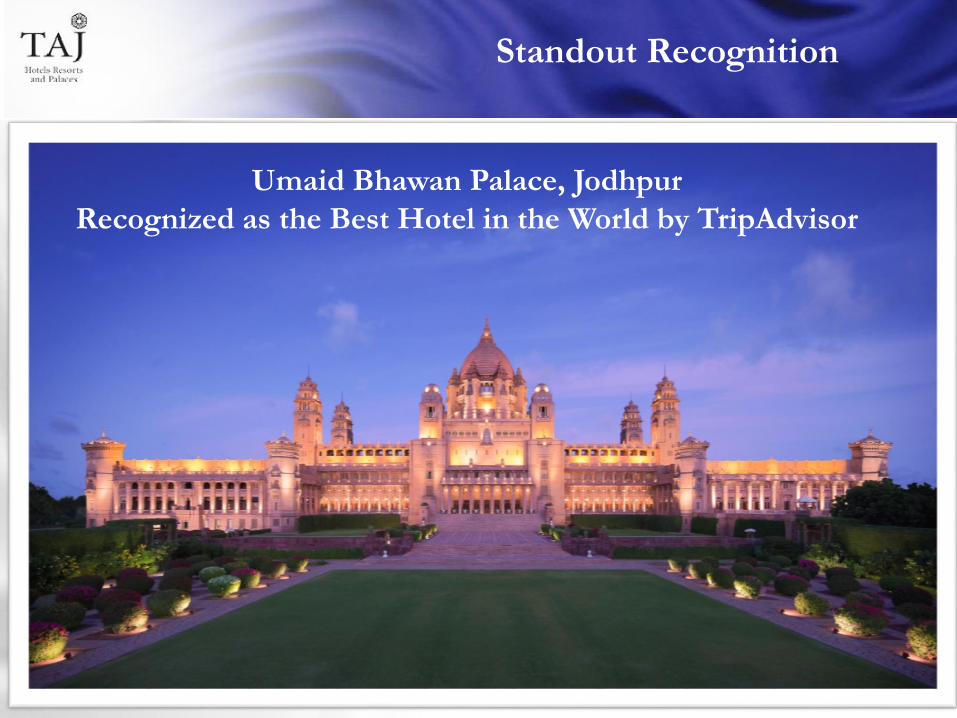
Umaid Bhawan Palace, Jodhpur
Recognized as the Best Hotel in the World by TripAdvisor
Standout Recognition

33
Awards & Accolades
Taj Hotels Resorts and Palaces
• Featured on the list of 10 of the World's Best Luxury Hotel Brands by
Forbes magazine
• Named the Best Hotel Group in India at the Travel + Leisure India &
South Asia's Best Awards
• Rated Best Business Hotel Chain in India by Business Traveller UK
TripAdvisor Travellers’ Choice Awards 2016
• Umaid Bhawan Palace, Jodhpur – Best Hotel in the World, Asia and
India
• Taj Lake Palace, Udaipur
• Rambagh Palace, Jaipur
• The Taj Mahal Palace, Mumbai
• Taj Exotica, Goa
• Taj Exotica Resort and Spa, Maldives
• Taj 51 Buckingham Gate Suites and Residences, London
• Taj Cape Town
• Vivanta by Taj – Bentota, Sri Lanka
Condé Nast Traveler US Gold List 2016
• Taj Falaknuma Palace, Hyderabad
• Taj Lake Palace, Udaipur
• The Taj Mahal Palace, Mumbai
• Umaid Bhawan Palace, Jodhpur
• Taj Tashi, Bhutan
Conde Nast Traveller UK Readers’
Travel Awards
• The Taj Mahal Palace, Mumbai was
the only Indian hotel in the top
three in the Best Overseas Business
Hotel category
• Taj Lake Palace, Udaipur, Rambagh
Palace, Jaipur and Taj Falaknuma
Palace, Hyderabad ranked 6th, 9th
and 15th respectively on the list of
World's Best Hotels in Asia & the
Indian Subcontinent
Town & Country Travel Best Hotels
in the World list
• Mahua Kothi, Bandhavgarh
• Banjaar Tola, Kanha
• Umaid Bhawan Palace, Jodhpur
TripAdvisor
• Taj Falaknuma Palace recognized as
number one in the Best Palace
Hotels in the World 2015 category

34
Standalone Financial Performance
for the
Year ended March 31, 2016
35
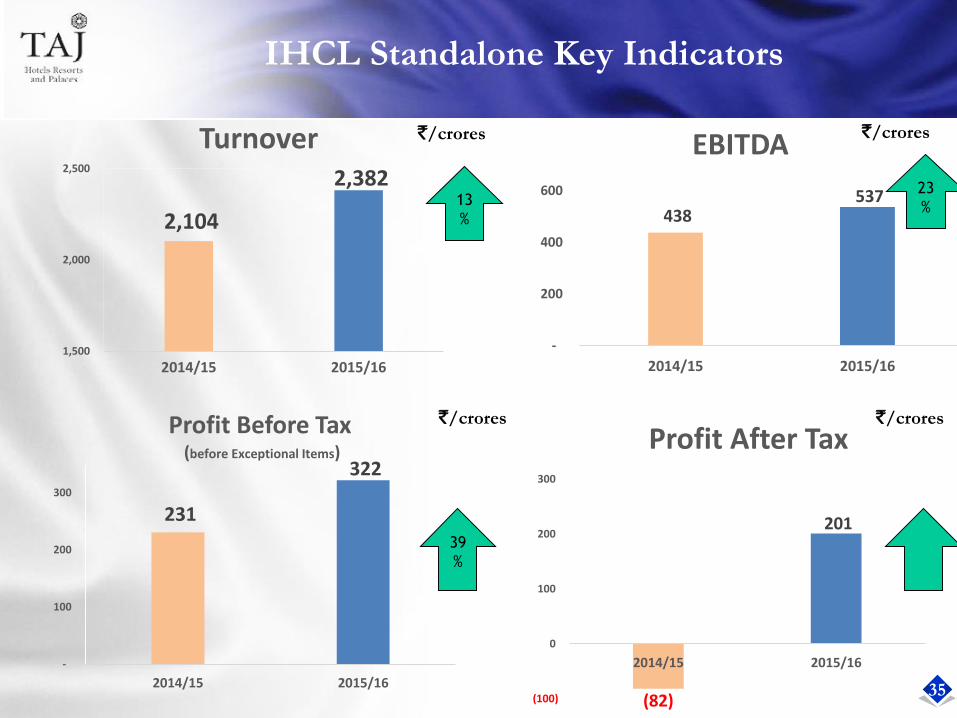
IHCL Standalone Key Indicators
2,104
2,382
1,500
2,000
2,500
2014/15 2015/16
Turnover
231
322
-
100
200
300
2014/15 2015/16
Profit Before Tax(before Exceptional Items)
438 537
-
200
400
600
2014/15 2015/16
EBITDA
(82)
201
(100)
0
100
200
300
2014/15 2015/16
Profit After Tax
13
%
23
%
39
%
`/crores `/crores
`/crores `/crores

36
Profit and Loss Account
Year ended March 31, 2016
`/ croresQuarter IV Full Year
2015/16 2014/15 % Change 2015/16 2014/15 % Change
Net Sales/Income from Operations 686.82 610.77 12 2273.70 2024.38 12
Other Operating Income - -
Total Income from Operations 686.82 610.77 12 2273.70 2024.38 12
Cost of Materials Consumed 57.60 49.63 16 209.82 181.88 15
Employee Benefits Expense 163.15 138.86 17 615.98 531.37 16
License Fees 43.97 39.04 13 146.87 128.39 14
Fuel, Power and Light 40.48 39.33 3 179.98 174.27 3
Depreciation and Amortisation Expense 36.29 29.19 24 127.08 117.85 8
Other Expenditure 199.09 190.07 5 692.50 649.80 7
Total Expenditure 540.58 486.12 11 1972.23 1783.56 11
Profit/ (Loss) from operations before Other
Income, Finance Costs and Exceptional Items146.24 124.65 17 301.47 240.82 25
Other Income 28.99 21.25 36 108.62 79.22 37
Profit/ (Loss) before Finance Costs and
Exceptional Items175.23 145.90 20 410.09 320.04 28
Finance Costs 22.21 19.77 12 88.20 89.46 (1)
Profit/ (Loss) after Finance Costs but before
Exceptional Items153.02 126.13 21 321.89 230.58 40
Exceptional items (17.18) (196.54) (10.21) (228.70)
Profit/ (Loss) before tax 135.84 (70.41) 311.68 1.88
Provision for Taxes 47.70 48.74 110.64 83.90
Profit/ (Loss) After Tax 88.14 (119.15) 201.04 (82.02)

37
Income Details
` / Crores 2015/16 2014/15 % Change
Room Income 1002.33 908.34 10
Food &Beverages and Banquet Income 918.20 813.42 13
Management & Operating fees 148.95 137.74 8
Other Operating Income 204.22 164.88 24
Income from Operations 2273.70 2024.38 12
Non Operating Income 108.62 79.22 37
Total Income 2382.32 2103.60 13
Room Income grew by 10%, pushed by higher occupancies as also on account of new hotels at Dwarka -
NCR ( full year impact) and at Guwahati
Healthy Increase in Restaurant sales and Banqueting business
Non Operating Income of Rs 109 crores includes Treasury Income earned on surplus funds being carried
by the company during the year as also Dividend Income.
38
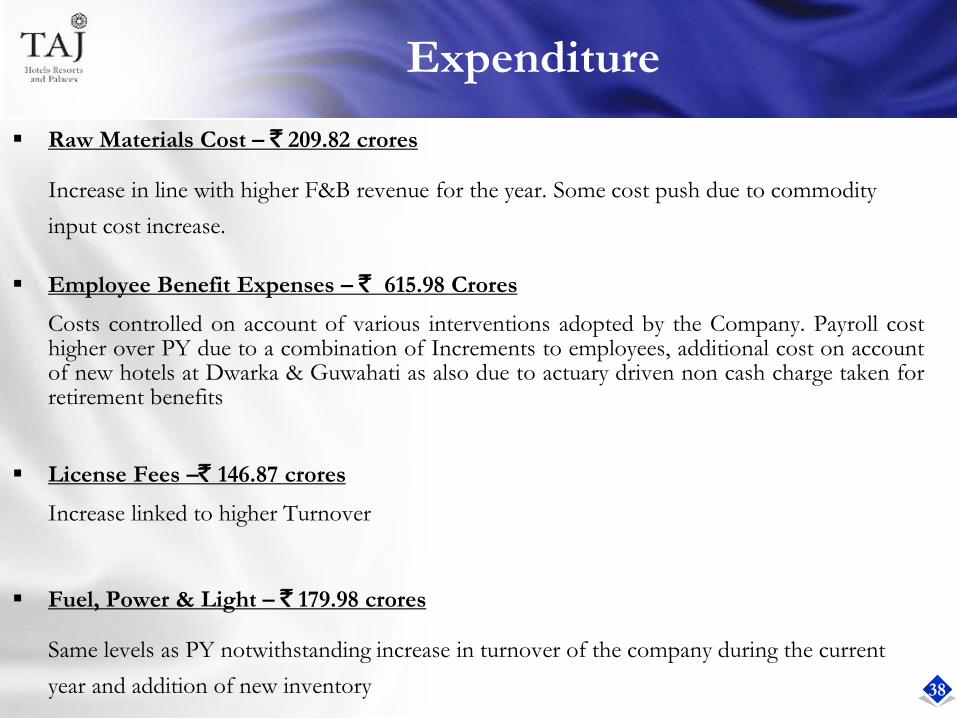
Expenditure
Raw Materials Cost – ` 209.82 crores
Increase in line with higher F&B revenue for the year. Some cost push due to commodity
input cost increase.
Employee Benefit Expenses – ` 615.98 Crores
Costs controlled on account of various interventions adopted by the Company. Payroll costhigher over PY due to a combination of Increments to employees, additional cost on accountof new hotels at Dwarka & Guwahati as also due to actuary driven non cash charge taken forretirement benefits
License Fees –` 146.87 crores
Increase linked to higher Turnover
Fuel, Power & Light – ` 179.98 crores
Same levels as PY notwithstanding increase in turnover of the company during the current
year and addition of new inventory

39
Expenditure
Other Expenditure - ` 692.5 crores
Increase during the year aligned with increase in turnover. Rent rates & Taxes, Repairs
& Maintenance costs nominally increased during the year. Conversely, the
advertising costs were lower when compared to PY.
Depreciation & Amortisation – ` 127.08 crores
Higher due to opening of new hotel at Dwarka
Finance Costs – ` 88.20 crores
Lower levels due to deleveraging measures of the Company resulting in reduced debt

40
Exceptional Items
Particulars 2015/16 2014/15
Profit on Sale of Investments 56.53 -
Exchange Gain/(Loss) (56.66) (24.75)
Diminution in value of long term investments (0.35) (213.49)
Others (9.83) 9.54
Total (10.21) (228.70)
` / Crores
The company divested its holding in Tata Projects Ltd during the year and earned a gain
on sale of such investment of ` 56.53 crores
Exchange Loss mainly comprise of notional restatement of company’s USD long term
loans on account of exchange rate movement

41
Financials Summary Year ended March 31, 2016
ParticularsQuarter IV Full Year
2015/16 2014/15 2015/16 2014/15
Total Income 715.81 632.02 2382.32 2103.60
EBITDA 211.52 175.09 537.17 437.89
EBITDA % 30% 28% 23% 21%
Profit/(Loss) before Finance Cost &
Exceptional Item175.23 145.90 410.09 320.04
Profit/(Loss) after Finance Costs but before
Exceptional Item153.02 126.13 321.89 230.58
Exceptional Item – Exchange Gain/( Loss) (16.83) 7.41 (56.56) (24.75)
Exceptional Item – Others (0.35) (203.95) 46.35 (203.95)
Profit /(Loss) before Tax 135.84 (70.41) 311.68 1.88
Tax Expense (47.70) (48.74) (110.64) (83.90)
Profit / (Loss) after Tax 88.14 (119.15) 201.04 (82.02)
`/crores
42
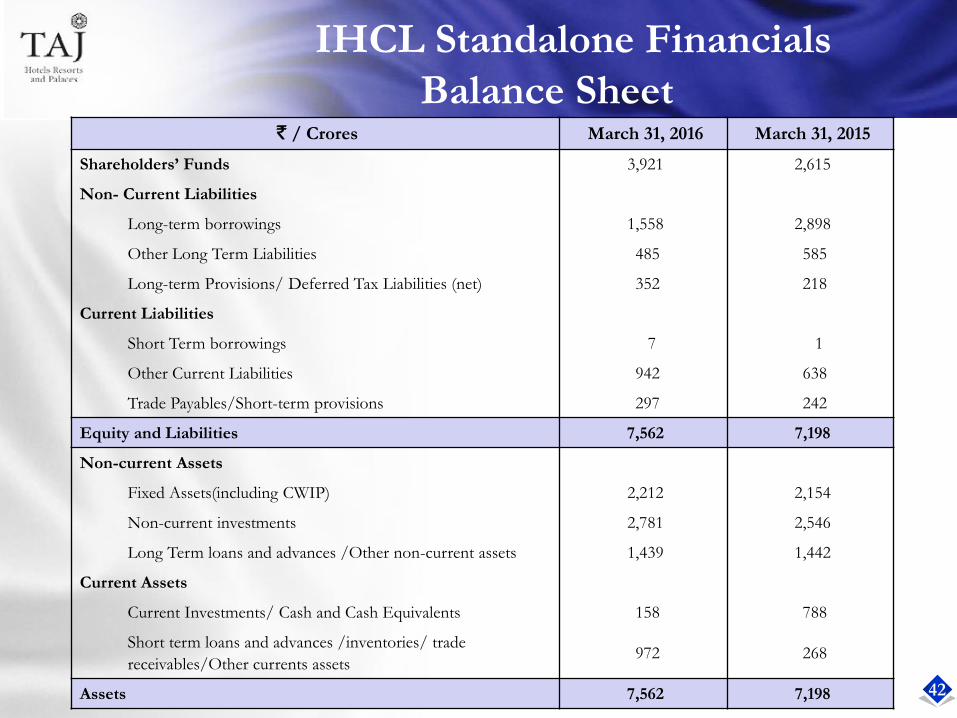
` / Crores March 31, 2016 March 31, 2015
Shareholders’ Funds 3,921 2,615
Non- Current Liabilities
Long-term borrowings 1,558 2,898
Other Long Term Liabilities 485 585
Long-term Provisions/ Deferred Tax Liabilities (net) 352 218
Current Liabilities
Short Term borrowings 7 1
Other Current Liabilities 942 638
Trade Payables/Short-term provisions 297 242
Equity and Liabilities 7,562 7,198
Non-current Assets
Fixed Assets(including CWIP) 2,212 2,154
Non-current investments 2,781 2,546
Long Term loans and advances /Other non-current assets 1,439 1,442
Current Assets
Current Investments/ Cash and Cash Equivalents 158 788
Short term loans and advances /inventories/ trade
receivables/Other currents assets972 268
Assets 7,562 7,198
IHCL Standalone Financials
Balance Sheet
43
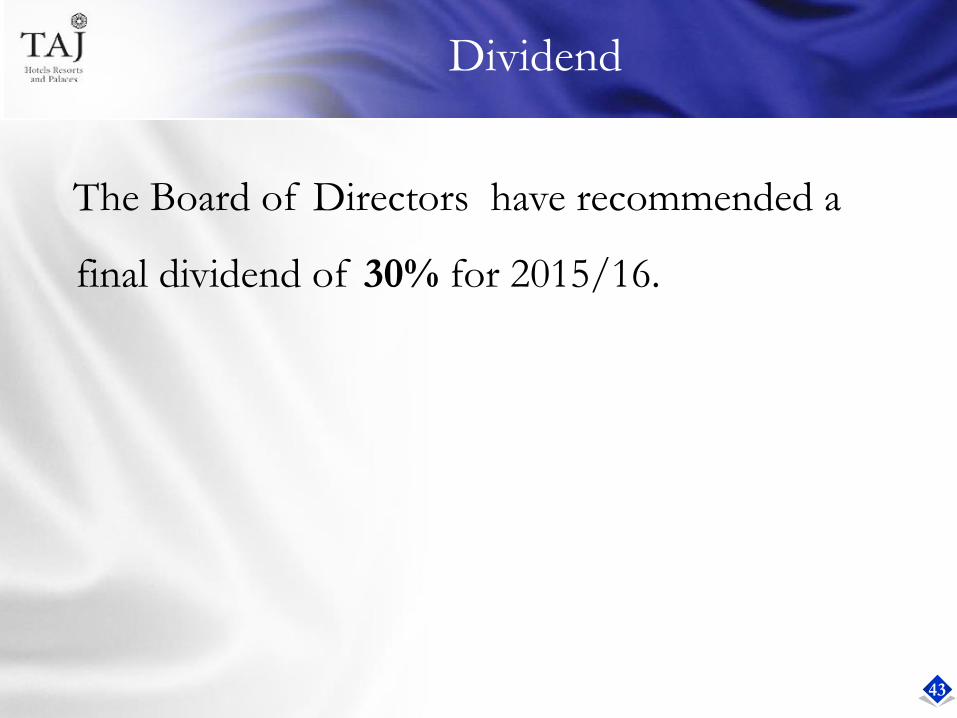
Dividend
The Board of Directors have recommended a
final dividend of 30% for 2015/16.

44
Consolidated Financial Performance
for the
Year Ended March 31, 2016

45
Taj Group
Major Companies
Company Name Effective
Holding
%
Company Name Effective
Holding
%
Subsidiaries Joint Ventures
Piem Hotels Ltd 51.57 Taj GVK Hotels & Resorts Ltd 25.52
Taj SATS Air Catering Ltd 51.00 Taj Madras Flight Kitchen Pvt Ltd 50.00
TIFCO Holdings Ltd [Investment Company] 100.00 Taj Kerala Hotels & Resorts Ltd 28.30
Benares Hotels Ltd 51.68 Taj Karnataka Hotels & Resorts Ltd 44.27
United Hotels Ltd 55.00 Taj Safaris Ltd 28.96
Roots Corporation Ltd 63.25 Kaveri Retreat & Resorts Ltd 50.00
Lands End Properties Pvt Ltd 100.00 IHMS (SA) Pty Ltd 50.00
Skydeck Properties Pvt Ltd 100.00 TAL Hotels & Resorts Ltd 27.49
United Overseas Holdings, Inc. 100.00
St James Court Hotel Ltd 72.25
IHOCO BV [Investment Company] 100.00 Associates
Samsara Properties Ltd [Investment Company] 100.00 Oriental Hotels Ltd 35.67
Lanka Island Resorts Ltd 24.66
TAL Lanka Hotel PLC 24.62
46
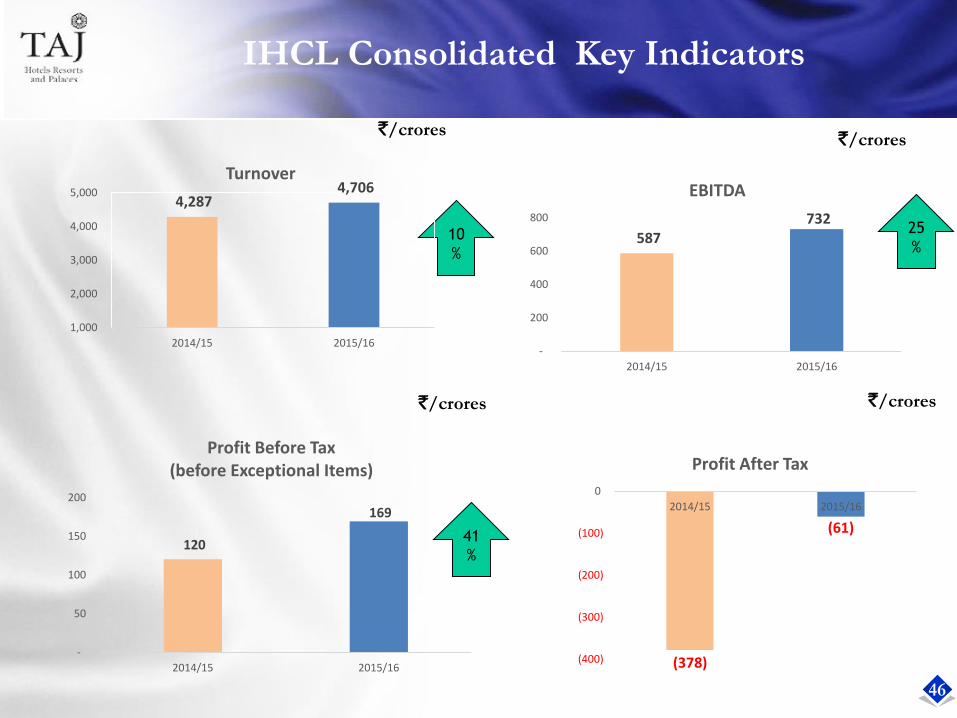
IHCL Consolidated Key Indicators
10
%
41
%
25
%
`/crores`/crores
`/crores `/crores
4,287 4,706
1,000
2,000
3,000
4,000
5,000
2014/15 2015/16
Turnover
587 732
-
200
400
600
800
2014/15 2015/16
EBITDA
120
169
-
50
100
150
200
2014/15 2015/16
Profit Before Tax (before Exceptional Items)
(378)
(61)
(400)
(300)
(200)
(100)
0
2014/15 2015/16
Profit After Tax

47
IHCL Consolidated - Profit and Loss AccountYear ended March 31, 2016
`/ croresFull Year
2015/16 2014/15 % Change
Net Sales/Income from Operations 4,590.92 4,188.64 10
Other Operating Income - - -
Total Income from Operations 4,590.92 4,188.64 10
Cost of Materials Consumed 504.48 443.09 14
Employee Benefits Expense 1609.71 1462.46 10
License Fees 232.99 209.61 11
Fuel, Power and Light 322.90 320.43 1
Depreciation and Amortisation Expense 316.67 291.29 9
Other Expenditure 1304.26 1264.49 3
Total Expenditure 4291.01 3991.37 8
Profit/ (Loss) from operations before Other Income, Finance Costs and
Exceptional Items299.91 197.27 52
Other Income 115.35 98.71 17
Profit/(Loss) before Finance Costs and Exceptional Items 415.26 296.00 40
Finance Costs 245.96 175.57 40
Profit/ (Loss) after Finance Costs but before Exceptional Items 169.30 120.43 41
Exceptional item (67.16) (352.91)
Profit/ (Loss) before tax 102.14 (232.49)
Less: Provision for Taxes (140.07) (114.60)
Add: Share of Profit/(Loss) in Associates 2.85 (0.04)
Less: Minority Interest in Subsidiaries (25.45) (30.97)
Profit/( Loss) after Tax (60.53) (378.10)

48
IHCL Consolidated - Financials Summary Year ended March 31, 2016
ParticularsFull Year
2015/16 2014/15
Total Income 4,706.27 4,287.36
EBITDA 731.93 587.28
EBITDA % 15.6% 13.7%
Profit/(Loss) before Finance Cost &
Exceptional Item415.26 296.00
Profit/ (Loss) after Finance Costs but before
Exceptional Item169.30 120.43
Exceptional Item – Exchange Gain/( Loss) (63.21) (51.07)
Exceptional Item – Others (3.95) (301.84)
Profit/(Loss) before Tax 102.14 (232.48)
Profit/(Loss) after Tax, Minority Interest &
share of profit/(loss) in associates(60.53) (378.10)
`/crores

49
Particulars March 31, 2016 March 31, 2015
Shareholders’ Funds 3,218 2,227
Minority Interest 835 738
Non- Current Liabilities
Long-term borrowings 3,685 4,598
Other Long Term Liabilities 489 586
Long-term Provisions/ Deferred Tax Liabilities (net) 450 306
Current Liabilities 2,267 1,432
Equity and Liabilities 10,945 9,887
Non-current Assets
Fixed Assets (including CWIP) 6,997 6,126
Goodwill on Consolidation (net) 1,346 478
Non-current investments 914 1,041
Long Term Loans and Advances/ Other Non Current Assets 566 518
Current Assets
Cash and Cash Equivalents /Current Investments 395 1,050
Inventories/Trade Receivables/Other Current Assets 727 673
Assets 10,945 9,887
IHCL Consolidated Financials
Balance Sheet`/crores
50
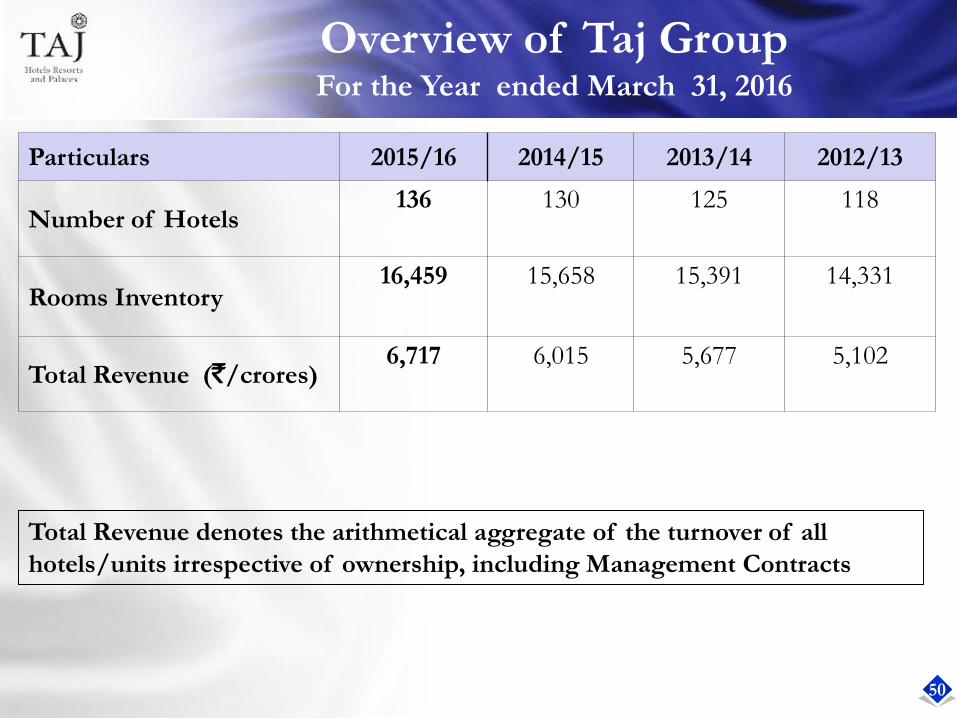
Overview of Taj GroupFor the Year ended March 31, 2016
Total Revenue denotes the arithmetical aggregate of the turnover of all
hotels/units irrespective of ownership, including Management Contracts
Particulars 2015/16 2014/15 2013/14 2012/13
Number of Hotels136 130 125 118
Rooms Inventory16,459 15,658 15,391 14,331
Total Revenue (`/crores)6,717 6,015 5,677 5,102

51
Treasury
Debt Position
Particulars Standalone Consolidated
Gross Debt 2,108 4,781
Debenture Redemption Premium
(Accrued) 318 331
Less : Liquidity (158) (395)
Net Debt 2,268 4,717
Net Debt/ Equity 0.58 1.47
Weighted cost of Debt 8.8% 7.3%
`/crores
Of the aggregate Sea Rock debt of ` 1,400 crores, an amount of ` 650 crores has been
repaid
Balance debt of ` 750 crores has been refinanced at a lower cost

52
IND-AS – Effective April 1, 2016
Effective April 1, 2016, IHCL will migrate to the new Accounting Standards – IND-AS.
Transition to IND-AS will result in change in presentation of accounts, inter alia, in the following
areas
– Revenue recognition
– Fair Value concept
– Time Value of Money ( economic interest concept for Borrowings)
– Equity accounting for JVs
– Substance Over form ( for determining component entities for consolidation)
The company’s financial results for Q1 - 2016/17 will be published under IND-AS along with a
comparatives of the previous quarter
53
Restructuring of Overseas Investments
54
Restructuring of Overseas Investments
IHOCO BV , the 100 % offshore subsidiary company has since become IHCL’s apex offshore
Investment holding company.
Holdings in the, USA, UK , Sri Lanka, Maldives hotels and the two London restaurants have
since been shifted to IHOCO BV
Thus, 8 owned hotels (1584 rooms) & 2 UK restaurants are now being held through IHOCO
BV
This restructuring allows the company :
(i) Efficiency in up streaming of funds
(ii) Visibility of International holdings to stakeholders
(iii) Fund raising options ( if required in future)

55
Scheme(s) of Arrangement - Update

56
Amalgamation – Update
The Board of Directors at its meeting held on October 19, 2015 have approved the
amalgamation of International Hotel Management Services LLC (formerly known as
IHMS Inc.) and Lands End Properties Private Limited, two wholly owned subsidiaries
(“transferor companies”) into the Company, by way of two separate Schemes of Arrangements
between the Company
The Amalgamation process will be completed after receipt of the requisite orders of the
Bombay High Court sanctioning the Schemes and filing of the orders with the Registrar of
Companies, Mumbai.

57
Amalgamation – Impact
There will be also an additional impact of inter change in Reserve & Surplus .
Debit Balance of ` 359 crores Profit & Loss Account will be adjusted with the
Securities Premium account .
The Impact on IHCL’s reserves on account of the two proposed amalgamation is summarised
below
Particulars Standalone
Books
Consolidated
Books
Reserve & Surplus as on March 31, 2016 3,822 3,119
LEEPL- Scheme of Arrangement (307) (293)
IHMS- Scheme of Arrangement (1,338) -
Reserve & Surplus as on March 31, 2016 post Impact of
Scheme of Arrangement
2,177 2,826
`/crores

58
Amalgamation - Timelines
58
Particulars Dates
Milestones achieved
Filing of IHMS LLC & LEPPL Scheme with SEBI October 21, 2015
Receipt of SEBI Approval December 19, 2015
High Court order for Shareholders / Creditors Meeting February 26,2016
Shareholders approval vide Postal Ballot ( for LEPPL
scheme)April 28, 2016
Court Convened Meeting/ EGM – Shareholders approval May 4, 2016
Way Forward
High Court final order for the schemes to be effective July, 2016 (Indicative)
Shareholders approval have been secured for the two schemes.
Post amalgamation, impact on Balance Sheet will be reported for status as
on March 31 , 2016 or alternatively as on April 1 , 2016

59
Divestment

60
Divestments during the year
Divestments during the year :-
– Tata Projects Ltd - ` 56 crores
– Belmond shares – Of our holding of 7.13 million shares, 2 million shares were
sold during previous year - $ 12 million ( ` 80 crores)
The Sale Proceeds from above have been utilised to reduce the Debt.
61
Divestments – New Proposal
The Board of Directors has accorded its approval to allow United Overseas Holding
Inc (UOH)., a wholly owned subsidiary of the Company, to pursue the option of
divestment of Taj Boston by way of sale/ disposal of the LLC interests in IHMS
(Boston) LLC (a direct subsidiary of UOH), at a consideration not lower than US$
125 million, whilst retaining brand presence on the property through Management
Services Agreement .
This will be subject to Shareholders and other approvals, as would be necessary
62
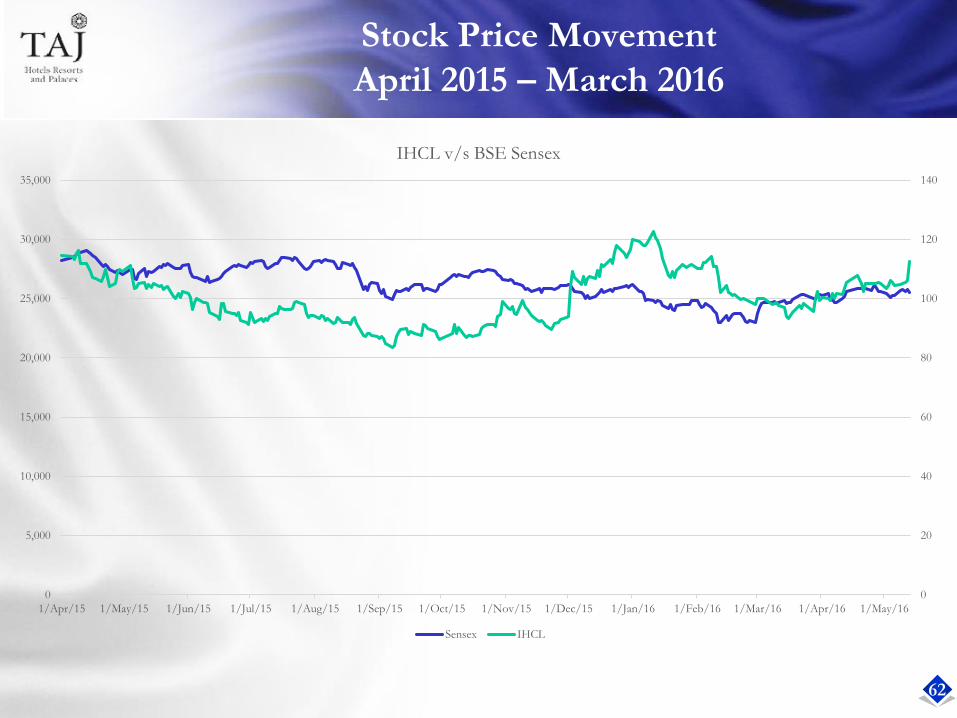
Stock Price Movement
April 2015 – March 2016
0
20
40
60
80
100
120
140
0
5,000
10,000
15,000
20,000
25,000
30,000
35,000
1/Apr/15 1/May/15 1/Jun/15 1/Jul/15 1/Aug/15 1/Sep/15 1/Oct/15 1/Nov/15 1/Dec/15 1/Jan/16 1/Feb/16 1/Mar/16 1/Apr/16 1/May/16
IHCL v/s BSE Sensex
Sensex IHCL

63
Thank you


