" .. - - The Influence of Chemical Reclamation on a Small Brown Trout Stream -· , ..... -. · - . • in Southwestern Wisconsin Technical Bulletin No. 110 DEPARTMENT OF NATURAL RESOURCES Madison, Wisconsin 1978 . . . . . . .... ttii· .... -- ,.. .. . . . ' . I ... .. - I . • ..
Transcript
" .. -- ~
The Influence of Chemical Reclamation on a Small Brown Trout Stream
-·
, ..... -.· - . •
in Southwestern Wisconsin
Technical Bulletin No. 110
DEPARTMENT OF NATURAL RESOURCES Madison, Wisconsin
1978
~ ~ . . . ~~ . . . .... ttii· .... --
-~---·· ,.. .. ~·~~--.~~~-~ . ~
. . ' .
~
I ...
.. -
I . • ..
COVER PHOTO-An effective forage fish barrier such as this one on Seas Branch Creek can more than double the life expectancy of chemical treatment projects on coulee streams.
ABSTRACT The present study was initiated to more thoroughly quantify effects of
chemical treatment and total fish removal on a domesticated brown trout (Salmo trutta) population, the sport fishery, and the aquatic invertebrate community in a small southwestern Wisconsin trout stream. A culvert-type fish barrier was installed in the middle of the study zone prior to chemical treatment to determine its effectiveness in preventing reinvasion of forage fishes and to quantitatively document added benefits this practice might have over and above those derived from chemical treatment alone.
Seas Bra.nch Creek was treated with antimycin A in October 1972 to eradicate a forage fish population consisting primarily of suckers, stonerollers, daces, and darters. The aquatic invertebrate community, fish populations, and sport fishery for stocked brown trout were studied for two years before and two years after chemical treatment.
Significant improvements occurred in the growth, standing crop and production of stocked brown trout after removal of up to 1,445 kg/ha of forage fish. The number of invertebrate orders represented in at least 30% of the trout stomachs also doubled, indicating that interspecific competition for food existed before treatment. Survival of trout did not improve following forage fish removal, nor did it improve significantly after a reduction of 50% in the stocking density. Poor survival and low carrying capacity of the stream were related to the lack of permanent instream cover.
The sport fishery was primarily of local interest; over 70 o/o of the anglers fishing the stream before and after treatment live within a 10-mile radius. The number of fishing trips and total fishing pressure increased following treatment but total harvest and catch ratio declined. The absence of trout > 30 em during the first year after treatment was primarily respGnsible for the total decline in harvest during the two-year, post-treatment study.
A culvert-type fish barrier proved effective in preventing access upstream to forage fishes. Reinvasion of the lower half of the treated stream (below the barrier) was led by the central stoneroller (Campostoma anomalum) and most species present before treatment returned by the end of the first year. After two years 90% of the average pretreatment density and 55% of the average pretreatment biomass of forage fish were present below the barrier; only 14 o/o of the average pretreatment density and 3 o/o of the average pretreatment biomass was present above the barrier. Of the 21 species originally present, all were present below the barrier two years after treatment, while only nine were observed above the barrier. Most of the latter gained entrance during a temporary wash-out of the fish barrier in a period of exceptionally high run off.
In order of numerical importance, Trichoptera, Diptera, Coleoptera, Ephemeroptera, and Amphipoda were the most important Orders of aquatic invertebrates present before and after treatment. Mean invertebrate density declined immediately after treatment but returned to normal within four to seven months. Responses of the more important genera of invertebrates to the antimycin treatment are discussed.
Technical Bulletin No. 110 DEPARTMENT OF NATURAL RESOURCES
Box 7921, Madison, WI 53707 1978
The Influence of Chemical Reclamation on a Small Brown Trout Stream
in Southwestern Wisconsin
by Eddie L. Avery
CONTENTS 2 INTRODUCTION Production, 15
3 DESCRIPTION OF SEAS BRANCH CREEK
5 METHODS
Food Habits, 15 The Sport Fishery, 17 Forage Fish Populations, 18
Before Chemical Treatment, 18
The Fish Barrier, 5 Chemical Treatment, 6 Trout Stocking, 6 Trout Population Inventories, 7 Trout Food Habits, 7 The Sport Fishery, 7 Forage Fish Population Inventories, 7 Aquatic Invertebrate Sampling, 7 Analysis of Invertebrate Samples, 8
8 RESULTS
Trout Populations, 8 Spatial Distribution, 8 Population Composition, Survival,
and Harvest, 8 Growth, 10 Standing Stock, 15
After Chemical Treatment, 19 The Invertebrate Community, 25
streams of which 3, 700 km ( 69%) , are categorized as Class II or Class III water where annual stocking of hatchery-reared trout is considered necessary to maintain desirable fisheries (Wisconsin DNR 1978). Much of the Class II and Class III water contains dense populations of suckers, chubs and shiners which may limit survival and/ or growth of both wild and domesticated trout through predation and competition for food and space. Some of these undesirable fishes also tend to bite more readily than trout and thus reduce the quality of the fishing experience for trout anglers. Presumably, if these undesirable fishes could be eliminated or greatly reduced, trout survival and growth would increase, many kilometers of stream would receive greater angler use, and angler harvest would account for a larger portion of the total mortality of stocked trout.
Chemical removal of undesirable fish is an effective and proven technique for managing trout lakes and reservoirs in Wisconsin (Stroud and Martin 1968; Brynildson and Kempinger 1973). Chemical treatment of trout streams, however, has usually been less successful due to (1) inadequate fish kills; (2) failure or impracticality of installing fish barriers to prevent rapid reinvasion of "target" species. Collection of quantitative pre- and posttreatment data has also been inade-
quate to properly assess the merits of stream treatment.
Widespread use of chemical fish control in the past decade, particularly in the treatment of major portions of large watersheds, has also caused increasing concern about the effects of this management technique on entire ecosystems (Klingbiel 1975).
The present study was initiated to more thoroughly quantify effects of chemical treatment and total fish removal on a domesticated brown trout (Salmo trutta) population, the sport fishery, and the aquatic invertebrate community in a Class II trout stream. (A Class II trout stream has some native trout but not in sufficient numbers to use available food and space. Moderate to heavy stocking is required to maintain good fishing.) Seas Branch Creek, a small trout stream in southwestern Wisconsin, was selected for study because of its abundant population of nongame fishes, rich invertebrate fauna and general similarity to other trout streams in the southwestern quarter of the state. A culvert-type fish barrier was installed in the stream to determine its effectiveness in preventing upstream movement of "target" fishes and to quantitatively document additional benefits this practice might have over and above those derived from chemical treatment alone.
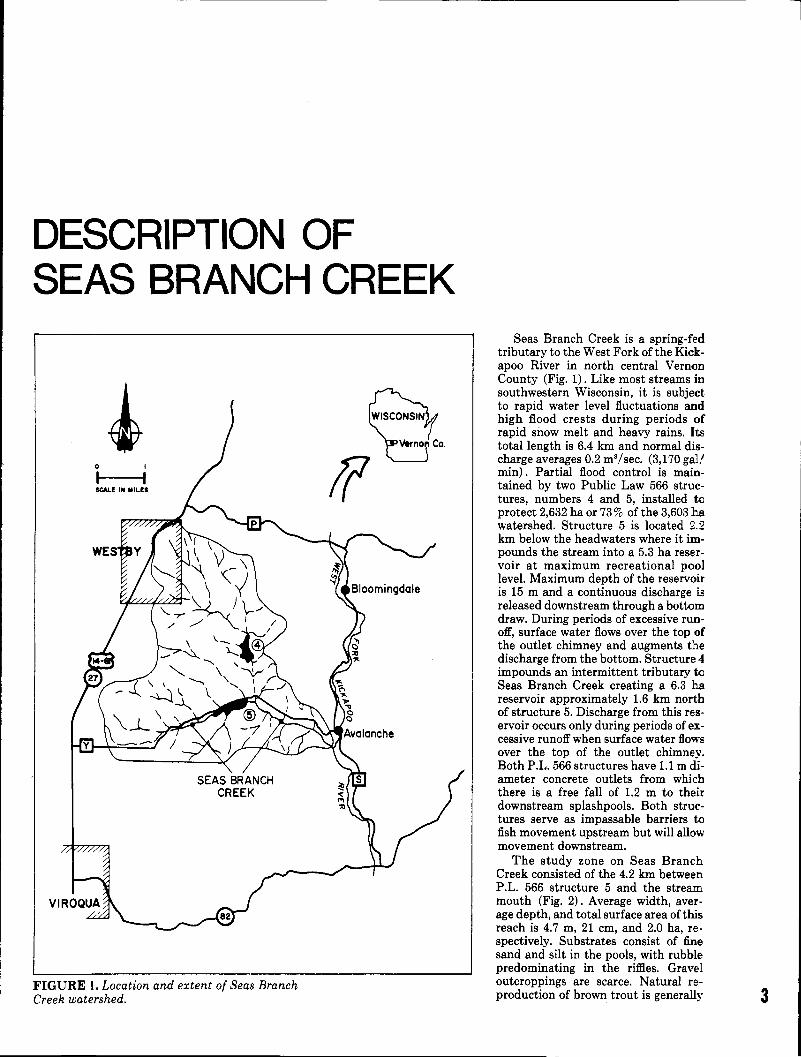
DESCRIPTION OF SEAS BRANCH CREEK
FIGURE 1. Location and extent of Seas Branch Creek watershed.
Seas Branch Creek is a spring-fed tributary to the West Fork of the Kickapoo River in north central Vernon County (Fig. 1). Like most streams in southwestern Wisconsin, it is subject to rapid water level fluctuations and high flood crests during periods of rapid snow melt and heavy rains. Its total length is 6.4 km and normal discharge averages 0.2 m3/sec. (3,170 gall min) . Partial flood control is maintained by two Public Law 566 structures, numbers 4 and 5, installed to protect 2,632 ha or 73% of the 3,603 ha watershed. Structure 5 is located 2.2 km below the headwaters where it impounds the stream into a 5.3 ha reservoir at maximum recreational pool level. Maximum depth of the reservoir is 15 m and a continuous discharge is released downstream through a bottom draw. During periods of excessive runoff, surface water flows over the top of the outlet chimney and augments the discharge from the bottom. Structure 4 impounds an intermittent tributary to Seas Branch Creek creating a 6.3 ha reservoir approximately 1.6 km north of structure 5. Discharge from this reservoir occurs only during periods of excessive runoff when surface water flows over the top of the outlet chimney. Both P.L. 566 structures have 1.1 m diameter concrete outlets from which there is a free fall of 1.2 m to their downstream splashpools. Both structures serve as impassable barriers to fish movement upstream but will allow movement downstream.
The study zone on Seas Branch Creek consisted of the 4.2 km between P.L. 566 structure 5 and the stream mouth (Fig. 2). Average width, average depth, and total surface area of this reach is 4.7 m, 21 em, and 2.0 ha, respectively. Substrates consist of fine sand and silt in the pools, with rubble predominating in the rifil.es. Gravel outcroppings are scarce. Natural reproduction of brown trout is generally 3
4
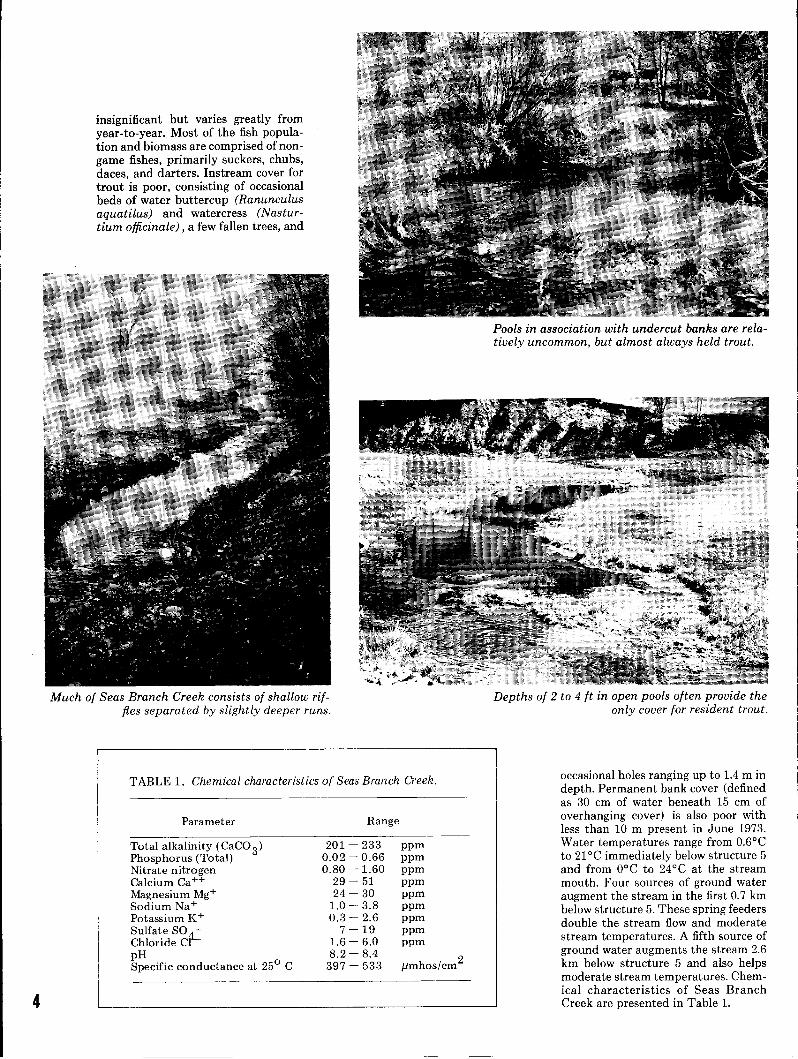
insignificant but varies greatly from year-to-year. Most of the fish population and biomass are comprised of nongame fishes, primarily suckers, chubs, daces, and darters. Instream cover for trout is poor, consisting of occasional beds of water buttercup (Ranunculus aquatilus) and watercress (Nasturtium officinale) , a few fallen trees, and
Much of Seas Branch Creek consists of shallow riffles separated by slightly deeper runs.
TABLE 1. Chemical characteristics of Seas Branch Creek.
Parameter
Total alkalinity (CaC0 3) Phosphorus (Total) Nitrate nitrogen Calcium Ca ++ Magnesium Mg+ Sodium Na+ Potassium K+ Sulfate SO 4 = Chloride cr pH Specific conductance at 25° C
Range
201-233 0.02-0.66 0.80-1.60
29-51 24-30
1.0-3.8 0.3-2.6
7-19 1.6- 6.0 8.2-8.4 397-533
ppm ppm ppm ppm ppm ppm ppm ppm ppm
,umhos/cm2
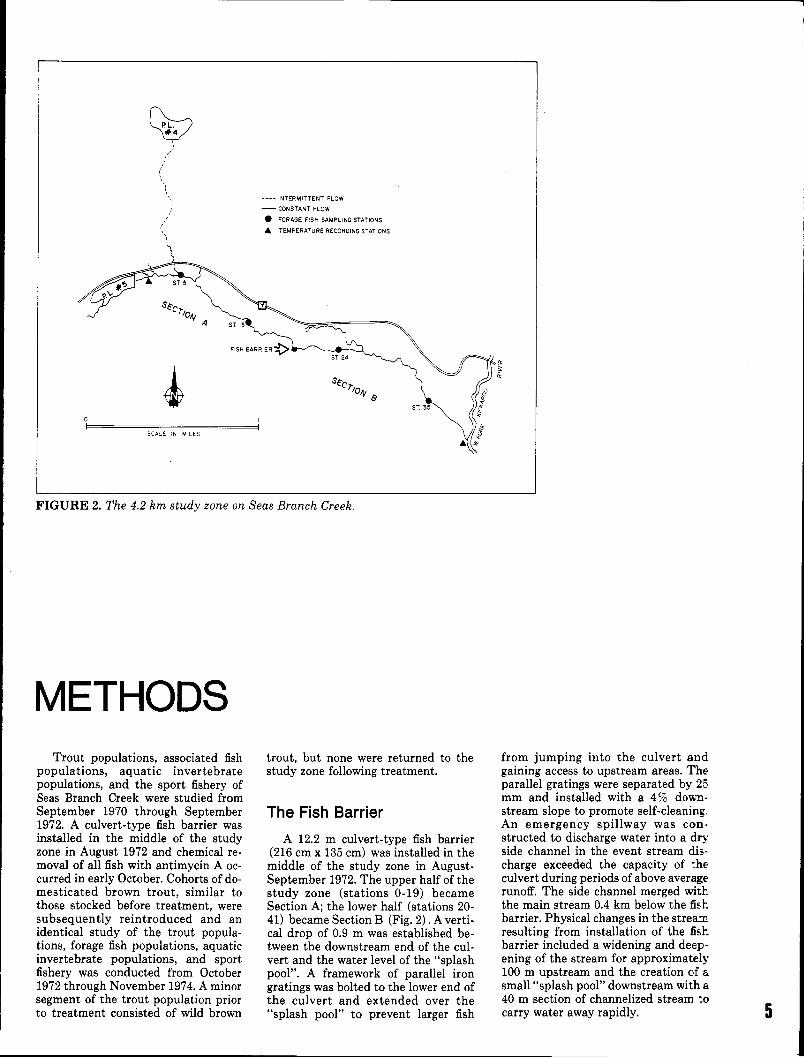
Pools in association with undercut banks are relatively uncommon, but almost always held trout.
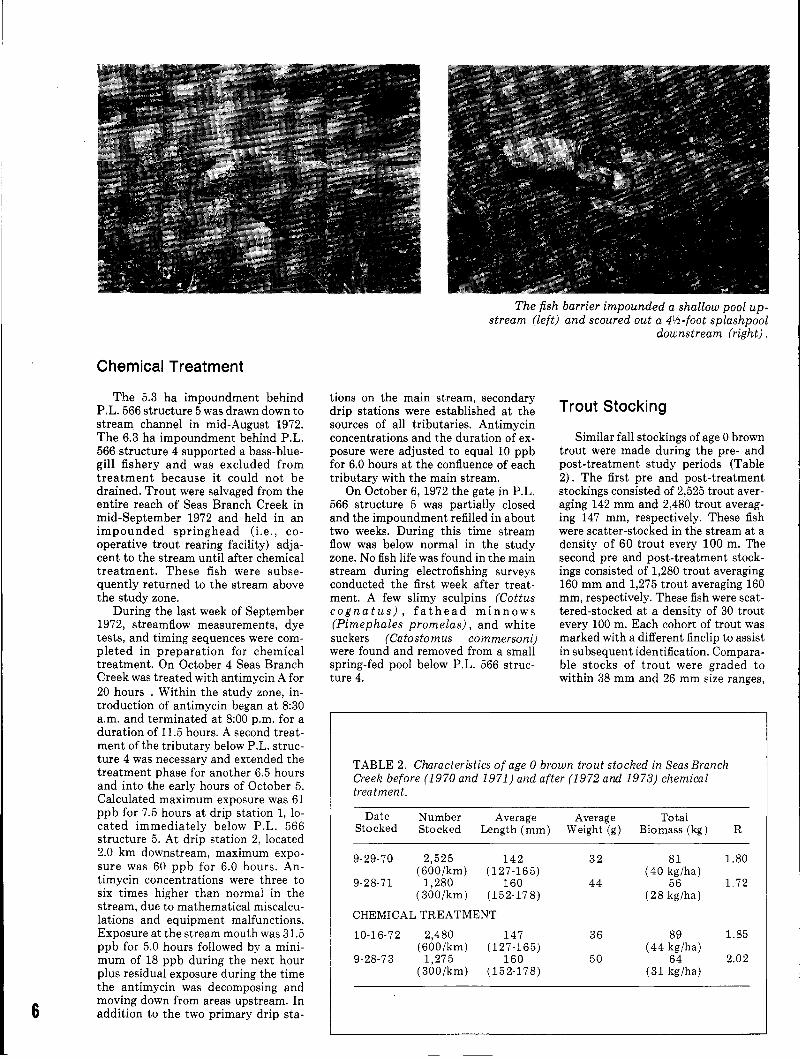
Depths of 2 to 4ft in open pools often provide the only cover for resident trout.
occasional holes ranging up to 1.4 m in depth. Permanent bank cover (defined as 30 em of water beneath 15 em of overhanging cover) is also poor with less than 10 m present in June 1973. Water temperatures range from 0.6°C to 21 oc immediately below structure 5 and from 0°C to 24°C at the stream mouth. Four sources of ground water augment the stream in the first 0. 7 km below structure 5. These spring feeders double the stream flow and moderate stream temperatures. A fifth source of ground water augments the stream 2.6 km below structure 5 and also helps moderate stream temperatures. Chemical characteristics of Seas Branch Creek are presented in Table 1.
---- INTERMITTENT FLOW
-CONSTANT FLOW
• FORAGE FISH SAMPLING STATIONS
A TEMPERATURE RECORDING STATIONS
FIGURE 2. The 4.2 km study zone on Seas Branch Creek.
METHODS Trout populations, associated fish
populations, aquatic invertebrate populations, and the sport fishery of Seas Branch Creek were studied from September 1970 through September 1972. A culvert-type fish barrier was installed in the middle of the study zone in August 1972 and chemical removal of all fish with antimycin A occurred in early October. Cohorts of domesticated brown trout, similar to those stocked before treatment, were subsequently reintroduced and an identical study of the trout populations, forage fish populations, aquatic invertebrate populations, and sport fishery was conducted from October 1972 through November 1974. A minor segment of the trout population prior to treatment consisted of wild brown
trout, but none were returned to the study zone following treatment.
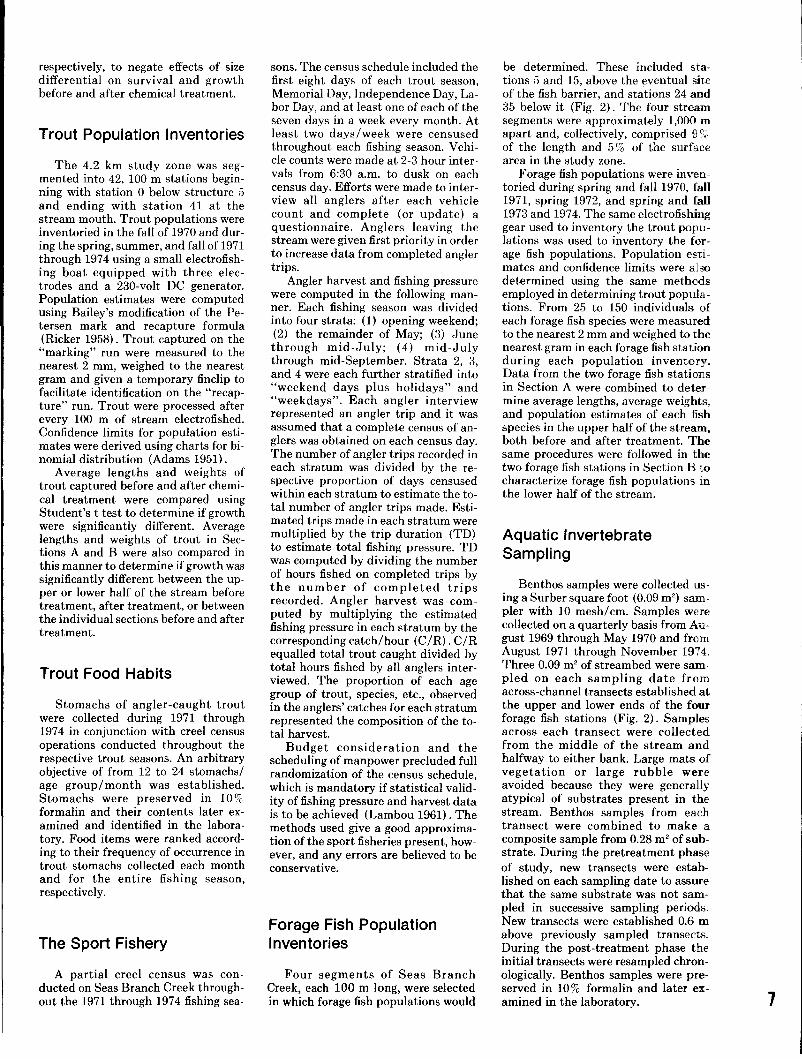
The Fish Barrier
A 12.2 m culvert-type fish barrier (216 em x 135 em) was installed in the middle of the study zone in AugustSeptember 1972. The upper half of the study zone (stations 0-19) became Section A; the lower half (stations 20-41) became Section B (Fig. 2). A vertical drop of 0.9 m was established between the downstream end of the culvert and the water level of the "splash pool". A framework of parallel iron gratings was bolted to the lower end of the culvert and extended over the "splash pool" to prevent larger fish
from jumping into the culvert and gaining access to upstream areas. The parallel gratings were separated by 25 mm and installed with a 4% downstream slope to promote self-cleaning. An emergency spillway was constructed to discharge water into a dry side channel in the event stream discharge exceeded the capacity of the culvert during periods of above average runoff. The side channel merged with the main stream 0.4 km below the fish barrier. Physical changes in the stream resulting from installation of the fish barrier included a widening and deepening of the stream for approximately 100 m upstream and the creation of a small "splash pool" downstream with a 40 m section of channelized stream to carry water away rapidly. 5
6
Chemical Treatment
The 5.3 ha impoundment behind P.L. 566 structure 5 was drawn down to stream channel in mid-August 1972. The 6.3 ha impoundment behind P.L. 566 structure 4 supported a bass-bluegill fishery and was excluded from treatment because it could not be drained. Trout were salvaged from the entire reach of Seas Branch Creek in mid-September 1972 and held in an impounded spring head (i.e., cooperative trout rearing facility) adjacent to the stream until after chemical treatment. These fish were subsequently returned to the stream above the study zone.
During the last week of September 1972, streamflow measurements, dye tests, and timing sequences were completed in preparation for chemical treatment. On October 4 Seas Branch Creek was treated with antimycin A for 20 hours . Within the study zone, introduction of antimycin began at 8:30 a.m. and terminated at 8:00 p.m. for a duration of 11.5 hours. A second treatment of the tributary below P.L. structure 4 was necessary and extended the treatment phase for another 6.5 hours and into the early hours of October 5. Calculated maximum exposure was 61 ppb for 7.5 hours at drip station 1, located immediately below P.L. 566 structure 5. At drip station 2, located 2.0 km downstream, maximum exposure was 60 ppb for 6.0 hours. Antimycin concentrations were three to six times higher than normal in the stream, due to mathematical miscalculations and equipment malfunctions. Exposure at the stream mouth was 31.5 ppb for 5.0 hours followed by a minimum of 18 ppb during the next hour plus residual exposure during the time the antimycin was decomposing and moving down from areas upstream. In addition to the two primary drip sta-
The fish barrier impounded a shallow pool upstream (left) and scoured out a 4V2-{oot splashpool
downstream (right).
tions on the main stream, secondary drip stations were established at the sources of all tributaries. Antimycin concentrations and the duration of exposure were adjusted to equal 10 ppb for 6.0 hours at the confluence of each tributary with the main stream.
On October 6, 1972 the gate in P.L. 566 structure 5 was partially closed and the impoundment refilled in about two weeks. During this time stream flow was below normal in the study zone. No fish life was found in the main stream during electrofishing surveys conducted the first week after treatment. A few slimy sculpins (Cottus cognatus), fathead minnows (Pimephales promelas), and white suckers (Catostomus commersoni) were found and removed from a small spring-fed pool below P.L. 566 structure 4.
Trout Stocking
Similar fall stockings of age 0 brown trout were made during the pre- and post-treatment study periods (Table 2). The first pre and post-treatment stockings consisted of 2,525 trout averaging 142 mm and 2,480 trout averaging 147 mm, respectively. These fish were scatter-stocked in the stream at a density of 60 trout every 100 m. The second pre and post-treatment stockings consisted of 1,280 trout averaging 160 mm and 1,275 trout averaging 160 mm, respectively. These fish were scattered-stocked at a density of 30 trout every 100 m. Each cohort of trout was marked with a different finclip to assist in subsequent identification. Comparable stocks of trout were graded to within 38 mm and 26 mm size ranges,
TABLE 2. Characteristics of age 0 brown trout stocked in Seas Branch Creek before (1970 and 1971) and after (1972 and 1973) chemical treatment.
Date Number Average Average Total Stocked Stocked Length (mm) Weight (g) Biomass (kg) R
respectively, to negate effects of size differential on survival and growth before and after chemical treatment.
Trout Population Inventories
The 4.2 km study zone was segmented into 42, 100 m stations beginning with station 0 below structure 5 and ending with station 41 at the stream mouth. Trout populations were inventoried in the fall of 1970 and during the spring, summer, and fall of 1971 through 1974 using a small electrofishing boat equipped with three electrodes and a 230-volt DC generator. Population estimates were computed using Bailey's modification of the Petersen mark and recapture formula (Ricker 1958). Trout captured on the "marking" run were measured to the nearest 2 mm, weighed to the nearest gram and given a temporary finclip to facilitate identification on the "recapture" run. Trout were processed after every 100 m of stream electrofished. Confidence limits for population estimates were derived using charts for binomial distribution (Adams 1951).
Average lengths and weights of trout captured before and after chemical treatment were compared using Student's t test to determine if growth were significantly different. Average lengths and weights of trout in Sections A and B were also compared in this manner to determine if growth was significantly different between the upper or lower half of the stream before treatment, after treatment, or between the individual sections before and after treatment.
Trout Food Habits
Stomachs of angler-caught trout were collected during 1971 through 1974 in conjunction with creel census operations conducted throughout the respective trout seasons. An arbitrary objective of from 12 to 24 stomachs/ age group/month was established. Stomachs were preserved in 10% formalin and their contents later examined and identified in the laboratory. Food items were ranked according to their frequency of occurrence in trout stomachs collected each month and for the entire fishing season, respectively.
The Sport Fishery
A partial creel census was conducted on Seas Branch Creek throughout the 1971 through 1974 fishing sea-
sons. The census schedule included the first eight days of each trout season, Memorial Day, Independence Day, Labor Day, and at least one of each of the seven days in a week every month. At least two days/week were censused throughout each fishing season. Vehicle counts were made at 2-3 hour intervals from 6:30 a.m. to dusk on each census day. Efforts were made to interview all anglers after each vehicle count and complete (or update) a questionnaire. Anglers leaving the stream were given first priority in order to increase data from completed angler trips.
Angler harvest and fishing pressure were computed in the following manner. Each fishing season was divided into four strata: (1) opening weekend; (2) the remainder of May; (3) June through mid-July; (4) mid-July through mid-September. Strata 2, 3, and 4 were each further stratified into "weekend days plus holidays" and "weekdays". Each angler interview represented an angler trip and it was assumed that a complete census of anglers was obtained on each census day. The number of angler trips recorded in each stratum was divided by the respective proportion of days censused within each stratum to estimate the total number of angler trips made. Estimated trips made in each stratum were multiplied by the trip duration (TD) to estimate total fishing pressure. TD was computed by dividing the number of hours fished on completed trips by the number of completed trips recorded. Angler harvest was computed by multiplying the estimated fishing pressure in each stratum by the corresponding catch/hour (C/R). C/R equalled total trout caught divided by total hours fished by all anglers interviewed. The proportion of each age group of trout, species, etc., observed in the anglers' catches for each stratum represented the composition of the total harvest.
Budget consideration and the scheduling of manpower precluded full randomization of the census schedule, which is mandatory if statistical validity of fishing pressure and harvest data is to be achieved (Lambou 1961). The methods used give a good approximation of the sport fisheries present, however, and any errors are believed to be conservative.
Forage Fish Population Inventories
Four segments of Seas Branch Creek, each 100 m long, were selected in which forage fish populations would
be determined. These included stations 5 and 15, above the eventual site of the fish barrier, and stations 24 and 35 below it (Fig. 2). The four stream segments were approximately 1,000 m apart and, collectively, comprised 9 ?~, of the length and 5% of the surface area in the study zone.
Forage fish populations were inventoried during spring and fall 1970, fall 1971, spring 1972, and spring and fall 1973 and 1974. The same electrofishing gear used to inventory the trout populations was used to inventory the forage fish populations. Population estimates and confidence limits were also determined using the same methods employed in determining trout populations. From 25 to 150 individuals of each forage fish species were measured to the nearest 2 mm and weighed to the nearest gram in each forage fish station during each population inventory. Data from the two forage fish stations in Section A were combined to determine average lengths, average weights, and population estimates of each fish species in the upper half of the stream, both before and after treatment. The same procedures were followed in the two forage fish stations in Section B to characterize forage fish populations in the lower half of the stream.
Aquatic Invertebrate Sampling
Benthos samples were collected using a Surber square foot (0.09 m2
) sampler with 10 mesh/ em. Samples were collected on a quarterly basis from August 1969 through May 1970 and from August 1971 through November 1974. Three 0.09 m2 of streambed were sampled on each sampling date from across-channel transects established at the upper and lower ends of the four forage fish stations (Fig. 2). Samples across each transect were collected from the middle of the stream and halfway to either bank. Large mats of vegetation or large rubble were avoided because they were generally atypical of substrates present in the stream. Benthos samples from each transect were combined to make a composite sample from 0.28 m2 of substrate. During the pretreatment phase of study, new transects were established on each sampling date to assure that the same substrate was not sampled in successive sampling periods. New transects were established 0.6 m above previously sampled transects. During the post-treatment phase the initial transects were resampled chronologically. Benthos samples were preserved in 10% formalin and later examined in the laboratory. 7
8
Analysis of Invertebrate Samples
Invertebrates in each sample were separated from debris, identified to genera (in most cases), and counted. Preliminary analyses showed that sample means were positively related to sample variances and frequency distribution of sample densities approximated a negative binomial distribution. A logarithmetic transformation, i.e., log (X + 1), of the invertebrate count in each of the eight 0.28 m2 samples collected each quarter was, therefore, made to normalize the frequency
TROUT POPULATIONS
Spatial Distribution
Five stations in Section A and five stations in Section B contained an average of 52% of the trout captured during all four years of the study (Table 3). These 10 stations represented only 24% of the total length of the study zone but provided most of the better trout habitat available in the stream. Eight stations had two or more of the following characteristics: (1) average depth :Z: 25 em; (2) maximum depth > 0.8 m; (3) presence of bank cover; ( 4) presence of other miscellaneous cover. The two other stations, numbers 20 and 21, were somewhat atypical. Significant numbers of trout in these stations occurred only after installation of the fish barrier between Sections A and B. Blockage of free movement upstream to trout which may have become displaced from Section A to Section B, the creation of additional cover in the form of a "splash pool" in station 20, and the logistics of station 21 may have all been equally important in determining the increased presence of trout in these two stations.
Population Composition, Survival, and Harvest
Before Chemical Treatment. Prior to the initial fall stocking of domesticated fingerlings in September 1970, the resident trout population in
distribution of the invertebrates and facilitate use of parametric statistics to compare derived means in corresponding and, in some instances, consecutive sampling periods. (Comparisons of derived means were made in consecutive sampling periods when a seasonal pattern of abundance was not evident from quarterly samples.) Derived means were obtained by subtracting 1 from the antilog of mean transformed counts (Elliot 1971). Only the most important families within each invertebrate Order were compared in this manner. Derived means were compared using Student's t test at 95% level of rejection.
----------- ------~
RESULTS Seas Branch Creek consisted primarily of wild fingerling (age 0) brown trout, along with smaller contingents of wild yearlings and domesticated age I +'s (Table 4). The initial cohort of 2,525 stocked fingerlings increased the population to 2,763 (658/km) which was the largest trout population present during the four years of study.
Domesticated and wild yearling trout comprised 83% and 13%, respectively, of the population present in April1971. Overwinter survival of wild fingerlings was 67%, compared to 31% for domesticated fingerlings, even though the latter were 10 mm larger than the wild residents when stocked the previous fall. By mid-September, and the end of the 1971 trout fishing season, only 16% of the spring population of domesticated yearlings remained. These survivors were equivalent to 5% of the original cohort stocked 12 months earlier. In contrast, 43% of the spring population of wild yearlings remained, equivalent to 29% of the population present the previous fall. Estimated angler harvest accounted for 76 'J~, of the summer decline in domesticated yearlings and 30% of the decline in wild trout (Table 5). The fall population was augmented by the second cohort of domesticated age 0 brown trout and the 1971 wild year class.
In May, 1972, the two domesticated cohorts of brown trout comprised 83 ';(, of the trout population (Table 4). The remaining 17 '/(, consisted of wild yearlings, age Il+'s, and domesticated age l+'s. Overwinter survival of the domesticated fingerlings was 36% or only 5 '%
better than that of the initial cohort of fingerlings stocked at twice the density. Overwinter survival of wild fingerlings was 78%, more than twice that of the domesticated fish, even though the domesticated trout were 38 mm larger than the wild residents when stocked the previous fall. It appears that wild fingerlings have what Bohlin (1977) refers to as an "owners advantage" over stocked fingerlings. This gives them competitive advantage for the available space which, in turn, results in better survival. However, overwinter survival of the domesticated yearlings was 80%, and the age Il's helped compensate for the low number of yearlings present.
The trout population declined precipitiously between May and July 1972, following the same pattern shown in 1971 (Table 3) . By the end of September, only 13% of the spring population of domesticated yearlings, 16% of the spring population of domesticated two year olds, and 38% of the spring population of wild yearlings remained. Estimated angler harvest explained 34% of the decline in domesticated yearlings, 52 'Ia of the decline in domesticated two year olds, and 46% of the decline in wild yearlings (Table 5). Total exploitation of the fingerlings stocked in 1970 and 1971 was 22 ~;, and 16 ~o, respectively. The 1972 wild year class was a failure and all trout captured in September were removed and returned to the stream above the study zone following chemical treatment.
After Chemical Treatment. Overwinter survival of the first cohort of fingerling brown trout stocked following
TABLE 3. Trout captured per 100 m station of Seas Branch Creek during spring, summer, and fall population inventories, 1971-74.
Station 1971 1972 Chemical 1973 No. Apr Jul Sep May Jul Sep Treatment Apr Jul Sep
*Stations containing an average of;:;;. 5% of trout captured during the study.
chemical treatment was 30% or essentially the same as the overwinter survival of its counterpart stocked before treatment (Table 6). Spring to fall survival in 1973 was 36% while total survival after one year was 11%. The latter's survival was more than twice the survival of their pretreatment counterparts, but can be attributed primarily to a 7 4% decline in angler harvest during the 1973 fishing season (Table 5). Local anglers knew the stream had been chemically treated the previous fall and that large trout would not be available. Consequently, many proficient anglers interviewed prior to
chemical treatment were noticeably absent in 1973. The result was that anglers harvested only 19% of the spring population of yearlings compared with 64% of the spring population in 1971.
Yearling and two-year-old domesticated brown trout comprised 73% and 25%, respectively, of the total population present in April 1974 (Table 6). Overwinter survival of the second cohort of fall fingerlings was 50%. This was 20% better than that of the initial cohort stocked at twice the density and 14% better than that of their counterparts stocked before treatment. Overwinter survival of domesticated year-
lings was 82%, or roughly equivalent to that achieved by their pretreatment counterparts.
Populations of both yearling and age II trout in 1974 followed the same trend as in all three previous years, that is, a sharp decline between April and July followed by a more gradual decline between July and September. Approximately 21% of the spring population of yearlings and 10% of the original cohort stocked remained in September 197 4. Estimated harvest accounted for 55% of the decline in yearlings from spring to fall as angler use returned to pretreatment levels. 9
10
TABLE 4. Trout populntions in Seas Branch Creek before chemical treatment, 1970-72 *
half of the study zone, that is in Section B. In 15 of 18 comparisons between average lengths and weights of trout in both sections, the trout in Section B were larger. Differences were significant at the 95% level in eight of the 15 comparisons (Table 9).
1970 Date Sep Apr
Domesticated Brown Trout Age 0 2,525 Age I 804 Age II Age I+ 30 19
Wild Brown Trout Age 0 183 Agel 25 122 Age II+ 21
Domesticated Rainbow Trout Age I+
TOTALS 2,763 966
NO./KM 658 230
1971 Jul Sep
1,280 169 131
12 9
50 50 58 53
9 9
3 2
300 1,534
71 365
1972 May Jul
459 89 105 30
21 5
39 22 56 16
680 163
162 39
Sep
61 17
8
3 15 10
114
27
After Chemical Treatment. The initial cohort of age 0 brown trout stocked after chemical treatment grew an average of 159 mm and 340 g during their first· 11.5 months in the stream and 246 mm and 738 g by the end of their second year (Table 7). Yearlings averaged 306 mm. and 376 g in the fall and age Il's averaged 393 mm and 77 4 g one year later (Table 8). The second cohort of fingerlings, stocked in September 1973, grew 150 mm and 309 g during their first year and averaged 310 mm and 359 g in September, 1974. Considering two weeks longer in residence and an initial size advantage of 13 mm, growth of the second cohort of fingerlings was slower than that of the first cohort of fingerlings stocked.
*Trout other than domestic browns, age 0, I, II, were initial residents and/or immigrants. Following chemical treatment
growth of both cohorts of trout was better in Section A, the upper half of the study zone. Average lengths and weights of trout in section A were greater in all18 comparisons with trout in Section B (Table 10). Differences were significant at the 95% level in 13 of these comparisons. High concentrations of trout in the first 300 m below the fish barrier were largely responsible for the slower average growth in Section B. An average of 34% of the trout captured were taken in this reach of stream and densities reached as high as 873/km. Trout captured in this reach of stream were noticeably smaller than in the remainder of Section B.
Total exploitation of this cohort during the 1974 fishing season was 22%, or 6% greater than that of their counterparts during 1972, before treatment.
Only 26% of the spring population of age II trout remained in September 1974. This was 2% of the original cohort stocked in the fall of 1972. Angler harvest in 1974 accounted for 44% of the spring population while total exploitation of the cohort was 9% during the 1973 and 1974 fishing seasons. The latter was 13% less than the corresponding exploitation of their counterparts during the two years before treatment and was primarily due to the meager harvest of yearlings in 1973. A population of 188 domesticated brown trout remained in September 1974, a 241% improvement over the 78 domesticated trout remaining in September 1972. This improvement was primarily a reflection of the lower harvest of the initial cohort of fingerlings stocked after treatment and better overwinter survival of the second cohort of fingerlings stocked.
Growth
Before Chemical Treatment. Age 0 brown trout stocked in late September 1970 grew 134 mm and 222 g during the first 11.5 months in Seas Branch Creek and 213 mm and 566 g by the
end of their second year (Table 7). Yearlings averaged 276 mm and 254 g in the fall and a year later age Il's averaged 355 mm and 598 g (Table 8) . The second cohort of age 0 trout, stocked in September 1971, grew 135 mm and 262 g during their first 12 months and averaged 295 mm and 306 g in September 1972. Considering the two week longer residence of the second cohort, little difference in growth was evident between the two cohorts during their first year in the stream.
Growth of both cohorts of brown trout was generally better in the lower
Pre and Post Treatment Comparisons. Trout growth improved significantly in Seas Branch Creek following chemical treatment and removal of the forage fish population. Growth of
TABLE 5. Composition of the harvest from Seas Branch Creek in 1971-74.
Domesticated Wild Other Brown Trout Brown Trout Trout
TABLE 8. Size comparisons of matched fall stockings of age 0 brown trout before and after chemical treatment of Seas Branch Creek (italics= after treatment)
Initial Cohorts Second Cohorts Avg. Avg. Avg. Avg.
Length t Weight t Length Weight t Date (mm) Value (g) Value (mm) Value (g) Value
TABLE 11. Size comparisons of matched fall stockings of age 0 brown trout in Section A of Seas Branch Creek before and after chemical treatment (italics= after treatment).
Avg. Avg. Avg. Avg. Length t Weight t Length t Weight t
TABLE 12. Size comparisons of matched fall stockings of age 0 brown trout in Section B of Seas Branch Creek before and after chemical treatment (italics= after treatment).
Avg. Avg. Avg. Avg. Length Weight Length t Weight t
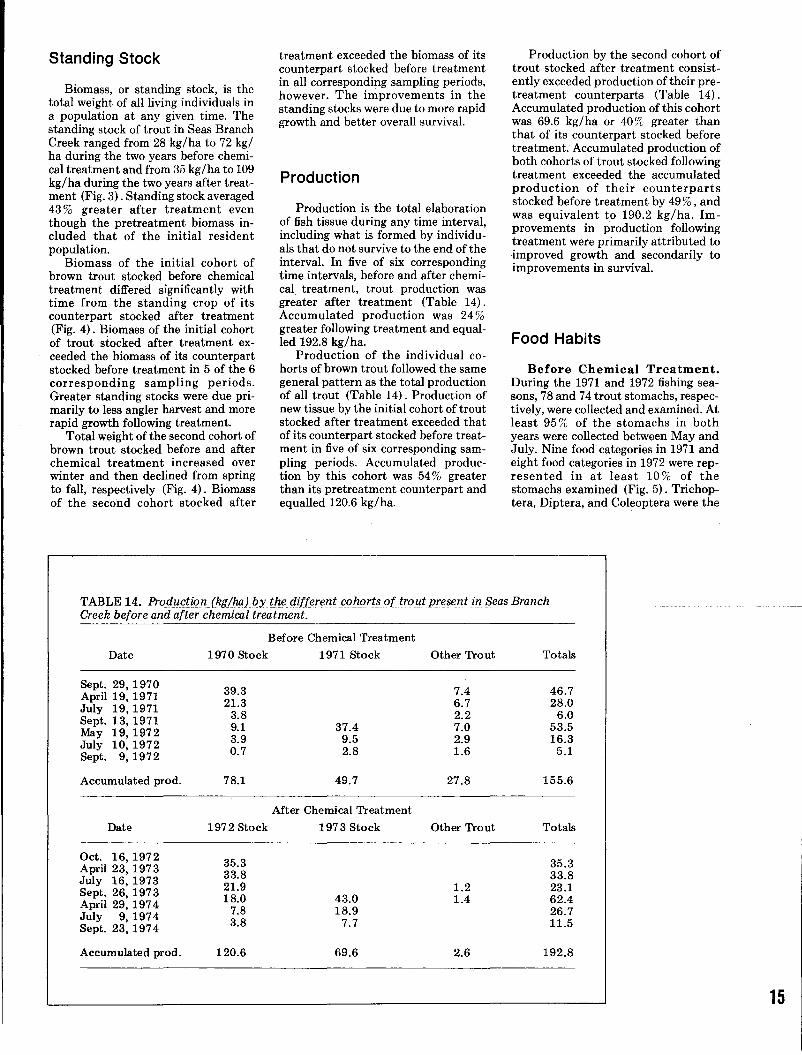
the initial cohort of trout stocked after treatment exceeded that of its pretreatment counterpart by 19% in length and 53% in weight during the first year (Table 7) . A difference of 15% in length and 30% in weight was still evident at the end of the second year (Table 8). Growth of the second cohort of brown trout exceeded that of its pretreatment counterpart by 10% in length and 22% in weight during their one year tenure. Slower growth of yearlings during the second year after treatment may really reflect the possibility that faster growing individuals in a population are harvested first, since harvest in 197 4 was much greater than in 1973. Intraspecific and interspecific competition for food may be a consideration but the abundant food resources lend little support to this as an explanation for the slower growth. Trout growth within each section of Seas Branch Creek was also faster following chemical treatment. In Section A average lengths and weights of both cohorts of trout were consistently larger than the average lengths and weights of their counterparts residing in Section A before treatment. Differences were significant at the 95% level in 17 out of 18 comparisons (Table 11). Differences in growth in Section B were not as consistent as in Section A, but trout were equal to or larger than their counterparts present before treatment in 12 out of 18 comparisons (Table 12).
Differences were significant at the 95% level in five of the 12 comparisons.
Since the most rapid growth of trout was in Section B before chemical treatment and in Section A after treatment, a comparison in trout growth
was made between these stations (Table 13). In 17 of 18 comparisons, trout growth was still faster after treatment, that is in Section A. Differences were significant at the 95% level in 16 of the 17 comparisons.
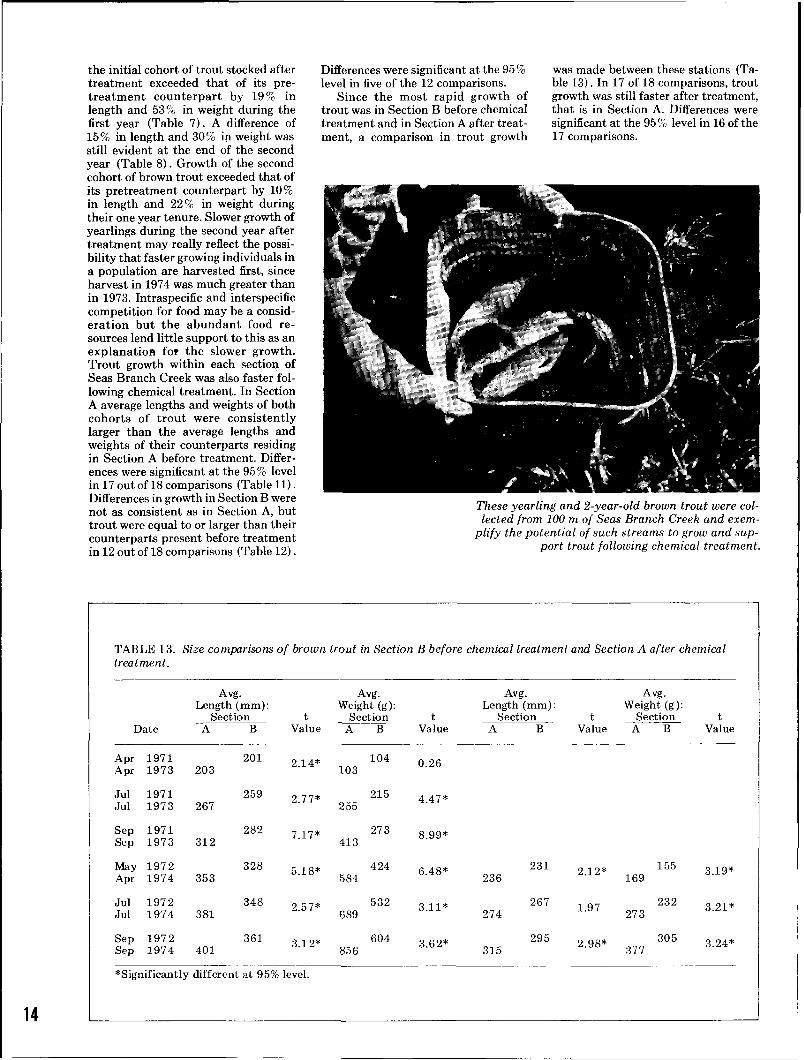
These yearling and 2-year-old brown trout were collected from 100m of Seas Branch Creek and exem
plify the potential of such streams to grow and support trout following chemical treatment.
TABLE 13. Size comparisons of brown trout in Section B before chemical treatment and Section A after chemical treatment.
Biomass, or standing stock, is the total weight of all living individuals in a population at any given time. The standing stock of trout in Seas Branch Creek ranged from 28 kg/ha to 72 kg/ ha during the two years before chemical treatment and from 35 kg/ha to 109 kg/ha during the two years after treatment (Fig. 3). Standing stock averaged 43% greater after treatment even though the pretreatment biomass included that of the initial resident population.
Biomass of the initial cohort of brown trout stocked before chemical treatment differed significantly with time from the standing crop of its counterpart stocked after treatment (Fig. 4) . Biomass of the initial cohort of trout stocked after treatment exceeded the biomass of its counterpart stocked before treatment in 5 of the 6 corresponding sampling periods. Greater standing stocks were due primarily to less angler harvest and more rapid growth following treatment.
Total weight of the second cohort of brown trout stocked before and after chemical treatment increased over winter and then declined from spring to fall, respectively (Fig. 4) . Biomass of the second cohort stocked after
treatment exceeded the biomass of its counterpart stocked before treatment in all corresponding sampling periods, however. The improvements in the standing stocks were due to more rapid growth and better overall survival.
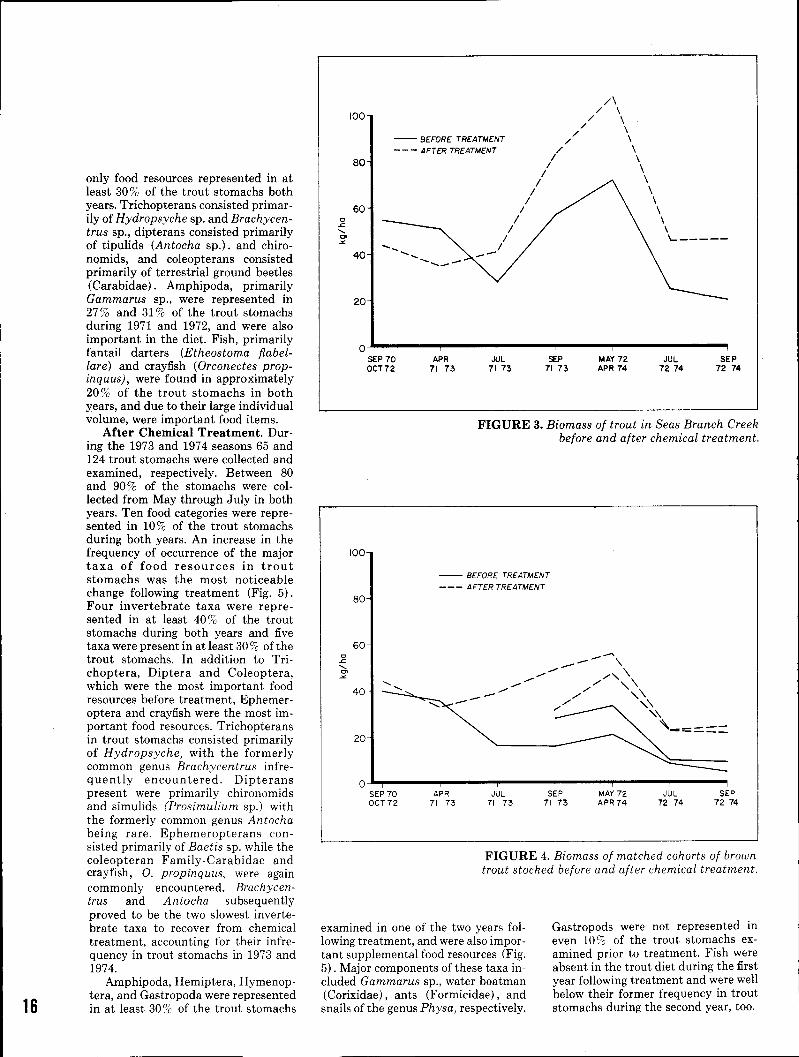
Production
Production is the total elaboration of fish tissue during any time interval, including what is formed by individuals that do not survive to the end of the interval. In five of six corresponding time intervals, before and after chemical treatment, trout production was greater after treatment (Table 14). Accumulated production was 24% greater following treatment and equalled 192.8 kg/ha.
Production of the individual cohorts of brown trout followed the same general pattern as the total production of all trout (Table 14). Production of new tissue by the initial cohort of trout stocked after treatment exceeded that of its counterpart stocked before treatment in five of six corresponding sampling periods. Accumulated production by this cohort was 54% greater than its pretreatment counterpart and equalled 120.6 kg/ha.
Production by the second cohort of trout stocked after treatment consistently exceeded production of their pretreatment counterparts (Table 14). Accumulated production of this cohort was 69.6 kg/ha or 40% greater than that of its counterpart stocked before treatment: Accumulated production of both cohorts of trout stocked following treatment exceeded the accumulated production of their counterparts stocked before treatment by 49% , and was equivalent to 190.2 kg/ha. Improvements in production following treatment were primarily attributed to improved growth and secondarily to improvements in survival.
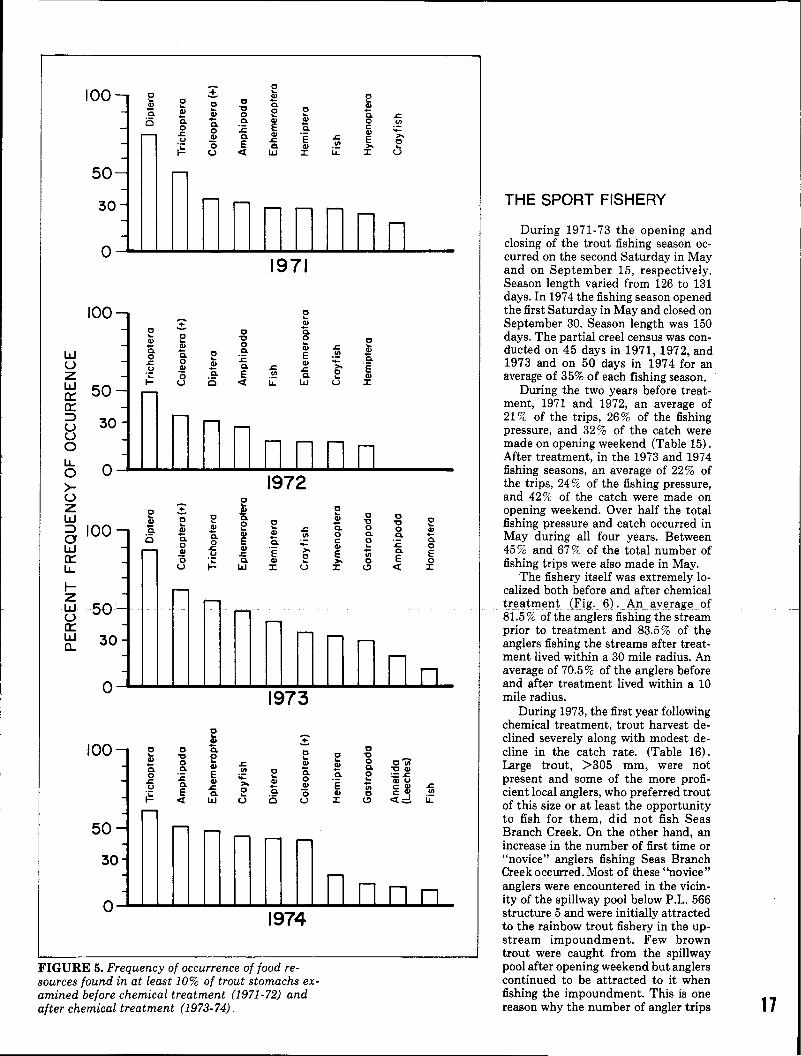
Food Habits
Before Chemical Treatment. During the 1971 and 1972 fishing seasons, 78 and 74 trout stomachs, respectively, were collected and examined. At least 95% of the stomachs in both years were collected between May and July. Nine food categories in 1971 and eight food categories in 1972 were represented in at least 10% of the stomachs examined (Fig. 5). Trichoptera, Diptera, and Coleoptera were the
T AilL;E: 1<!. Production (kg/ha) by the different cohorts o[ trout present in Seas Branch Creek before and after chemical treatment.
Oct. 16,1972 35.3 35.3 April 23, 1973 33.8 33.8 July 16, 1973 21.9 1.2 23.1 Sept. 26, 197 3 18.0 43.0 1.4 62.4 April 29, 1974 7.8 18.9 26.7 July 9, 1974 3.8 7.7 11.5 Sept. 23, 197 4
Accumulated prod. 120.6 69.6 2.6 192.8
15
16
only food resources represented in at least 30% of the trout stomachs both years. Trichopterans consisted primarily of Hydro psyche sp. and Brachycentrus sp., dipterans consisted primarily of tipulids (Antocha sp.). and chironomids, and coleopterans consisted primarily of terrestrial ground beetles (Carabidae). Amphipoda, primarily Gammarus sp., were represented in 27% and 31% of the trout stomachs during 1971 and 1972, and were also important in the diet. Fish, primarily fantail darters (Etheostoma flabellare) and crayfish (Orconectes propinquus), were found in approximately 20% of the trout stomachs in both years, and due to their large individual volume, were important food items.
After Chemical Treatment. During the 1973 and 1974 seasons 65 and 124 trout stomachs were collected and examined, respectively. Between 80 and 90% of the stomachs were collected from May through July in both years. Ten food categories were represented in 10% of the trout stomachs during both years. An increase in the frequency of occurrence of the major taxa of food resources in trout stomachs was the most noticeable change following treatment (Fig. 5). Four invertebrate taxa were represented in at least 40% of the trout stomachs during both years and five taxa were present in at least 30% of the trout stomachs. In addition to Trichoptera, Diptera and Coleoptera, which were the most important food resources before treatment, Ephemeroptera and crayfish were the most important food resources. Trichopterans in trout stomachs consisted primarily of Hydropsyche, with the formerly common genus Brachycentrus infrequently encountered. Dipterans present were primarily chironomids and simulids (Prosimulium sp.) with the formerly common genus Antocha being rare. Ephemeropterans consisted primarily of Baetis sp. while the coleopteran Family-Carabidae and crayfish, 0. propinquus, were again commonly encountered. Brachycentrus and Antocha subsequently proved to be the two slowest invertebrate taxa to recover from chemical treatment, accounting for their infrequency in trout stomachs in 1973 and 1974.
Amphipoda, Hemiptera, Hymenoptera, and Gastropoda were represented in at least 30% of the trout stomachs
100
-- BEFORE TREATMENT
---AFTER TREATMENT
80
60
I I --
.... _ .... _ ................. ...---40
20
I I
I
I I
I
I
/ /
/ I
I
/ /
/
\ \ \ \ \ \ \ \ \ \ \ \ \ '-------
0~------~----~----~------~----~----~ SEP 70 OCT72
APR 71 73
JUL 71 73
SEP 71 73
MAY 72 APR 74
JUL 72 74
SEP 72 74
FIGURE 3. Biomass of trout in Seas Branch Creek before and after chemical treatment.
100
-- BEFORE TREATMENT
--- AFTER TREATMENT
c ""' ' "' -"'
80
60
40 ......
'
SEP 70 OCT72
APR 71 73
JUL 71 73
SEP 71 73
MAY 72 APR74
JUL 72 74
SEP 72 74
FIGURE 4. Biomass of matched cohorts of brown trout stocked before and after chemical treatment.
examined in one of the two years following treatment, and were also important supplemental food resources (Fig. 5). Major components of these taxa included Gammarus sp., water boatman (Corixidae), ants (Formicidae), and snails of the genus Physa, respectively.
Gastropods were not represented in even 10% of the trout stomachs examined prior to treatment. Fish were absent in the trout diet during the first year following treatment and were well below their former frequency in trout stomachs during the second year, too.
100
50
100
50
30
100
50
30
c ... Gl a. 0
.<:
"' ~
c ... Gl a. 0
.<:
"' if
c '1:1 0 Q.
.<: Q. E <t
± c ... Gl c. 0 Gl 0 u
~ Gl a. 0
~ a e Gl E Gl .<: Q.
LJ.J
c '1:1 0 Q.
.<: Q. E <t
c '1:1 0 Q.
~ Q.
E <t
~ .!! Q. e Gl E Gl
.<: Q.
LJ.J
.<:
"' ;;:: ,..., ~ u
1971
e Gl a. ·e Gl J:
c ... ~ c. 0
c ... Gl c. e Gl E Gl
.<: c.
LJ.J
.<:
"' -,..., c ... u
c ... Gl a. 0 Gl 0 u
FIGURE 5. Frequency of occurrence of food resources found in at least 10% of trout stomachs examined before chemical treatment (1971-72) and after chemical treatment (1973-74).
.<:
.~ ->-c ... u
c ... Gl a. 0 c: Gl E ,..., J:
~ Gl a. ·e Gl J:
e Gl a. 0 c: Gl E >J:
c 'C 0 Q. 0 ... u; c
(,!)
c 'C 0 Q.
~ "' c
(,!)
0 'C 0 Q.
.<: Q.
E <t
~ Gl c. 0 E ~
THE SPORT FISHERY
During 1971-73 the opening and closing of the trout fishing season occurred on the second Saturday in May and on September 15, respectively. Season length varied from 126 to 131 days. In 1974 the fishing season opened the first Saturday in May and closed on September 30. Season length was 150 days. The partial creel census was conducted on 45 days in 1971, 1972, and 1973 and on 50 days in 1974 for an average of 35% of each fishing season.
During the two years before treatment, 1971 and 1972, an average of 21% of the trips, 26% of the fishing pressure, and 32% of the catch were made on opening weekend (Table 15). After treatment, in the 1973 and 1974 fishing seasons, an average of 22% of the trips, 24% of the fishing pressure, and 42% of the catch were made on opening weekend. Over half the total fishing pressure and catch occurred in May during all four years. Between 45% and 67% of the total number of fishing trips were also made in May.
The fishery itself was extremely localized both before and after chemical treatment (Fig. 6). An average of 81.5% of the anglers fishing the stream prior to treatment and 83.5% of the anglers fishing the streams after treatment lived within a 30 mile radius. An average of 70.5% of the anglers before and after treatment lived within a 10 mile radius.
During 1973, the first year following chemical treatment, trout harvest declined severely along with modest decline in the catch rate. (Table 16) . Large trout, >305 mm, were not present and some of the more proficient local anglers, who preferred trout of this size or at least the opportunity to fish for them, did not fish Seas Branch Creek. On the other hand, an increase in the number of first time or "novice" anglers fishing Seas Branch Creek occurred. Most of these "novice" anglers were encountered in the vicinity of the spillway pool below P.L. 566 structure 5 and were initially attracted to the rainbow trout fishery in the upstream impoundment. Few brown trout were caught from the spillway pool after opening weekend but anglers continued to be attracted to it when fishing the impoundment. This is one reason why the number of angler trips 17
18
and fishing pressure in 1973 were maintained more equitably than the harvest and catch rate. In 1974 some of the more proficient local anglers began to fish the stream again because large trout were again available. All aspects of the sport fishery improved while the number of fishing trips as well as the fishing pressure were the highest observed in the study. Overall, in the two years following treatment, the total number of fishing trips and total fishing pressure were 20% and 6% greater, respectively, than in the two years prior to treatment. Total harvest declined 36%, however, and the average catch rate declined from 0. 7 trout/hr. to 0.4 trout/hr.
FORAGE FISH POPULATIONS
Eighteen species of fish other than trout were captured and identified from the four minnow stations in Seas Branch Creek. Three additional species were captured and identified from other portions of the stream, thus increasing the total number identified to 21 (Table 17).
Before Chemical Treatment. Forage fish populations in Section B, the lower half of the study zone, ranged from a high of 34 7,000 /ha in September 1972 (Tables 18 and 19). Forage fish in Section A, the upper half of the study zone, were roughly half as abundant, with a high of 163,842/ha in September 1970 and a low of 64,241/ha
1971
1973
1972
BEFORE CHEMICAL TREATMENT
1974
AFTER CHEMICAL TREATMENT
FIGURE 6. Origin of angler trips made to Seas Branch Creek, 1971-74. (Distances are straight line
radii from the stream.)
TABLE 15. Chronology of fishing pressure and harvest during the 1971-74 fishing seasons on Seas Branch Creek.
Time of Season
Opeai,1g weekend Remainder May June - mid-July Mid-July- Sept.
TOTALS
Time of Season
Opening weekend Remainder May June - mid-July Mid-July- Sept.
TOTALS
1971 Fishing Pressure
Trips Hrs.
50 153.0 66 142.0 95 157.5 44 94.0
255 546.5
1973 Fishing Pressure
Trips Hrs.
66 120.0 78 164.5 79 177.5 51 66.5
274 527.5
Harvest
184 142 173
56
555
Harvest
63 18 23 34
107
1972 Fishing Pressure
Trips fus.
73 146.0 151 267.0
84 153.0 27 45.0
335 611.0
1974 Fishing Pressure
Trips fus.
98 186.0 136 190.0 144 187.0 100 150.5
478 713.5
Harvest
88 134
31 18
271
Harvest
149 141
29 70
389
I
TABLE 16. Angling pressure and harvest statistics for the 1971-74 trout fishing seasons on Seas Branch Creek.
No. Angling Tot. Pressure Total Catch/ Year Trips (hr/ha) Harvest Hour
1971 274 270 555 1.0 1972 352 302 271 0.4
CHEMICAL TREATMENT- Oct. 1972
1973 274 259 138 0.3 1974 478 345 389 0.5
TABLE 17. Other fish species found in Seas Branch Creek before and after chemical treatment.
Common Name**
Fantail darter Johnny darter Blacknose dace Longnose dace Southern redbelly dace Redside dace Central stoneroller Creek chub Hornyhead chub White sucker Northern hog sucker Slimy sculpin
*Found only after chemical treatment and represented by only one individual.
I **Common and scientific names from Hubbs and Lagler (1958 ).
in May 197 2. Populations in both sections were generally higher in the fall than in the spring due to the recruitment of new year classes into the population.
Total biomass of forage fishes ranged from 1,445 kg/ha to 550 kg/ha in Section Band from 748 kg/ha to 451 kg/ha in Section A. These ranges paralleled the high and low numerical populations in each section.
In order of decreasing numerical importance, fantail darter (Etheos-
toma flabellare) , central stoneroller (Campostoma anomalum), blacknose dace (Rhinichthys atratulus) , brook stickleback (Eucalia inconstans) , and johnny darter (Etheostoma nigrum) were the most consistently abundant fishes in Section B. Together they comprised from 89 to 96% of the populations present during the four population inventories. Fantail darter, central stoneroller, white sucker (Catostomus commersoni) , blacknose dace, and creek chub (Semotilus atromacu-
latus) comprised from 89% to 97% of the total weight present during each of the population inventories.
In order of decreasing numerical importance, fantail darter, black:nose dace, slimy sculpin (Cottus cognatus) , brook stickleback, and central stoneroller were the most consistently abundant fishes in Section A. These species comprised from 75% to 93% of the populations present during the p<Jpulation inventories. The white sucker, fantail darter, central stoneroller, blacknose dace, and slimy sculpin comprised from 82% to 92% of the total weight present.
Considering both numbers and biomass, the fantail darter, central stoneroller, blacknose dace, and white sucker were the most important fishes in the entire study zone of Seas Branch Creek. The slimy sculpin was common only in Section A and was important in this reach of stream. The brook stickleback and johnny darter were generally abundant, especially in Section B, but were unimportant in terms of biomass. The creek chub was important in terms of biomass, particulary in Section B, but was not as abundant as any of the previously cited species. ·
After Chemical Treatment. Little movement of forage fish into Seas Branch Creek occurred during the first five weeks following chemical treatment. Sixty-three fish of four different species were captured in a double run electro-fishing survey of station 35 in November 1972. This was the lowermost forage fish station, loeatedt>.7-km above the mouth of Seas Branch Creek (Fig. 2). The central stoneroller comprised 92% of the catch. The thre'e other species captured included the blacknose dace, creek chub, and fathead minnow (Pimephales promelas). The white sucker was captured in a single run electrofishing survey of an additional400 m upstream. Forage fish became progressively less abundant upstream and no fish were seen in the last 200 m surveyed.
Unseasonably warm weather, rain, and melting snow increased the volume of Seas Branch Creek beyond the capacity of the culvert-type fish barrier in early March 1973. Excess water flowed over the emergency spillway and eroded it to near stream level. Upstream migration of forage fish past the barrier was not evident but considerable expense was necessary to repair the damage. Also in conjunction with the heavy runoff, the impoundment behind P.L. 566 structure No. 4 m·erflowed and flushed thousands of bluegill (Lepomis macrochirus) down into the study zone. However, most bluegills were removed during the spring electrofishing survey for trout in 1973. 19
20
In April 1973, six months following chemical treatment, 13 forage fish species (excluding bluegill) comprised a density of 12,223/ha and a standing stock of 145 kg/ha in Section B (Table 20). The central stoneroller, fathead minnow, and white sucker comprised over 93% of both the population and biomass. The central mudminnow (Umbra limi) and black bullhead (lctalurus melas) were captured for the first time during the study. However, the black bullhead had occasionally been seen in the stream prior to treatment. The density and standing stock of forage fish was equivalent to 7% of the average spring density and 19% of the average spring biomas before treatment.
Only five forage fish species (excluding bluegill) were captured in Section A of Seas Branch Creek in April 1973. A density of 100/ha was less than 1% of the average spring density prior to treatme!lt. Total biomass was negligible.
One year after treatment, 12 forage fish species (excluding bluegill) comprised a density of 198,101/ha and a biomass of 514 kg/ha in Section B (Table 20). This was 71% of the average fall density before treatment and 49% of the average fall biomass. All species captured before treatment were again present. Bluegills were no longer abundant due to intensive removals during the spring and summer trout population inventories. Populations of central stoneroller, white sucker, and fathead minnow, the three most abundant species in the spring, had declined and were relatively unimportant. Numbers of blacknose dace, fantail darter, brook
Erosion of the emergency spillway in 1973 (left) and slumping and collapse of the dike in 1974
(right) created unanticipated problems, which can be avoided with proper engineering and
construction.
stickleback and creek chub had increased rapidly, however, and together comprised most of the population and biomass. The blacknose dace was the dominant species and was more abundant than at any time during the study. The creek chub was the only other species approaching its pretreatment density.
Above the fish barrier, in Section A, bluegill, brook stickleback, and slimy sculpin comprised a population of 8,328/ha with a biomass of 16 kg/ha in September 1973. This was 6% of the average fall population density before treatment and 2% of the average fall biomass. Small brook stickleback comprised most of the population and biomass. Most of them appeared to be the result of a successful year class produced by apparent survivors of chemical treatment.
During early March 1974 unseasonably warm weather and melting snow once again created problems. Partial thawing of ground frost, saturated soil conditions and high water caused the southwest end of the earthen dike supporting the fish barrier to collapse. Repairs were made within three days but migration of some forage fishes into Section A was later indicated during the trout population inventory in April. At that time a few central stonerollers and creek chubs were observed in the first 400 m of stream above the fish barrier.
In April 1974 14 forage fish species comprised a population of 53,898/ha and a biomass of 206 kg/ha in Section B (Table 21). This was 30% of the average spring density and 26% of the average spring biomass before treat-
ment. The fantail darter and blacknose dace were the most abundant species but the creek chub, central stoneroller, and white sucker comprised most of the biomass. The golden shiner (Notemigonus crysoleucas) was collected for the first time. Blacknose dace was the only species approximating its abundance before treatment.
In Section A, brook stickleback and slimy sculpin comprised a density of 3,385/ha and a biomass of 2 kg/ha in April1974. This was 4% of the average spring density before treatment and less than 1% of the average spring biomass. Most of the population and biomass was comprised of brook sticklebacks.
Two years after chemical treatment, in September 1974, forage fish in Section B equalled 184,786/ha and had a biomass of 693 kg/ha (Table 21). This was 67% of the average fall population before treatment and 66% of the average standing stock. The fantail darter, creek chub, white sucker, blacknose dace, and central stoneroller were the most important species. Numbers of creek chubs and johnny darters had increased since spring and were more abundant than before treatment. Brook sticklebacks and white suckers were similar to their pretreatment densities.
Numbers of forage fish in Section A equalled 29,357 /ha in September 1974 while the total biomass was 33 kg/ha. This was 22% of the average fall density and 5% of the average fall biomass before treatment. Five species were present but brook stickleback comprised most of the population and biomass. The creek chub and blacknose
TABLE 18. Forage fish populations above and below the fish barrier site before chemical treatment- spring and fall, 1970.
ABOVE FISH BARRIER SITE (SECTION A)
April1970 September 1970 Population C. I. Density Biomass Population C. I. Density Biomass
dace were found for the first time since treatment. The central stoneroller was the second most abundant species but individuals were small, presumedly the result of successful spawning of a few adults seen in Section A shortly after collapse of the earthen dike in April 1974.
An additional electrofishing survey was conducted in Section A in May 1976, 3.5 years after treatment, to delineate further the chronology of the buildup of forage fishes (Table 22). Forage fish density was only 14% of the average pretreatment density and the standing stock was only 5 % of the average pretreatment biomass. The fathead minnow and brook stickleback were the most abundant species, with the fathead minnow comprising over half the biomass.
In summary all forage fish species present before chemical treatment were again present below the barrier one year after treatment. In that section, both density and biomass returned to two-thirds their former level by the end of two years. In contrast, only eight of 13 species present before treatment were present above the fish barrier after 3.5 years. More importantly, both density and biomass were still relatively insignificant above the barrier, and the smaller species, fathead minnow, brook stickleback, etc., were the most abundant species.
THE INVERTEBRATE COMMUNITY
Total Benthos. Fifty-nine taxa of aquatic invertebrates were identified from Seas Branch Creek (Table 23). The dominant forms, in order of decreasing abundance, were Trichoptera (caddisfly) - Hydropsyche sp. and Brachycentrus sp.; Diptera-Chironomidae (midges) and Antocha sp. (cranefl.y); Coleoptera-Optioservus sp. (riffle beetle); Ephemeroptera (mayfly) -Baetis sp. and Stenonema sp.; and Amphipoda-Gammarus sp. (scud.)
A weak trend in overall invertebrate abundance from low mean densities* in May to progressively higher mean densities in August, November and February-March was evident before chemical treatment (Fig. 7). Mean density ranged from 2,875/m2 in May, 1972 to 7,443/m2 in early March 1970.
A sharp decline in abundance occurred following chemical treatment in October 1972. Mean density in Novem-
*Mean density is actually a derived mean obtained by transforming the arithmetic mean of transformed counts (i.e., log x + 1) back to the original scale (Elliot 1971: 33).
12 14
12
0~--~-r--~,-~--~~--r-Lr--~,-~--~~--r--r~ AUG NOV MAR MAY AUG NOV FEB MAY AUG NOV FEB MAY AUG NOV FEB MAY AUG NOV
1969 1970 1971 1972 1973 1974 SAMPLING DATES
FIGURE 7. Mean numbers of invertebrates 1m2 collected in eight transects sampled each quarter from
Seas Branch Creek and their 95% confidence limits.
TABLE 22. Forage fish populations in the two minnow stations above the fish barrier in May 1976.
Species Population Density Biomass Species Estimate* (no./ha) (kg/ha)
*Estimates made using the removal method (Zippin 1958)
ber, five weeks after treatment, was 2,542/m2
• This was not only the lowest density observed during the study but it was also significantly different from the mean density in all other November sampling periods. Mean density improved consistently during the next year surpassing corresponding pre-
treatment levels in May 1973 (seven months after treatment). Mean density throughout the remainder of the study remained greater than in corresponding sampling periods before treatment. Most taxa recovered or surpassed their former abundance within 10-12 months (Table 24). 25
26
TABLE 23. Macroinvertebrate taxa present in Seas Branch Creek.
TRICHOPTERA (caddisflies) Brachycentridae
Brachycentrus * Hydro psychidae
Hydro psyche* Hydroptilidae
Ochrotrichia Li mne philidae
Pycnopsyche Neophylax Limnephilus
Glossosomatidae Glossosoma
Helicopsychidae Helicopsyche
Lepidostomatidae Lepidostoma
Psychomyiidae Psychomyia
Philopotamidae Chimarra
Polycentropodidae Nyctiophylax Poly centro pus
EPHEMEROPTERA (mayflies) Baetidae
Baetis* Heptageniidae
Stenonema* Ephemerellidae
Ephemerella Caenidae
Caenis Leptophlebiidae
Leptophlebia Tricorythidae
Tricorythodes Siphlonuridae
lsonychia
DIPTERA (true flies) Chironomidae* Tipulidae
Antocha * Dicranota Tipula Hexatoma
Ceratopogonidae Stratiomyidae
Euparyphus Ptychopteridae
Ptychoptera Muscidae
Limnophora Empididae Psychodidae
Peri coma Rhagionidae
Atherix Simuliidae
Prosimulium Dolichopodidae Tabanidae
Tabanus Chrysops
*Dominant taxa
PLECOPTERA (stoneflies) Perlodidae
/soper/a
COLEOPTERA (beetles) Elmidae
Optioservus* Dubiraphia
Dytiscidae Agabus
Psephenidae Ectopria
Hydrophilidae Hydrobius
HEMIPTERA (true bugs) Corixidae
Sigara Belostomatidae
Belostoma Gerridae
MEG ALOPTERA ( alderflies) Sialidae
Sialis
ODONATA (dragonflies) Coenagrionidae
Argia
AMPHIPODA (scuds, sideswimmers) Gammaridae
Gammarus* Talitridae
Hyalella
HIRUDINEA (leeches) Erpobdella Glossiphonia
OLIGO CHAETA Tubificidae
NEMATOMORPHA Gordius
TRICLADIDA Plancria
NEMATODA
GASTROPODA (snails) Physa
PELECYPODA (clams) Piscidium
HYDRA CARIN A ( watermites)
DECAPODA (crayfish) Orconectes *
Trichoptera (caddisflies). Caddisflies were the most numerous invertebrates in the stream prior to chemical treatment and were represented by 13 genera within 10 different families (Table 23). Mean density was lowest during May, increased through August and November and peaked in February-March (Fig. 8). Mean density ranged from 882/m' in May 1972 to 3,332/m' in early March 1970.
Hydropsyche sp. and Brachycentrus sp. were the two most important genera of caddis and comprised an average of64% and 32%, respectively, of the trichopterans present in quarterly samples (Appendix, Table 25). Glossosma sp., Helicopsyche sp., and Ochrotrichia sp. were three other commonly occurring genera which, collectively, accounted for most of the remaining population.
Mean densities of Hydro psyche and Brachycentrus increased progressively from seasonal lows in May to seasonal highs in February-March (Fig. 8). Mean density of Helicopsyche was generally lower during the summer sampling periods (May, August) and higher during the winter sampling periods (November, February). Seasonal abundance of Ochrotrichia was just the opposite with mean densities higher during summer and lower during winter. A distinct pattern of abundance was not apparent for Glossosoma (Appendix, Table 26) .
A precipitious decline in the caddisfly population occurred as a result of chemical treatment with little recovery apparent during the first seven months (Fig. 8). In August 1973, ten months after treatment, mean density returned to normal and throughout the remainder of the study was similar to or slightly greater than in corresponding sampling periods before treatment. Mean density ranged from 250/m' in November 1972 to 3,750/m' in November 1973.
Declines in both the Hydropsyche and Brachycentrus populations occurred as a result of the antimycin treatment but the resilience of each genus differed greatly (Fig. 8). Mean density of Hydropsyche was back to normal in August 1973, 10 months after treatment, and reached an all time high three months later in November. Mean densities remained higher throughout the remainder of the study than in corresponding sampling periods before treatment. Mean density of Brachycentrus did not approach pretreatment levels until August and November, 1974, 22 and 25 months after treatment, respectively. Even then, mean densities were below corresponding mean densities before treatment although differences were not significant. Jacobi and Degan (1977) observed
TABLE 24. Chronology of recovery to pretreatment levels of aquatic invertebrates after treatment with antimycin in Seas Branch Creek ( 10-61 ppb/8 hr ).
Total Invertebrate Density Invertebrate Taxa Trichoptera: Hydropsyche sp.
*Sampling procedures and/or apparatus were not designed to effectively sample this taxon.\Consequently, results are negatively biased.
similar reactions of Hydropsyche and Brachycentrus in Seas Branch Creek but a five month pretreatment study period prevented quantitative delineation of the complete recovery period.
Populations of Glossosoma, Helicopsyche, and Ochrotrichia also declined following chemical treatment (Appendix, Table 26). Mean densities of Glossosoma and Helicopsyche returned to pretreatment levels in May 1973, seven months after treatment, and remained similar to or slightly greater than their respective mean densities in corresponding sampling periods before treatment. Ochrotrichia were still below their pretreatment population densities in May 1973. However, in August they were the most abundant caddis in the benthos with a mean density more than 25 times greater than at any time before treatment. Their prominence was shortlived though as mean densities throughout the remainder of the study were similar to their respective mean densities in corresponding sampling periods before treatment.
Diptera (true flies). Dipterans were second in abundance to caddisflies in Seas Branch Creek before treatment, with 12 families and 12 genera being represented (Table 23). A consistent seasonal pattern of abundance was not evident and there were no significant differences in mean densities
between sampling periods. Mean density ranged from 882/m2 in February 1972 to 1,832/m2 in early March 1970 (Fig. 8).
Chironomidae (midges) and Tipulidae (cranefly) were the most important families, comprising an average of 49% and 48%, respectively, of the dipterans present in quarterly samples (Appepdix, Table 27). The only consistent trend in the mean density of chironomids was a seasonal low in November (Fig. 8). A consistently high mean density of tipulids occurred in November while a consistently low mean density occurred in May. Four genera of tipulids were identified but Antocha sp. was the dominant genus and will be considered synonymously with the Family.
Dipterans became the most abundant invertebrates in the streams following chemical treatment and as a whole exhibited little, if any, adverse affects. Mean density in November 1972, five weeks after treatment was the second lowest recorded during the study and the lowest recorded following treatment (Fig. 8) . However, it was not significantly different from the mean density in any of the sampling periods before treatment. Mean densities in February and May 1973 and in August 1974 were greater than mean densities in all sampling periods before treatment and were signficantly differ-
ent from them in from one to eight of the nine sampling periods. Mean density ranged from 880/m2 in November 1972 to 3,650/m2 in May 1973.
The chironomid population showed no adverse affects following chemical treatment but began to increase, iilling niches vacated by less tolerate invetebrates. Mean density in November 1972, five weeks after treatment, was slightly greater than in the preceding August sampling period and substantially greater than the mean density in both of the two previous November sampling periods (Fig. 8). Mean densities in February and May 1973 were greater than in all sampling periods before treatment and in most instances were significantly different. Densities returned to more "normal" levels in August, 10 months after treatment, but remained generally higher than before treatment throughout the remainder of the study. Jacobi and Degan (1977) observed a sharp peak in the biomass of chironomids in Seas Branch Creek in December 1973, followed by subsequent peaks in May 1973 and 1974.
In contrast to the positive response by the chironomids, a marked decline occurred in the tipulid (i.e., Antocha) population as a result of chemical treatment (Fig. 8). Mean densities in November 1972 and February and August 1973 were less than and signifi- 27
4
3
"' 2! ~ ~ 'E 2 ' "' w
"' ::;; :::> :z :z <! w ::;;
4
3
~ 2
"' w
"' ::;; :::> :z :z <! w ::;;
TRICHOPTERA
U CHEMICAL TREATMENT
AUG NOV MAR MAY AUG NOV FEB MAY AUG NOV FEB MAY AUG NOV FEB MAY AUG NOV
1969 1970 1971 1972 1973 1974
SAMPLING DATES
DIPTERA
AUG NOV MAR MAY AUG NOV FEB MAY AUG NOV FEB MAY AUG NOV FEB MAY AUG NOV
1969 1970 1971 1972 1973 1974
SAMPLING DATES
4 TRICHOPTERA
- Hydropsychidae (Hydro psyche sp.)
--- Brachycentridae (Brachcentrus sp.)
3
"' "0
" ~ " ~
NE 2 ' "' w "' ::;; :::> :z :z <! w ::;;
AUG NOV MAR MAY AUG NOV FEB MAY AUG NOV FEB MAY AUG NOV FEB MAY AUG NOV
1969 1970 1971 1972 1973 1974
SAMPLING DATES
4 DIPTERA
-- Chironomidae --- Tipulidae
3
N
~ 2
"' w
"' :::; ::> :z :z <! w :::;
\ I \ I
\!
I I
I I
I I
I I
I
'\---0~~~--~~--r-~~~~~--~--r-~~~~
AUG NOV MAR MAY AUG NOV FEB MAY AUG NOV FEB MAY AUG NOV FEB MAY AUG NOV
o~~w=~~~~~~~~-f~~~--~~~,~/~--~~-----~/-AuG NOV MAR MAY AUG NOV FEB MAY AUG NOV FEB MAY AUG NOV FEB MAY AUG NOV AUG NOV MAR MAY AUG NOV FEB MAY AUG NOV FEB MAY AUG NOV FEB MAY AUG NOV
FIGURE 8. Mean density of invertebrates collected t in quarterly benthos samples in the study zone of Seas Branch Creek. ~
cantly different from mean densities in all previous and subsequent corresponding sampling periods. Not until August and November 1974, 22 and 25 months after treatment, respectively, did the mean density of tipulids equal
or exceed their mean density in corresponding sampling periods before treatment. After two years, Jacobi and Degan (1977) did not observe full recovery of Antocha at their sampling sites on Seas Branch Creek.
SAMPLING DATE
Simulidae (blackflies) were represented by Prosimulium sp. and comprised an average of only 0.4 <:[. of the dipterans present in Seas Branch Creek before treatment (Appendix, Table 27). After treatment Prosimu- 29
30
lium comprised an average of 4% of the dipterans, thus realizing a 10-fold increase. Mention of this minor taxa of diptera is made because of its positive response following treatment rather than for its importance in the benthos. No seasonal pattern of abundance was apparent either before or after treatment.
Coleoptera (beetles). Four families and five genera of aquatic and semi-aquatic beetles were identified in the benthos of Seas Branch Creek (Table 23). Most coleopterans were either larvae or adults of Optioservus sp., however, and Coleoptera will be considered synonymously with this genus.
Beetles were the third most abundant invertebrates in the stream before treatment with mean densities ranging from 293/m' in August 1969 to 1,811/ m' in August 1971. A consistent seasonal trend in abundance was not evident (Fig. 8). Relatively low mean densities recorded in 1969-1970 may have resulted from sampling error. Optioservids preferred small fissures and other indentations on rocky surfaces and a more diligent effort was made to sample them from these areas beginning in 1971.
Chemical treatment had no adverse affects on the coleopteran community, rather, the population burgeoned within 10 and 13 months (Fig. 8). A consistent seasonal trend in abundance became evident with low densities occurring in May and high densities fluctuating between the November and February sampling periods. From November 1973 to the end of the study mean densities were greater than in all corresponding sampling periods before treatment. Mean densities throughout this period were significantly different from the mean densities in at least one of the corresponding sampling periods before treatment. Mean density ranged from 479/m' in May 1973 to 3,714/m' in November 1973.
Ephemeroptera (mayflies). Mayflies ranked fourth in abundance before treatment with seven families each being represented by a single genus (Table 23). Maximum densities of from 400 to 500/m' occurred in the February-early March sampling periods while generally less than 100/m' were present during other sampling periods (Fig. 8).
Baetidae-Baetis sp. and Heptagennidae-Stenonema sp. were the two most important genera, comprising 76% and 23%, respectively, of the mayflies collected before treatment (Appendix, Table 28). Mean density of Baetis peaked in February-early March and was much lower and rela-
tively constant during the other sampling periods (Fig. 8). Mean density of Stenonema tended to be higher in November and February and lower in May and August, although the pattern was very weak.
An immediate decline in the mayfly population occurred as a result of the chemical treatment but recovery occurred within four to seven months followed by a general increase (Fig. 8). Mean density beginning seven months after treatment and continuing throughout the remainder of the study was higher than in all corresponding sampling periods before treatment. In most cases, the corresponding mean densities were significantly different.
Initially, both Bae tis and Stenonema were adversely affected by the antimycin (Fig. 8). Baetids were absent three weeks after treatment and mean density was below normal February 1973, four months after treatment. Beginning in May, however, and continuing throughout the remainder of the study, mean densities were greater than in all corresponding sampling periods before treatment. In most instances, corresponding mean densities were significantly different. The baetid population peaked 15 months after treatment at three to four times its pretreatment density.
Mean density of Stenonema also declined during the first three weeks after treatment but was similar to pretreatment levels within four to seven months (Fig. 8). Beginning in August 1973, 10 months after treatment, and continuing throughout the remainder of the study mean densities were higher than in all corresponding sampling periods before treatment. Again, mean densities in most corresponding sampling periods were significantly different. Peak densities occurred one year after treatment.
Amphipoda (scuds, sideswimmers, freshwater shrimp). Two families of Amphipoda, each represented by one genus, were identified in Seas Branch Creek (Table 23). Gammaridae:Gammarus sp. was by far the most important genus and will be considered synonymously with the Order.
Prior to chemical treatment, Gammarus comprised from 1% to 5% of the stream benthos arid mean densities ranged from 18/m' to 254/m' (Fig. 8). Highest densities were generally in the August sampling periods with no definite pattern of population lows.
The Gammarus population declined abruptly following chemical treatment. During the first 10 months, mean densities were below mean densities in all corresponding sampling peri-
ods before treatment as well as in subsequent sampling periods after treatment (Fig. 8). Mean densities in all corresponding sampling periods were significantly different. A year after chemical treatment the population began to recover and by August and November 1974, 22 months and 25 months after treatment, respectively, mean densities were higher than in all corresponding sampling periods before treatment. Mean densities in most corresponding sampling periods were significantly different. Mean density of Gammarus ranged from 0/m' to 368/ m' during the post treatment phase.
Aquatic vegetation, primarily water buttercup (Ranunculus aquatilis), increased from a maximum of 15% streambed coverage before treatment to 50% coverage in Seas Branch Creek in 1973 (Jacobi and Degan 1977). These investigators found a greater biomass of Gammarus present in the summer of 1973 than in the summer of 1972 before treatment and attributed it to the increase in vegetation which provided more surface area for colonization. In 1973 I also observed much greater densities of Gammarus in vegetated areas than in non vegetated areas. Large mats of vegetation were purposely avoided, however, when collecting benthos samples in this study. Consequently, the recovery of Gammarus probably occurred much sooner and was likewise more dramatic than indicated.
Miscellaneous Taxa. Responses to chemical treatment of some of the minor taxa of invertebrates were also evident in Seas Branch Creek (Fig. 8). Plecoptera-Isoperla sp. disappeared during the first four months after treatment, but beginning in August 1973 and continuing throughout November 1974 equalled or exceeded their pretreatment densities. Hirudinea, Gastropoda, and Decapoda showed little initial response to treatment but all three taxa increased in abundance between 10 and 13 months after treatment. The Hirudinea population showed the greatest increase and remained above pretreatment densities through the remainder of the twoyear, post-treatment study. Qualitative observation during the spring, summer, and fall electrofishing surveys indicated a much larger increase in . decapod or crayfish (Orconectes propinquus) population than was quantitatively documented. Sampling techniques used in this study were not designed to capture such highly mobile invertebrates.
-- - ---------------------"
MANAGEMENT CONSIDERATIONS Intensive single species manage
ment deliberately reduces ecological fish diversity. The potential reduction of such diversity must, therefore, be carefully considered in each proposed chemical treatment application since it is conceivable that other fish species (i.e., threatened or endangered) may take precedence over "monoculture management" for trout. A complete list of the fish species present in the watershed to be treated should preface any serious consideration of removing a fish community with chemical toxicants.
The present study provides quantitative evidence that chemical treatment can effectively remove the forage fish population from a trout stream. Benefits derived from such treatment projects are, however, largely dependent upon (1) the installation of an effective fish barrier to deter reinvasion of forage fishes; (2) the food supply available to the resident trout; (3) the amount of permanent cover for trout available in the treated stream.
The culvert-type fish barrier used on Seas Branch Creek was effective and is recommended for use to prevent upstream migration of fishes in chemically treated streams. The forage fish population above the barrier was relatively insignificant 3.5 years after treatment. while the population den-
SUMMARY (l) Domesticated brown trout dis
tributed themselves in accordance to the available habitat (i.e., instream cover) in Seas Branch Creek before and after chemical treatment with antimycin.
(2) Survival of wild, resident brown trout was significantly better than that of stocked similar aged domesticated trout, larger in size but introduced at much greater densities.
(3) Removal of forage fishes did not appreciably improve overwinter survival of domesticated brown trout. An
sity and biomass below the barrier returned in two years to 90% and 55%, respectively, of their average pretreatment levels.
Although initially most invertebrate taxa were adversely affected by the antimycin treatment, most taxa recovered or surpassed their former abundance within 10-12 months. Thus, even though antimycin concentrations were 3-6 times greater than normally used in field applications no irrevocable damage resulted. This should not be interpreted as a justification for the use of such high concentrations. A minimum concentration of 10 ppb for six hours appears to be satisfactory for forage fish control without inflicting long-term adverse affects upon the invertebrate community.
In addition to smaller aquatic and terrestrial insects, large individual food items (fish and crayfish) were important in the diet of brown trout. The frequency of crayfish in trout stomachs doubled following removal of forage fishes with antimycin and further emphasized the importance of large food items in the diet. Reintroduction of a forage fish species in streams lacking crayfish is recommended to sustain rapid growth of larger brown trout (greater than 10 inches), in chemically treated streams. An acceptable forage fish species to reintroduce should sat-
increase in overwinter survival did occur after treatment in conjunction with a 50% reduction in stocking density. Poor trout habitat (low carrying capacity) was generally responsible for low overwinter survival of 30-35 C:0.
(4) Growth of domesticated brown trout was 19C:O greater in length and 53% greater in weight during the first year after treatment. During the second year, growth was 10'.0 greater in length and 22% greater in weight than before treatment. Greater harvest during the second year and the possibility
isfy the following criteria: (1) an abundant species; (2) a maximum size of less than 10 em; (3) no problem to trout anglers; (4) commonly utilized by brown trout for food. If crayfish had been absent in Seas Branch Creek, an example of such a species would have been the fantail darter. This was the most abundant fish in the stream and comprised the majority of fish eaten by the resident trout.
Overwinter survival and the ultimate carrying capacity of a trout stream is related to the amount of year around instream cover available for the trout. Instream cover was essentially nil in Seas Branch Creek and the percent overwinter survival of fall fingerlings stocked was in the low 30's before treatment. Nonetheless, it was. hypothesized that removal of forage fishes, particularly the white suckers and chubs sharing the deeper pools and runs with trout, would increase overwinter survival in response to the increase in "available" habitat or space. This did not occur and the potential increase in production made possible by the increase in available food resources following treatment was not totally realized. In streams similar to Seas Branch Creek consideration should be given to providing additional instream cover in conjunction with or before removal of forage fishes.
that faster-growing individuals in a population are harvested first are the most plausible explanations of slowed growth during the second year. Trout growth was better in the lower half of the study zone before treatment and in the upper half of the study zone after treatment. The growth of trout in both sections of stream was significantly faster after treatment than in either section of stream before treatment.
(5) Maximum biomass of trout was 72 kg/ha before treatment and 109 kg/ ha after treatment. Average standing 31
32
crop increased 43% following treatment. Accumulated production of trout flesh increased 49% after treatment. Increases in the standing stock and production following treatment were primarily due to more rapid growth, a decline in angler harvest the first year, and better overwinter survival of the second cohort of fall stocked fingerlings (age 0). ·
(6) During the two fishing seasons prior to chemical treatment anglers harvested 22% of the initial cohort of age 0 brown trout stocked in the fall. After two years less than 1 % of this cohort remained. Angler harvest of a second cohort of fingerling trout, stocked one year before treatment, was 16% and 5% of the cohort remained. During the first two fishing seasons following treatment anglers harvested 9% of an initial cohort of fall fingerlings corresponding to the initial cohort stocked before treatment. Two percent of this cohort remained after two years. Angler harvest of the second cohort of fall fingerlings was 22% during one fishing season; 10% of the cohort remained after one year. Total angler exploitation during the two years following chemical treatment was therefore less than in the two years before treatment.
(7) In general, the sport fishery declined during the two years following treatment. The number of fishing trips and total fishing pressure increased 20% and 6%, respectively, but total harvest declined 36% while catch ratio declined by an average of 0.3 trout/hr. The fishery was extremely localized with 70% of the anglers living within a 10-mile radius of the stream both before and after treatment. The absence of large trout during the first year after treatment discouraged many fishermen and was primarily responsible for the overall decline in the sport fishery.
(8) The diet of the domesticated brown trout changed significantly fol-
lowing treatment. The number of invertebrate orders represented in at least 30% of the trout stomachs before treatment doubled following treatment. Aquatic insects were the primary food items but terrestrial coleopterans (Carabidae) were also important both before and after treatment. Fish and crayfish were important before treatment because of their large individual size. The percent frequency of occurrence of crayfish in trout stomachs doubled in response to the removal of forage fishes.
(9) Twenty-one forage fish species were identified in Seas Branch Creek. Before treatment, fantail darter, white sucker, central stoneroller, and blacknose dace were the most important species both numerically and in terms of biomass. Maximum population density and biomass was 347,000/ha and 1,445 kg/ha, respectively. Following treatment with antimycin in October 1972 the central stoneroller was the first species to reinvade the lower half of stream below the fish barrier. One year after treatment all forage fish species originally present had returned to the half of the study zone. Forage fish then equalled 71% of their average fall density before treatment and 49% of their average fall biomass. Above the fish barrier only an insignificant population of brook stickleback was present. Two years after treatment the forage fish population below the fish barrier was equivalent to 67% of the average fall density and 66% of the average fall biomass before treatment. The dominant species present before treatment were again dominant with the addition of the creek chub. Above the fish barrier five forage fishes comprised a population equal to 22% of the average fall density and 5% of the average fall biomass before treatment. Three of these species gained access when the fish barrier was inoperational for three days in March, 197 4. After 3.5 years, forage fish populations in Sec-
tionA were equivalent to 14% of their average density and 5% of their average biomass before treatment.
(10) The dominant invertebrates in the benthos of Seas Branch Creek were Trichoptera (caddisfly) -Hydropsyche sp. and Brachycentrus sp.; DipteraChironomidae (midges) and Antocha sp. (cranefly); Coleoptera-Optioservus sp. (riffle beetle); Ephemeroptera (mayfly) -Baetis sp. and Stenonema sp.; and Amphipoda-Gammarus sp. (scud).
(11) Chemical treatment with antimycin adversely affected the benthic population, initially. Total mean density recovered within seven months, however, and exceeded pretreatment densities throughout the remainder of the study. Effects of the antimycin upon individual taxa varied widely. Optioservus and Chironomidae showed little effect and were at normal densities 1.5 months after treatment. Baetis recovered fully in seven months while Hydropsyche and Stenonema recovered in 10 months. Gammarus recovered in 13 months but Antocha did not recover until after 22 months. Brachycentrus was the slowwest taxa to recover and was just approaching their pretreatment densities 25 months after treatment at the termination of the study. Mean densities of all but the latter two taxa exceeded their mean densities before treatment. No invertebrate taxon was eliminated by the antimycin.
(12) chemical removal of forage fishes is an effective management tool only when used in conjunction with an effective fish barrier similar to the one used in this study. The greater the productivity of the stream, i.e., food supplies, and the better the trout habitat, the greater the expected gains. Where threatened or endangered species are involved, or instream cover is lacking, alternative management procedures such as habitat improvement should take precedence.
APPENDIX
TABLE 25. Total numbers of the major genera of Trichoptera collected from Seas Branch Creek during each sampling period, 1969 through 1974.
Date Hydro psyche Brachycentrus Glossosoma Helicopsyche Ochrotrichia Misc. Totals
Nov 1972 567 106 13 28 14 728 Feb 1973 417 46 103 126 208 900 May 1973 637 1 64 19 1 20 742 Aug 1973 1,859 102 5 16 4,935 48 6,965 Nov 1973 7,505 558 73 254 24 319 8,733 Feb 1974 6,521 641 166 480 9 431 8,248 May 1974 2,530 2 88 52 211 72 2,955 Aug 1974 3,163 1,938 98 15 312 166 5,692 Nov 1974 6,307 1,618 405 188 5 180 8,703
TABLE 26. Derived mean no/m2 of the 5 most abundant families of caddisflies before and after chemical treatment.
Hydropsychidae Brachycentridae Glossosomatidae Helicopsychi~ae Hydroptilidae Date Mean No/m2 Mean No/m2 Mean No/m2 Mean No/m Mean No/m2
Aug 1969 611 229 Nov 1969 1,714 411 Were Not Distinguished Mar 1970 2,600 507 May 1970 750 32 0 ~4 57 Aug 1971 1,089 646 11 ~4 4 Nov 1971 1,543 811 7 14 0 Feb 1972 1,361 1,036 21 36 0 May 1972 793 ~4 7 4 18 Aug 1972 925 132 4 4 ~
CHEMICAL TREATMENT
Nov 1972 196 18 0 Feb 1973 171 11 11 18 0 May 1973 239 ~4 7 4 ~ Aug 1973 646 21 ~4 4 1,464 Nov 1973 3,136 114 14 46 7 Feb 1974 2,832 125 29 75 ~4 May 1974 811 ~4 14 11 54 Aug 1974 1,079 246 11 4 64 Nov 1974 2,061 289 29 25 ~
33
TABLE 27. Total numbers of the major families of Diptera collected from Seas Branch Creek during each sampling period, 1969 through 197 4.
Date Chironomidae Tipulidae Simulidae Misc. Totals
Aug 1969 1,615 950 2 443 3,010 Nov 1969 460 2,537 2 24 3,023 Mar 1970 3,596 2,233 105 5,934 May 1970 1,996 1,380 16 65 3,457 Aug 1971 2,034 1,361 15 41 3,451 Nov 1971 838 2,524 3 29 3,394 Feb 1972 1,310 1,614 68 42 3,034 May 1972 2,684 1,086 7 28 3,805 Aug 1972 2,442 1,965 2 13 4,422
Chemical Treatment Oct 3-5, 1972
Nov 1972 2,109 127 5 2,241 Feb 1973 5,462 211 444 24 6,141 May 1973 8,781 504 461 254 10,000 Aug 1973 2,831 508 229 81 3,649 Nov 1973 2,735 2,097 221 50 5,103 Feb 1974 1,817 1,676 323 61 3,877 May 1974 5,008 454 6 115 5,583 Aug 1974 3,758 2,631 314 65 6,768 Nov 1974 2,655 4,596 37 46 7,334
TABLE 28. Total numbers of the major families of Ephemeroptera collected from Seas Branch Creek during each sampling period, 1969 through 1974.
Date Baetidae Heptageniidae Misc. Totals
Aug 1969 151 8 1 160 Nov 1969 82 109 5 196 Mar 1970 1,599 75 36 1,710 May 1970 304 100 9 413 Aug 1971 270 45 1 316 Nov 1971 97 106 203 Feb 1972 ,1,481 85 1,566 May 1972 83 40 1 124 Aug 1972 167 30 197
Chemical Treatment Oct 3·5, 1972
Nov 1972 12 12 Feb 1973 13 59 1 73 May 1973 253 50 8 311 Aug 1973 1,839 168 7 2,014 Nov 1973 784 974 12 1,770 Feb 1974 5,282 814 42 6,138 May 1974 1,997 466 49 2,512 Aug 1974 1,666 304 11 1,981 Nov 1974 250 926 39 1,215
34
LITERATURE CITED ADAMS, L.
1951. Confidence limits for the Peterson or Lincoln index used in animal population studies. J. Wild!. Manage. 15: 13-19.
BOHLIN, T. 1977. Habitat selection and intercohort
competition of juvenile sea-trout (Salmo trutta). Oikos 29: 112-117.
BRYNILDSON, 0. M. AND J. J. KEMPINGER
1973. Production, food and harvest of trout in Nebish Lake, Wisconsin. Wis. Dept. Nat. Resour., Madison, Tech. Bull. No. 65, 20 p.
ELLIOTT, J. M. 1971. Some methods for the statistical
analysis of samples of benthic in-
2500-3J90041-79
vertebrates. Freshwater Bioi. Assoc. Sci. Pub!. No. 25. 148 p.
HuBBS, CARL L AND KARL F. LAGLER
1958. Fishes of the Great Lakes region. Univ. Michigan Press, Ann Arbor. 213 p.
JACOBI, G. z. AND D. J. DEGAN
1977. Aquatic macroinvertebrates in a small Wisconsin trout stream before, during, and two years after treatment with the fish toxicant antimycin. U. S. Fish. and Wild!. Serv.-Fish Control Lab., LaCrosse, Wis. Invest. in Fish Control Rep. No. 81. 24 p.
KLINGBIEL, J. H. 1975. Use of fish toxicants in Wisconsin,
1961. Determination of fishing pressure from fishermen or party counts with a discussion of sampling problems. Proc. 15th Ann. Conf. Southeastern Game and Fish Comm., pp. 380-401.
RICKER, w. E.
1958. Handbook of computations for biological statistics of fish populations. Fish. Res. Bd. Can. Bull. No. 119. 300 p.
WISCONSIN DEPARTMENT OF NATURAL
RESOURCES
1978. Wisconsin trout streams, Madison. (in press).
35
ACKNOWLEDGMENTS
Special appreciation to Robert Hunt, Cold Water Group Leader, for his supervisory support, encouragement, and guidance as well as assistance in the field and to Robert Carline, fellow biologist in the Cold Water Group, for his counsel and assistance during the study. Of equal significance is my appreciation to Kent Niermeyer and Harrison Sheldon, technicians in the Cold Water Group, who faithfully assisted in all phases of field work, equipment design and maintenance, and much preliminary processing of field data.
I am grateful also to many DNR fishery personnel within the West Central District. I note in particular Elmer Simonson (Operations Coordinator) and Wayne Calhoun (Field Foreman) who twice responded with quick and efficient repairs to the fish barrier following serious "wash-outs", and Willis Fernholz (Supervisor, Mississippi River Work Unit) for his counsel and use of a field crew during actual chemical treatment.
Special expertise in technology and planning of the antimycin treatment was contributed by Philip Gilderhaus, biologist with the Fish Control La bora-
tory, U.S. Fish and Wildlife Service, LaCrosse, Wisconsin. Verification of aquatic invertebrates was provided by William Hilsenhoff, Associate Professor, Department of Entomology, University of Wisconsin-Madison. . Expertise contributed by fellow
DNR employees included statistical consultation from Donald Thompson, chemical analyses of water samples by James Weckmuller, supervisory support and editing by Lyle Christenson, and essential typing assistance by Connie Bendorf.
Lastly, I would like to extend my thanks to the Westby Rod and Gun Club who allowed me to use their facilities adjacent to the stream as headquarters during field phases of the study and to riparian landowners who allowed me and my field crews access across their private lands to reach the stream.
This research was supported in part by funds provided by the Federal Aid in Fish Restoration Act, under DingeliJohnson Project F -83.R.
Production Credits
Ruth L. Hine, Editor Sheryl S. Smith, Copy Editor Richard G. Burton, Graphic Artist
About The Author
Eddie L. Avery holds a B.S. from Kansas State University and a M.S. from Montana State University. He has been a research biologist for the Wisconsin Department of Natural Resources since 1969 and has worked on a variety of problems dealing with both wild and domesticated salmonids in inland waters of Wisconsin as well as anadromous salmonids in tributaries of Lake Michigan.
TECHNICAL BULLETINS ( 1973-78) *
No. 61 Overwinter drawdown: Impact on the aquatic vegetation in Murphy Flowage, Wisconsin. (1973) Thomas D. Beard
No. 63 Drain oil disposal in Wisconsin. (1973) Ronald 0. Ostrander and Stanton J. Kleinert
No. 64 The prairie chicken in Wisconsin. (1973) Frederick and Frances Hamerstrom
No. 65 Production, food and harvest of trout in Nebish Lake, Wisconsin. (1973) Oscar M. Brynildson and James J. Kempinger
No. 66 Dilutional pumping at Snake Lake, Wisconsin- a potential renewal technique for small eutrophic lakes. (1973) Stephen M. Born, Thomas L. Wirth, James 0. Peterson, J. Peter Wall and David A. Stephenson
No. 67 Lake sturgeon managtlment on the Menominee River. (1973) Gordon R. Priegel
No. 68 Breeding duck populations and habitat in Wisconsin. (1973) James R. March, Gerald F. Martz and Richard A. Hunt
No. 69 An experimental introduction of coho salmon into a landlocked lake in northern Wisconsin. (1973) Eddie L. Avery
No. 70 Gray partridge ecology in southeast-central Wisconsin. (1973) John M. Gates
No. 71 Restoring the recreational potential of small impoundments: the Marion Millpond experience. (1973) Stephen M. Born, Thomas L. Wirth, Edmund 0. Brick and James 0. Peterson
No. 72 Mortality of rado-tagged pheasants on the Waterloo Wildlife Area. (1973) Robert T. Dumke and Charles M. Pils
No. 73 Electro fishing boats: Improved designs and operating guidelines to increase the effectiveness of boom shockers. (1973) Donald W. Novotny and Gordon R. Priegel
No. 75 Surveys of lake rehabilitation techniques and experiences. (1974) Russell Dunst et all.
No. 76 Seasonal movement, winter habitat use, and population distribution of an east central Wisconsin pheasant population. (1974) John M. Gates and James B. Hale
No. 78 Hydrogeologic evaluation of solid waste disposal in south central Wisconsin. (1974) Alexander Zaporozec
No. 79 Effects of stocking northern pike in Murphy Flowage. (1974) Howard E. Snow
No. 80 Impact of state land ownership on local economy in Wisconsin. (1974) Melville H. Cohee
No. 81 In1luence of organic pollution on the density and production of trout in a Wisconsin stream. (1975) Oscar M. Brynildson and John W. Mason
No. 82 Annual production by brook trout in Lawrence Creek during eleven successive years. (1974) Robert L. Hunt
No. 83 Lake sturgeon harvest, growth, and recruitment in Lake Winnebago, Wisconsin (1975) Gordon R. Priegel and Thomas L. Wirth
No. 84 Estimate of abundance, harvest, and exploitation of the fish population of Escanaba Lake, Wisconsin, 1946-69. (1975) James J. Kempinger, Warren S. Churchill, Gordon R. Priegel, and Lyle M. Christenoon
No. 85 Reproduction of an east central Wisconsin pheasant population. (1975) John M. Gates and James B. Hale
No. 86 Characteristics of a northern pike spawning population. (1975) Gordon R. Priegel and David C. Krohn
No. 87 Aeration as a lake management technique. (1975) S. A. Smith, D. R. Knauer and T. L. Wirth
No. 90 The presettlement vegetation of Columbia County in the 1830's (1976) William Tans
No. 91 Wisconsin's participation in the river basin commissions. (1975) Rahim Oghalai and Mary Mullen
No. 93 Population and biomass estimates of fishes in Lake Wingra. (1976) Wa.rren S. Churchill
No. 94 Cattail-the significance ofits growth, phenology, and carbohydrate storage to its control and management. (1976) Arlyn F. Linde, Thomas Janisch, and Dale Smith
No. 95 Recreational use of small streams in Wisconsin. (1976) Richard A. Kalnicky
No. 96 Northern pike production in managed spawning and rearing marshes. (1977) Don M. Fago
No. 97 Water quality effects of potentiaa urban best management practices; a literature review. (1977) Gary L. Oberts
No. 98 Effects of hydraulic dredging on the ecology of native trout populations in Wisconsin spring ponds. (1977) Robert F. Carline and Oscar M. Brynildson
No. 99 Effects of destratification and aeration of a lake on the distribution of planktonic crustacea, yellow perch, and trout. (1977) Oscar M. Brynildson and Steven L. Serns
No. 100 Use of arthropods to evaluate water quality of streams. (1977) William L. Hilsenhoff
No. 101 Impact upon local property taxes of acquisition within the St. Croix River State Forest in Burnett and Poll: Counties. (1977) Monroe H. Rosner
No. 102 Scientific Areas in Wisconsin. (1977) Clifford E. Germain, William E. Tans, and Robert H. Read
No. 103 A 15-year study of the harvest, exploitation, and mortality of fishes in Murphy Flowage, Wisconsin. (1978) Howard E. Snow
No. 104 Changes in population density, growth and harvest of northern pike in Escanaba Lake after implementation of a 22-incb size limit. (1978) James J. Kempinger and Robert F. Carline
No. 105 Population dynamics, predator-prey relationships, and management. of the red fox in Wisconsin. (1978) Charles M. Pils and Mark A. Martin
*Complete list of all technical bulletins in the series, and loan copies of out-of-print numbers, are available £rom Mrs. Sandra Farr, Bureau of Research, Department of Natural Resources, Box 7921, Madison, WI 53707 (608) 266-7012.