Page 1
19
Jurnal Akuntansi Trisakti ISSN : 2339-0832 (Online)
Volume. 6 Nomor. 1 Februari 2019:19-30
Doi : http://dx.doi.org/10.25105/jat.v6i1.4869
THE INFLUENCE OF CORPORATE GOVERNANCE, COMPANY
SIZE, AND LEVERAGE TOWARD EARNING MANAGEMENT
Mayasari1*
Ayu Yuliandini2
Intan Indah Permatasari2
123Faculty of Economic and Business Universitas Trisakti
*Correspondence: [email protected]
Abstract
The purpose of this study is to examine the influence of GCG variables, firm
size, and leverage on earnings management.
The sample used is 35 public listed property and real estate companies in the
Indonesia Stock Exchange (IDX) from 2015 until 2017. The sampling technique uses
purposive sampling. This study uses multiple regression.
The results of the analysis showed that managerial ownership does not have a
negative effect on earnings management but oppositely, it has a positive effect on
earnings management, while company size does not have any effect on earning
management.
Keywords: Corporate governance, company size, leverage, dan earning management
Submission date: 2019-07-17 Accepted date: 2019-08-14
INTRODUCTION
Earnings management is a condition where the management intervenes in the
process of preparing a financial report for stakeholders so that it can flatten, raise, and
lower earnings. Thus, the financial report received by investors or shareholders of the
company or external companies sometimes is not the same as happened. In other word,
the financial statements have been manipulated by management for the sake of
unilateral interests. If this happens, the external parties will suffer losses as well as the
owner of the company.
Corporate governance is one way to control opportunistic actions taken by
management. There are five principles in Good Corporate Governance/GCG
(transparency, accountability, responsibility, independence, and fairness) are created to
protect the interests of all stakeholders (FCGI & ADB, 2001). The implementation of
Corporate Governance concept is expected to raise oversight and transparency in a
Page 2
20 The Influence of Corporate Governance, Company Size______________________
company, so that Corporate Governance acts as a factor, which influences the behavior
of management as mention by (Watts, 2003) which stated the implementation of
Corporate Governance as one of the ways to monitor contract issues and reduce the
management’s opportunistic behavior. The practice of earnings management has been
indicated to arise as an impact on agency problems or agency theory. Agency theory
occurs because of the conflict of interests between company owners and management
(Jensen & Meckling, 1976). The agency problems, motivated principals, enter into
contracts to maximize interests for their welfare by increasing profits. Because of
agency problem, principals are motivated to maximize their welfare by entering into
contract by increasing the company’s earnings, while agents are motivated to maximize
the fulfillment of their economic and psychological needs in terms of obtaining
investments, loans, or compensation contracts. Leverage is one effort to increase
company profits. Companies that have high financial leverage due to the size of debt or
liabilities compared to assets owned by the company, it is suspected that earnings
management is caused by the company being threatened by default, which means that
the company cannot fulfill its debt repayment obligations on time (Shanti & Yudhanti,
2007).
From several studies on the influence of corporate governance, company size,
and leverage on earnings management found differences in research results. Corporate
governance factors include institutional ownership, management ownership, as well as
the size of the board of commissioners and leverage. Also, the results of these studies
are still less convincing or less consistent, which can be seen from the research by
(Veno & Sasongko, 2016) stated that committees audit and managerial ownership
influence earnings management. Similarly, research conducted by (Jao & Pagalung,
2011), which states that managerial ownership and institutional ownership and audit
committees have an influence on earnings management, but leverage does not affect.
Another thing with ownership management, the audit committee does not affect
earnings management, but leverage affects earnings management.
An agency relationship is defined as one in which one or more persons (the
principals) engages another person (the agent) to perform some service on their behalf
which involves delegating some decision-making authority to the agent Jensen and
Meckling, 1976 (Ross, 1973). The cornerstone of agency theory is the assumption that
the interests of principles and agents diverge. According to agency theory, the principal
can limit divergence from hislher interests by establishing appropriate incentives for the
agent, and by incur- ring monitoring costs designed to limit opportunistic action by the
agent. Further, it may pay the agent to spend resources (bonding costs) to guarantee that
he/she will not take certain actions that would harm the principal, or to ensure that the
principal will be appropriately compensated if helshe does take such action. That is, the
agent may incur ex-ante bonding costs in order to win the right to manage the resources
of the principal. Despite these devices, it is recognized that some divergence between
the agent’s actions and the principal’s interests may remain. Insofar as this divergence
reduces the principals’s welfare, it can be viewed as a residual loss.
LITERATURE REVIEW
The earnings management, according to (Setiawati & Na’im, 2000), is a
management intervention in the external financial reporting process to benefit itself.
Whereas according to (Wedari, 2004) earnings management is earnings manipulation
Page 3
______________________________Mayasari/Ayu Yuliandini/Intan Indah Permataari 21
carried out by management to achieve certain goals. This manipulation is done so that
profits look as expected, other than that it aims to keep investors interested in the
company.
(Jones, 1991) identified earnings management by measuring discretionary
accruals. He stated that issuers conduct earnings management with an income
increasing pattern that will have positive discretionary accruals and if discretionary
accruals are negative for protection import from the government.
Managerial ownership is the separation of ownership between the outsider and
the insider, if a company has many shareholders, then the large group of individuals is
unable to participate actively in the daily management of the company (Bodie & Alan,
2006). (Melinda & Sutejo, 2008) measures managerial ownership by the number of
company shares owned by managers and commissioners. (Lamora, Vince, & Kamaliah,
2014) stated that with the ownership of shares held by managers, managers would act
in harmony with the interests of shareholders to minimize the opportunistic behavior of
managers. Management ownership can be measured by using a ratio scale that is by the
percentage of shares held by the management of all outstanding company stock capital
(Guna & Herawaty Arleen, 2000).
Hypothesis Development
Management ownership decreases, the incentives for the possibility of the
opportunistic behavior of managers will increase (Jao & Pagalung, 2011). With regard
to the effects of managerial ownership on managers’incentives, economics theory
identifies two types: the incentive alignment effect and the management entrenchment
effect. The literature on traditional agency theory argues that shareholdings held by
managers help align their interests with those of shareholders (Jensen & Meckling,
1976). This incentive alignment effect is expected to have more impact as managerial
ownership increases, suggesting that as managerial ownership increases, corporate
performance increases and opportunistic managerial behavior decreases monotonically.
The results of the research conducted by (Veno & Sasongko, 2016) state that there is an
effect of managerial ownership on earnings management. Based on such a description,
the hypothesis is formulated as follows:
H1: Managerial ownership has a negative effect on earnings management.
Company ownership may consist of institutional ownership and individual
ownership or a mixture of both with a certain proportion (Nuraina, 2012). Institutional
ownership is the ownership of company shares owned by institutions or institutions
such as insurance companies, banks, investment companies, and ownership of other
institutions (Tarjo, 2008). Institutional ownership is the proportion of shares held by
institutions such as insurance companies, pension funds, or other companies measured
by the percentage calculated at the end of the year. Institutional ownership can be
measured using a percentage indicator of the number of shares held by an institution
from all share capital circulating in the stock market (Boediono, 2005).
Institutional ownership has a negative influence on the practice of earnings
management, where the smaller the percentage of institutional ownership, the greater
the existence of managerial trends in making certain policies to manipulate earnings
reporting (Werner R. Murhadi, 2009). This statement is supported by the results
expressed by (Jao & Pagalung, 2011). However, this is different from the research
Page 4
22 The Influence of Corporate Governance, Company Size______________________
conducted by (Guna & Herawaty Arleen, 2000) which states that institutional
ownership does not affect earnings management, nor is it revealed in a study conducted
by (Agustia, 2013). Based on such a description, the hypothesis is formulated as
follows:
H2: Institutional ownership has a negative effect on earnings management
Leverage is the use of assets and sources of funds (source of funds) by
companies that have fixed costs (expenses) to increase the potential profits of
shareholders (Sartono, 2001). According to (Barus & Leliani, 2013) leverage ratio is
the ratio that exists in financial statements that can find out how much the company is
financed by debt with the ability of the company described by capital, or it can also
show some of the assets used as the guarantor of the debt. (Radyasinta &
Kusmuriyanto, 2014) concluded that companies that have a high leverage ratio mean
having a proportion of debt that is higher than the proportion of assets will tend to
manipulate in the form of earnings management. Variable leverage can be calculated
using a ratio of total liabilities (short-term debt and long-term debt) to the total assets
owned by the company at the end of the year.
Leverage is the ratio between total liabilities and total assets of the company
(Agustia, 2013). This ratio will show the number of assets owned by companies
financed by debt. The results of research conducted by (Agustia, 2013), (Guna &
Herawaty Arleen, 2000) show that leverage affects earnings management. Based on
such a description, the hypothesis is formulated as follows:
H3: Leverage has a positive effect on earnings management.
Company size is a company structure that shows the scale of a company. The
size of the company shows the amount of experience and ability to grow a company
that indicates the ability and level of risk in managing investments provided by
investors to increase their prosperity (Apriyani, 2013).
The size of the company influences investors' decision making; large companies
will be more trusted by investors to invest their capital; in the end, large companies
have less possibility to practice earnings management. The statement is by the results of
a study conducted by (Prasetya & Gayatri, 2016) that firm size has a negative effect on
earnings management. Based on such a description, the hypothesis is formulated as
follows:
H4: Firm size has a negative effect on earning management.
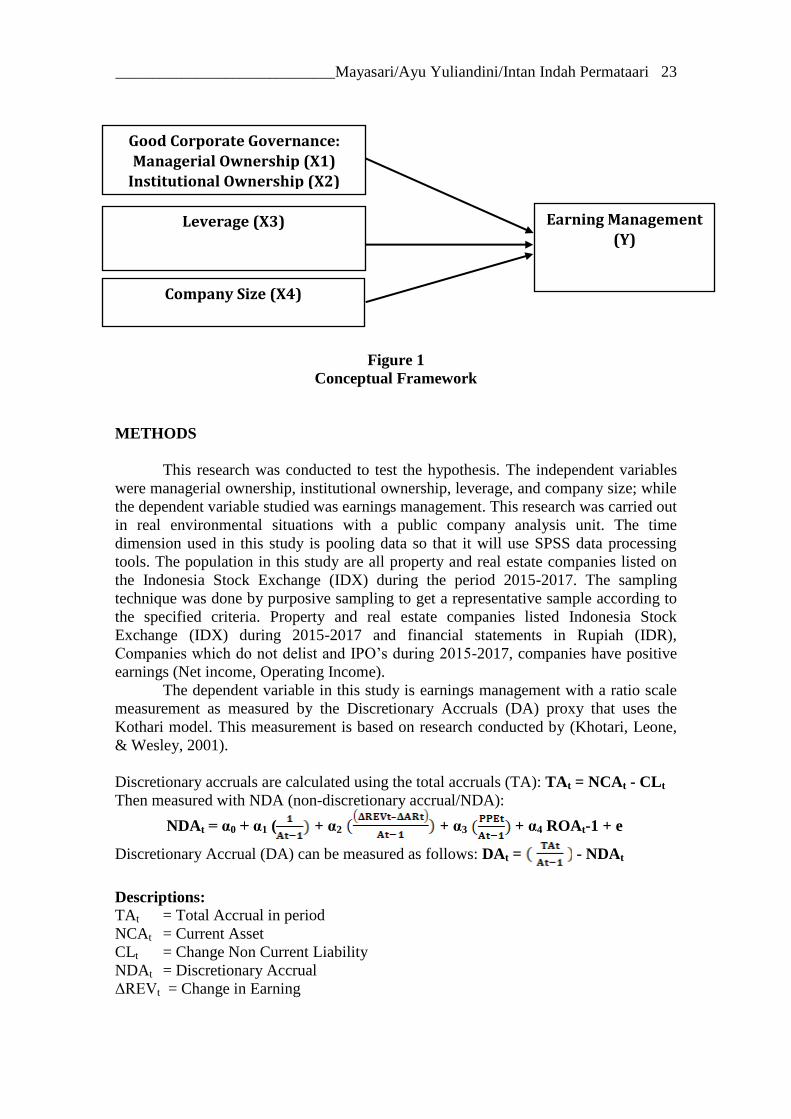
Conceptual Framework
Earnings management is earnings manipulation conducted by management to
achieve certain goals. The motivation of this manipulation is to keep.
Page 5
______________________________Mayasari/Ayu Yuliandini/Intan Indah Permataari 23
Figure 1
Conceptual Framework
METHODS
This research was conducted to test the hypothesis. The independent variables
were managerial ownership, institutional ownership, leverage, and company size; while
the dependent variable studied was earnings management. This research was carried out
in real environmental situations with a public company analysis unit. The time
dimension used in this study is pooling data so that it will use SPSS data processing
tools. The population in this study are all property and real estate companies listed on
the Indonesia Stock Exchange (IDX) during the period 2015-2017. The sampling
technique was done by purposive sampling to get a representative sample according to
the specified criteria. Property and real estate companies listed Indonesia Stock
Exchange (IDX) during 2015-2017 and financial statements in Rupiah (IDR),
Companies which do not delist and IPO’s during 2015-2017, companies have positive
earnings (Net income, Operating Income).
The dependent variable in this study is earnings management with a ratio scale
measurement as measured by the Discretionary Accruals (DA) proxy that uses the
Kothari model. This measurement is based on research conducted by (Khotari, Leone,
& Wesley, 2001).
Discretionary accruals are calculated using the total accruals (TA): TAt = NCAt - CLt
Then measured with NDA (non-discretionary accrual/NDA):
NDAt = α0 + α1 ( + α2 + α3 + α4 ROAt-1 + e
Discretionary Accrual (DA) can be measured as follows: DAt = - NDAt
Descriptions:
TAt = Total Accrual in period
NCAt = Current Asset
CLt = Change Non Current Liability
NDAt = Discretionary Accrual
ΔREVt = Change in Earning
Good Corporate Governance:
Managerial Ownership (X1)
Institutional Ownership (X2)
Leverage (X3)
Company Size (X4)
Earning Management
(Y)
Page 6
24 The Influence of Corporate Governance, Company Size______________________
ΔARt = Change in Receivable
PPEt = Property, Plant, And Equipment
ROAt = Return On Assets
At-1 = Total Asset
e = Error
DAt = Discretionary Accrual in Period
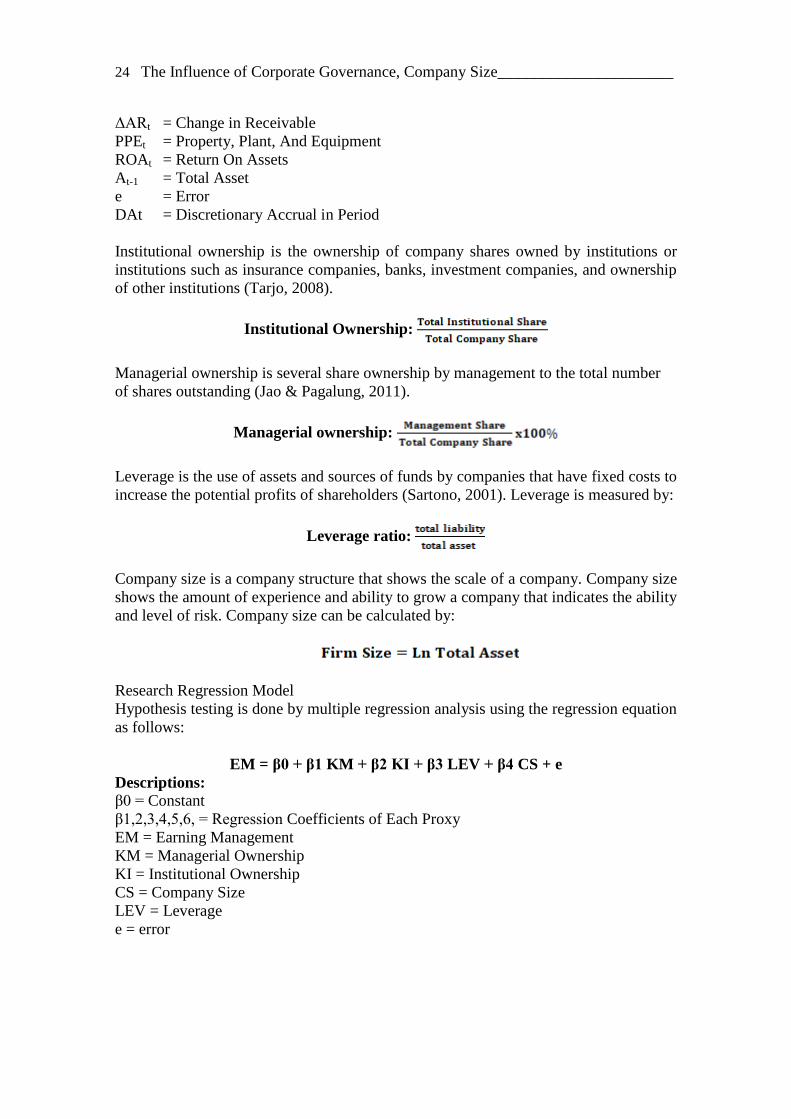
Institutional ownership is the ownership of company shares owned by institutions or
institutions such as insurance companies, banks, investment companies, and ownership
of other institutions (Tarjo, 2008).
Institutional Ownership:
Managerial ownership is several share ownership by management to the total number
of shares outstanding (Jao & Pagalung, 2011).
Managerial ownership:
Leverage is the use of assets and sources of funds by companies that have fixed costs to
increase the potential profits of shareholders (Sartono, 2001). Leverage is measured by:
Leverage ratio:
Company size is a company structure that shows the scale of a company. Company size
shows the amount of experience and ability to grow a company that indicates the ability
and level of risk. Company size can be calculated by:
Research Regression Model
Hypothesis testing is done by multiple regression analysis using the regression equation
as follows:
EM = β0 + β1 KM + β2 KI + β3 LEV + β4 CS + e
Descriptions:
β0 = Constant
β1,2,3,4,5,6, = Regression Coefficients of Each Proxy
EM = Earning Management
KM = Managerial Ownership
KI = Institutional Ownership
CS = Company Size
LEV = Leverage
e = error
Page 7
______________________________Mayasari/Ayu Yuliandini/Intan Indah Permataari 25
DISCUSSION
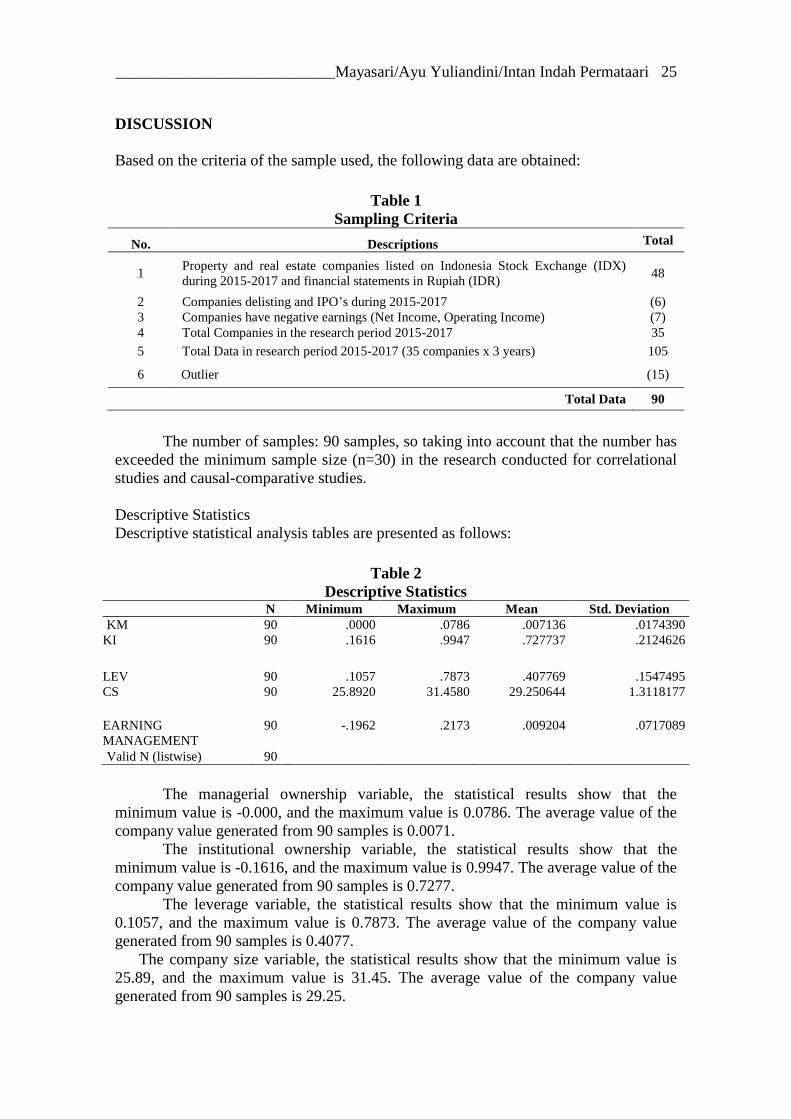
Based on the criteria of the sample used, the following data are obtained:
Table 1
Sampling Criteria
No. Descriptions Total
1 Property and real estate companies listed on Indonesia Stock Exchange (IDX)
during 2015-2017 and financial statements in Rupiah (IDR) 48
2 Companies delisting and IPO’s during 2015-2017 (6)
3 Companies have negative earnings (Net Income, Operating Income) (7)
4 Total Companies in the research period 2015-2017 35
5 Total Data in research period 2015-2017 (35 companies x 3 years) 105
6 Outlier (15)
Total Data 90
The number of samples: 90 samples, so taking into account that the number has
exceeded the minimum sample size (n=30) in the research conducted for correlational
studies and causal-comparative studies.
Descriptive Statistics
Descriptive statistical analysis tables are presented as follows:
Table 2
Descriptive Statistics N Minimum Maximum Mean Std. Deviation
KM 90 .0000 .0786 .007136 .0174390
KI 90 .1616 .9947 .727737 .2124626
LEV 90 .1057 .7873 .407769 .1547495
CS 90 25.8920 31.4580 29.250644 1.3118177
EARNING
MANAGEMENT
90 -.1962 .2173 .009204 .0717089
Valid N (listwise) 90
The managerial ownership variable, the statistical results show that the
minimum value is -0.000, and the maximum value is 0.0786. The average value of the
company value generated from 90 samples is 0.0071.
The institutional ownership variable, the statistical results show that the
minimum value is -0.1616, and the maximum value is 0.9947. The average value of the
company value generated from 90 samples is 0.7277.
The leverage variable, the statistical results show that the minimum value is
0.1057, and the maximum value is 0.7873. The average value of the company value
generated from 90 samples is 0.4077.
The company size variable, the statistical results show that the minimum value is
25.89, and the maximum value is 31.45. The average value of the company value
generated from 90 samples is 29.25.
Page 8
26 The Influence of Corporate Governance, Company Size______________________
The earning management variable, the statistical results show that the minimum
value is -0.1962, and the maximum value is 0.2173. The average value of the company
value generated from 90 samples is 0.0092.
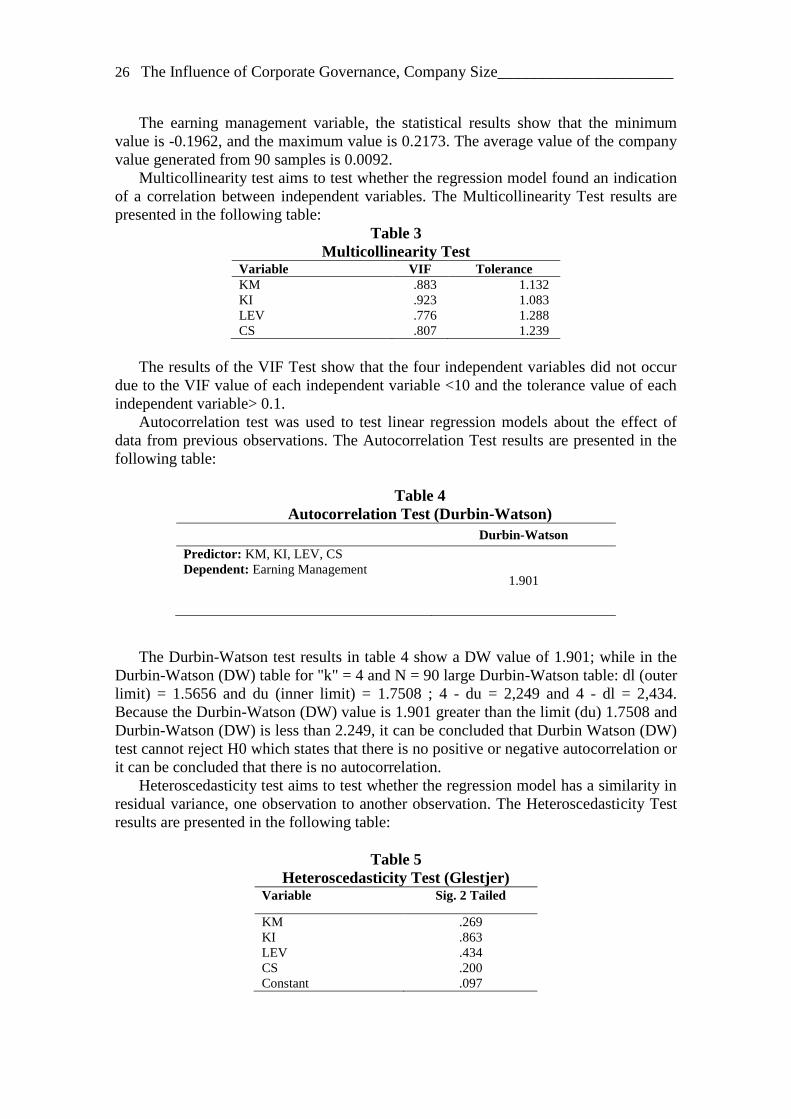
Multicollinearity test aims to test whether the regression model found an indication
of a correlation between independent variables. The Multicollinearity Test results are
presented in the following table:
Table 3
Multicollinearity Test Variable VIF Tolerance
KM .883 1.132
KI .923 1.083
LEV .776 1.288
CS .807 1.239
The results of the VIF Test show that the four independent variables did not occur
due to the VIF value of each independent variable <10 and the tolerance value of each
independent variable> 0.1.
Autocorrelation test was used to test linear regression models about the effect of
data from previous observations. The Autocorrelation Test results are presented in the
following table:
Table 4
Autocorrelation Test (Durbin-Watson)
Durbin-Watson
Predictor: KM, KI, LEV, CS
Dependent: Earning Management 1.901
The Durbin-Watson test results in table 4 show a DW value of 1.901; while in the
Durbin-Watson (DW) table for "k" = 4 and N = 90 large Durbin-Watson table: dl (outer
limit) = 1.5656 and du (inner limit) = 1.7508 ; 4 - du = 2,249 and 4 - dl = 2,434.
Because the Durbin-Watson (DW) value is 1.901 greater than the limit (du) 1.7508 and
Durbin-Watson (DW) is less than 2.249, it can be concluded that Durbin Watson (DW)
test cannot reject H0 which states that there is no positive or negative autocorrelation or
it can be concluded that there is no autocorrelation.
Heteroscedasticity test aims to test whether the regression model has a similarity in
residual variance, one observation to another observation. The Heteroscedasticity Test
results are presented in the following table:
Table 5
Heteroscedasticity Test (Glestjer) Variable Sig. 2 Tailed
KM .269
KI .863
LEV .434
CS .200
Constant .097
Page 9
______________________________Mayasari/Ayu Yuliandini/Intan Indah Permataari 27
The Heteroscedasticity Test results in the table show the significance values of the
four independent variables, more than 0.05. Thus it can be concluded that there is no
problem of heteroscedasticity in the regression model.
The normality test aims to determine whether in a residual regression model, the
independent variables and dependent variables have a normal distribution or not.
Table 6
Normality Test (Kolmogorov-Smirnov)
Item N Asymp. Sig (2 Tailed)
Unstandardized Residual 90 0.200
The significant value for Kolmogorov-Smirnov must be above 0.05 or 5%. The
sample results in Table 4.6 show that the Kolmogorov-Smirnov value is 0.200 > 0.05
so that the residuals are declared to be normally distributed.
Table 7
Determination Coefficient Test Result
Predictor Adjusted R-Square
Managerial ownership, Institutional Ownership, Leverage,
Company Size to Earning Management 0.198
Based on the table 7 above, it is known that the coefficient of determination seen
from the value of Adj R2 is 0.198. That is, 19.8% of the variation of the dependent
variable earning management can be explained by independent variables (Managerial
ownership, Institutional Ownership, Leverage, and Company Size) while the remaining
80.2% (100%-19.8%) is explained by other variables not included in the equation.
Table 8
Simultaneous Significant Test (F-Test) Result Model F Sig.
Dependent: Earning Management
Predictor Managerial ownership, Institutional Ownership,
Leverage, Company Size to Earning Management
*support statistically on alpha 5%
Regression
6.508
0.000
Table 9
Significant Test of Individual Parameters (t-Test) Result Unstandardized
Hypothesis Coefficients Beta Sig. (One Tail)
(Constant) -.182 .428
KM 4.923 .000 Ha Rejected
KI -.795 .214 Ha Rejected
LEV -.957 .170 Ha Rejected
CS .375 .354 Ha Rejected
Page 10
28 The Influence of Corporate Governance, Company Size______________________
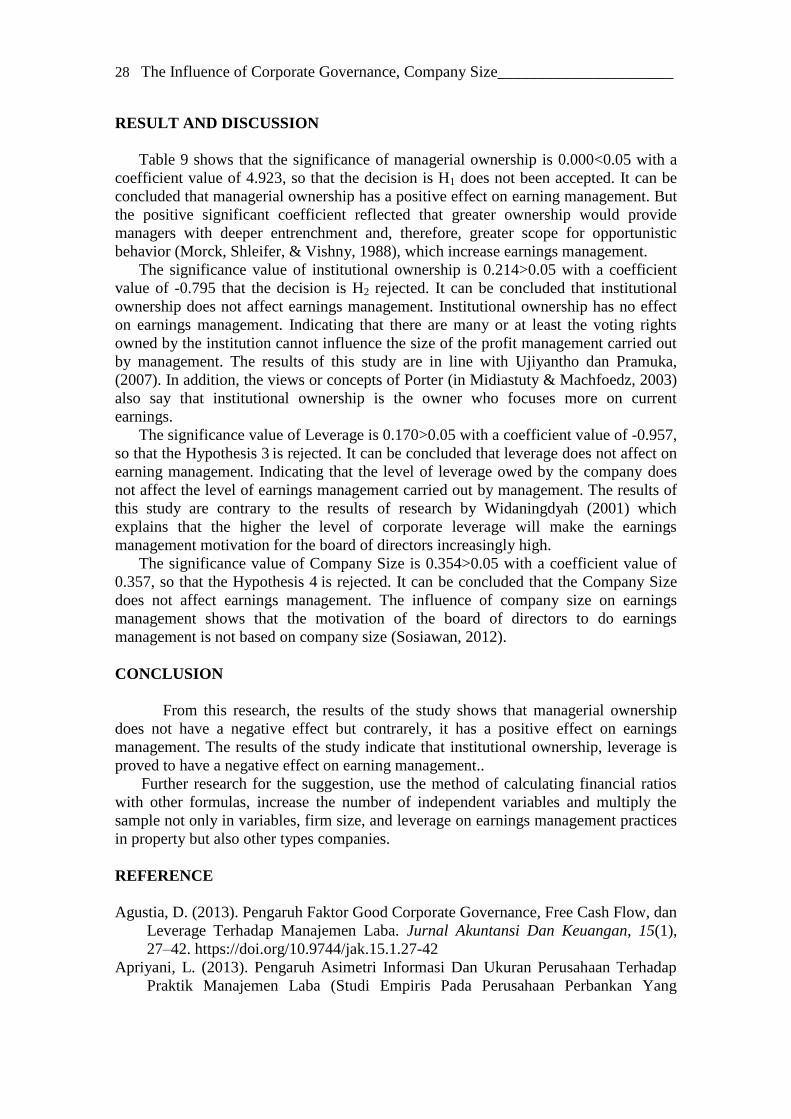
RESULT AND DISCUSSION
Table 9 shows that the significance of managerial ownership is 0.000<0.05 with a
coefficient value of 4.923, so that the decision is H1 does not been accepted. It can be
concluded that managerial ownership has a positive effect on earning management. But
the positive significant coefficient reflected that greater ownership would provide
managers with deeper entrenchment and, therefore, greater scope for opportunistic
behavior (Morck, Shleifer, & Vishny, 1988), which increase earnings management.
The significance value of institutional ownership is 0.214>0.05 with a coefficient
value of -0.795 that the decision is H2 rejected. It can be concluded that institutional
ownership does not affect earnings management. Institutional ownership has no effect
on earnings management. Indicating that there are many or at least the voting rights
owned by the institution cannot influence the size of the profit management carried out
by management. The results of this study are in line with Ujiyantho dan Pramuka,
(2007). In addition, the views or concepts of Porter (in Midiastuty & Machfoedz, 2003)
also say that institutional ownership is the owner who focuses more on current
earnings.
The significance value of Leverage is 0.170>0.05 with a coefficient value of -0.957,
so that the Hypothesis 3 is rejected. It can be concluded that leverage does not affect on
earning management. Indicating that the level of leverage owed by the company does
not affect the level of earnings management carried out by management. The results of
this study are contrary to the results of research by Widaningdyah (2001) which
explains that the higher the level of corporate leverage will make the earnings
management motivation for the board of directors increasingly high.
The significance value of Company Size is 0.354>0.05 with a coefficient value of
0.357, so that the Hypothesis 4 is rejected. It can be concluded that the Company Size
does not affect earnings management. The influence of company size on earnings
management shows that the motivation of the board of directors to do earnings
management is not based on company size (Sosiawan, 2012).
CONCLUSION
From this research, the results of the study shows that managerial ownership does not have a negative effect but contrarely, it has a positive effect on earnings
management. The results of the study indicate that institutional ownership, leverage is
proved to have a negative effect on earning management..
Further research for the suggestion, use the method of calculating financial ratios
with other formulas, increase the number of independent variables and multiply the
sample not only in variables, firm size, and leverage on earnings management practices
in property but also other types companies.
REFERENCE
Agustia, D. (2013). Pengaruh Faktor Good Corporate Governance, Free Cash Flow, dan
Leverage Terhadap Manajemen Laba. Jurnal Akuntansi Dan Keuangan, 15(1),
27–42. https://doi.org/10.9744/jak.15.1.27-42
Apriyani, L. (2013). Pengaruh Asimetri Informasi Dan Ukuran Perusahaan Terhadap
Praktik Manajemen Laba (Studi Empiris Pada Perusahaan Perbankan Yang
Page 11
______________________________Mayasari/Ayu Yuliandini/Intan Indah Permataari 29
Terdaftar Di Bursa Efek Indonesia). Artikel Ilmiah Mahasiswa.
Barus, A. C., & Leliani. (2013). Analisis Faktor-Faktor yang Mempengaruhi
Profitabilitas pada Perusahaan Manufaktur yang Terdaftar di Bursa Efek
Indonesia. Jurnal Wira Ekonomi Mikroskil, 3(2), 73–81. Retrieved from
https://mikroskil.ac.id/ejurnal/index.php/jwem/article/view/207
Bodie, K. A., & Alan, M. (2006). Investasi. Alih Bahasa oleh Zuliani Dalimunthe dan
Budi Wibowo. Jakarta: Salemba Empat.
Boediono, G. S. (2005). Kualitas Laba: Studi Pengaruh Mekanisme Corporate
Governance dan Dampak Manajemen Laba dengan Menggunakan Analisis Jalur.
Simposium Nasional Akuntansi VIII, VIII(September), 172–194.
FCGI, & ADB. (2001). Corporate Governance Self Assessment Checklist (2nd ed.).
Retrieved from www.fcgi.or.id
Guna, W. I., & Herawaty Arleen. (2000). PENGARUH MEKANISME GOOD
CORPORATE GOVERNANCE, INDEPENDENSI AUDITOR, KUALITAS
AUDIT DAN FAKTOR LAINNYA TERHADAP MANAJEMEN LABA. Jurnal
Bisnis Dan Akuntansi, 12(1), 53–68. https://doi.org/Vol. 12, No. 1, April 2010,
Hlm. 53 - 68
Jao, R., & Pagalung, G. (2011). CORPORATE GOVERNANCE, UKURAN
PERUSAHAAN, DAN LEVERAGE TERHADAP MANAJEMEN LABA
PERUSAHAAN MANUFAKTUR INDONESIA. Jurnal Akuntansi & Auditing,
8(1), 43–54.
Jensen, M. C., & Meckling, W. H. (1976). Theory of the firm: Managerial behaviour,
agency costs and ownership Structure. Journal of Financial Economics, 3, 305–
360. Retrieved from
http://search.ebscohost.com/login.aspx?direct=true&db=buh&AN=12243301&site
=ehost-live
Jones, J. J. (1991). Earnings Management During Import Relief Investigations. Journal
of Accounting Research, 29(2), 193–228.
Khotari, S. ., Leone, A. J., & Wesley, C. E. (2001). Performance Matched
Discretionary Accrual Measures. Mit, (May).
Lamora, S., Vince, & Kamaliah. (2014). PENGARUH KEPEMILIKAN
MANAJERIAL, KEPEMILIKAN INSTITUSIONAL DAN KEPEMILIKAN
KELUARGA TERHADAP MANAJEMEN LABA (EARNING
MANAGEMENT) PADA PERUSAHAAN BERKEPEMILIKAN ULTIMAT
YANG TERDAFTAR DI BEI. Jurnal Online Mahasiswa Fakultas Ekonomi
Universitas Riau, 1–15.
Melinda, F. I., & Sutejo, B. S. (2008). INTERDEPENDENSI KEPEMILIKAN
MANAJERIAL DAN KEPEMILIKAN INSTITUSIONAL TERHADAP
KINERJA KEUANGAN. Manajemen & Bisnis, 7(2), 153–154.
Midiastuty, P. P., & Machfoedz, M. (2003). Analisis Hubungan Mekanisme Corporate
Governance dan Indikasi Manajemen Laba. Simposium Nasional Akuntansi VI,
176–199.
Morck, R., Shleifer, A., & Vishny, R. W. (1988). Management Ownership and Market
Valuation* An Empirical Analysis. Journal of Financial Economics, 20, 293–315.
Nuraina, E. (2012). PENGARUH KEPEMILIKAN INSTITUSIONAL DAN
UKURAN PERUSAHAAN TERHADAP KEBIJAKAN HUTANG DAN NILAI
PERUSAHAAN (STUDI PADA PERUSAHAAN MANUFAKTUR YANG
TERDAFTAR DI BEI). AKRUAL Jurnal Akuntansi, 4(1), 51–70.
Page 12
30 The Influence of Corporate Governance, Company Size______________________
Prasetya, P. J., & Gayatri. (2016). Pengaruh Ukuran Perusahaan terhadap Manajemen
Laba dengan Pengungkapan Corporate Social Responsibility sebagai Variabel
Intervening. E-Jurnal Akuntansi Universitas Udayana, 14, 511–538.
Radyasinta, S. P., & Kusmuriyanto. (2014). PENGARUH MEKANISME GOOD
CORPORATE GOVERNANCE, LIKUIDITAS, PROFITABILITAS, DAN
LEVERAGE TERHADAP KONSERVATISME AKUNTANSI. Accounting
Analysis Journal, 3(2), 255–263.
Ross, S. A. (1973). The Economic Theory of Agency: The Principal’s Problem.
American Economic Association, 63(2), 134–139.
Sartono, A. (2001). Manajemen Keuangan Teori dan Aplikasi (4th ed.). Yogyakarta:
BPFE.
Setiawati, L., & Na’im, A. (2000). Manajemen laba. Jurnal Ekonomi Dan Bisnis
Indonesia, 15(4), 424–441. https://doi.org/10.1016/j.polymer.2003.08.024
Shanti, J., & Yudhanti, C. B. H. (2007). Pengaruh Set Kesempatan Investasi dan
Leverage Finansial Terhadap Manajemen Laba. Jurnal Ekonomi Bisnis Dan
Akuntansi, 10(3), 49–70.
Sosiawan, S. Y. (2012). Pengaruh Kompensasi, Leverage, Ukuran Perusahaan,
Earnings Power terhadap Manajemen Laba. JRAK, 8(1), 79–89.
Tarjo. (2008). Pengaruh Konsentrasi Kepemilikan Institusional dan Leverage terhadap
Manajemen Laba, Nilai Pemegang Saham serta Cost of Equity Capital. SNA
Volume 11. Pontianak.
Ujiyantho, M. A., & Pramuka, B. A. (2007). Mekanisme Corporate Governance,
Manajemen Laba dan Kinerja Keuangan. Simposium Nasional Akuntansi X, 1–26.
https://doi.org/10.1016/b978-0-12-373932-2.00098-3
Veno, A., & Sasongko, N. (2016). PENGARUH ASIMETRI INFORMASI
TERHADAP MANAJEMEN LABA DENGAN GOOD CORPORATE
GOVERNANCE SEBAGAI VARIABEL MODERASI. Jurnal Ekonomi
Manajemen Sumber Daya, 18(1), 64–78.
Watts, R. L. (2003). Conservatism in Accounting Part I: Explanations and Implications.
Accounting Horizons, 17(3), 207–221. https://doi.org/10.2308/acch.2003.17.3.207
Wedari, L. K. (2004). Analisis Pengaruh Proporsi Dewan Komisaris Dan Keberadaan
Komite Audit Terhadap Aktivitas Manajemen Laba. SNA Volume 7.
Werner R. Murhadi. (2009). Studi pengaruh good corporate governance terhadap
praktek earnings management pada perusahaan terdaftar di PT Bursa Efek
Indonesia. Jurnal Manajemen Dan Kewirausahaan, 11(1), pp.1-10. Retrieved
from http://puslit2.petra.ac.id/ejournal/index.php/man/article/view/17739