THE INFLUENCE OF FASTING AND CREATINE FEEDING UPON THE CREATINE CONTENT OF THE TISSUES AND BLOOD OF THE WHITE RAT.* BY ALFRED CHANUTIN AND HERBERT SILVETTE. WITH THE ASSISTANCE OF B. W. RAWLES, JR. (From the Laboratory of Physiological Chemistry, University of Virginia, University.) (Received for publication, September 21, 1928.) The recent review of the literature on creatine and creatinine by Hunter (1) shows that comparatively few investigations have been made with respect to the factors involved in the storage of creatine in the body tissues, particularly during fasting. Mendel and Rose (2, a) have presented evidence to show that “there occurs an increase in the percentage of creatine in the muscles of rabbits and fowl during inanition,” According to Myers and Fine (3), “The creatine content of rabbit muscle is rel- atively increased in the early part of starvation, but decreased at the close of the starvation, owing to the great loss of creatine in the urine during this period.” Evidence both for and against these ideas has been presented by other workers (1). It may be said that the majority of the evidence points towards a decrease in the creatine content of muscle as a result either of inanition or mal- nutrition. The investigations recorded in this paper were begun in view of the divergent results obtained by workers interested in the relation- ship of the creatine content of muscle to inanition. In order to study this problem effectively, a large number of white rats were employed. The unexpected results obtained led us to try further experi- ments in order to test the present theories concerning the storage of creatine in the body. The present investigation deals with the *Part of the expenses of this investigation was defrayed by a grant from the funds of the Research Committee of the University of Virginia. 589 by guest on April 29, 2020 http://www.jbc.org/ Downloaded from
Transcript
THE INFLUENCE OF FASTING AND CREATINE FEEDING UPON THE CREATINE CONTENT OF THE TISSUES
AND BLOOD OF THE WHITE RAT.*
BY ALFRED CHANUTIN AND HERBERT SILVETTE.
WITH THE ASSISTANCE OF B. W. RAWLES, JR.
(From the Laboratory of Physiological Chemistry, University of Virginia, University.)
(Received for publication, September 21, 1928.)
The recent review of the literature on creatine and creatinine by Hunter (1) shows that comparatively few investigations have been made with respect to the factors involved in the storage of creatine in the body tissues, particularly during fasting.
Mendel and Rose (2, a) have presented evidence to show that “there occurs an increase in the percentage of creatine in the muscles of rabbits and fowl during inanition,” According to Myers and Fine (3), “The creatine content of rabbit muscle is rel- atively increased in the early part of starvation, but decreased at the close of the starvation, owing to the great loss of creatine in the urine during this period.” Evidence both for and against these ideas has been presented by other workers (1). It may be said that the majority of the evidence points towards a decrease in the creatine content of muscle as a result either of inanition or mal- nutrition.
The investigations recorded in this paper were begun in view of the divergent results obtained by workers interested in the relation- ship of the creatine content of muscle to inanition. In order to study this problem effectively, a large number of white rats were employed.
The unexpected results obtained led us to try further experi- ments in order to test the present theories concerning the storage of creatine in the body. The present investigation deals with the
*Part of the expenses of this investigation was defrayed by a grant from the funds of the Research Committee of the University of Virginia.
creatine concentration of muscle, liver, kidneys, testes, heart, and brain as influenced by (a) loss of body weight due to fasting, (b) re- feeding creatine and control diets after prolonged fasting, and (c) feeding creatine diets to normal rats with the consequent effect of fasting and substitution of a control diet. In addition blood studies were made under the various conditions noted above.
EXPERIMENTAL.
The albino rat served as the experimental subject. These ani- mals were maintained on a stock diet.’ Recrystallized creatine was added in proper amounts to the above food mixture so as to make a 5 and 10 per cent creatine diet. In all cases, the animals were placed on the control diet for at least a week preceding any experimental work. Those animals fed on experimental diets were allowed food up to the time of killing. During the period of fasting, the rats were placed in individual double bottom mesh cages to avoid coprophagy. Water was always available.
In order to obtain the tissues and blood for analysis, the animals were stunned by a sharp blow behind the head and were immedi- ately decapitated. The blood was allowed to drain into a small beaker containing powdered potassium oxalate. The various tissues to be analyzed were promptly removed and dissected free from all visible fat. The muscles of the hind legs were ground in a small meat grinder and samples were taken for creatine analysis and total solids. The remaining tissues were cut into small pieces with scissors and were analyzed for creatine. The analysis for creatine (total creatinine) was made by the method of Rose, Helmer, and Chanutin (4). Every effort was made to treat the tissues with sulfuric acid within a few minutes after the death of the animal. The non-protein nitrogen, total creatinine, and pre- formed creatinine were determined on the tungstic acid filtrate according to the method of Folin and Wu (5). The reducing sugar was determined by the method of Benedict (6).
1 Whole wheat flour two-thirds, dried whole milk one-third, 1 per cent of the weight of the wheat as sodium chloride, and 1 per cent of the weight of the wheat as calcium carbonate. Lettuce was fed three times a week and water was given ad lib&m.
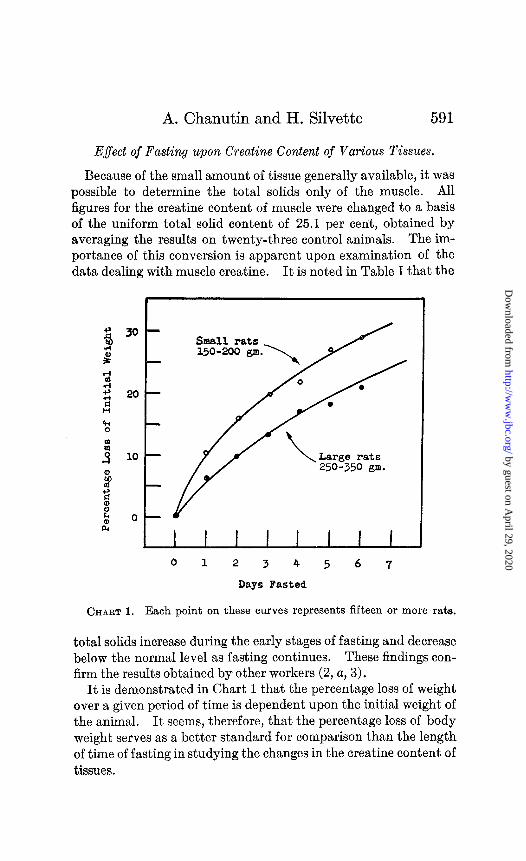
E$ect of Fasting upon Creatine Content of Various Tissues.
Because of the small amount of tissue generally available, it was possible to determine the total solids only of the muscle. All figures for the creatine content of muscle were changed to a basis of the uniform total solid content of 25.1 per cent, obtained by averaging the results on twenty-three control animals. The im- portance of this conversion is apparent upon examination of the data dealing with muscle creatine. It is noted in Table I that the
0 1 2 3 4 5 6 7
Days Fasted
CHART 1. Each point on these curves represents fifteen or more rats.
total solids increase during the early stages of fasting and decrease below the normal level as fasting continues. These findings con- firm the results obtained by other workers (2, a, 3).
It is demonstrated in Chart 1 that the percentage loss of weight over a given period of time is dependent upon the initial weight of the animal. It seems, therefore, that the percentage loss of body weight serves as a better standard for comparison than the length of time of fasting in studying the changes in the creatine content of tissues.
The data on the influence of fasting on the creature content of various tissues are summarized in Table I. It is noted that of the tissues analyzed, the muscle shows the greatest change in its creatine content as a result of fasting. The muscle creature of the animals in Group I, which represents the early stages of fasting, shows only a slight average increase of 3.9 per cent over the control group. In Groups II and III, the muscle creatine content is in- creased 8.1 and 10.8 per cent respectively. The average creatine concentration of the muscle of the animals in Group IV (terminal stage) shows a marked increase of 25.6 per cent above normal. Practically all rats die of fasting after 30 to 40 per cent of the
TABLE II.
Comparison between Loss of Tissue Weight and Creatine Concentration as Result of Acute Inanition (Loss of Rody Weight, 33 Per Cent).
body weight has been lost. As a rule, an animal in this group was not killed until it was very weak and on the verge of death.
Not only do these results indicate that the creatine content of muscle progressively increases during fasting, but they show that a relatively sharp increase occurs shortly before death.
In Table II it will be noted that there is no absolute relationship between loss of weight and creatine concentration of tissues during the extreme stages of fasting. The creatine content of the kidneys and muscle is definitely increased during this experimental condi- tion. The increased creatine content of the kidneys probably has no direct metabolic significance, but is due to the resulting creatin- uria of fasting. The results obtained for the remaining tissues cannot be considered as significant, since a variation in total solids may account for the slight rise in creatine obtained. This same
argument may be used to explain the small variations in the creatine content of the heart and testes during the course of fasting (Table I).
Refeeding a 10 Per Cent Creatine and Control Diet after Prolonged Inanition.
In the foregoing data, it was demonstrated that the greatest in- crease in the creatine concentration of muscle occurred just before death. It seemed probable that the refeeding of a creatine- containing diet at this stage might result in a cumulative effect. As may be seen in Table III, the results obtained are striking. The creatine of the muscle increases to a level appreciably higher (4.8 per cent) than the average maximum concentration obtained during fasting. We believe this creatine concentration in muscle (30.4 per cent above normal) to be higher than any creatine storage reported in the literature. Despite continued creatine feeding, the muscle creatine content drops during the 2nd and 3rd days. Evidently the creatine reservoir can retain less and less creatine as the animal regains its weight. The creatine concen- tration after 3 days of creatine refeeding is about the same as that obtained by feeding the same diet to control animals (Table V).
A further consideration of the data in Table III shows that the ingestion of creatine after prolonged fasting has also caused a de- cided increase in the creatine concentration of other tissues. This is particularly striking in the case of the liver in which there is an increase of about 1000 per cent after 1 day’s creatine feeding. During the 2nd and 3rd days, there is a gradual decrease. The in- crease in the creatine content of the kidneys is marked (360 per cent) and remains fairly constant for the duration of the experi- ment. A maximum increase of about 42 per cent above the highest figure obtained during fasting is noted in the creatine concentra- tion of the heart. The creatine content of the testes and brain, however, is practically the same as in animals showing a similar loss of weight due to inanition.
The refeeding of a control diet after fasting (Table IV) throws further light on the tendency of the creatine reservoir to return to the normal level. The creature of the muscle drops after 1 day’s refeeding, and continues to decrease proportionately as the body weight increases. The analyses of the kidneys seem to indicate
that creatinuria still persists during the 1st day of refeeding. The creatine content drops to normal on the 2nd day and remains constant at this level during the period of the experiment. Al- though the remaining tissues seem to return to normal, no definite conclusion can be drawn because of the few analyses.
TABLE III.
E$ect of Creatine Refeeding after Prolonged Fasting.
In both these series of experiments, the water content of the muscle presents an interesting picture. Beginning with the 1st day and continuing throughout t.he remainder of the experimental period, there is a rise in the water content of the muscle which is definite and striking. This result would seem to indicate that an excessive storage of water, as judged from muscle, plays an impor- tant role in the regaining of body weight after prolonged fasting.
increase in the creatine content of the liver, kidneys, heart, and muscle after 1 day’s feeding (Table V). Continued feeding of creatine is accompanied by a definite decrease in all of the tissues mentioned above. This picture seems to be typical of the various experiments of this nature. Under these experimental conditions
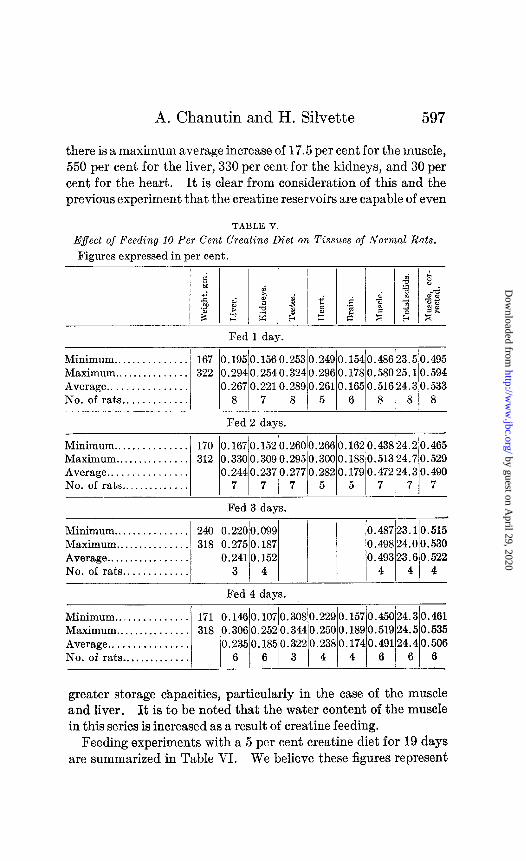
there is a maximum average increase of 17.5 per cent for the muscle, 550 per cent for the liver, 330 per cent for the kidneys, and 30 per cent for the heart. It is clear from consideration of this and the previous experiment that the creatine reservoirs are capable of even
TABLE V.
Effect of Feeding 10 Per Cent Creatine Diet on Tissues of Normal Rats.
Minimum ............... 171 0.1460.107/0.3080.2290.1570.45024.30.461 Maximum ............... 318 0.3060.2520.3440.2500.1890.51924.50.535 Average ................ 0.2350.1850.3220.2380.1740.49124.40.506 No. of rats .............. 6 6 3 4 4 6 66
greater storage capacities, particularly in the case of the muscle and liver. It is to be noted that the water content of the muscle in this series is increased as a result of creatine feeding.
Feeding experiments with a 5 per cent creatine diet for 19 days are summarized in Table VI. We believe these figures represent
a state of creatine equilibrium in the organism. It is noted that the creatine content of various tissues is increased and also that the total solids for muscle are normal.
TABLE VI.
Effect of Feeding 6 Per Cent Creatine Diet for 19 Days on Tissues of - . Normal Rats.
Figures expressed in per cent.
Rat No. Weight
-~
gm.
114 212 115 177 116 205
-~
Liver. Kid- neya.
0.158 0.136 0.129 0.119 0.301 0.277
0.199 0.177
-_
Testes. Heart.
--
0.348 0.253 0.268
0.330 0.275 --
0.339 0.265
TABLE VII.
Brain.
0.176
0.543 0.569 0.545
0.552
Tota* Muscle,
solids. cor- rected. --
25.3 0.539 25.4 0.560 25.2 0.544 --
25.3 0.548
Effect of Feeding 10 Per Cent Creatine Diet on Liver and Muscle of Young Rats.
The creature content of the liver and muscle of young rats fed a creatine-containing diet is decidedly increased (Table VII). The muscle of these young animals shows an increase of 22 per cent, an increase definitely higher than that obtained with adult rats under the same conditions. Possibly the low creatine content of the normal muscle, characteristic of young animals, allows for a greater creatine capacity. The liver creatine is increased as a re- sult of the 1st day’s creatine ingestion, but the succeeding day’s figures show a marked drop. In these experiments we are again confronted with the decrease in muscle total solids.
TABLE VIII.
Effect of Discontinuing Creatine Feeding on Tissues of Normal Rats. Figures expressed in per cent.
E#eet of Discontinuation of Creatine Diets on Tissue Creatine in Normal Rats.
After adult rats were fed on a 10 per cent creatine diet for a suf- ficient length of time to assure an adequate storage of excess creatine in the tissues, food was withdrawn in one series and a con- trol diet substituted in another (Table VIII). The sudden with- drawal of creatine causes a rapid disappearance of the excess crea- tine from the liver and kidneys during the 1st day. The muscle, however, shows only a very small loss of creatine under these con- ditions.
Minimum ..................... Maximum ..................... Average. ..................... No. of rats ....................
144 24 1.7 151 25 148 25 1.7 23.3 2 2 1
reached. Although there is an average maximum increase of about 15 per cent, this cannot be taken at its face value because of the individual variations within each group. There is evidence that a few of the animals show a distinct rise in non-protein ni- trogen toward the later stages of fasting. These data are not in
strict accord with those of Morgulis and Edwards (7), who found an unmistakable rise in non-protein nitrogen at the terminal stage of fasting in dogs.
Morgulis and Edwards noted further a fall in the blood sugar values of the dog in the early stages of fasting, followed by a rise above normal with further progress of the fast. A similar curve was obtained in these experiments, but the blood sugar concen- tration never reached the normal level during any stage of fasting.
Although our analyses for creatine and creatinine are few in number, we must conclude from these data that these two com- ponents of the blood are not affected as a result of fasting. This is rather surprising in the light of the changes that were found to have taken place in the creatine concentration of muscle and kid- neys. It is certain that any marked changes in the blood creatine and creatinine would have been noted despite the paucity of the material.
E$ect of Feeding a 10 Per Cent Creatine Diet upon the Blood.
The blood analyses in rats fed a diet containing 10 per cent crea- tine are summarized in Table X. It will be observed that the non- protein nitrogen is increased slightly under these conditions. The sugar concentration remains normal. According to Hill (8), the oral administration of creatine causes a decrease in the blood sugar. Creatine ingestion in the rat apparently does not have the same effect on blood sugar as is encountered in dog and man. As one might expect, the blood creatine has been markedly increased. The preformed creatinine of the blood in these animals is definitely higher than in the controls. This finding confirms the idea that ingestion of creatine in sufficient quantities is accompanied by an increase of creatinine in the blood and urine.
E$ect of Refeeding Control and Creatine Diets upon the Blood.
The outstanding result of refeeding a control diet after prolonged fasting is the unquestionable increase in the total creatinine. This increase may be due to the decrease in the creatine content of muscle, with a consequent liberation of creatine into the blood stream. The refeeding of creatine causes an increase, not only in the total creatinine, but also in the blood sugar (Table XI).
Although creatine is known to be a weak reducing agent, it cannot be responsible for this increased blood sugar.
In these blood studies the constancy of creatine and creatinine during fasting should be emphasized. The most marked changes in the blood creatine and creatinine are obtained after creatine ingestion. The results of the determination of blood non-protein nitrogen and sugar are not significant in our consideration of creatine and creatinine metabolism.
TABLE XI.
E$ect of Refeeding Creatine and Control Diets after Prolonged Fasting. Figures expressed in mg. per 100 cc. of blood.
Minimum ..................... 40 120 22 Maximum ..................... 58 145 62 Average ...................... 49 134 34 No. of rats ................... 4 5 5
DISCUSSION.
The chief points of interest in the foregoing studies have been the bearing of the results upon creatine storage and metabolism in the organism. It has been demonstrated that the ability to store creatine in the tissues, particularly in muscle, is a relative one, and is dependent upon the experimental conditions. Fur- thermore, a comparison of the creatine storage under varying conditions of nutrition has been made, which serves as an excellent basis for discussing creatine metabolism.
The literature concerning the relationships of creatine metabo- lism to tissues, limited for the most part to muscle, deals with ex- perimental methods which are both direct and indirect. Efforts
to relate the creatinuria of fasting and the creatine content of muscle have led to a number of theories concerning certain phases of creatine metabolism. Hunter (1) has summarized the ideas offered by many workers to explain the origin of urinary creatine during fasting, as follows: (1) Protein catabolism causes a de- crease in the power of the body to dehydrate creatine (Cathcart). (2) Urinary creatine represents preexisting creatine released from disintegrating muscle, and is excreted without change (Myers and Fine). (3) Inanition results in an increased formation of creatine, accompanied by an inability of the organism to utilize or destroy the surplus creatine (Mendel and Rose; Benedict and Osterberg). The second and third hypotheses have the greatest number of adherents.
The work of Myers and Fine (3) is the most representative and presents the strongest argument for the proponents of the second idea. These workers have shown a preliminary increase in crea- tine concentration of muscle during early fasting in rabbits, which is followed by a marked decrease as a result of prolonged fasting. They concluded that the resulting creatinuria of fasting is directly related to the decrease in the creatine content of muscle. The chief objections to this work are the suppositions “that creatine may not disappear in anabolic reactions, and that in the starving organism no creatine is ever produced” (1). Their results differ from those of Mendel and Rose (2, a), who found a gradually marked increase in the creatine content of muscle with prolonged fasting. Myers and Fine attempt to explain these discrepancies by making calculations from the “initial creatine.” This method of calculation lacks experimental evidence.
The data presented in this paper demonstrate a rise in the crea- tine content of muscle during fasting which is particularly marked during the terminal stage. As a result of kidney analyses, we must assume that a creatinuria existed. These experiments dem- onstrate, therefore, that during fasting in the rat, creatine is eliminated in the urine with an accompanying progressive increase in the creatine content of muscle. There is every reason to believe from our data that “creatine is a product of endogenous metabo- lism, and that an increased formation of creatine occurs when the tissue catabolic processes are accelerated” (2, a).
The influence of the adipose tissue in muscle and kidneys on the
creatine changes in these tissues must be considered negligible. The fat content of the entire rat body varies from 5 to 8 per cent of the moist weight. Since the muscle and kidneys contain but relatively small amounts of fat, a complete removal of fat at the terminal stage of fasting would account for only a small part of the increase in creatine content noted. It is true that the loss of fat may affect the apparent rise in creatine concentration more mark- edly during the earlier stages of fasting, but even this influence cannot be considerable in the light of the increases in creatine con- centration found.
TABLE XII.
Showing “Saturation Point” for Creatine Storage in Muscle, together with Data for Other Tissues, under Various Experimental Conditions.
Further support for the idea that the loss of fat is unimportant so far as it influences the creatine content of muscle and kidneys is given in Table IV. After a control diet is refed to rats subjected to prolonged fasting, the creatine content of the kidneys returns to normal after 2 days, despite the fact that at this time the rats were 23.2 per cent below the normal weight. In the muscle, the creatine content is rapidly approaching normal by the 4th day of refeeding, though there is still a 17.9 per cent loss of body weight. This rapid decrease in the creatine content of the muscle cannot be explained even by assuming a marked deposition of fat.
Data are summarized in Table XII to illustrate the extreme var- iations in the creatine concentration of tissues under different
experimental conditions, and particularly in the case of muscle. An increase of 17.4 per cent in the creatine content of muscle is noted after the feeding of a 10 per cent creatine diet to a control animal for 1 day. Since further feeding of creatine is accompanied by a drop in the creatine content of muscle (Table V), we feel this is the highest concentration that can be attained under these cir- cumstances. A still greater increase is obtained as a result of ex- treme inanition. It is difficult to explain the data obtained for fasting unless it is assumed that creatine is being formed and stored in progressively larger quantities as the rate of catabolism in- creases. In addition, fasting is unquestionably responsible for the increased creatine capacityof muscle tissue. Thisview is confirmed by the results obtained in the animals refed a creatine diet after prolonged fasting. In one such animal, for example, the increase amounted to about 45 per cent above the control creatine content of muscle. It seems obvious that the differences in the creatine concentration of muscle caused by feeding creatine to control and fasted animals demonstrates the effect of the nutritional state upon the ability of the muscle to store creatine.
If the assumptions concerning creatine storage are correct, we believe that some fundamental interpretations concerning crea- tine metabolism may be made. Our evidence would lead one to be- lieve that the storage of excess creatine in tissues is accomplished only under unusual metabolic conditions. Apparently the meta- bolic state determines the equilibrium between the creatine stored in the tissues and the creatine of the body fluids. It seems that theories attempting to explain creatinuria on the basis of the capacity to store creatine, or because of a “low saturation” point, cannot be considered entirely valid as a result of the evidence presented in this investigation. It is more probable that poor utilization of creatine is responsible for most types of creatinuria.
After feeding diets containing 2.6 per cent creatine for a com- paratively long time, Chanutin (9) found no increase in the muscle creatine of rats. In mice, however, a definite increase in muscle creatine content has been demonstrated after a 2 per cent creatine diet is fed (10). In the present experiments, we have been able to demonstrate a marked storage of excess creatine in rat muscle by feeding 5 and 10 per cent creatine diets. It is interesting to point out that the average increase in the muscle creatine of mice
was 9.8 per cent above normal as contrasted with a 20 per cent in- crease in rats under similar conditions. We must conclude from this evidence that the manner of metabolizing creatine in mice and rats is quantitatively different.
The evidence given thus far emphasizes the importance of the muscle in creatine metabolism. The muscle is the tissue in which the creatine concentration is affected after both fasting and crea- tine ingestion. The storage of creatine in the liver occurs only after the feeding of creatine. Furthermore, the ability of this organ to store variable amounts of creatine is striking. One can, it is true, ascribe the differences in liver creatine content in these experiments to the rate of absorption from the intestine. After the creatine diet is discontinued, the liver creatine content returns to normal rapidly, while the muscle creatine concentration changes slowly. It appears, therefore, that excess creatine is loosely bound in the liver as compared to the creatine combination in muscle. In pre- vious investigations (9,lO) an attempt was made to correlate crea- tine metabolism with the liver. In the light of the present studies we must agree with Hunter that the relationship of the liver to creatine metabolism is uncertain, and that “the weight of the evidence on the negative side of the question is greater.”
The heart muscle is capable of storing an appreciable amount of creatine . This increase cannot be considered important from a quantitative view-point. It is interesting, however, to note that cardiac tissue is capable of reacting toward creatine in the same manner as striated muscle. The changes in the testes and brain are negligible throughout these experiments. It is doubtful whether the testes and brain with their relatively high creatine content have any relationship to creatine metabolism. It seems that our evidence adds further proof that striated muscle is by far the most important tissue involved in creatine metabolism.
CONCLUSIONS AND SUMMARY.
Fasting in the rat causes the following changes in the creatine content and t’otal solids of tissues.
1. The creatine content of rat muscle is progressively increased during the period of fasting. The possible relationship between endogenous catabolic processes and the formation and storage of excess creatine has been pointed out.
2. The kidney creatine content is increased early in fasting, which is certainly indicative of creatinuria.
3. The heart, testes, liver, and brain show very little change in creatine content.
4. Total solids of muscle are increased in the early part of fasting, but decreased at the close of fasting.
The creatine concentration of muscle is increased after feeding a high creatine diet to adult and young rats. The liver and heart also show appreciable increases.
The flexibility of the creatine reservoirs in muscle and liver has been demonstrated. It has been possible to change the saturation point by varying the experimental conditions.
Studies of the blood during and after fasting and during creatine feeding have been made.
BIBLIOGRAPHY.
1. Hunter, A., Creatine and creatinine, London, 1928. 2. Mendel, L. B., and Rose, W. C., J. Bid. Chem., 1911-12, x, (a) 255,
(b) 213. 3. Myers, V. C., and Fine, M. S., .I. Bid. Chem., 1913, xv, 283. 4. Rose, W. C., Helmer, 0. M., and Chanutin, A., .I. Biol. Chem., 1927,
lxxv, 543. 5. Folin, O., and Wu, H., J. Biol. Chem., 1919, xxxviii, 81. 6. Benedict, S. R., J. BioZ. Chem., 1926, Ixviii, 759. 7. Morgulis, S., and Edwards, A. C., Am. J. Physiol., 1924, lxviii, 477. 8. Hill, R. M., Proc. Am. Sot. BioZ. Chem., 1928, vii, 4; J. BioZ. Chem.,
1928, lxxviii, p. iv. 9. Chanutin, A., J. BioZ. Chem., 1927, lxxv, 549.
10. Chanutin, A., and Beard, H. H., J. BioZ. Chem., 1928, lxxviii, 167. 11. Jackson, C. M., Am. J. Anat., 1915, xviii, 75.