Page 1
THE INFLUENCE OF GEOGRAPHY ON THE LIVES OF AFRICAN AMERICAN
RESIDENTS OF ARLINGTON COUNTY, VIRGINIA, DURING SEGREGATION
by
Nancy Perry
A Dissertation
Submitted to the
Graduate Faculty
of
George Mason University
in Partial Fulfillment of
The Requirements for the Degree
of
Doctor of Philosophy
Earth Systems and Geoinformation Sciences
Committee:
Dr. Nigel M. Waters, Dissertation Director
Dr. Spencer Crew, Committee Member
Dr. Germana Manca, Committee Member
Dr. Earle Reybold, Committee Member
Dr. Peggy Agouris, Department Chairperson
Dr. Timothy L. Born, Associate Dean for
Student and Academic Affairs, College of
Science
Dr. Vikas Chandhoke, Dean, College of
Science
Date: Spring Semester 2013
George Mason University
Fairfax, VA
Page 2
The Influence of Geography on the Lives of African American Residents of Arlington
County, Virginia, During Segregation
A Dissertation submitted in partial fulfillment of the requirements for the degree of
Doctor of Philosophy at George Mason University
by
Nancy Perry
Master of Science
George Mason University, 2009
Master of Science
George Mason University, 1990
Bachelor of Arts
University of Washington, 1966
Director: Nigel M. Waters, Professor
Department of Earth Systems and Geoinformation Sciences
Spring Semester 2013
George Mason University
Fairfax, VA
Page 3
ii
This work is licensed under a creative commons
attribution-noderivs 3.0 unported license. Contact: Claudia Holland at
[email protected]
Page 4
iii
DEDICATION
This research is dedicated to the memory of my older sister, Anna Perry Gillespie, who
held a PhD in Sociology from Colorado State College. Ann was my model and my
inspiration from the day I was born. I would not have entered Mason’s PhD program had
it not been for Ann’s encouragement. Much of my research is qualitative, and at the time
of my research Mason’s Geography and Geospatial Information Sciences department did
not offer a course in qualitative research methods. Ann helped me write an interview
instrument, critiqued my interview transcripts, and taught me how to ask the questions. I
deeply regret Ann’s untimely death before the research was complete.
Page 5
iv
ACKNOWLEDGEMENTS
There are many people who contributed to the successful completion of this
dissertation. First I must express my deep gratitude to Dr. Nigel M. Waters for
supervising my PhD research. His incredible patience, generosity, tolerance, humor,
unflagging support, and never ending encouragement helped to maintain the
momentum through a difficult but fascinating process. I will be forever grateful to
him. I would also like to thank my wonderful committee members, Dr. L. Earle
Reybold, Dr. Spencer Crew, and Dr. Germana Manca. They each brought unique
skills and knowledge to the task.
I am thankful to George Mason University for their dissertation completion grant,
which enabled me to complete this dissertation in a timely fashion.
I am indebted to those in the Geographic and Geoinformation Sciences Department at
George Mason University who have educated and guided me throughout my time in
this department.
I am deeply in debt to members of Arlington’s historically African American
neighborhoods who invited me into their homes and businesses, and answered my
questions. Their efforts to help me understand this period in Arlington’s history are
greatly appreciated. Thank you to Gary Barbee, Yolanda Black, Vivian Bullock,
Audrey Coachman, Charles Collins, Joan Cooper, Arlene Corbin, Eddie Corbin,
Welbe Deskins, Robert Gaskill, Melvin Green, Saundra Green, George Jones, Idabel
Jones, Mary Koblitz, Edith Moore, George Moore, Hattie Oliver, Loretta Reid,
Dorothy Robinson, Florence Ross, Milton Rowe, Naomi Smith, Margarit Syphax,
Alfred Taylor, Delores Taylor, Una Warrington, Irene West, and Ola Willoughby.
Thank you also to the staff of the Virginia Room at the Arlington Central Library for
interest in and support of my research.
I am grateful to the Arlington County government, particularly the Historical
Preservation coordinator, Michael Leventhal and the Department of Environmental
Systems manager, Luis Araya for sharing their insights and information about the
workings of Arlington during Segregation.
Finally, I thank my son Sasha and my friend Steve McClure, who supported and
encouraged me throughout this research.
Page 6
v
TABLE OF CONTENTS
Page
List of Tables ................................................................................................................... viii List of Figures .................................................................................................................... ix
Abstract ............................................................................................................................... x
CHAPTER ONE: INTRODUCTION ................................................................................. 1
CHAPTER TWO: SEGREGATION PATTERNS, NORTH AND SOUTH ................... 13 2.1 Residential Patterns ................................................................................................. 13
2.2 Occupational Patterns .............................................................................................. 17
2.3 Business Patterns ..................................................................................................... 18
CHAPTER THREE: QUANTITATIVE DATA USED IN THE STUDY ....................... 23 Introduction ................................................................................................................... 23
3.1 Aggregate census data ............................................................................................. 23
3.1.1 Description........................................................................................................ 24
3.1.2 Source ............................................................................................................... 25
3.1.3 Converting aggregate data to an Excel database .............................................. 25
3.2 Manuscript census data ........................................................................................... 26
3.2.1 Description........................................................................................................ 26
3.2.2 Source ............................................................................................................... 26
3.2.3 Converting manuscript data to an Excel database ............................................ 28
CHAPTER FOUR: QUALITATIVE DATA USED IN THE STUDY ............................ 30 Introduction ................................................................................................................... 30
4.1 Interviews ................................................................................................................ 30
4.1.1 Sampling method .............................................................................................. 30
4.1.2 Participants ....................................................................................................... 31
4.1.3 Interview procedures ........................................................................................ 33
4.1.4 Process interview data using grounded theory techniques ............................... 33
4.1.5 Strategies for enhancing rigor........................................................................... 33
4.2 Oral Histories .......................................................................................................... 35
4.2.1 Sources of oral histories ................................................................................... 36
Page 7
vi
4.2.2 Processing oral histories using grounded theory techniques ............................ 36
4.3 Cross referenced telephone books ........................................................................... 36
4.3.1 Source of telephone books ................................................................................ 39
4.4 Land deeds............................................................................................................... 39
4.4.1 Source of land deeds ......................................................................................... 39
CHAPTER FIVE: RESIDENTIAL PATTERNS ............................................................. 40 5.1 Abstract ................................................................................................................... 40
5.1.1 Background ....................................................................................................... 40
5.1.2 Methods ............................................................................................................ 40
5.1.3 Results .............................................................................................................. 41
5.1.4 Conclusions ...................................................................................................... 41
5.2 Background ............................................................................................................. 41
5.3 Methods ................................................................................................................... 46
5.3.1 Data Collection Methods .................................................................................. 46
5.3.2 Data analysis methods ...................................................................................... 49
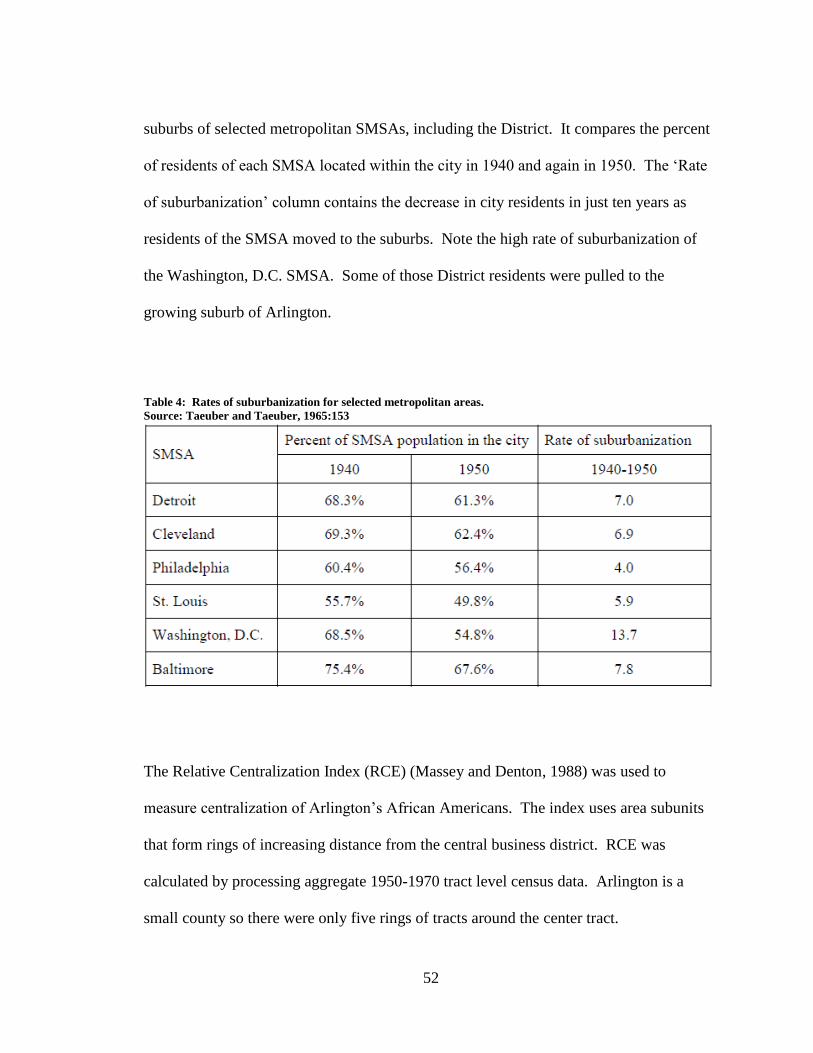
5.4 Results ..................................................................................................................... 50
5.4.1 Centralization.................................................................................................... 51
5.4.2 Clustering.......................................................................................................... 55
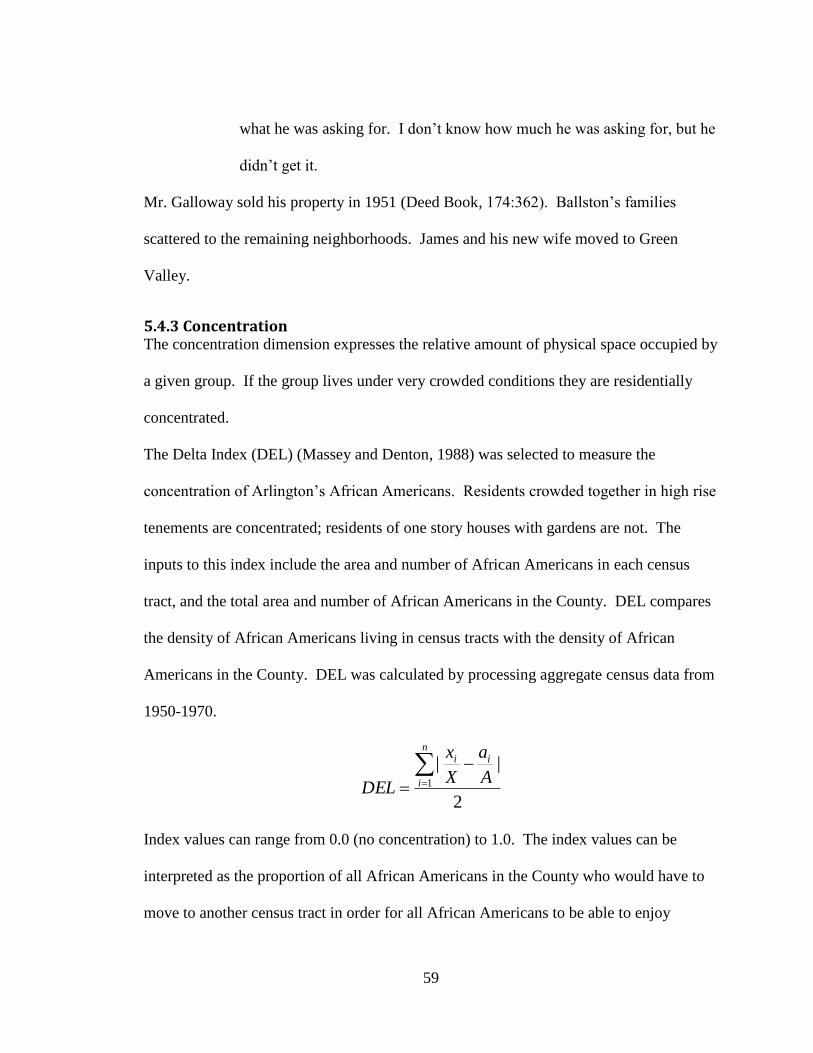
5.4.3 Concentration.................................................................................................... 59
5.4.4 Evenness ........................................................................................................... 61
5.4.5 Exposure ........................................................................................................... 67
5.5 Discussion ............................................................................................................... 69
5.6 Conclusions ............................................................................................................. 73
CHAPTER SIX: OCCUPATIONAL CHOICE ................................................................ 75 6.1 Abstract ................................................................................................................... 75
6.1.1 Background ....................................................................................................... 75
6.1.2 Methods ............................................................................................................ 75
6.1.3 Results .............................................................................................................. 75
6.1.4 Conclusions ...................................................................................................... 76
6.2 Background ............................................................................................................. 76
6.3 Methods ................................................................................................................... 81
6.3.1 Data collection methods ................................................................................... 81
6.3.2 Data analysis methods ...................................................................................... 82
Page 8
vii
6.4 Results ..................................................................................................................... 83
6.4.1 Preparing for work – career training opportunities .......................................... 83
6.4.2 Laboring on the farms....................................................................................... 87
6.4.3 Working in the brick yards ............................................................................... 88
6.4.4 General laborers and domestic workers ............................................................ 93
6.4.5 Working for the federal government in the Civil Service ................................ 95
6.4.6 Working in Arlington – 1950-1970 ................................................................ 102
6.5 Discussion ............................................................................................................. 105
6.6 Conclusions ........................................................................................................... 107
CHAPTER SEVEN: BUSINESSES ............................................................................... 108
7.1 Abstract ................................................................................................................. 108
7.1.1 Background ..................................................................................................... 108
7.1.2 Methods .......................................................................................................... 109
7.1.3 Results ............................................................................................................ 109
7.1.4 Conclusions .................................................................................................... 109
7.2 Background ........................................................................................................... 110
7.3 Methods ................................................................................................................. 110
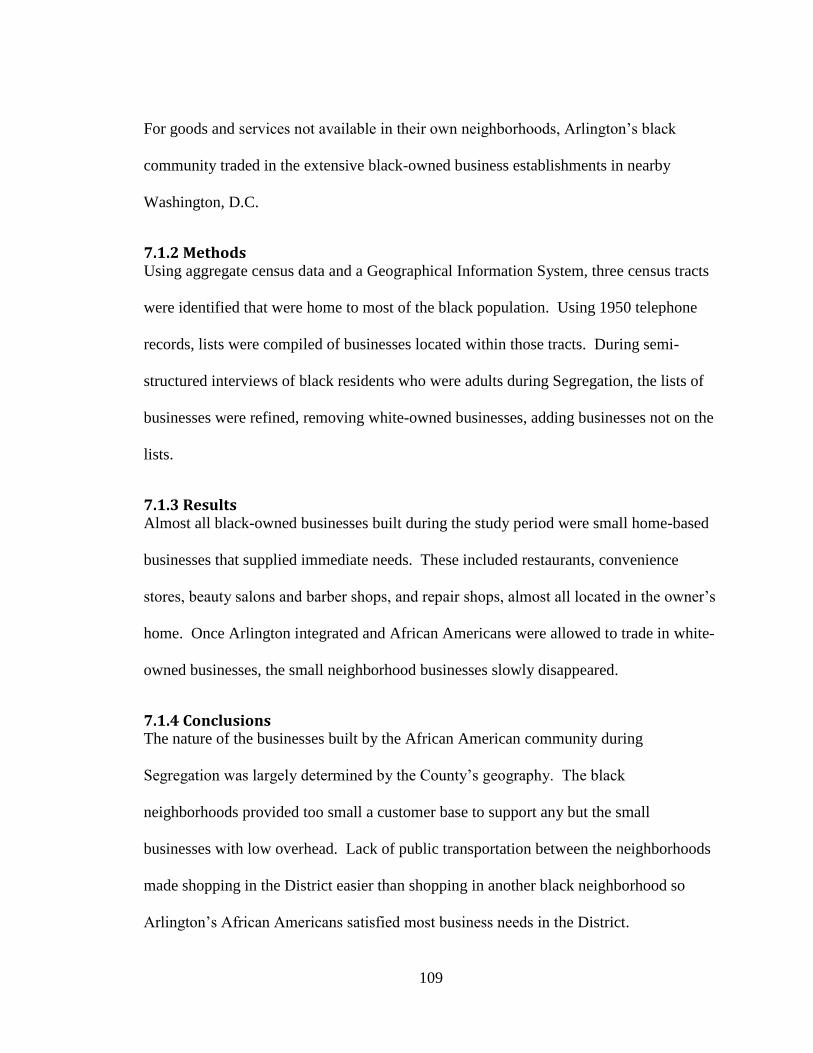
7.4 Results ................................................................................................................... 114
7.4.1 Food ................................................................................................................ 116
7.4.2 Housing ........................................................................................................... 119
7.4.3 Transportation ................................................................................................. 120
7.4.4 Personal Services ............................................................................................ 121
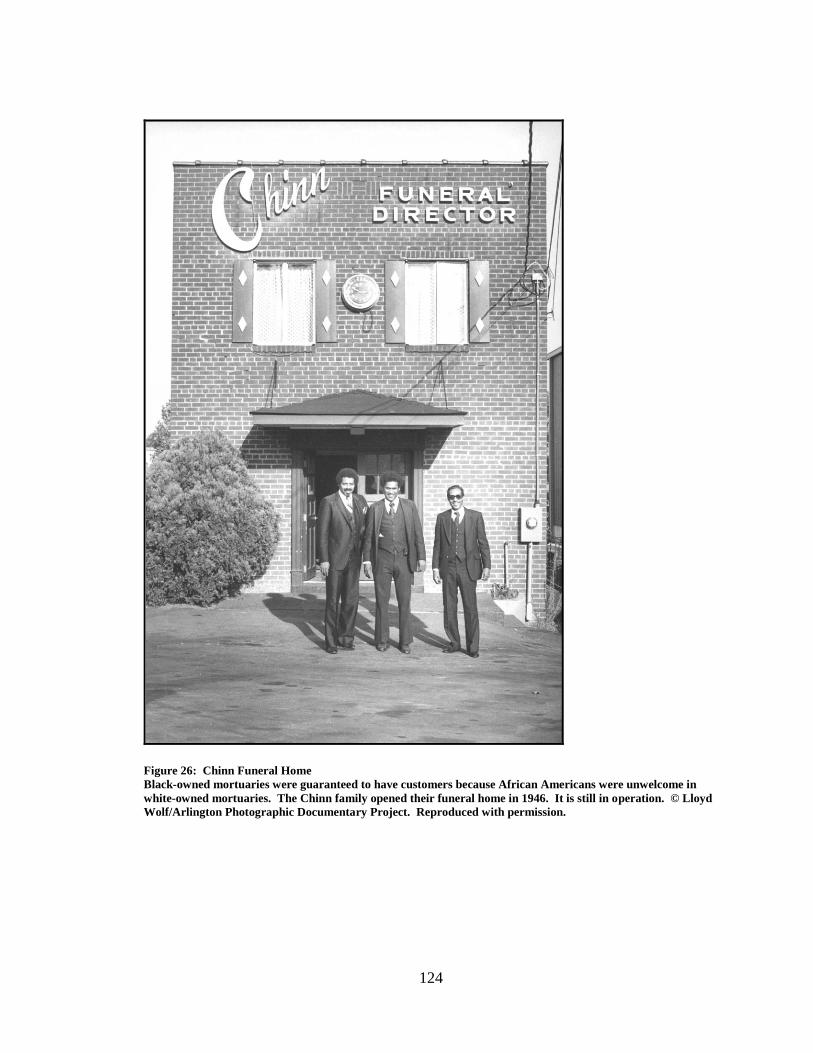
7.4.5 Professional Services ...................................................................................... 123
7.4.6 Impact of desegregation on the black-owned businesses ............................... 125
7.5 Discussion ............................................................................................................. 127
7.6 Conclusions ........................................................................................................... 128
CHAPTER EIGHT: CONCLUSIONS ........................................................................... 130
CHAPTER NINE: EPILOGUE ...................................................................................... 133 Appendix ......................................................................................................................... 137
References ....................................................................................................................... 141
Page 9
viii
LIST OF TABLES
Table Page
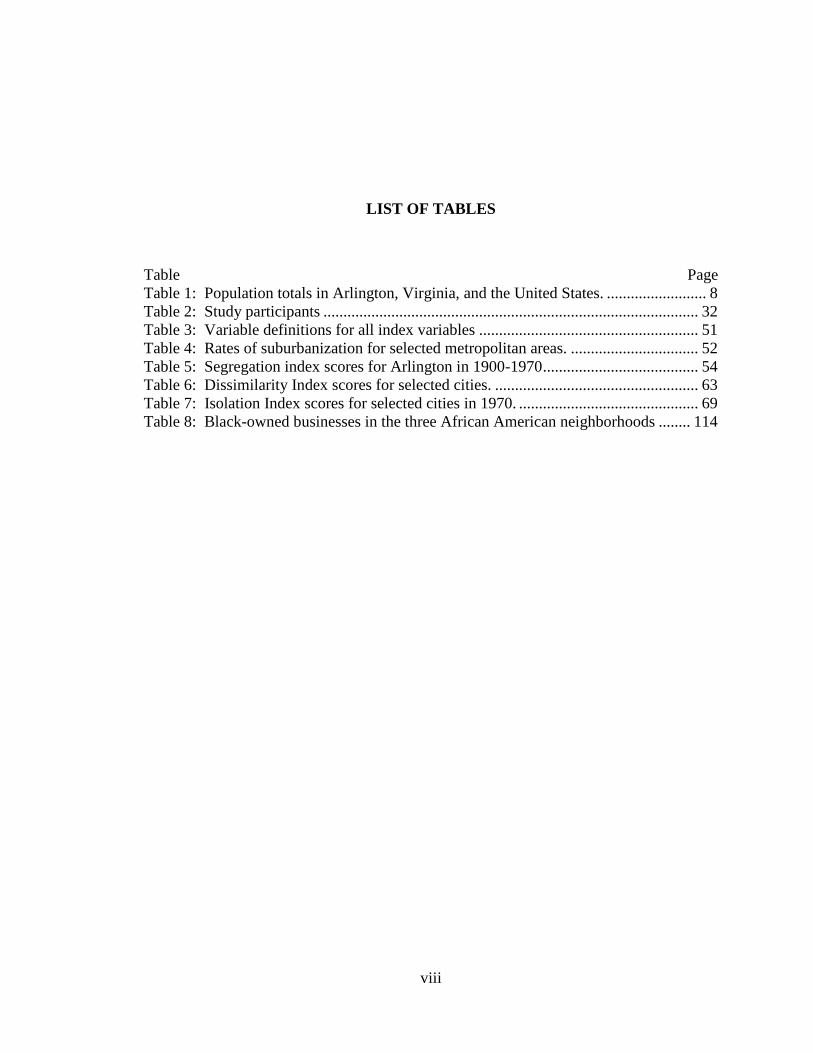
Table 1: Population totals in Arlington, Virginia, and the United States. ......................... 8 Table 2: Study participants .............................................................................................. 32
Table 3: Variable definitions for all index variables ....................................................... 51
Table 4: Rates of suburbanization for selected metropolitan areas. ................................ 52
Table 5: Segregation index scores for Arlington in 1900-1970 ....................................... 54 Table 6: Dissimilarity Index scores for selected cities. ................................................... 63 Table 7: Isolation Index scores for selected cities in 1970. ............................................. 69 Table 8: Black-owned businesses in the three African American neighborhoods ........ 114
Page 10
ix
LIST OF FIGURES
Figure Page
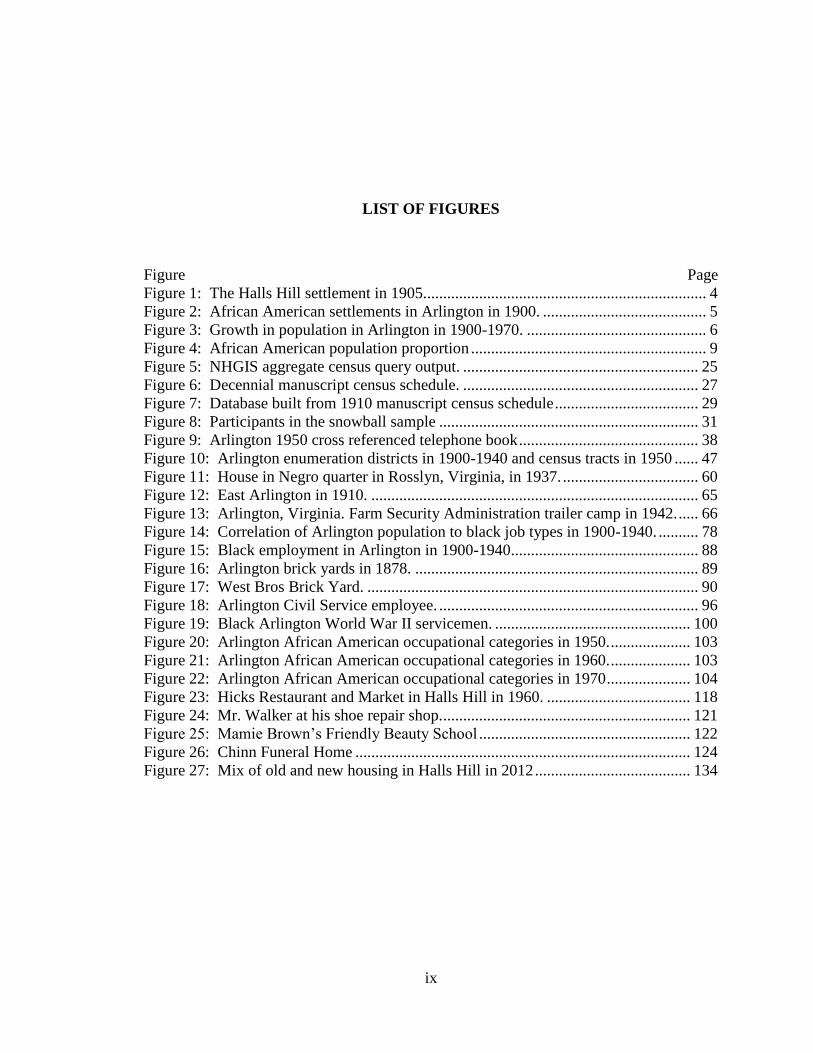
Figure 1: The Halls Hill settlement in 1905....................................................................... 4 Figure 2: African American settlements in Arlington in 1900. ......................................... 5
Figure 3: Growth in population in Arlington in 1900-1970. ............................................. 6
Figure 4: African American population proportion ........................................................... 9
Figure 5: NHGIS aggregate census query output. ........................................................... 25 Figure 6: Decennial manuscript census schedule. ........................................................... 27 Figure 7: Database built from 1910 manuscript census schedule .................................... 29 Figure 8: Participants in the snowball sample ................................................................. 31
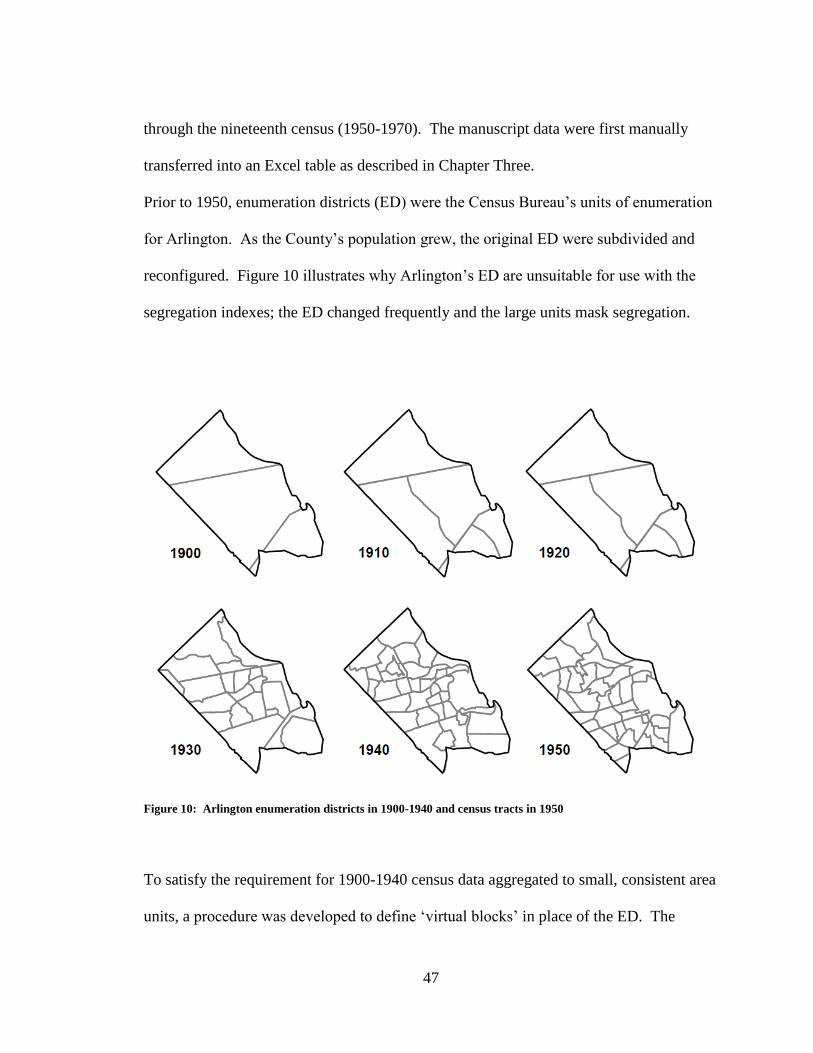
Figure 9: Arlington 1950 cross referenced telephone book ............................................. 38 Figure 10: Arlington enumeration districts in 1900-1940 and census tracts in 1950 ...... 47
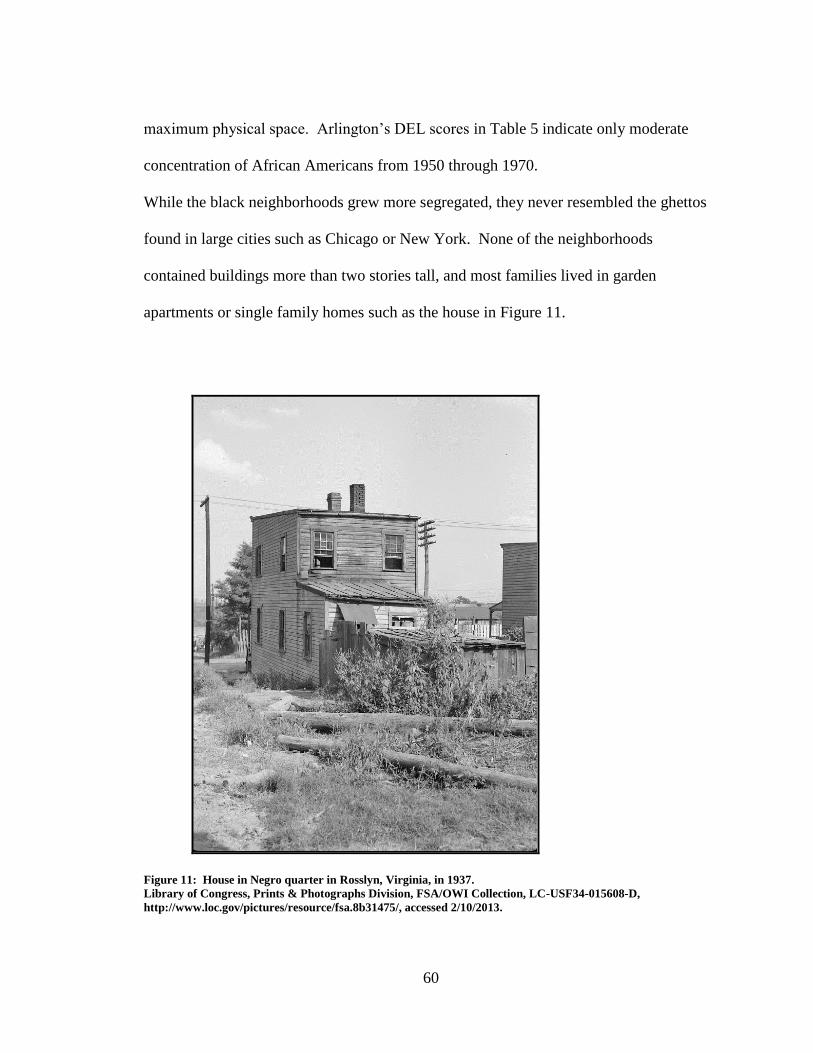
Figure 11: House in Negro quarter in Rosslyn, Virginia, in 1937. .................................. 60 Figure 12: East Arlington in 1910. .................................................................................. 65 Figure 13: Arlington, Virginia. Farm Security Administration trailer camp in 1942. ..... 66
Figure 14: Correlation of Arlington population to black job types in 1900-1940. .......... 78 Figure 15: Black employment in Arlington in 1900-1940 ............................................... 88
Figure 16: Arlington brick yards in 1878. ....................................................................... 89 Figure 17: West Bros Brick Yard. ................................................................................... 90
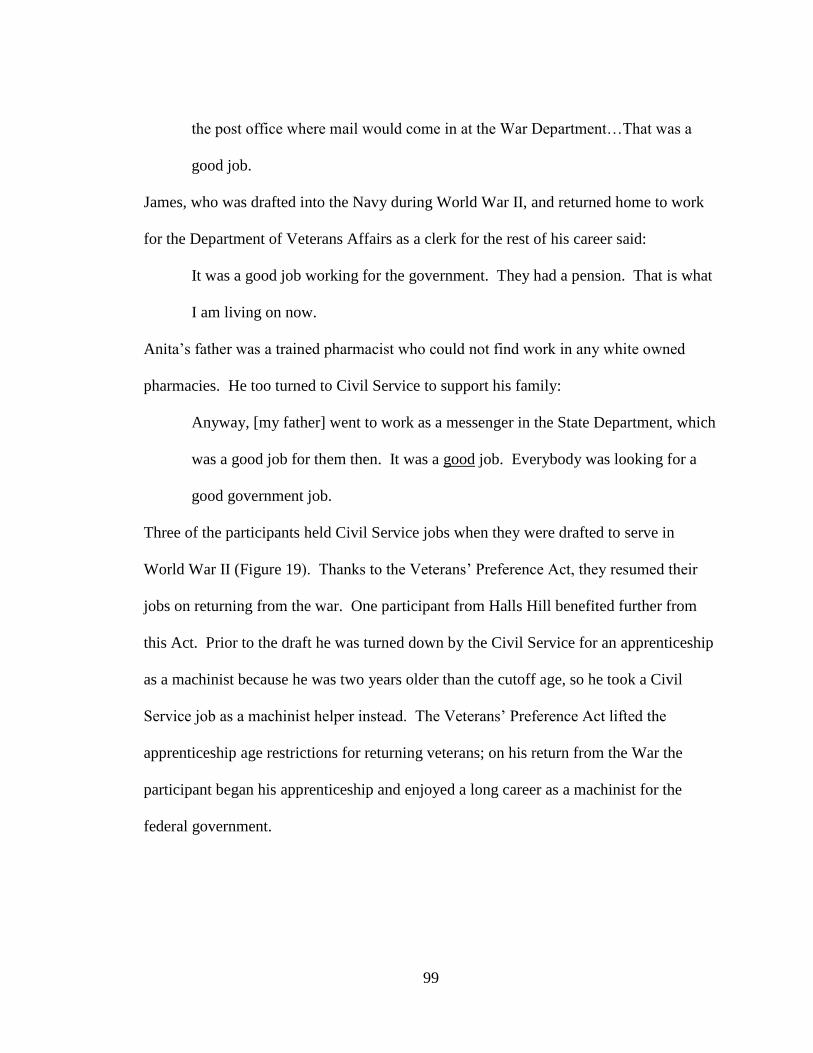
Figure 18: Arlington Civil Service employee. ................................................................. 96 Figure 19: Black Arlington World War II servicemen. ................................................. 100
Figure 20: Arlington African American occupational categories in 1950. .................... 103 Figure 21: Arlington African American occupational categories in 1960. .................... 103
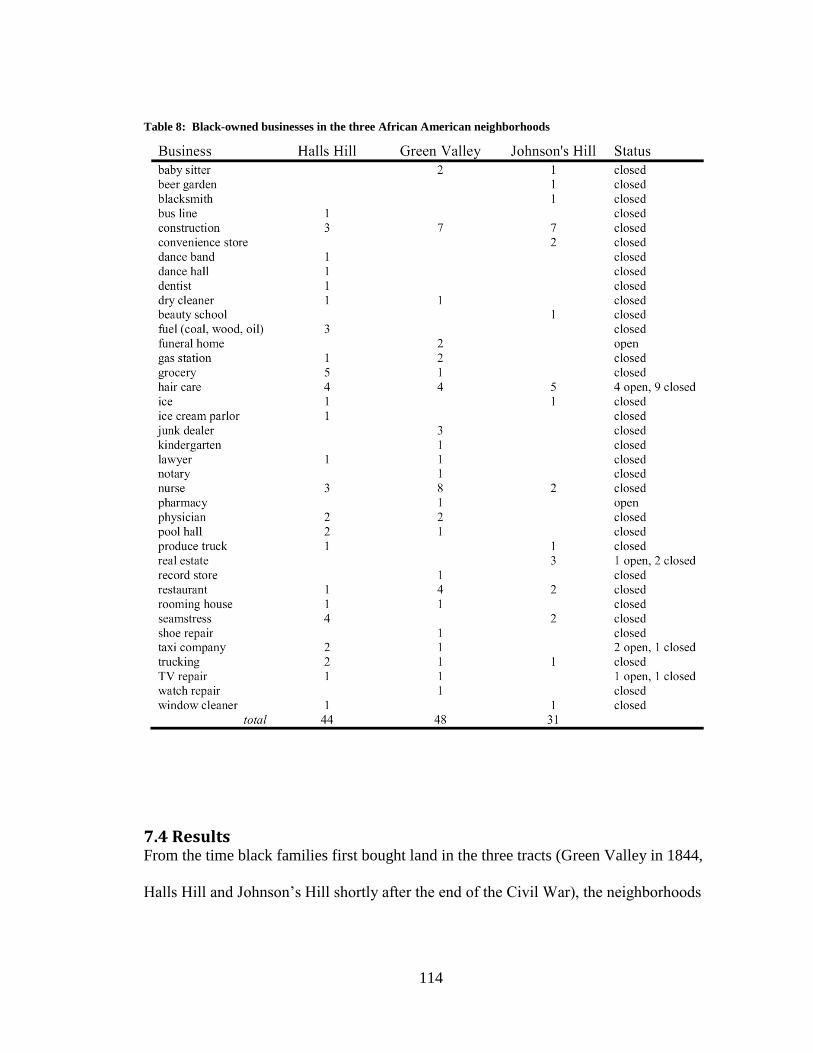
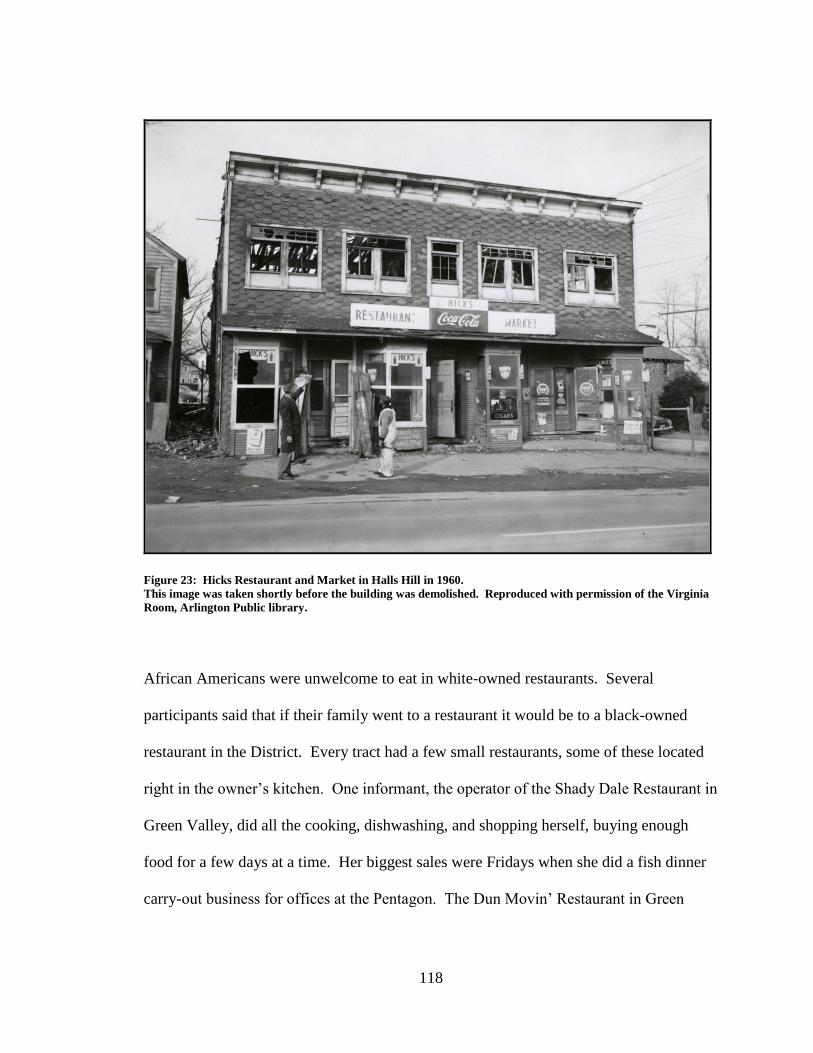
Figure 22: Arlington African American occupational categories in 1970 ..................... 104 Figure 23: Hicks Restaurant and Market in Halls Hill in 1960. .................................... 118 Figure 24: Mr. Walker at his shoe repair shop............................................................... 121 Figure 25: Mamie Brown’s Friendly Beauty School ..................................................... 122 Figure 26: Chinn Funeral Home .................................................................................... 124
Figure 27: Mix of old and new housing in Halls Hill in 2012 ....................................... 134
Page 11
x
ABSTRACT
THE INFLUENCE OF GEOGRAPHY ON THE LIVES OF AFRICAN AMERICAN
RESIDENTS OF ARLINGTON COUNTY, VIRGINIA, DURING SEGREGATION
Nancy Perry, Ph.D.
George Mason University, 2013
Dissertation Director: Dr. Nigel M. Waters
Most scholarship on racial segregation in U.S. cities retraces the Great Migration from
the rural South to the urbanizing, industrializing North. It identifies residential,
occupational, and entrepreneurial patterns typical of the South, and very different
residential, occupational, and entrepreneurial patterns typical of the North. Arlington
County, Virginia, adjacent to the federal government and to the large, prosperous African
American community in Washington, D.C., provides a unique opportunity to study
processes that transcended this dichotomy. Combining both qualitative and quantitative
research methods and mixed data sources, this program of research discovered that life
for African Americans in Arlington, Virginia, during Segregation was largely determined
by the County’s unique context.
Using 1900-1940 manuscript census data, 1950-1970 aggregate census data, and
segregation indexes the study measured five dimensions of segregation and discovered
Page 12
xi
high residential segregation resembling neither Northern nor Southern patterns. The
results of the indexes demonstrated that some indexes are inappropriate for measuring
segregation in Arlington. The study introduced a new procedure for aggregating
manuscript census data for use with the indexes. Semi-structured interviews and oral
histories of Arlington’s elderly black residents documented the influence that proximity
to the federal government had on Arlington’s residential patterns.
Scholarship on occupational choice describes the enormous impact that environment
plays on such choices. This program of research studied the impact, both positive and
negative, that two phenomena in the environment of African Americans in Arlington –
Segregation and proximity to the federal government – had on occupational choice for
the African American community as Arlington grew from a scattering of farm settlements
to a prosperous white suburb of Washington, D.C. (the District). The District’s black
high schools offered excellent career training and the government offered Civil Service
employment. The arrival in Arlington of the Pentagon and large numbers of white
federal workers provided new sources of employment, but obliterated existing farm and
brick factory work.
During Segregation Arlington’s African Americans were limited to living and doing
business in three of the County’s 38 census tracts. This program of research discovered
that neither the entrepreneurial patterns typical of Northern nor those of Southern cities
were found in Arlington’s African American community. Using census data, interviews,
and telephone books this study explored the businesses built by entrepreneurial African
Americans in Arlington during Segregation. It discovered that the black neighborhoods
Page 13
xii
were dispersed, lacking public transportation, with insufficient customers to support the
self-contained business infrastructure found in many segregated cities of similar size.
Conversely Arlington’s black residents were welcomed in the extensive black-owned
business infrastructure of nearby Washington, D.C.
The study concluded that Arlington’s geography, its location on the border between
North and South and its proximity to the federal government influenced the residential
patterns, the occupational choices, and the entrepreneurial activities of its African
American community during the years of Segregation.
Page 14
1
CHAPTER ONE: INTRODUCTION
Arlington has been home to African Americans since the 1600s when slaves worked on
tobacco farms (Rose, 2009). Some black Arlingtonians are descendants of the original
slaves, living on land their ancestors purchased from their masters at the end of the Civil
War (Netherton and Netherton, 1987; Rose, 2009). Several of the study participants trace
their roots back to Virginia slaves.
Symptomatic of Virginia’s long struggle with racial issues was its inability to define race.
In 1866 Virginia law stated “Every person having one-fourth or more Negro blood shall
be deemed a colored person” (Guild, 1969:33). In 1910 Virginia revised the definition,
declaring “Every person having one-sixteenth or more Negro blood shall be deemed a
colored person” (Guild, 1969:35). Finally in 1930 the State made up its mind “Every
person in whom there is ascertainable any Negro blood shall be deemed a colored
person” (Guild, 1969:35).
Determining the correct definition of race was vitally important. In 1900 Virginia’s
African Americans and whites could not attend the same schools. They could not sit on
steamboats, motorcars, or trains together. They could not be quartered together in
penitentiaries. They could not sit together in “any public hall, theatre, motion picture,
show, or any place of public entertainment or assemblage” (Guild, 1969:145-149). If
Page 15
2
they were to intermarry, they would “be guilty of a felony and be confined in the
penitentiary for from one to five years” (Guild, 1969:36).
Arlington County has been at the center of that struggle. Arlington is on the margin
between North and South. It is in a culturally “Southern” state, yet it lies in close
proximity to Washington D.C. In fact, from the 1801 Act when Virginia ceded Arlington
to the federal government until 1846 when the Act of Retrocession gave the County back
to Virginia, Arlington was a portion of the District of Columbia. Like the rest of
Virginia, once a part of the Confederate States of America, Arlington has a long history
of racial segregation.
During the Civil War, runaway slaves – contraband – fled to the District seeking safety.
Unable to accommodate so many penniless refugees in the District, the government built
villages for them. Freedmen’s Village was built in 1863 on the grounds of Robert E.
Lee’s former plantation in Arlington (Green, 1967). When Freedmen’s Village closed in
1888, many of the residents moved further into Arlington to live. A few of the study
participants are descendants of those residents.
After the Civil War some former slaves from Georgia and the Carolinas migrated north
along the Atlantic coast (Rose, 1969). Some of those migrants settled in the District and
a few settled in Arlington (Green, 1967). In 1900, 2.6 percent of Arlington’s African
Americans had roots in this migration, including a few of the study participants.
From 1910 to 1970 the sociological phenomenon referred to as the Great Migration
occurred, when between six and seven million rural, Southern African Americans
migrated to cities, mostly in the North (Crew, 1987). While industrial Northern cities
Page 16
3
were the destination of most of the migrants, some came to the Washington, D.C. area.
Few, however, moved to Arlington. In 1940, only twelve percent of Arlington’s African
American community, including one of the study participants, had roots in a Southern
state other than Virginia.
By 1900 Arlington was on the cusp of transformation from farmland to a white suburb.
The County was lightly populated; about 38 percent of the residents were African
American. They lived in several small settlements and three black neighborhoods (Halls
Hill, Johnson’s Hill, and Green Valley), each neighborhood growing individually when a
specific farm was subdivided and sold. An Arlington County historian describes the
County at this time (Rose, 2009:145):
Arlington County in 1900 had much open area and many farms but it was
evolving from a strictly rural area to a suburban community. However,
many of the amenities of life were still to come. Wells were still the
source of water and outhouses or septic tanks took care of sanitation.
There was no water or sewer system in the County. Gas might be used for
illumination in the cities, but not in Arlington where kerosene lamps were
still the rule.
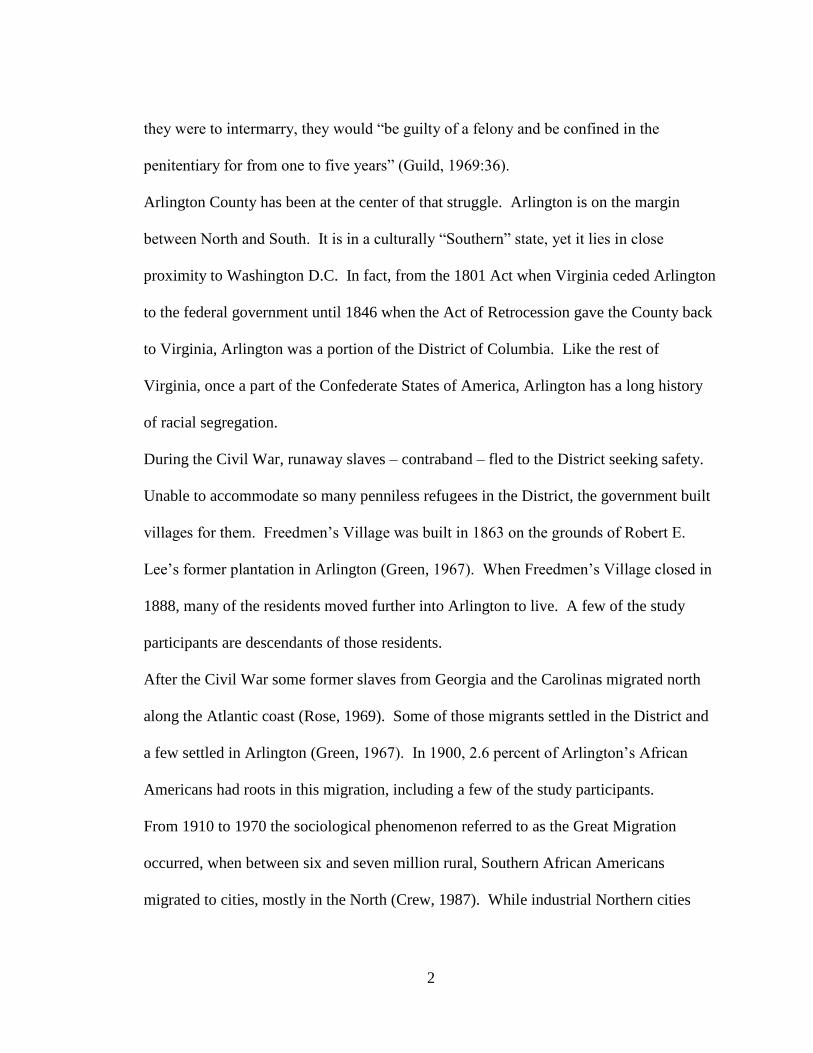
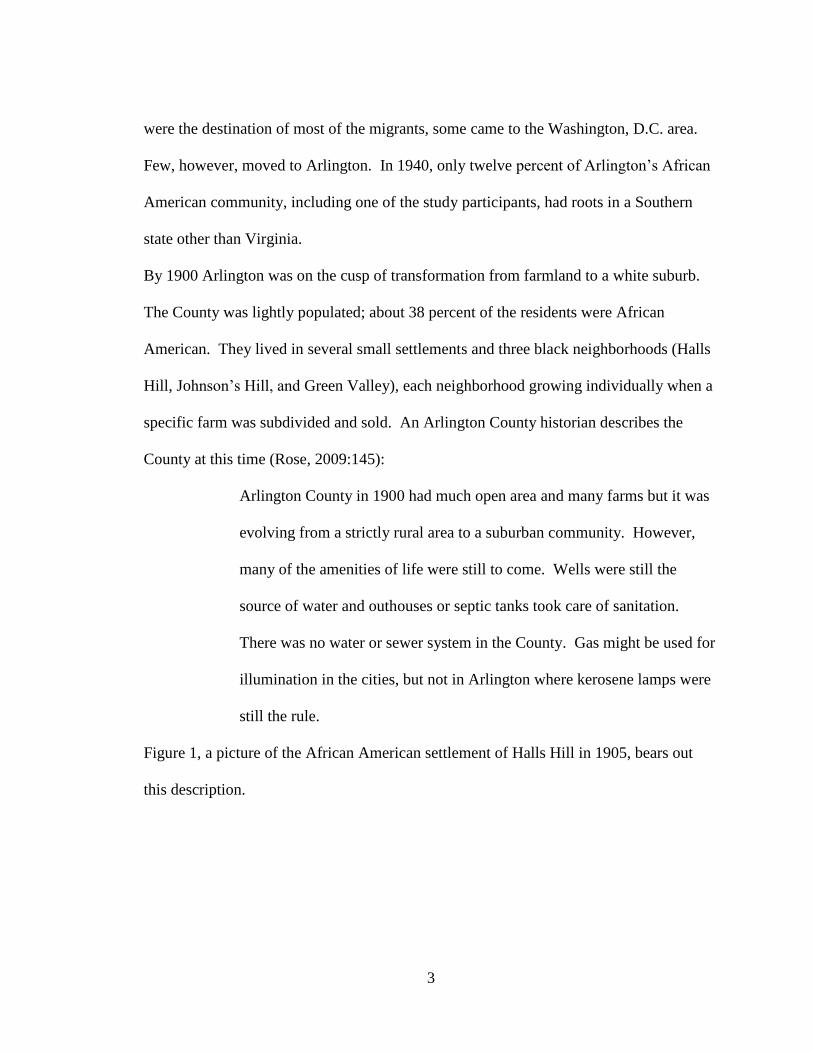
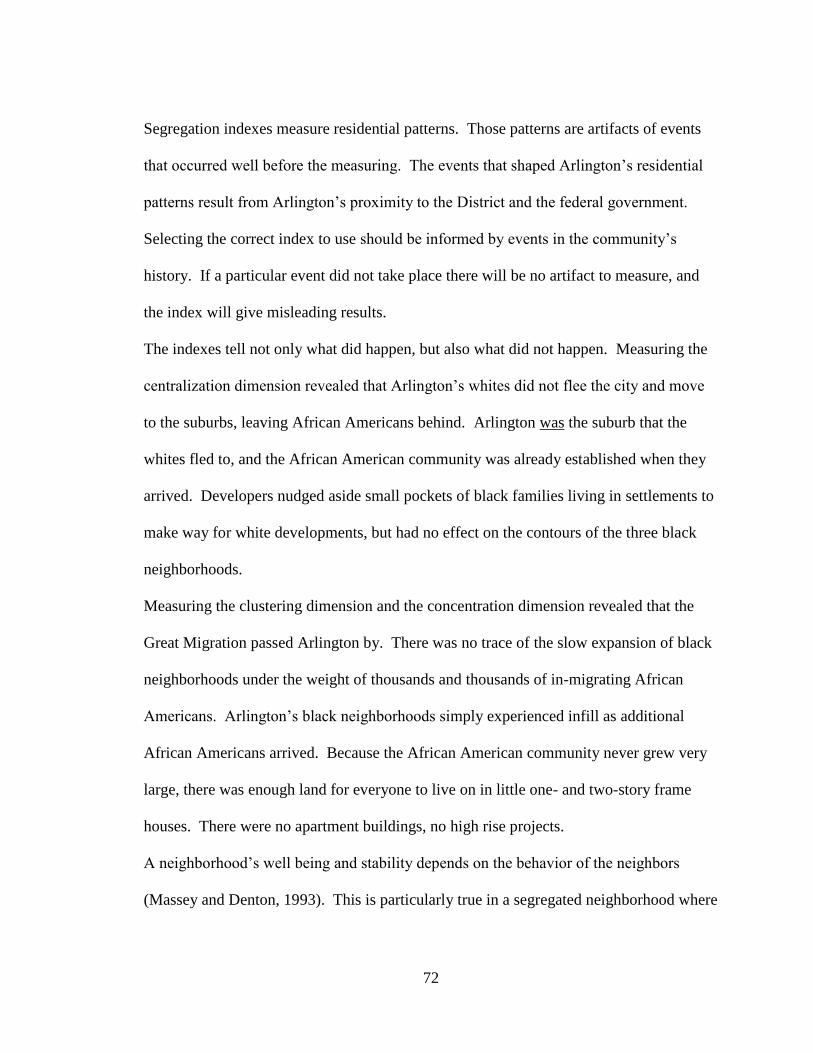
Figure 1, a picture of the African American settlement of Halls Hill in 1905, bears out
this description.
Page 17
4
Figure 1: The Halls Hill settlement in 1905.
Reproduced with permission of the Virginia Room, Arlington Public Library.
Until legislation during the Civil Rights Era required it, official Arlington County
neglected the African American community, spent little on black schools, refused to grant
licenses to most black businesses, and failed to pave streets (Morris, 2001) or run water
and sewer pipes in black neighborhoods (Rose, 2009).
At the turn of the twentieth century roads were built, and two new electric railroads
connected the County to itself and to the District. On the heels of the railroads came
developers promoting subdivisions for residential development. The black
neighborhoods remain; all but one of the black settlements have since disappeared.
Page 18
5
Figure 2 is a map of the County and the black settlements and neighborhoods. Chapter
Five discusses the fate of those settlements.
Figure 2: African American settlements in Arlington in 1900.
Map by Nancy Perry, projection NAD 1983 UTM Zone 18N.
Beginning with the buildup of the government workforce during World War I, many
white federal workers moved out of the District, creating suburbs in outlying areas of
Page 19
6
Maryland and Virginia. The influx of white federal workers into Arlington, similar to the
migration described by Lassiter and Niedt (2012), intensified during the New Deal and
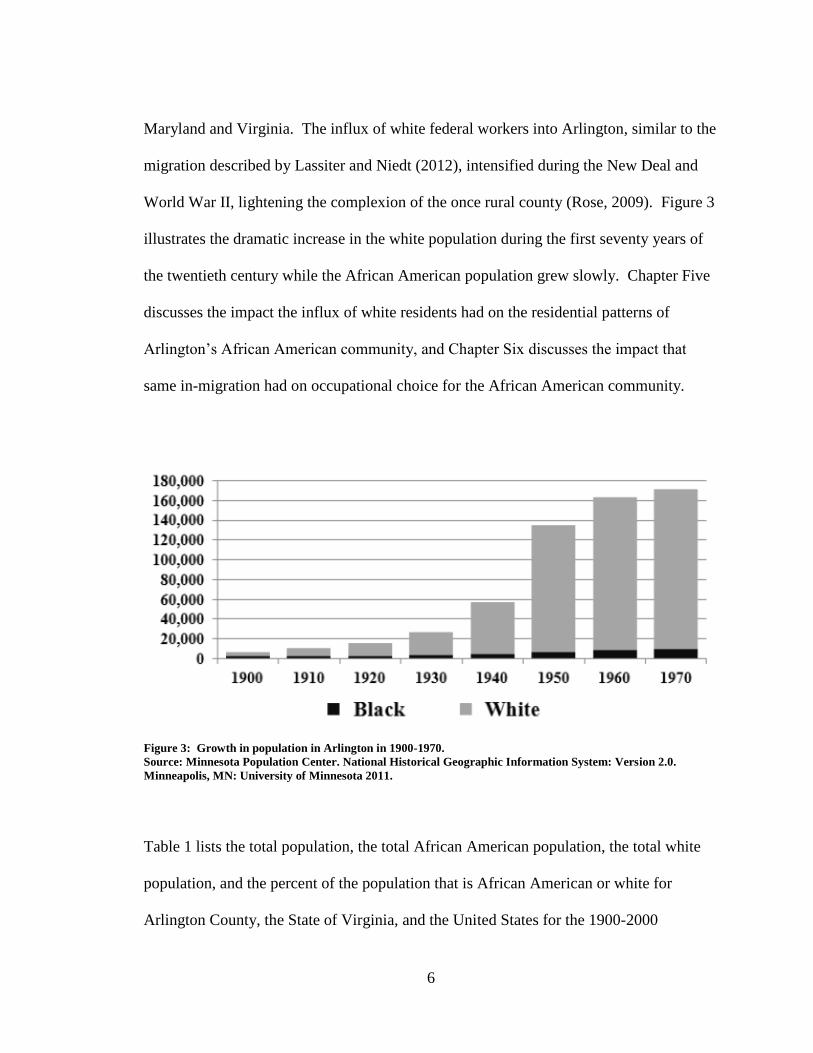
World War II, lightening the complexion of the once rural county (Rose, 2009). Figure 3
illustrates the dramatic increase in the white population during the first seventy years of
the twentieth century while the African American population grew slowly. Chapter Five
discusses the impact the influx of white residents had on the residential patterns of
Arlington’s African American community, and Chapter Six discusses the impact that
same in-migration had on occupational choice for the African American community.
Figure 3: Growth in population in Arlington in 1900-1970.
Source: Minnesota Population Center. National Historical Geographic Information System: Version 2.0.
Minneapolis, MN: University of Minnesota 2011.
Table 1 lists the total population, the total African American population, the total white
population, and the percent of the population that is African American or white for
Arlington County, the State of Virginia, and the United States for the 1900-2000
Page 20
7
censuses. Virginia, a Southern state, has always had a higher proportion of African
Americans than the United States. At the beginning of Segregation, Arlington’s
proportion of African Americans was higher than that of the State of Virginia, but as
Arlington grew into a white suburb, the proportion of African Americans fell rapidly until
by 1940 the proportion of African Americans was not only lower than that of the State,
but also lower than that of the United States. The proportion of African Americans
gradually rose in Arlington at the end of Segregation, but remains lower than the levels of
both the State and the United States. Figure 4 illustrates these trends, depicting the
proportion of African Americans in the County, the State, and the United States.
Page 21
8
Table 1: Population totals in Arlington, Virginia, and the United States.
Source: Minnesota Population Center. National Historical Geographic Information System: Version 2.0.
Minneapolis, MN: University of Minnesota 2011.
Page 22
9
Figure 4: African American population proportion
in Arlington, in Virginia, and in the United States in 1900-2000
This study discusses only two races – African American and white. Prior to the end of
Segregation in the mid 1960s Arlington was home to virtually no other race. Even as late
as the 1980 census the entire County had only two percent residents of other races.
This study will show how Arlington’s geography, its proximity to the District of
Columbia and its historical membership in the Confederacy influenced the lives of its
black residents long after the Civil War was over. The goal of the program is to use
mixed methods, both qualitative and quantitative, to explore the impact of geography on
the lives of the African American community. This goal will be achieved through three
sub-studies:
1. During Segregation Arlington changed from a fairly integrated collection of
small settlements to a very segregated suburb of the District. Analyze
Page 23
10
Arlington’s residential pattern and explore how proximity to the District
influenced that pattern to answer the following research questions:
What were the residential patterns of Arlington’s African
American community during Segregation?
In what ways were the residential patterns influenced by
Arlington’s geography?
2. During Segregation African Americans had limited occupational choices.
Childhood is the period when individuals go through a series of stages in
winnowing out unsuitable occupational choices. Explore the types of
occupations worked by Arlington’s African Americans and the ways that their
occupational choices were influenced by Arlington’s proximity to the District
to answer the following research questions:
What types of employment did Arlington’s African Americans engage
in during Segregation?
In what ways were black employment choices influenced by
Arlington’s geography?
3. During Segregation African Americans were unwelcome in Arlington’s white-
owned businesses establishments. Analyze the entrepreneurial activities of
African Americans in Arlington during Segregation to answer the following
research questions:
What types of businesses were built by Arlington’s African American
community during Segregation?
Page 24
11
In what ways were the types of businesses built by the African
American community influenced by Arlington’s geography?
This dissertation is divided into nine chapters. The rationale of the study is best
described by an overview of the literature, found in Chapter Two. It examines three
specific contexts: residential patterns, occupational choice, and entrepreneurship,
comparing in each instance the context for African Americans living in the North and
African Americans living in the South. This study employs mixed research methods,
qualitative methods where appropriate and quantitative methods where appropriate, to get
a rich understanding of the situation of segregation for a unique community living in a
unique geography. Chapter Three discusses the quantitative data sources, consisting of
census data in two formats – manuscript census schedules for the 1900-1940 censuses
and aggregate data for the 1950-1970 censuses. The chapter describes the source and the
format of each census data type and outlines the process used by this study to aggregate
data in the manuscript census schedules, converting it to a format that can be used by
segregation indexes for measuring the degree of residential segregation. Chapter Four
discusses the qualitative data sources used in the study: interviews, oral histories,
historical telephone books, and land records. The chapter describes the methods
employed to process and analyze data from each of these data sources. Chapters Five,
Six, and Seven provide the findings of the three sub-studies in the form of original
research papers (one published, two under review) that were undertaken during the
course of this program of research. Chapter Eight provides a summary of the conclusions
Page 25
12
drawn from the research. Finally, Chapter Nine describes residential patterns,
occupational choice, and entrepreneurship since the end of Segregation.
Note: The race of people studied in this dissertation has been known by many names.
During segregation they were referred to as Colored or Negro. The preferred name
changed to black, popularized by black activist Stokely Carmichael during the Civil
Rights era in the 1960s. At the time of this dissertation’s writing the phrase African
American is winning acceptance. This dissertation uses ‘black’ and ‘African American’
interchangeably. When ‘black’ is used it is not capitalized, as is the word ‘white’ also not
capitalized.
Page 26
13
CHAPTER TWO: SEGREGATION PATTERNS, NORTH AND SOUTH
The previous chapter outlined the framework of the study with an introduction to
Arlington County and Arlington’s African American community. It is instructive to
understand the phenomenon of segregation on a national level before examining the
impact of segregation on Arlington’s African American community. This chapter
provides an overview of the literature about the three subtopics as they pertain to black
life in the entire country. In each subtopic the manifestations of segregation differ in the
North and in the South. Arlington, on the boundary between North and South, was
subject to influences from both major regions.
2.1 Residential Patterns Sociologists, geographers, and others have long studied residential patterns in cities.
Burgess (1925) envisions concentric socio-economic zones around the city center, with
the status of the household directly related to its distance from the city center. Hoyt’s
variation of Burgess’ socio-economic zones (1939) follows lines of transportation and
high ground radiating out from the city center in a sectoral pattern, with the household’s
financial status inversely related to its distance from these lines. Harris and Ullman
(1945) describe a pattern found in some cities, of several nuclei, rather than the single
city center. Bourne and Murdie (1972), using factor analysis and canonical correlation,
unite these three models using data for Toronto.
Page 27
14
Segregation also leaves its mark on residential patterns. Woofter (1969:37) said about
residential patterns caused by segregation:
Each city has a pattern of its own determined by the percentage of
Negroes in the total, the distribution of Negro employment, the
distribution of the areas where property is within the means of colored
families, the attitude of the people toward segregation, and the rate of
expansion of business and manufacturing sections.
While each city’s pattern is unique, it is also an instance of one of a limited number of
general patterns. Because Segregation played out differently in the North and in the
South, the general residential patterns found in Southern and Northern cities differ.
Prior to 1900, 84 percent of all African Americans lived in the South. After the Civil
War, twenty percent of Southern rural African Americans moved to cities. The
residential patterns of those cities reflect their age. Older cities like Charleston found
African Americans in wealthy as well as poor sections, living near their employers in
alley dwellings or on nearby side streets (Groves and Muller, 1975; Massey and Denton,
1993), a remnant of earlier times when slaves lived near their masters. As more African
Americans arrived, the dispersed pattern blurred and black urban clusters formed, both
within the city and along the boundaries, often on the least desirable land (Ingham, 2003;
Kusmer, 1976). Younger Southern cities like Birmingham, lacking the tradition of slaves
living near their owners, exhibited this segregated pattern from the beginning (Groves
and Muller, 1975; Wilson 2000).
Page 28
15
During this same period, Northern cities displayed the Southern residential pattern of
small black enclaves and alley residences dispersed within larger white neighborhoods,
giving residents access to employment (Massey and Denton, 1993). African Americans
were segregated more by economics than by race (Johnson, 1970); most African
Americans worked in menial, low paying jobs and lived in relatively integrated
neighborhoods (Massey and Denton, 1993). Professional African Americans - doctors,
lawyers, ministers - sometimes lived in predominantly white areas. Black servants often
lived with their white employer, giving a further impression of integration (Groves and
Muller, 1975). Some Southern African Americans migrated to Northern cities, moving
into existing black neighborhoods. The neighborhoods gradually expanded into
adjoining white neighborhoods as former white owners moved up to better housing
(Massey and Denton, 1993).
In the South, with the outbreak of World War I, the trickle of rural African Americans
moving to cities became a flood. At the same time, whites began relocating in the
suburbs, resulting in a new Southern residential pattern – large black residential districts
in the center of some cities (Groves and Muller, 1975; Taeuber and Taeuber, 1965).
Meanwhile, many European immigrants who had kept the wheels in Northern factories
turning during the nineteenth century returned home. A series of legislative acts,
including the National Origins Act of 1924 (Sixty-Eighth Congress, 1925), made
migration to America difficult and reduced the number of immigrant laborers in Northern
factories. Needing a new source of cheap labor, the factories actively recruited Southern
African Americans (Massey and Denton, 1993), resulting in the Great Migration (1910-
Page 29
16
1970) (Rose, 1969; Crew, 1987; Tolnay, 2003; Gregory, 2005). The arrival of so many
black in-migrants threatened the white population. Prejudice, racial violence, and
segregation spawned a new Northern residential pattern, the ghetto. Unable to absorb all
the migrants, black neighborhoods expanded into one large, dense, very black city within
a city (Wilkerson, 2010).
World War II restrictions on new housing construction made the market extremely tight
for both African Americans and whites. After the war, in Southern cities new housing
was built for segregated occupation. Particularly in smaller Southern cities, because there
was less in-migration, vacant land was available for construction. Southern African
Americans often moved into new homes rather than into the older homes of upward
bound white families (Taeuber and Taeuber, 1965). At the same time, Northern whites
fled to the suburbs, leaving behind a pool of older housing for African Americans. As
was the typical pattern in the North, African Americans assumed previously white-owned
housing, easing the congestion in the ghettos.
De jure residential segregation existed until passage of the Fair Housing Act of 1968, and
de facto residential segregation exists in some localities even today. Segregation
developed in each community reflecting the community’s context. Arlington had a
unique context - a border state community with roots in the South but with influences
from the North and from the nearby federal government. Chapter Five explores the
residential patterns exhibited by the African American community in Arlington.
Residential segregation is measured in Arlington during the 1900-1970 study period
Page 30
17
using widely used and respected segregation indexes, and the reasons are explained for
the scores that Arlington gets on those indexes.
2.2 Occupational Patterns In 1870, 80 percent of all African Americans lived in the rural South (Massey and
Denton, 1993). After the Civil War, former field slaves, knowing no other profession,
were caught in the endless cycle of sharecropping while former artisan slaves, skilled in
such trades as bricklaying, plastering, and carpentry, fled to the cities (Johnson, 1970).
African Americans in the professions – dentists, lawyers, doctors – were generally
limited to serving other African Americans (Bates et al., 2007).
Job seekers looking for work with local governments relied on political patronage jobs –
jobs often rewarded to potential voters. Until the Fifteenth Amendment to the
Constitution gave them the vote, Southern African Americans had little leverage for
obtaining such positions (Krislov, 1967). After passage of the Pendleton Civil Service
Reform Act of 1883, establishing the classified Civil Service with its merit system based
on competitive examinations, African Americans found work with the federal
government. As a result of this legislation, the proportion of African Americans in
federal service rose from 0.06 percent in 1881, to 5.8 percent in 1910, to 11.9 percent in
1944 (Krislov, 1967).
During the Great Migration (1910-1970) more than six million Southern African
Americans turned their backs on agricultural work, migrating to Northern cities and
seeking employment in industrial plants and factories (Rose, 1969). The District was
Page 31
18
also a destination city, though the number fell far short of the volume migrating to large
industrial cities like Chicago, Cleveland, and Detroit (Green, 1967).
African Americans suffered disproportionately during the Depression. They were often
the first to lose their jobs when a company experienced a downturn (Tabb, 1971). Men
resorted to working as day laborers. When necessary, women worked as domestics in
white homes or did ‘domestic’ work in their own homes - supporting their families as
dressmakers, laundresses, and proprietors of boarding houses.
When the United States was drawn into World War II almost no African Americans were
among the 1,400,000 additional workers accepted to training programs and defense
contracts to build ships, aircraft, ordnance, and the other infrastructure required to
conduct a war (Johnson, 1970). After black leaders threatened to march on Washington
D.C. (Krislov, 1967), President Roosevelt issued Executive Order 8802, forcing
government agencies and defense contractors to open up opportunities for African
Americans to serve their country at home in factories as well as on the battlefield
(Krislov, 1967).
Chapter Six examines the theories social scientists have advanced of occupational choice.
The chapter explores the occupations chosen by African Americans living in Arlington
during Segregation, and explains the influences that Arlington’s geography, Arlington’s
proximity to the federal government, had on those choices.
2.3 Business Patterns In America’s complicated racial history, black business ownership has reflected
black status in society (Tabb, 2001). The well documented history of black
Page 32
19
entrepreneurship in older Northern cities with large black populations – whether
the city is Chicago, Cleveland, New York, or Washington D.C. (Drake and
Cayton, 1962; Osofsky, 1966; Kusmer, 1976; Ruble, 2010) - has certain familiar
themes (see also Boyd, 2011). Free black entrepreneurs established shops
providing goods and services before and during Reconstruction (Birmingham,
1977; Bates et al., 2007), often catering to a white rather than a black clientele.
African Americans were constrained in the types of businesses they could build,
but they dominated the fields that were open to them, such as hair care, catering,
tailoring, and shoe repair (Ingham, 2003). There were also limitations imposed
by a lack of financing. To overcome their inability to make business loans they
formed mutual aid societies - fraternal lodges - which grew into insurance
companies and banks (Butler, 2005).
With the in-migration of Europeans in the late 1890s and early 1900, African
Americans lost their monopoly in certain fields that had traditionally been theirs –
e.g. catering (Boyd, 1998; House-Soremekun, 2002). Jim Crow laws, reflecting
growing racial prejudice, made black business ownership increasingly difficult
(Rose, 1985). Beginning around 1915 a massive in-migration of African
Americans from the South intensified crowding in black ghettos and worsened the
already tenuous relations with whites (Wilkerson, 2010). Tabb (1971) compares
the black ghettos to colonies, where a superior group (whites) exploits their
economic control over the inferior group (African Americans), subjugating them
and making them politically dependent. The close dependency relationship that
Page 33
20
black business owners had cultivated with the upper-class white clientele withered
(Massey and Denton, 1993). As opportunities for serving white customers
became problematic, African Americans targeted their businesses toward other
African Americans. Isolated in the ghettos, the black residents made a ready
market for their fellow black entrepreneurs (Aldrich et al., 1985; Boyd, 1998;
Butler, 2005; Boyd, 2010) who built businesses such as grocery stores,
restaurants, banks, and beauty parlors (Light and Rosenstein, 1995; Boyd, 2000b;
Harvey, 2005).
Black businesses suffered disproportionately during the Great Depression. Not
only retail stores, but also black banks and insurance companies collapsed
(Massey and Denton, 1993). Black businessmen with a large, densely packed
minority customer base were more likely to survive (Ingham, 2003). Their
customers were encouraged to display racial loyalty to the black-owned
businesses (Butler, 2005). The disadvantage theory of enterprise posits that when
a minority group is excluded from the labor market, when they cannot get jobs
sufficient to support themselves and their families, they often turn to trade – to
starting a business (Light, 1979; Fischer and Massey, 2000). During the Great
Depression the response of many African Americans, choosing between
joblessness and self-employment, was to become survivalist entrepreneurs –
“persons who become self-employed in response to a desperate need to find an
independent means of livelihood” (Boyd, 2000a:648). Establishing hair care
shops and salons was especially popular as the training was easily available, the
Page 34
21
cost of establishing a shop was low, their customers could not get served in white-
owned hair care shops, and the customers preferred black barbers and hair
dressers who, they felt, could address their special hair care needs (Drake and
Cayton, 1962; Aldrich et al., 1985; Willett, 2000; Boyd, 2000a; Boyd, 2010).
These businesses, often cash-based and unregulated, produced an irregular
income (Boyd, 2000a).
Different factors influenced black commercial development in Southern cities.
There was not a large influx of European immigrants (Taeuber and Taeuber,
1965) into Southern cities. However, they were often the destination for rural
Southern African Americans during the Great Migration. Ingham (2003) suggests
that the shape and size of the business community and the types of businesses
found there reflect the origins of the inhabitants. Southern black communities
tended to be built on undeveloped land on the outskirts of cities. Small service
businesses, and eventually a main business street evolved, with a few ‘anchor
firms’ such as banks, department stores, or insurance companies. These anchor
businesses gave the community stability.
Civil rights legislation was passed in the 1950s and 1960s, opening employment
opportunities for African Americans in the general labor market (Harvey-
Wingfield, 2008). After the mid 1960s black enrollment in colleges increased
dramatically, with more African Americans earning business degrees than any
other degree (Bates, 1997). These new college graduates were less interested in
owning the small personal service businesses their parents and grandparents had
Page 35
22
owned than in establishing high yield niche enterprises (Bates, 1997). Kollinger
and Minniti (2006) found, based on 2002 survey data, that today’s black business-
men and –women, confident in their entrepreneurial skills, are twice as likely to
try starting a business as whites. However, contending with lingering residential
segregation in cities, and lacking the protected market that their parents enjoyed,
many black entrepreneurs struggle to succeed in business (Fairchild, 2008b;
Fairchild, 2008a).
Chapter Seven explores the types of businesses established by African Americans living
in Arlington during Segregation. It explores the influence that proximity to the large and
successful businesses establishments built by the African American community in the
District had on the types of businesses built in Arlington’s black neighborhoods.
Page 36
23
CHAPTER THREE: QUANTITATIVE DATA USED IN THE STUDY
Introduction Census data, both aggregate census data and manuscript census data were incorporated
into the study. Aggregate data were available for the entire study period. These data
have limitations. By definition, aggregate data are combined from many sources. Census
aggregate data are tabulations of rows of data, each row representing one individual. The
aggregate data describe the aggregate of the group, but not individuals within the group.
Manuscript data describe individuals within the group. Manuscript data were available
for the first forty years of the study period. These data also have limitations. They come
in an awkward format and must first be reformatted so they can be manipulated, sorted,
and tabulated – an extremely time consuming process.
3.1 Aggregate census data Aggregate census data identify total counts – the total number of African Americans and
total number of whites living in Arlington each census year, the total number of black
men and the total number of black women per census tract living in Arlington each
census year, the total number of African Americans per census tract working in each of
the Census Bureau’s occupational categories each census year.
This study used data from the 1900-2000 decennial censuses. Arlington County was
fully tracked by the 1950 census; i.e. 1950 is the first census for which data aggregated
on a census tract basis are available (NHGIS, 2004). Before 1950, census totals were
Page 37
24
reported for the entire county. The number of tracts (38) and their configuration has not
changed since they were first defined.
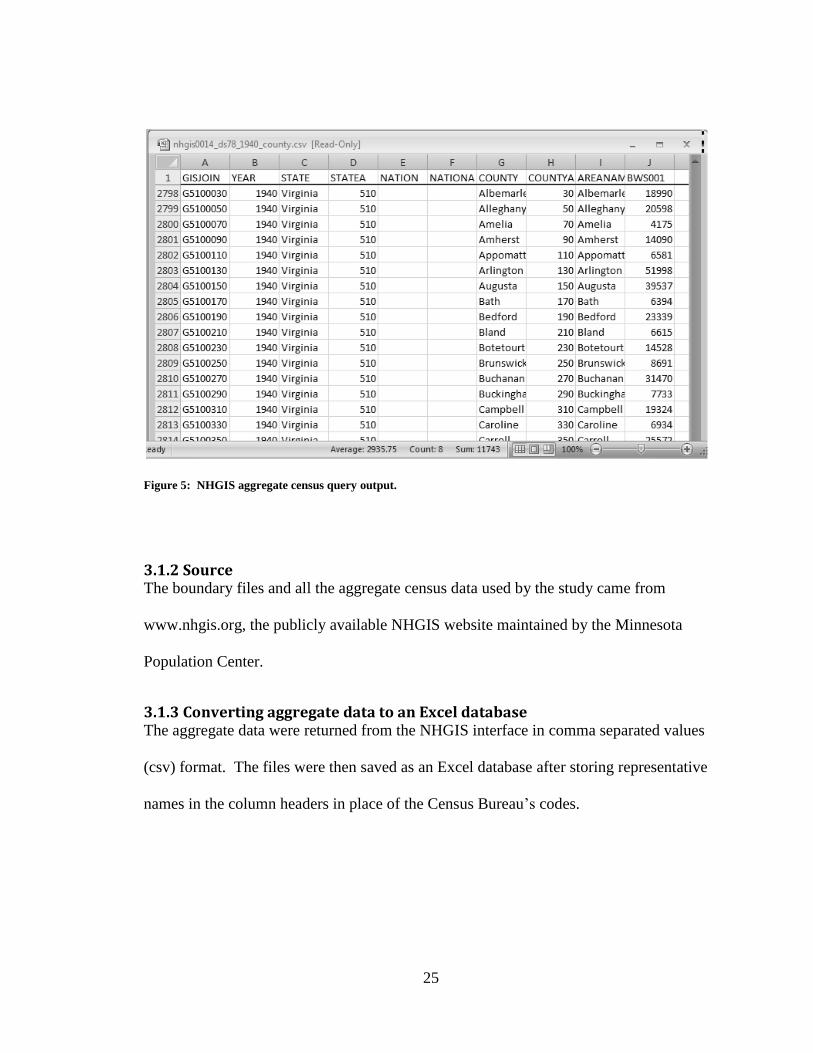
3.1.1 Description Aggregate census data are obtained by running a census query on the National Historical
Geographic Information System (NHGIS) website. The query parameters consist of the
Geographic Level of data desired (entire nation, state, county, census tract, block group,
or block), the census year, and one or more datasets. For example, to learn the number of
whites living in Arlington County in 1940 the parameters are ‘County’, ‘1940’,
‘Population, Housing, Agriculture & Economic Data’, and ‘Total White Population’.
The output of the above query is the total number of white residents in each county in the
United States (See Figure 5). The data column names are codes used by the Census
Bureau; an accompanying text file maps the Census Bureau code to a descriptive name.
The column labeled ‘BWS001’ contains the total white population of each county.
Page 38
25
Figure 5: NHGIS aggregate census query output.
3.1.2 Source The boundary files and all the aggregate census data used by the study came from
www.nhgis.org, the publicly available NHGIS website maintained by the Minnesota
Population Center.
3.1.3 Converting aggregate data to an Excel database The aggregate data were returned from the NHGIS interface in comma separated values
(csv) format. The files were then saved as an Excel database after storing representative
names in the column headers in place of the Census Bureau’s codes.
Page 39
26
3.2 Manuscript census data
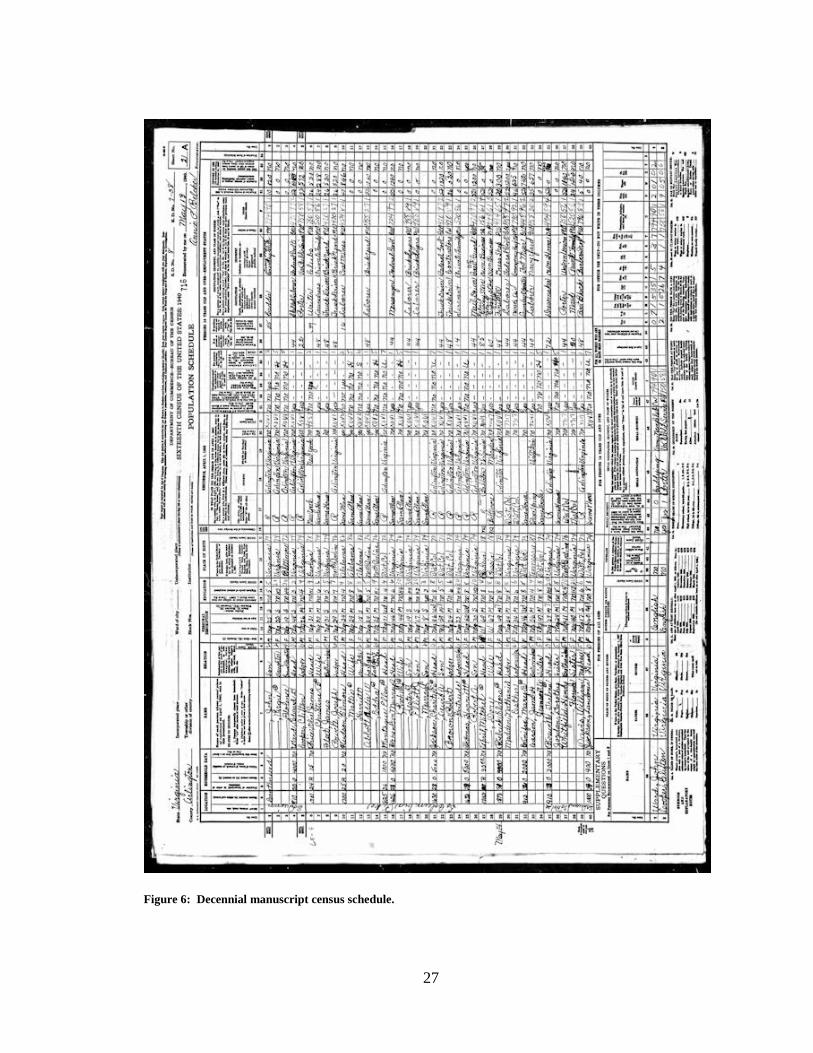
3.2.1 Description Manuscript census schedules (Figure 6) from the twelfth through the sixteenth census
(1900-1940) were used for this study. Manuscript census data more recent than 1940 are
not available; the U.S. government cannot release personally identifiable information
about an individual to anyone other than that individual until 72 years after it is collected,
as stipulated by law (92 Stat. 915; Public Law 95-416; October 5, 1978). The manuscript
data are formatted as images of the original hand written schedules filled out by the
census enumerator when taking the census, with one line in the schedule for each
individual being enumerated. The data columns on the schedules changed over time. For
example, the 1900 and 1910 censuses asked adult females the number of babies they had
given birth to and the number of those babies that survived. The 1920 census asked for
not only the individual’s native language, but also the parents’ native languages. The
1930 census asked adult males if they were veterans, and if so which war or engagement
they served in. The 1940 census asked which New Deal programs, if any, the individual
participated in. This study only used data columns common to all of the 1900-1940
censuses.
3.2.2 Source The manuscript data came from a publicly available website, www.Ancestry.com.
Page 40
27
Figure 6: Decennial manuscript census schedule.
Page 41
28
3.2.3 Converting manuscript data to an Excel database The manuscript schedules are in portable document format (pdf), meaning that they can
be read, but not manipulated. To be useful to this study the schedules were reformatted
to allow manipulation of the data. A subset of the data columns from the schedule were
manually copied one line at a time into an Excel spreadsheet (Figure 7). The rows were
stored in the order that they appear in the manuscript schedule – the order of
enumeration. The data preserved include the census year, township, enumeration district,
household status (head of household, live-in servant, family member, or lodger), gender,
race, age, birth state of the individual and/or of his parents (depending on the census
year), the individual’s occupation and place of work, and whether the head of household
owned or rented the home. The Page and Line columns were preserved in order to allow
reference back to the original schedule. The township column (Twp) reflects the fact that
the Virginia’s 1870 constitution mandated all counties be divided into three governing
districts. Arlington’s districts were named ‘Jefferson, ‘Arlington’, and ‘Washington’.
The Census Bureau used the township boundaries to define the enumeration districts in
the 1900 census, and in succeeding censuses subdivided those enumeration districts as
the County’s population grew. A diagram of the townships and enumeration districts
appears in Chapter Five, Figure 10.
Page 42
29
Figure 7: Database built from 1910 manuscript census schedule
Page 43
30
CHAPTER FOUR: QUALITATIVE DATA USED IN THE STUDY
Introduction This study used a variety of sources of qualitative data, the primary source being
interview data. These included both interviews conducted for the study and interviews
conducted by others at some time in the past (oral histories). In addition, the study used
historical telephone books and land deeds.
4.1 Interviews Interviewing is prompted by “an interest in understanding the lived experience of other
people and the meaning they make of that experience” (Seidman, 2006:9). While a great
deal was learned from the census data alone, the significance of the events that transpired
during Segregation in Arlington could best be learned by talking to the people who
experienced them. Chapters Five, Six, and Seven discuss use of data from the interviews
and oral histories.
4.1.1 Sampling method Snowball sampling (Tashakkori and Teddlie, 1998; Weiss, 1994) was used to select the
study participants. This sampling method, rather than a scientific or a random sampling
method was used because the study was targeted at a specific, very small population.
The first participant was met at a civic association meeting in one of the black
neighborhoods. This individual volunteered to be interviewed and to identify other
prospective participants. Because he was so well connected, well respected by the
Page 44
31
community, he proved to be very valuable to the study. Over time a good variety of
participants was found, with approximately the same proportion of sample members from
each tract as there are residents in that tract. Figure 8 depicts the participants included in
the sample. When asked for contact information for specific persons or types of persons,
the participants were helpful giving contact information. Some of the participants were
reluctant at first to take part in the study, expressing doubt in their having anything
meaningful to add. Mentioning who had recommended them (the known sponsor) helped
encourage those individuals to agree to be interviewed.
Figure 8: Participants in the snowball sample
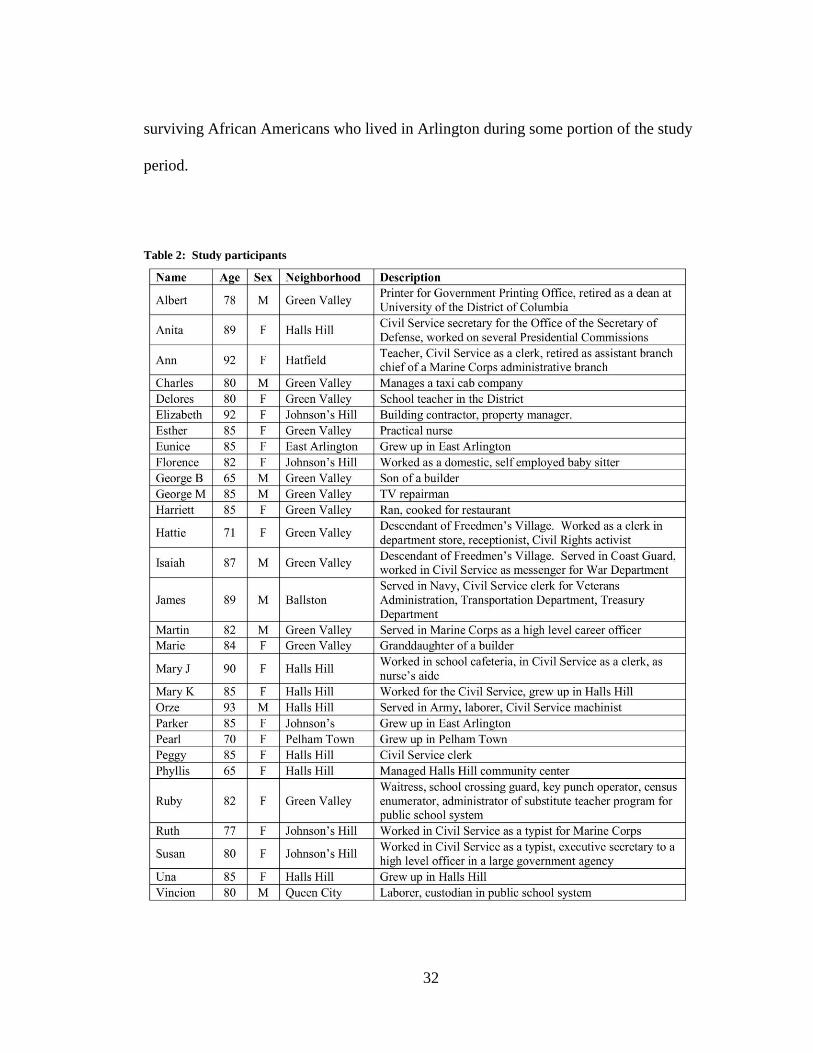
4.1.2 Participants The selection criteria for participants were that they reached their majority by 1940, and
they lived in one of the three black tracts during Segregation. All but two of the
participants (Table 2) were born in Arlington and all of them reached adulthood in
Arlington well before Arlington integrated. They represent a very small pool of
Page 45
32
surviving African Americans who lived in Arlington during some portion of the study
period.
Table 2: Study participants
Page 46
33
4.1.3 Interview procedures The interviews were conducted during the summer of 2010 and during the summer and
fall of 2012. Some participants were interviewed both in 2010 and 2012. A few of the
2010 participants were either no longer alive or no longer well enough to submit to an
interview by 2012. Most of the interviews were conducted in the participant’s home. At
the beginning of the interview, participants reviewed pages from the 1920, 1930, and/or
1940 manuscript census schedule listing the participant’s family; this helped to stimulate
the participant’s memory. Thoughtful conversations ensued about the participants, their
families, and their community. Interviews lasted between one and two hours.
4.1.4 Process interview data using grounded theory techniques The interviews were analyzed using grounded theory techniques (Strauss and Corbin,
1998). This included assigning conceptual labels to blocks of text, sorting the labels into
categories, and integrating the categories into emerging themes to answer the research
questions. This is both an inductive and abductive process where the researcher searches
for patterns in the participants’ comments that would help answer the research questions.
Conceptual labels and preliminary categories were identified after each interview. When
new questions emerged from the data, a second interview guide was developed for a
subsequent interview with the participant.
4.1.5 Strategies for enhancing rigor Several techniques were employed in an effort to enhance rigor of the study (Baxter and
Eyles, 1997). These include conducting multiple interviews with each participant, typing
verbatim interview transcripts, member checking interview transcripts and emerging
Page 47
34
themes with the participants, triangulating data collection methods, and maintaining an
audit trail of memos across the data gathering and analysis processes.
Multiple interviews enhance validity. Each participant was interviewed at
least twice. At the first interview a semi-structured interview guide was used.
The interviews were recorded, the recording was typed, and the transcript was
analyzed to label concepts the participant discussed and to develop
preliminary categories. This process always raised new questions, which were
asked at a subsequent interview. The same interview guide was used for all
participants for the first interview but an interview guide specific to the
participant was used for subsequent interviews.
Member checking allows “systematically soliciting feedback about your data
and conclusions from the people you are studying” (Maxwell, 2005:111) by
allowing the participants to edit their transcripts for the purpose of checking
for errors. Participants were given transcripts of each interview to read and
correct. All but one participant took the task of editing the transcripts very
seriously, and returned them with corrections. Any corrections they made and
any themes that emerged from the transcripts were discussed. Participants
were given any pages from the final paper that included quotations from their
transcripts for their final approval.
Triangulation of the interview data and the census data, “Collecting
information using a variety of sources and methods” (Maxwell, 2005:93),
Page 48
35
reduced the risk of misinterpreting the individual data sources. It also assisted
in the analysis.
An audit trail was maintained for each participant. It contained all
information collected about that individual other than the interview
transcripts, and a diary of every occasion when the individual was contacted.
For example, the audit trail contained the date and notes about the phone call
when the participant was first invited to take part in the study, the date and
notes about the first interview, the date and content of the thank you note
written to the participant after the interview, any photos taken of the
participant, any census data related to the participant’s family, the researcher’s
impressions of the participant, and the researcher’s notes about plans for
future contact with the participant.
4.2 Oral Histories Because most black residents of the County who lived during the early portion of the
study period are no longer alive, the interview data were augmented with oral histories of
early residents. The oral histories were included as a data source because 1) the pool of
participants is small, 2) the oral histories supplement and complement the interviews, 3)
the oral histories were collected between ten and forty years ago making the participants
a generation older than the study’s participants, and 4) the oral histories increased the
variety of occupations represented. The use of oral histories greatly contributed to the
final analysis. As stated by Andrews et al. about a similar study conducted in
Teignmouth, England (Andrews, et al., 2006:170): “The older people’s stories clearly
Page 49
36
demonstrate unique insights into the history of places. Indeed, what these narratives
provide is recollection about self, about relationships with others and a place, insights
rarely provided in such depth by other methods.”
4.2.1 Sources of oral histories Fifteen of the oral histories, collected as part of a project funded by the National
Endowment of the Arts, are publicly available in the archive at Langston-Brown
Community Center in Halls Hill. An additional twenty oral histories, collected as an
ongoing oral history project conducted by Arlington County, are publicly available in the
Virginia Room at the Arlington Central Library.
4.2.2 Processing oral histories using grounded theory techniques The oral histories were read and analyzed as if they were transcripts of interviews
conducted by the study. This allowed the adequacy of the themes that arose from
analyzing the interviews to be tested. This type of validation of results is referred to as
‘referential adequacy’ (Baxter and Eyles, 1997:515).
4.3 Cross referenced telephone books For the study of black entrepreneurship, a list of black-owned businesses in Arlington
during Segregation was needed. A list was built using an old telephone book. The book
chosen was a cross referenced telephone book from 1950, the oldest such book available
at the Arlington Central Library (Hill, 1950). A cross referenced telephone book, not to
be confused with present day ‘Yellow Pages,’ lists every telephone number twice, first by
the name of the individual and second by the address. While the names of the business
owners was not known, the street names and address ranges of the streets running
through the black neighborhoods was known. Individuals listed their name in the
Page 50
37
telephone book and, if they chose, their business. For example Mrs. Toth, a practical
nurse who lived at 1100 North Roosevelt Street, listed herself as “Toth, Mildred B. Mrs.
nurse”. Figure 9 is a portion of the page listing the 1000 through 1600 blocks of
Roosevelt Street North. This gave only a partial listing, as only those businesses that
were open in 1950, had a telephone, and listed themselves in the telephone book were
included. Chapter Seven describes how the cross referenced book was used by the study
to identify black-owned businesses.
Page 51
38
Figure 9: Arlington 1950 cross referenced telephone book
Page 52
39
4.3.1 Source of telephone books The 1950 cross referenced telephone book was found in the Virginia Room of the
Arlington Central Library, 1015 North Quincy Street in Arlington.
4.4 Land deeds Land deeds are physical records maintained by a municipality. They record the sale of all
real property and contain such information as the date, name of the seller (grantor), the
buyer (grantee), the price, and an exact description of the boundaries of the property
being bought or sold. Land deeds were used to discover when African Americans first
built homes in some of the small settlements, and when they sold their property and
moved out of those settlements into one of the three black neighborhoods. Chapter Five
discusses the use of the land deeds.
4.4.1 Source of land deeds The land deeds reside in the Arlington County Office of Land Records, 1425 Courthouse
Road, Suite 6200 in Arlington.
Page 53
40
CHAPTER FIVE: RESIDENTIAL PATTERNS1
5.1 Abstract
5.1.1 Background In 1900 Arlington was bucolic farm land with 6500 residents living in a scattering of
populated settlements, many of them comprised of black families. By 1970 Arlington
was a bustling white suburb of almost 243,000 residents, 92 percent of them white.
African Americans no longer lived in widely dispersed settlements, but rather were
clustered into three all black neighborhoods. This chapter quantifies that clustering using
segregation indexes and explores how two phenomena, segregation and proximity to the
District, influenced the shift in residential patterns.
5.1.2 Methods Decennial census data from 1900-1970 were processed using segregation indexes to
quantify the degree of clustering displayed by African Americans. Because 1900-1940
manuscript census data are only available as images of the original census schedules, it
was first aggregated using a two step procedure developed for this study. The 1950-1970
census data from NHGIS was already aggregated. Using a mixed methods case study
method, the output of the indexes was analyzed in conjunction with data from interviews
1 The majority of the material included in this chapter was submitted as a manuscript and
is in review: Perry N., Crew S., and Waters N.M., 2013, “We didn’t have any other place
to live”: Residential Patterns in Segregated Arlington, Virginia. The data gathering and
analysis were done by Nancy Perry, and the writing mainly by Nancy Perry. All authors
contributed important intellectual content and provided critical review of the papers.
Page 54
41
and oral histories to characterize the residential patterns of Arlington’s African American
community, and to understand the reasons for those particular patterns.
5.1.3 Results High levels of segregation were detected by the two indexes measuring isolation and
uneven dispersion of the minority group. Medium segregation was detected by the index
measuring the degree of concentration of the minority group on the land. No segregation
was detected by the indexes measuring the presence of the minority in the center of the
city and the clustering of minority neighborhoods into ghettos.
5.1.4 Conclusions Arlington’s residential patterns are not typical Northern or Southern patterns. The
African American community began the twentieth century relatively dispersed. During
the study period they became progressively more segregated as Arlington grew from a
collection of lightly populated settlements to a densely populated white suburb of the
District. Segregation is an artifact of a community’s history. The segregation indexes,
measuring the artifacts of Arlington’s history, show that Arlington’s African American
community, overrun by in-migrating whites, was slowly pushed into a few widely
dispersed black settlements, but never pushed out of the County altogether. The process
developed by this study for aggregating manuscript census data proved to be a reliable
method for formatting the data for use with the segregation indexes.
5.2 Background Arlington has a long history of residential segregation that did not end until after the Fair
Housing Act, passed by Congress in 1968, made residential segregation illegal. This
Page 55
42
chapter measures residential segregation in Arlington during the study period and
examines the residential patterns that resulted from that segregation.
Arlington’s African American community has complex origins. Some black residents are
the descendants of slaves who worked on Arlington’s early farms, others are the
descendants of runaway slaves housed at Freedmen’s Village, yet others are the
descendants of freed slaves who migrated north during Reconstruction, and still others
are the descendants of sharecroppers who moved north during the Great Migration.
By 1900 the African American community was well entrenched. Thirty eight percent of
the 6482 County residents were African American. A scattering of settlements emerged,
twelve of them containing black households (Rose, 2009). The map in Figure 2 in
Chapter One illustrates the location of those black settlements, including some that have
since disappeared.
In a discussion of segregation, Johnson (1970:8) describes a residential pattern he labels
‘small Southern towns’. He could have been describing Arlington’s three black
neighborhoods in 1900, Green Valley, Johnson’s Hill, and Halls Hill, although the
settlements are not located on the edge of town:
It is an interesting fact that practically all the Negro neighborhoods in the
small towns are located on the edge of town. ... They are separated from
one another by intervening white neighborhoods which have paved streets,
street lights, water and sewerage connections which seldom reach the
Negro residential areas. These areas, unlike those in the larger cities, are
Page 56
43
not “inherited” from white residents who have moved on to better areas,
but were developed as Negro residential areas, or “quarters.”
The three neighborhoods grew in parallel but in isolation from one another. In 1900 each
was integrated but with a good sized black population, each had a black elementary
school, one or more black churches, and a few businesses (Perry and Waters, 2012). By
1970 Halls Hill was 84 percent black and the other two neighborhoods were almost 100
percent black. When census tracts were defined, each of the three neighborhoods was
made into a tract.
Many theories of neighborhood selection exist; all agree that the process of selecting a
house, thereby selecting a neighborhood, has many variables. Coleman (1990) maintains
that neighborhood selection has actors and resources, where each actor controls some
resources. A household with a given amount of resources (social, cultural, monetary,
earning ability) exchanges those resources to purchase housing in a neighborhood they
like. Early freed slaves in Arlington bought land, had it platted, farmed it for a time, and
then sold individual lots to other black families, thereby creating the first black
neighborhoods. Many of those neighborhoods survived Segregation intact.
Residential patterns reflect supply and demand in the housing market (Logan and
Molotch, 1987). Each neighborhood offers packages of amenities (schools, public
transit, affordable housing). Households make their choice of neighborhood based on the
household’s ability to pay for the location and the neighborhood’s amenities, weighing
the location and amenities most important to them. The early black neighborhoods
lacked access to utilities such as sewer, water, and electricity. However, the land was
Page 57
44
affordable and they offered the African American families safety, stability, and
welcoming black relatives and neighbors.
Once a household invests their resources in their home, they take steps to protect the
value of that investment from perceived threats. During Segregation white
neighborhoods erected racial barriers, fearing that in-migration of African Americans
might lower their house value (Farley et al., 1993). Participants mentioned how white
home owners put up cinderblock walls (in Halls Hill) and tall, thick hedges (in Ballston)
to keep their black neighbors’ homes out of sight of their own properties.
Schelling (1971) identifies three types of residential segregation: 1) organizationally
enforced, 2) economically induced, and 3) segregation resulting from individual
behavior. Organizationally enforced segregation is a result of practices that are legal and
illegal, coercive and exclusionary, open or covert, kindly or malicious. Economically
induced segregation causes the poor to live separately from the rich. Individually
motivated segregation occurs when households allows habit, tradition, prejudice, fear,
hostility, or alienation to inform their residential choices. Organizational segregation -
restrictive covenants on houses in Arlington’s new residential developments - left black
households with few neighborhoods where they could live. Individually motivated
segregation, reinforced by annual Ku Klux Klan marches past some of the
neighborhoods, further encouraged the African Americans to remain in their black
neighborhoods.
Economically induced segregation was less apparent in Arlington. There were no
wealthy black settlements. The doctor, lawyer, and minister lived in the same
Page 58
45
neighborhood as their patients, clients, or flock. Karl Taeuber (1975) points out that poor
whites are not integrated with poor blacks, nor wealthy whites integrated with wealthy
blacks. He maintains that residential segregation is systemic racial discrimination by
whites against blacks.
Residential segregation is “…a measure of the degree to which two or more groups live
separately from one another in different parts of the urban environment” (Massey and
Denton, 1988:282). School districts and other agencies and individuals need to quantify
segregation, i.e., compare the racial/residential pattern they see with a pattern displaying
no segregation. Segregation is measured using segregation indexes. Taeuber and Taeuber
(1965:29) discuss the value of such indexes:
[A] numerical segregation index, reflecting one basic aspect of a city’s
racial residential pattern, permits a variety of comparisons. Comparison of
the index value for a city at one point in time with this value at a
subsequent point in time permits some assessment of the impact of various
intervening processes thought to encourage segregation or desegregation.
Such an index is useful also for comparing different cities with each other.
It lends objectivity to an effort to determine what features of the social
organization of a city or what characteristics of the city’s population are
related to the degree of residential segregation.
The phenomenon of residential segregation has five dimensions: evenness, exposure,
concentration, centralization, and clustering (Massey and Denton, 1988). Because
segregation patterns are an artifact of a population’s specific history, not all populations
Page 59
46
display segregation on every dimension. Measuring multiple dimensions requires
multiple indexes. “It may be that no single index will be sufficient because of the
complexity of the notion of segregation, involving as it does consideration of spatial
pattern, unevenness of distribution, relative size of the segregated group, and the
homogeneity of sub-areas, amongst others” (Duncan and Duncan, 1955:217).
Index parameters include such data as the number of black and white residents in the area
and in each subarea, the size of the area and each subarea, and the distance between each
pair of subareas. The subareas are frequently wards, census tracts, or census blocks. The
Census Bureau first used census tracts for the 1910 census, but not until the 2000 census
was every city and county divided into tracts. This raises two issues when comparing
index values: 1) the area units may vary in size from one census to the next, or from one
city to another, and 2) small area units are more sensitive to pockets of segregation than
large units (Taeuber and Taeuber, 1965). The most meaningful comparisons are made
when the area units are approximately the same size, and when the area units are small.
5.3 Methods Using a mixed qualitative and quantitative case study method (Stake, 1995), this study
explored Arlington’s residential patterns to discover if the community developed the
patterns of a Southern city or of a Northern city. The data sources included census data,
semi-structured interviews, oral histories, and deed records.
5.3.1 Data Collection Methods The study used two census data formats – manuscript census schedules from the twelfth
through the sixteenth census (1900-1940) and aggregate census data from the seventeenth
Page 60
47
through the nineteenth census (1950-1970). The manuscript data were first manually
transferred into an Excel table as described in Chapter Three.
Prior to 1950, enumeration districts (ED) were the Census Bureau’s units of enumeration
for Arlington. As the County’s population grew, the original ED were subdivided and
reconfigured. Figure 10 illustrates why Arlington’s ED are unsuitable for use with the
segregation indexes; the ED changed frequently and the large units mask segregation.
Figure 10: Arlington enumeration districts in 1900-1940 and census tracts in 1950
To satisfy the requirement for 1900-1940 census data aggregated to small, consistent area
units, a procedure was developed to define ‘virtual blocks’ in place of the ED. The
Page 61
48
procedure assumes that when the census enumerators performed the actual census, they
started at one end of a block, working their way around it before beginning the next
block. Instructions to enumerators in 1900 confirm this assumption (U.S. Dept. of
Interior, 1900:17): “If your district is in a town having a system of house numbers, the
enumeration must be made by blocks or squares. Begin at one corner of some block, and
proceed entirely around and through it before leaving it for another.”
The first step to define the virtual blocks is to transfer the manuscript data to an Excel
database. At a minimum, household status and the race of each individual are required
data columns. The second step is to sort the database by household status, grouping the
rows for ‘head of household’ in the order that the households were enumerated. This
results in a list of all the households in the order that they occur along the street. The race
of the head of household is assigned to the entire household. Assign a block number to
groups (virtual blocks) of contiguous households. The block size is arbitrary; for this
study blocks of 20 households and larger blocks of 40 households were created. The
third step is to count the number of white households and the number of black households
that comprise each block and store that data with the block. For this research the virtual
blocks were used as input to the segregation indexes for 1900-1940. Note that while
census tracts are a set of individuals, virtual blocks are a set of households.
Aggregate census data identify the total number of black persons and white persons per
census tract. The aggregate tract totals were loaded into an Excel table without
modification for use as input to the segregation indexes for 1950-1970.
Page 62
49
Census data revealed Arlington’s residential patterns; the interviews revealed events in
the history of the community that caused the patterns. We conducted the interviews
during the fall of 2012. The snowball sampling method was used to identify interview
participants (Weiss, 1994). For the residential patterns portion of the study a total of
thirteen participants, representing three large black neighborhoods and five small
settlements, were interviewed. All the participants for the residential patterns study grew
up in Arlington. The methods used for collecting and processing the interview data are
described in Chapter Four.
Because most black residents of the County who lived during the early portion of the
study period are no longer alive, the interviews were augmented with oral histories of
early residents. Including the oral histories revealed black settlements no longer in
existence. The methods used for processing the oral histories are described in Chapter
Four.
Land deeds were used to put dates on events the participants described. For example,
land deeds revealed when the first African American purchased and then platted the land
that became the settlement Ballston.
5.3.2 Data analysis methods The five segregation dimensions were measured, selecting one index to measure each
dimension, using both the manuscript (virtual block) and the aggregate (census tract)
data. A Python computer program was written to calculate the index values. The results
for Arlington were then compared with equivalent results for other cities.
Page 63
50
The analysis of the 1900-1940 Excel database included sorting it to discover the number
of black and white households, the number and size of black settlements, the number and
location of live-in black servants, the proportion of black families that owned or rented
their homes, etc. Because each census was stored in a separate table, the above analysis
was done for each census and the results were compared.
5.4 Results Arlington’s degree of segregation was measured on each of the five dimensions of
segregation. The first three dimensions were measured using the 1950-1970 aggregate
census data only. Those indexes require knowledge of the size and/or the location of the
area unit. The size and location of the census tracts, the area unit of the 1950-1970
aggregate census data, is known. Because the virtual blocks have no known area size or
location, they could not be used to measure the first three dimensions for the 1900-1940
censuses. The virtual blocks were used to measure the final two dimensions for the 1900-
1940 censuses.
Variable definitions for all the equations in this section are found in Table 3.
Page 64
51
Table 3: Variable definitions for all index variables
5.4.1 Centralization This dimension expresses the degree to which a group was clustered near the center of
the city. The clustering is the result of both a push and a pull (Burgess, 1928) as white
residents were pushed out of the city center by the growth of industry and pulled out to
more attractive residential districts on the edges of the city. African Americans, unable to
afford this change in lifestyle, tended to remain in the center, occupying the older and
therefore cheaper housing. Over time the neighborhoods in the centers of affected cities
became predominantly African American and the suburbs on the fringes became
predominantly white. Table 4 contains evidence for the pull of city residents out to the
Page 65
52
suburbs of selected metropolitan SMSAs, including the District. It compares the percent
of residents of each SMSA located within the city in 1940 and again in 1950. The ‘Rate
of suburbanization’ column contains the decrease in city residents in just ten years as
residents of the SMSA moved to the suburbs. Note the high rate of suburbanization of
the Washington, D.C. SMSA. Some of those District residents were pulled to the
growing suburb of Arlington.
Table 4: Rates of suburbanization for selected metropolitan areas.
Source: Taeuber and Taeuber, 1965:153
The Relative Centralization Index (RCE) (Massey and Denton, 1988) was used to
measure centralization of Arlington’s African Americans. The index uses area subunits
that form rings of increasing distance from the central business district. RCE was
calculated by processing aggregate 1950-1970 tract level census data. Arlington is a
small county so there were only five rings of tracts around the center tract.
Page 66
53
RCE index values can range from -1.0 (whites clustered in the center of the city) to 1.0
(African Americans clustered in the center of the city). Arlington’s RCE scores in Table
5 indicate no centralization of either racial group from 1950-1970. The slight increase in
the RCE value from1950-1960 and 1960-1970 is due to the location of the three large
neighborhoods. By 1950 all but one of the settlements was gone. The first ring around
the center tract contained the one remaining settlement. The second ring contained no
settlements. The third ring contained all three of the large neighborhoods. The fourth
and fifth rings contained no settlements. As African Americans moved out of the
settlements into the three neighborhoods the population was increasingly located in the
third ring, but with one small settlement close to the center.
)()( 1
11
1
i
n
i
ii
n
i
i YXYXRCE
Page 67
54
Table 5: Segregation index scores for Arlington in 1900-1970
Centralization of African Americans did not occur in Arlington during Segregation.
Beginning with the buildup of the government workforce during World War I, many
federal workers fled the congestion of the District, creating suburbs in outlying areas of
Maryland and Virginia. Arlington was one area to which they fled; population totals
indicate that most of the new residents were white. Rose (2009:156) describes this
period:
In the decade between 1900 and 1910, the population of the County rose
from 6,430 to 10,231. In the next ten years it moved up to 16,040 despite
the annexation of a sizeable area by Alexandria City in 1915. Highways
and the transportation system were improved and expanded … Arlington’s
suburban character was intensified and it was well on its way to becoming
what in fact it later was called, the “bedroom” of the District of Columbia.
Page 68
55
Arlington’s African American community was already well established in the three black
neighborhoods when the whites arrived. In this respect Arlington’s residential pattern
matches a Southern pattern described by Taeuber and Taeuber (1965:56):
In the North, there has never been any significant amount of rural and
village settlement by Negroes, and they have been excluded from nearly
all new housing developments in the suburbs. In the South, by contrast,
Negroes have long resided in many rural and village places that have been
brought in to the metropolitan sphere as urban settlement expanded
outward.
5.4.2 Clustering The clustering dimension expresses the clustering together of racial neighborhoods in
space. While the centralization dimension was a measure of the degree of clustering of
racial neighborhoods relative to a central point, the clustering dimension is a measure of
the degree of clustering of those same neighborhoods relative to each other.
The clustering of racial neighborhoods in cities is a twentieth century phenomenon, an
artifact of the Great Migration. Few migrants settled in the District in the early years, but
by the 1930s the numbers of in-migrants had increased. However, the volume of
migrants to the District fell far short of the volume to large industrial cities like Chicago,
Cleveland, and Detroit (Green, 1967). Even fewer migrants moved to Arlington. Those
that arrived were moving into old, established, cohesive African American communities.
The Spatial Proximity Index (SP) (White, 1986) was selected to measure clustering of
Arlington’s black settlements. The index employs a proximity grid with a row and
Page 69
56
column for each area unit (38 rows and 38 columns for Arlington’s 38 census tracts)
containing ‘1’ in the cells of contiguous tracts and ‘0’ in all other cells. SP is the average
proximity between members of the same group (Pxx), the opposite group (Pxy) and all
groups (Ptt), weighted by the proportion of the population that group represents. SP was
calculated by processing aggregate 1950-1970 tract level census data.
2
1 1
X
cxx
P
ijj
n
i
n
j
i
xx
XY
cyx
P
ijj
n
i
n
j
i
xy
1 1
2
1 1
T
ctt
P
ijj
n
i
n
j
i
tt
Index values can range from 1 (no clustering of black tracts or white tracts) to values
greater than 1 (clustering of black tracts or white tracts). Arlington’s SP scores in Table
5 indicate no clustering from 1950-1970. While Arlington was not a destination city
during the Great Migration, some migrants did arrive during that period from Southern
states. In 1900 three percent of Arlington’s African American community originated in
states south of Virginia. By 1940 twelve percent of the African American community
originated in states south of Virginia.
One participant, Anita, described the period prior to World War II, when African
Americans moved to Green Valley from Southern Virginia:
[W]hen people came here they found property that was available. Just
during the same time [a black builder] who migrated here, who was a
tt
yyxx
TP
YPXPSP
Page 70
57
carpenter, was building homes and they just latched on to them, stayed and
raised families. They would send back down to wherever they came from
and brought other relatives up. … They were building the Pentagon. All
that drew a lot of people from the South here for work, from further down
in Virginia here to work.
Southern African Americans moving to Arlington during the Great Migration came
individually, not in waves. The existing black neighborhoods absorbed them without
extreme crowding. A few of the study’s participants’ parents were part of the Great
Migration.
Arlington was also subject to a different migration – a migration of white federal
employees beginning early in the twentieth century after trolley and rail lines connected
Arlington with the District. “People worked in Washington then. They had to commute.
They did it by trolley and train. And that was considered the way to do it. They could
live in the country, have a little bit of land, and have a house that was cheaper than in the
city” (Leventhal, 2012). The white in-migration intensified during the New Deal and
World War II, completely changing the complexion of the once rural County.
The new white residents required homes, and developers were quick to provide them.
Existing farms and several of the small black settlements were bought and cleared.
Residential segregation was an established fact by this time; African Americans were
unwelcome in the new developments that replaced their settlements. Their only choice, if
they were to remain in Arlington, was to move to one of the three black neighborhoods
and buy or rent a home from another African American. Note on Figure 2 in Chapter
Page 71
58
One the black settlements that disappeared during the study period. Ballston was such a
settlement.
The Ballston settlement was located near the junction of two historic roads, Glebe Road
and Wilson Boulevard. The black family of William Green purchased the land in 1880
from a white farmer, had it platted, and sold individual lots to other black families (Deed
Book, F4:293). This was a very stable community. Twenty five families lived in
Ballston in 1920; many of them were related; all of them owned their own homes. More
than 75 percent of those same families appear on the 1930 and 1940 census. That the
settlement was close knit is evident from the memories of James:
I remember how, thank God, how people treated me. They all treated me
like I was their child. We were taught to respect everybody, and so it was
just like the 25 families there, it was just like we were one family and they
treated me like I was the baby of that family. The Turners, the Grangers,
the Andersons, I had respect for them and it was like I was their youngest
kid. … We were all families but we were happily one family.
Once World War II ended and housing construction resumed, the land occupied by the
Ballston settlement became very attractive to developers, who bought up Ballston
properties. James recalled:
[T]hat was in ’46. Soon after there were people trying to get our
property… Across the street was Mr. Galloway, who was a minister. He
was the last African American that sold out. He had a rickety little place.
I can see him. Everything else was gone, but he held out. He didn’t get
Page 72
59
what he was asking for. I don’t know how much he was asking for, but he
didn’t get it.
Mr. Galloway sold his property in 1951 (Deed Book, 174:362). Ballston’s families
scattered to the remaining neighborhoods. James and his new wife moved to Green
Valley.
5.4.3 Concentration The concentration dimension expresses the relative amount of physical space occupied by
a given group. If the group lives under very crowded conditions they are residentially
concentrated.
The Delta Index (DEL) (Massey and Denton, 1988) was selected to measure the
concentration of Arlington’s African Americans. Residents crowded together in high rise
tenements are concentrated; residents of one story houses with gardens are not. The
inputs to this index include the area and number of African Americans in each census
tract, and the total area and number of African Americans in the County. DEL compares
the density of African Americans living in census tracts with the density of African
Americans in the County. DEL was calculated by processing aggregate census data from
1950-1970.
2
||1
n
i
ii
A
a
X
x
DEL
Index values can range from 0.0 (no concentration) to 1.0. The index values can be
interpreted as the proportion of all African Americans in the County who would have to
move to another census tract in order for all African Americans to be able to enjoy
Page 73
60
maximum physical space. Arlington’s DEL scores in Table 5 indicate only moderate
concentration of African Americans from 1950 through 1970.
While the black neighborhoods grew more segregated, they never resembled the ghettos
found in large cities such as Chicago or New York. None of the neighborhoods
contained buildings more than two stories tall, and most families lived in garden
apartments or single family homes such as the house in Figure 11.
Figure 11: House in Negro quarter in Rosslyn, Virginia, in 1937.
Library of Congress, Prints & Photographs Division, FSA/OWI Collection, LC-USF34-015608-D,
http://www.loc.gov/pictures/resource/fsa.8b31475/, accessed 2/10/2013.
Page 74
61
5.4.4 Evenness The evenness dimension expresses the differential distribution of two groups within the
total space. Unevenness is detected if the proportion of African Americans and whites in
each tract is not the same as the proportion of African Americans and whites in the entire
County. Of the many indexes that have been developed to measure evenness, the
Dissimilarity Index (D) (James and Taeuber, 1985) was selected. The index has a long
history of use in racial studies (Farley, 1977; Darden, 1995; Massey and Denton, 1987;
Massey, 1979, DeFina and Hannon, 2009). The value of the index is insensitive to the
relative size of the group, but very sensitive to the size of the tracts. Small pockets of
segregation within a large tract are not detected using this index. Lieberson explains
“[T]he smaller the spatial units the greater the possible index of segregation…If tracts
were broken down into blocks, then the index based on blocks would be at least as high
as that obtained for tracts…” (1963:34).
This index does not require information about the location or size of the area units so D
was calculated using virtual blocks for 1900-1940 and census tracts for 1950-1970. To
test Lieberson’s assertion, two sizes of virtual blocks were used – 20 households and 40
households.
)1(2
||
PTP
Ppt
D i
ii
Index values can range between 0.0, (total evenness) to 1.0, (total unevenness). An index
value greater than 0.6 indicates high segregation, and 1.0 indicates that every tract is
either all white or all black. Arlington’s D scores are found in Table 5.
Page 75
62
This index discovered significant unevenness in the distribution of African Americans in
Arlington during Segregation. As Lieberson predicted, the 40 household block scores are
slightly lower than the 20 household blocks. Table 6 compares Arlington’s dissimilarity
results with other cities. The 1940 values used city blocks for all cities except Arlington.
The Arlington value, the second highest in the table, is based on 40 household virtual
blocks. For all cities in the table, the 1940 city block values are higher than the 1950
tract values. The drop in Arlington’s values when using tracts instead of virtual blocks
has several explanations: 1) the dividing line between two otherwise white tracts bisects
the settlement called Hatfield, putting half its residents in one tract and half in the other,
2) seven percent of the African American community lived as servants in otherwise white
tracts, 3) the black tracts were slightly larger than the black neighborhoods, causing
whites to be included in the black tracts.
Page 76
63
Table 6: Dissimilarity Index scores for selected cities.
Source: 1Taeuber and Taeuber, 1965:39-40; 2Taeuber and Taeuber, 1965:54; 3Massey and Denton, 1987:815-
816
Once they sold their homes, black families had few housing choices. The new white
developments were segregated. An instrument to keep the developments white was the
restrictive covenant. This contractual agreement between property owners was effected
by inserting the following words into the deed: “…nor shall said property or any portion
thereof to be sold, leased, or bequeathed to any person not of the Caucasian Race”.2
Until 1948, persons violating a covenant could be taken to court. In 1948, the Supreme
Court decision – Shelly v. Kraemer, made covenants unenforceable by the courts (Ruble,
2 These words were inserted in many deeds at the Arlington County Office of Land Records.
Page 77
64
2010). However, restrictive covenants were still common in Arlington until passage of
the Fair Housing Act made them illegal (Leventhal, 2012). Therefore, prospective black
home buyers were limited to purchasing homes from other African Americans, and over
time the only homes owned by other African Americans were located in the three black
neighborhoods.
A new principal arrived in 1941 – the federal government (Goldberg, 1992). During
World War II the War Department outgrew its buildings and prepared to build the
Pentagon in Arlington, partially on land occupied by the black settlements of Queen City
and East Arlington (Figure 12). Exercising eminent domain, the government condemned
all the houses in the settlements, gave the residents less than thirty days to move, paid
each household $2,050 for their property (Vogel, 2007), and leveled the two settlements,
evicting over 220 black families. Eunice, who was 12 on the day her family moved,
reminisced:
It was just such a sad story, because so many people had nowhere to go …
no idea of what to do. All the government was thinking about was
building the Pentagon, and running us off. And it worked that way too. It
was sad, a sad situation … you could see people standing outside with
their few belongings. ... and some of those people had no place to go.
Page 78
65
Figure 12: East Arlington in 1910.
Photo shows unpaved streets, no gutters, no sidewalks. By 1941 when it was leveled to make way for the
Pentagon, Arlington County still had not run streets, sidewalks, curbing, gutters, water or sewer to East
Arlington. Reproduced with permission of the Virginia Room, Arlington Public Library.
The supply of housing during the War was extremely limited. In 1942 Arlington’s
Housing Registry Office received 4,300 applications. They were able to fill just 650 of
them (Rose, 2009). The newly homeless residents of Queen City and East Arlington
moved wherever they could find room. Eunice and nine family members moved into a
wooden shed with a dirt floor. Vincion’s family moved into a government supplied
trailer (Figure 13). He remembered:
We were from Queen City. We had to move because we were where they
were going to put the Pentagon. They put us out. After we moved from
Page 79
66
there, when they started building the Pentagon, we lived in a [government
supplied] trailer in Green Valley for two years … Then we moved to
Johnson’s Hill and we lived in a military style home there, like barracks
that [the government] had built, because we didn’t have any other place to
live.
Figure 13: Arlington, Virginia. Farm Security Administration trailer camp in 1942.
General view of the camp from the roof of the community building. Source Library of Congress, Prints &
Photographs Division, FSA/OWI Collection, LC-USF34-100, accessed 2/10/2013.
Page 80
67
5.4.5 Exposure The exposure dimension expresses the potential for contact within or between members
of the racial groups.
The Isolation Index (xPx) (Massey and Denton, 1988) was selected to measure the
exposure of African Americans to other African Americans, e.g., the percent of African
Americans in the census tract of the average black resident. The amount of exposure an
African American experiences to other African Americans depends not only on the
concentration of African Americans, but also on the number of African Americans
relative to the number of whites in the community, e.g., if the same proportion of African
Americans live in every census tract but the city is fifty percent black, then the average
black resident will be exposed to more African Americans than if the city is five percent
black.
This index does not require information about the location or size of the area units so xPx
was calculated using virtual blocks for the 1900-1940 censuses and census tracts for the
1950-1970 censuses. Two sizes of virtual blocks were used – 20 households and 40
households.
Index values can range from 0.0 (no probability of exposure to another African
American) to 1.0 (100 percent probability of exposure to another African American). An
index value greater than 0.5 indicates that African Americans are more likely to have
African Americans than whites as neighbors. Arlington’s xPx scores in Table 5 indicate a
fairly high exposure of African Americans to other African Americans.
)(1 i
in
i
ixx
t
x
X
xP
Page 81
68
The scores indicate no trend over time; they do not consistently increase nor decrease
from one census to the next. This suggests that two phenomena are at work
coincidentally. Arlington’s black neighborhoods grew denser, the black population
slowly increased as African Americans were pushed out of the small settlements into the
three black neighborhoods, so that this would cause the scores to increase from one
census to the next. However, the proportion of African Americans to whites decreased
with each census, so that this would cause the scores to decrease from one census to the
next. The result of these countervailing trends was to produce a stasis.
Table 7 compares Arlington’s xPx scores with those of fifteen other cities with large black
populations. The average of those 15 scores is 0.666; Arlington is slightly lower than
average.
Page 82
69
Table 7: Isolation Index scores for selected cities in 1970.
Source: The figures in this table come from Massey and Denton (1987:815-816). The Arlington figure was
calculated using 1970 aggregate census data.
5.5 Discussion Arlington’s African American community was fairly integrated in 1900, living in small
black clusters, segregated from whites more by income than by race. The County
displayed neither the residential patterns typical of the North nor those typical of the
South. The Southern pattern of small African American communities around the
periphery of the city, particularly built on land deemed undesirable by whites, was not
Page 83
70
evident. Arlington’s black neighborhoods were found rather evenly dispersed all though
the County, on land that is now considered very desirable. As is evident from their
names, all three of the black neighborhoods (Halls Hill, Johnson’s Hill, and Green
Valley) are built on hills with a view of the District. Also not detected was a
phenomenon described by Hoyt (1939:68) where as the proportion of minority residents
increased so did the level of segregation: “…a far smaller degree of [segregation] tends to
obtain in cities having a small number of nonwhites, or where nonwhites constitute only a
small proportion of the total population.” In Arlington as the white population increased
exponentially, the level of segregation increased even as the proportion of African
Americans decreased.
Arlington’s African American community has its roots in the South. Almost all the
participants could trace their families several generations back to an ancestor who lived
in slavery. However, the white community has much more complicated roots. The
original whites were Southern with Southern attitudes about African Americans, but that
community was soon eclipsed by the huge in-migration of white federal workers whose
roots can only be guessed. Certainly they were not all Southern. While the whites
coveted the land African Americans lived on, and while they were eventually successful
in pushing African Americans out of the little settlements (but not out of the three
neighborhoods), it was accomplished with power and money rather than with violence.
African Americans were not newcomers. They had been there as long as the original
whites and much longer than the in-migrating whites. Coming from an agricultural
background, they appreciated the efficacy of owning the land they lived on and sacrificed
Page 84
71
to buy it, giving proof to Coleman’s theory (1990). Even African Americans who
worked humble jobs as farm laborers, servants, and railroad porters owned their own
homes. In 1900, 59 percent of the black families were homeowners and by 1920, 64
percent of the families were homeowners. Such a high level of home ownership put the
African American community at an advantage when developers began scooping up land
to build housing developments for the whites. Because they owned their homes, African
Americans were not so easily pushed aside.
In 1900 half the black families lived in settlements of thirteen households or fewer. They
were able to select a neighborhood for what Logan and Molotch (1987) referred to as its
amenities. By 1940 half the black families lived in settlements of 140 households or
more. They had three neighborhoods from which to choose, so amenities were less
important than an available dwelling or land on which to build. Schelling (1971)
identified three types of segregation: organizationally enforced, economically induced,
and individual behavior. All three types were at work moving African Americans out of
the small settlements into the neighborhoods. Forces outside the black community -
residential developers, the County, the federal government - coveted land African
Americans owned and occupied. One by one they persuaded or coerced black families to
sell their land and move; because of residential segregation the only place they could
move was a black neighborhood. As a consequence, by 1950 almost all the settlements
were gone. Taeuber’s theory of racial discrimination (1975) was borne out, as everyone
in the community – the doctor, the minister, the laborer, and the domestic worker – lived
in the same neighborhood, segregated by color, not income.
Page 85
72
Segregation indexes measure residential patterns. Those patterns are artifacts of events
that occurred well before the measuring. The events that shaped Arlington’s residential
patterns result from Arlington’s proximity to the District and the federal government.
Selecting the correct index to use should be informed by events in the community’s
history. If a particular event did not take place there will be no artifact to measure, and
the index will give misleading results.
The indexes tell not only what did happen, but also what did not happen. Measuring the
centralization dimension revealed that Arlington’s whites did not flee the city and move
to the suburbs, leaving African Americans behind. Arlington was the suburb that the
whites fled to, and the African American community was already established when they
arrived. Developers nudged aside small pockets of black families living in settlements to
make way for white developments, but had no effect on the contours of the three black
neighborhoods.
Measuring the clustering dimension and the concentration dimension revealed that the
Great Migration passed Arlington by. There was no trace of the slow expansion of black
neighborhoods under the weight of thousands and thousands of in-migrating African
Americans. Arlington’s black neighborhoods simply experienced infill as additional
African Americans arrived. Because the African American community never grew very
large, there was enough land for everyone to live on in little one- and two-story frame
houses. There were no apartment buildings, no high rise projects.
A neighborhood’s well being and stability depends on the behavior of the neighbors
(Massey and Denton, 1993). This is particularly true in a segregated neighborhood where
Page 86
73
poverty is endemic. If one resident chooses to neglect his/her property, indulge in crime,
or exhibit other antisocial behavior it can spread to the neighbors. This did not appear to
happen in the three neighborhoods. Perhaps the fact that so many of the residents were
related to each other, the fact that no one could (and therefore no one did) move out, the
fact that the neighborhoods were so small that everyone knew everyone else’s business,
helped the residents to develop a strong sense of community. Wilma stated “You knew
everyone. You knew every single house that was in Halls Hill at that time. You knew
every person and they knew you. It was really a tight-knit community.”
Arlington grew from a relatively integrated collection of farm settlements in 1900 to an
extremely segregated, majority white suburb in 1970, as the small black settlements
disappeared and their residents moved to the black neighborhoods. This is reflected in
Arlington’s scores on the evenness dimension and the exposure dimension. In 1900 half
the black families lived in settlements of thirteen households or fewer. By 1940 half the
black families lived in settlements of 140 households or more. Forces outside the African
American community – residential developers, the County, the federal government -
coveted land African Americans owned and occupied. One by one they convinced, and
occasionally forced black families to sell their land and move; because of residential
segregation the only place they could move to in Arlington was another black
neighborhood. By 1950 almost all the small black settlements were gone.
5.6 Conclusions Arlington’s development is unlike the typical story of urban growth during Segregation.
The African American community was located between the North (Washington, D.C.)
Page 87
74
and the South (the State of Virginia). The residential patterns that emerged during
Segregation were typical of neither. Historically, African Americans in-migrated to a
city in search of work, rapidly grew in numbers, and slowly pushed into the white
neighborhoods. The whites then retreated to more affluent areas of the city and beyond
to the suburbs. In Arlington the African American community was entrenched in their
settlements and neighborhoods; more than half of them owned their homes. Whites began
in-migrating in search of a home outside of the District but within an easy commute. The
whites grew in numbers with the rapid growth of the federal government, beginning with
World War I, and then the New Deal, World War II, and the Cold War. They did not
push African Americans out of the County, but they did succeed in pushing them out of
their small settlements into the three existing black neighborhoods. Those neighborhoods
were not located on the less desirable areas along the edges of the city, but rather were
dispersed evenly through the County on very desirable land. After integration African
Americans did not move out of their neighborhoods into the white areas, but remained
where they were, giving proof to Uhlenberg’s hypothesis of migration. Those
neighborhoods have since gradually become integrated as both whites and people of other
races have moved in.
Page 88
75
CHAPTER SIX: OCCUPATIONAL CHOICE3
6.1 Abstract
6.1.1 Background Most scholarship on occupational choice describes a period from childhood through
young adulthood when individuals select the occupation that best satisfies their needs
based on their values, interests, education, and environment. In Arlington during the
study period, environment - both the constraints of segregation and proximity to the
District and the federal government - had an enormous impact on occupational choice for
the African American community.
6.1.2 Methods Using a qualitative case study method, including mixed data sources (interviews, oral
histories, and qualitative census data), this paper describes the types of work done by
members of Arlington’s African American community during Segregation.
6.1.3 Results At the beginning of Segregation farming, brick yard labor, general labor, and domestic
work supported most African Americans. Over time as the government grew and as both
3 The majority of the material included in this chapter was submitted as a manuscript and
is in review: Perry, N., Reybold, L.E., and Waters, N.M., 2012, “Everybody was Looking
for a Good Government Job”: Occupational Choice during Segregation in Arlington,
Virginia. The data gathering and analysis were done by Nancy Perry, and the writing
mainly by Nancy Perry. All authors contributed important intellectual content and
provided critical review of the papers.
Page 89
76
the Pentagon and large numbers of white federal workers moved to Arlington, many new
sources of employment became available, including Civil Service employment, while
existing farm and factory work were obliterated.
6.1.4 Conclusions This study discovered that sharing a boundary with the District and the federal
government represented both an advantage and a liability to Arlington’s African
American community. The advantage was abundant Civil Service jobs. The liability was
loss of brick yard labor and farm labor as the brick yards were leveled to allow
construction of the Pentagon and the farms were subdivided to make way for new white
residential developments.
6.2 Background The previous chapter examined the residential patterns of Arlington’s African American
community during the first seventy years of the twentieth century, noting how African
Americans became progressively more limited in where they could live as Arlington
grew from a bucolic farming community into a white suburb of the District. This chapter
examines the impact that the proximity to the federal government and the in-migration of
whites had on the occupational opportunities of Arlington’s African Americans during
Segregation, a time when occupational opportunities were limited for most African
Americans.
During Segregation, entrepreneurial Arlington African Americans supported themselves
by running their own businesses. A few individuals worked in the building trades, a few
opened repair shops, a few ran small groceries and retail shops, a few provided barbering,
Page 90
77
babysitting, or cleaning services. These businesses were small, reflecting their limited
customer base; most African Americans satisfied all but their most basic business needs
at black-owned enterprises in the District (Perry and Waters, 2012). However, the
majority of the County’s black workers were wage earners.
The state adopted a new constitution in 1902 that disadvantaged the African American
community with literacy tests, poll taxes, and segregated schools, theaters, and
transportation (Guild, 1969). However, no provisions in the new constitution forbade
African Americans from working with whites. They were unnecessary; society enforced
separation of the races, limiting black occupational choice.
The manuscript census schedules list the occupation of each enumerated individual. As
white federal workers began migrating to Arlington, the variety of jobs available to
African Americans increased. Figure 14 shows the correlation between the total County
population and the number of job types available to black workers. An expanding
population spelled the need for more shops, services and industries, which in turn spelled
increased occupational choices. However, increased choices do not necessarily translate
to improved choices. In 1900 African Americans were working the least desirable jobs
from a small pool of job types. By 1940 they were working the least desirable jobs from
a much larger pool of job types. In 1900 no African Americans were working at the
country clubs. By 1940 the clubs hired African Americans to work as caddies, as servers
in the club dining room, as short order cooks in the snack bar. They did not hire them to
work as accountants in the office, as the business manager, as the club ‘pro’. In 1900
most workers held jobs on farms, in the brick yards, or as general laborers and domestic
Page 91
78
workers. By 1940 the farms were replaced by ever expanding white residential
neighborhoods, the last remaining brick yard was on the verge of being closed, a much
smaller proportion of African Americans were filling jobs as general laborers. Instead,
African Americans were working in jobs that did not even exist in 1900 including Civil
Service jobs. The Appendix is a list of job types worked by Arlington’s African
Americans as listed on the 1900-1940 manuscript censuses, illustrating how limited the
occupational opportunities were for the black community even as the number of job types
grew with each census. The 1940 list includes the gas station attendant but not the gas
station owner. The grave digger is there but not the funeral home director. Nurse’s aides
made the list but no nurses.
Figure 14: Correlation of Arlington population to black job types in 1900-1940.
Page 92
79
For years social scientists have analyzed the process of occupational choice. While
theories abound and each theory is unique, all agree that selecting an occupation is a long
process beginning in childhood and extending through young adulthood or even later.
Each theory emphasizes the role that social constraints such as racial segregation play in
informing the individual choice.
For example, Ginzberg (1988) describes the process as a series of age specific stages,
beginning in early childhood where children consider any/every occupation, continuing
in early adolescence where they narrow down their choices, until young adulthood where
they take action to make their occupational choice a reality. Their final choice is
determined by 1) their level of educational achievement, 2) their emotional response to
the environment, 3) their individual value system determining the ‘value’ they place on
various occupations, and 4) reality - the limitations imposed by the environment. Racial
segregation was a limitation on the occupational choices of Arlington’s African
American community.
Like all children, Arlington’s black boys and girls began their childhood having no
understanding of the limitations that segregation would put on their adult careers.
Gottfredson (1981) says that small children accept all occupations as possible choices.
Over time they become aware of their gender, social class, intelligence, interests,
competencies, and values. As they mature they focus on occupations they deem most
appropriate based on their maturing self concept. Where occupational requirements
conflict with the child’s self concept, a compromise takes place “…largely as a natural
process of learning what is typical and acceptable within one’s surroundings long before
Page 93
80
youngsters enter the job market” (1981:564). Seeing the occupational choices of the
adults in their environment helped them understand the occupations they too could aspire
to, but also the occupations they wanted to avoid.
Blau (1956) describes occupational choice as a series of crossroads in the individual’s
life, decision points that winnow the occupational alternatives. The final career choice
reflects a compromise between the individual’s estimation of the value of the work and
his/her ability to do the work. The winnowing process is influenced by factors within the
individual’s control (education, personality, values, social standing) and factors outside
his/her control (racial prejudice, market demand, job requirements).
Cultural values and work values guide individuals when they are making an occupational
choice. Arlington’s children learned the cultural value of responsibility and the work
value of diligence from watching their parents struggle under Segregation’s constraints to
take care of them. Brown (2002) said that cultural and work values combine with other
factors in our environment to either limit or encourage occupational choice.
Work is done within a work environment. When choosing an occupation the individual
is also choosing that environment. Holland (1985) defined six major work environments
and the occupations within each environment. Within their preferred environment,
individuals select an occupation that they are familiar with, and that satisfies their
assessment of themselves. Their choice is constrained by limitations imposed by society.
Occupation seekers targeted by racial segregation choose from the subset of occupations
open to their race.
Page 94
81
All of the above theories recognize the role that societal constraints play in occupational
choice. Segregation was a deciding factor in the occupational choices of Arlington’s
African American community. Arlington was unlike almost every other segregated town.
While it was once part of the Confederacy, it lies directly across the Potomac River from
the District and the federal government. This research explored the limitations on
occupational choice within the African American community living in Arlington during
Segregation, and the impact that Arlington’s proximity to the District had on those
choices. While race remains to this day significant to occupational choice, the focus for
this paper is limited to the years 1900-1970.
6.3 Methods Thousands of African Americans in communities across the United States lived and
worked under the constraints of segregation, each community with its own particular set
of circumstances, so a study of black occupational choice during Segregation must be
specific to the context where it occurs. This study of occupational choice is an intrinsic
case study, an optimal choice when the focus of inquiry is “the particularity and
complexity of a single case, coming to understand its activity within important
circumstances” (Stake, 1995: xi). The study explores the impact that Arlington’s unique
geography had on black occupational choice.
6.3.1 Data collection methods The study incorporated various data sources including interviews, oral histories, and
census data. The primary qualitative data source was semi-structured interviews. The
interviews were conducted during the summer of 2012. Snowball sampling was used
Page 95
82
(Weiss, 1994) to identify study participants for interviews. The fourteen participants,
eight women and six men, ranged in age from seventy-seven through ninety-three years
of age, with an average age of eighty-four, and were employed during their adult years.
Members of the sample came from each of the three larger black neighborhoods as well
as three of the smaller settlements. The oldest participant went to work after graduating
high school in 1939; most participants entered the workforce in the 1940s. Each
participant was given pages from the 1920, 1930, and/or 1940 manuscript census listing
the participant’s family. These pages helped to spark conversations about the
participant’s occupation (‘occupation’ is a data column on the census page). The
methods used for collecting the interview data are described in Chapter Four.
The interviews were augmented with oral histories. The lives of the sample of
participants did not represent the entire time span of the study. The oral histories added
data about occupations that no longer existed by the time the participants were old
enough to go to work, so including the oral histories increased the variety of occupations
represented.
Census data, both aggregate census data from 1900 through 1970 and manuscript census
data from 1900 through 1940, were incorporated into the study. The manuscript data
columns used for this study include the age, gender, family status, and occupation of the
individual.
6.3.2 Data analysis methods As the data sources are mixed, the analysis methods are similarly mixed, applying the
appropriate analysis method to each data source. The interview transcripts and the oral
Page 96
83
histories were analyzed using the techniques of grounded theory (Strauss and Corbin,
1998), as described in Chapter Four).
The Excel tables containing the manuscript census data were sorted first by race and
occupation to determine the number of African Americans in each occupational field.
They were sorted by race, gender, and occupation to determine the main occupations
worked by black women and the main occupations worked by black men. Because each
census was stored in a separate table, the above analysis was done for each census, and
then the results were plotted on a graph and analyzed. Manuscript census data identified
the types of occupations worked by African Americans, the percent of the black working
population in each occupational category, and the percent of the black population
engaged in work.
The aggregate census data were analyzed to calculate the percent of African Americans
living in each census tract and the percent of African Americans working in each of the
occupational categories identified by the Census Bureau. This could only be done for
1950, 1960, and 1970 censuses as 1950 is the first year when the Census Bureau used
census tracts as the area of enumeration in Arlington.
6.4 Results
6.4.1 Preparing for work – career training opportunities Holland (1985) stated that an individual’s occupational choice is constrained by his
environment, including the schools where the individual receives his career training.
Arlington’s segregated schools were inferior, leaving their graduates ill prepared for their
eventual careers. The only black high school in the County, Hoffman-Boston School of
Page 97
84
Negroes, opened in 1930 (Rose, 2009). Black Arlington teachers were paid less than
their white counterparts (Rose, 2009). Johnson (1970) says that it was typical in the
South for black teachers and other employees to receive lower wages than whites. He
posits that this was based on the assumption that African Americans have lower living
standards and requirements. When asked how they would rewrite their careers if they
could do so, many of the participants mentioned that they would have liked to teach, but
said that black teachers were paid so little at the time that they could not afford to do so.
The County spent less on black school buildings and supplies. Susan, from Johnson’s
Hill, told about her teacher’s trips to white Washington-Lee High School to collect
discarded books for use by the children at Hoffman-Boston:
It was “separate but equal” they called it. We got the books from North
Arlington. The teachers would go get the books and bring them and we
would clean them up. We would have to erase all the junk out of them
and everything.
Mary, whose parents sent her to school in the District, said:
The teachers at Hoffman-Boston were very good but they just didn’t have
the things to teach with because they got the leftover books from
Washington-Lee. All the teachers did the best they could, but they just
didn’t have the equipment.
The high school’s physical plant was substandard. Vincion, who attended Hoffman-
Boston and went on to be a custodian in the Arlington Public School System said:
Page 98
85
During some of the winter months when we were going to school there
was no heat in the building…So instead of me staying in class I went
down and learned about the furnace. And I got that junker going and I got
heat in the building. So part of my day was shot.
Hoffman-Boston provided little career training. According to Susan, a Hoffman-Boston
graduate, the school offered ‘shop’ classes for boys and home economics classes for girls.
Typing classes were available for everyone who could provide their own typewriter; the
typing classrooms at Hoffman-Boston lacked typewriters until the early 1950s (Coates,
1991).
The District’s black schools were considered the best black school system in the country
(Green, 1967). Because of their excellent reputation and because black teachers in the
District by law were paid the same as white teachers, black teachers from all over the
country competed to teach in the District’s black schools (Birmingham, 1977). The
District’s schools were funded by Congress (Green, 1967). A teacher from Halls Hill
said (Johnson, 2000):
But I always said I wanted to be a teacher but I will not teach in Virginia
because you don’t make any money. So I taught in Washington. Now
that’s one area where black and white teachers made the same money …
[M]y salary was the same to begin with as a white teacher would have
been.
Most participants’ families sent their children to District schools. Technically,
Arlington’s black students were not allowed to attend District schools once Hoffman-
Page 99
86
Boston was built, although an exception was made for children whose parents worked for
the federal government. However, many participants had relatives living in the District
and their parents enrolled them in District schools using the relative’s address. Ten of the
fourteen participants attended high school in the District. A resident from Halls Hill
whose father was a laborer for the Department of the Interior said (Deskins, 2001):
“When your parents worked in the federal government, you didn’t have to pay to go to
school in the District, you know. But a whole lot of kids out here went; they just gave an
address in Washington.”
Most of the participants attended Armstrong Technical High School, studying fields such
as printing, engineering, drafting, and architecture as well as the usual high school
subjects. Students who were destined for college were also taught college preparatory
subjects. One participant who went through Armstrong’s printing program was so skilled
that he was hired by a white printing shop immediately upon graduation. In time he was
the highest ranked printer at the Government Printing Office, printing the Congressional
Record and the Warren Report.
Two of the participants attended the District’s Cardozo Business High School, focusing
on business, accounting, and secretarial courses, with college preparatory classes for
those who wanted them. Students who intended to work after graduation were well
prepared in typing and shorthand before they graduated. One of the participants attended
Cardozo’s college prep business courses, graduated with a scholarship, and eventually
earned a degree in business administration from Howard University in the District.
Page 100
87
6.4.2 Laboring on the farms Black employment in the first quarter of the twentieth century reflects Arlington’s
farming roots. Figure 15 was created based on the occupational titles used by the census.
Over half of the farm workers were black in the 1900 census, and almost all were male.
Farmers and farm laborers are included in the ‘Farms’ totals. Prior to the twentieth
century, Arlington was largely farmland (Netherton and Netherton, 1987), first worked
by slaves (Rose, 2009) and later by black farmers and farm laborers. Black employment
in the first quarter of the twentieth century reflects those farming roots. Farm laborers
were counted in all parts of the County in early censuses; later censuses found them only
in northern census districts. Anita’s grandfather supported his family with a truck farm
near his home:
My grandfather had every kind of farming thing in that little space that he
had. We had three kinds of cherry trees, we had pears, and not many
apples but I think he had one apple tree called crab apple which you
couldn’t eat because they are so sour. But we had good grapes. Oh, we
had grapes…My grandfather used to take that produce down to
Washington Circle in the District and sell it. That was in Georgetown.
That is how he supported himself and his family.
The proportion of black workers who labored on farms gradually fell from 24 percent in
1900 to one percent in 1940. By 1950 the decennial census records no farms within the
boundaries of the County. Black farm employment evaporated as farms were consumed
by housing developments for the new white residents, many of them federal employees.
Because of growing residential segregation, the African American community was
Page 101
88
constrained to living in the existing black neighborhoods, which grew progressively more
crowded, while the small black settlements and settlements gradually disappeared.
Figure 15: Black employment in Arlington in 1900-1940
6.4.3 Working in the brick yards A number of brick yards were established parallel to the Potomac River in Arlington,
taking advantage of rich clay deposits located along the river. These brick yards were
documented as early as the 1870 census, when 4 percent of Arlington’s African
Americans were listed as brick yard laborers. In the 1900 census 80 percent of the brick
yard laborers were black men. Figure 16, a fragment of an 1878 map of Arlington (inset)
(1878 Alexandria County Virginia), shows (in ellipse) five brick yards: Appleman &
Bros, West Bros, Potomac Brick Works, Smitson Brick Yard, and Adamantine Brick Co.
One of the largest of these was West Bros (Figure 17). Bricks from this company were
used to build the White House, the Pentagon, the U.S. Supreme Court building and the
Capitol (Mackey, 1907). Brick yard laborers were counted in southern census districts
Page 102
89
through the 1940 census. The proportion of blacks laboring in the brick yards peaked in
the 1910 census and gradually fell off.
Figure 16: Arlington brick yards in 1878.
(1878 Alexandria County Virginia), Permission = public domain in the U.S.
Work in the brick yards was unpleasant. Vincion, describing his memories of the yards,
said:
I visited the brick yard as a kid. I remember it being really hot in those
places. The kilns that they used were like Eskimo huts...You could go
inside and go down a little ways – a lot of heat. I don’t know how people
could stay down in there. They had to go in to place the bricks and they
had to go in to get them out. They were still hot when they took them out.
Page 103
90
They didn’t let them cool down first because they were making them so
fast. It was a really hard job.
Figure 17: West Bros Brick Yard.
Reproduced with permission of the Virginia Room, Arlington Public Library.
The brick yards offered work not only to Arlington African Americans, but also to
African Americans from nearby cities who commuted to Arlington to work. Vincion
grew up in Queen City. He recalled:
A lot of people from Queen City worked for the brick yards. A lot of
people came from all over to work there. I know a gentleman…and he
lived all the way outside of Charlottesville, and he would come up to work
in the brick yard. There wasn’t much work down there, it was all farms,
so he would come up [to Arlington] to work and then he went back home.
A lot of people came up here to work, worked all week, and then went
home for the weekends.
Page 104
91
Other employment opportunities arose in support of the brick yard laborers. Florence,
who was born in East Arlington, reminisced:
I knew people who used to prepare meals and take to the people who
worked in the brick yards. I wouldn’t say it was catering, but they would
prepare meals and carry it down, lunch or dinner. I think they got paid at
the end of the week, when the people that worked there got paid.
This employment source ended abruptly in 1941 when the federal government in its
buildup prior to entering World War II exercised its right of eminent domain,
condemning the land occupied by West Bros brick yard and the two adjoining black
settlements, East Arlington and Queen City, in order to build the Pentagon. The African
American community lost both housing for one hundred fifty families and brick yard
employment for well over one hundred workers (Goldberg, 1992). While jobs in the
brick yards were lost with the building of the Pentagon, other work opportunities
eventually replaced them. Participants mentioned their neighbors, uprooted by the
closure of the brick yards, finding work constructing the Pentagon. Vincion described his
father’s role in preparing the land so the Pentagon could be built:
Lots of people were building the Pentagon. My father was driving
then…He was hauling all the sludge. It was a swamp. They had to dig
that out and haul it away. And they dumped that waste up on Johnson’s
Hill, in this area [Hatfield], Rosslyn, anywhere they found a place to
dump; that is what they did. And then they filled it in with dirt, brick,
Page 105
92
slag, whatever. They dug down as far as they could go to get all the loose
matter, and then they filled it in.
Once the Pentagon was complete in January of 1943, it provided jobs for many Arlington
African Americans. Martin, whose mother worked there, said:
After the Pentagon and the Navy Annex buildings were built she, as well
as some of the other ladies in Green Valley, were able to get custodial jobs
either at the Pentagon or Navy Annex. She was at the Navy Annex and
my grandmother was on the custodial staff at the Pentagon.
Ruth described the work her neighbors found at the new Pentagon:
Most of the men when they lost their job at the brick yard they worked as
custodians. [My neighbor] was an older gentleman. But he went to work
for the Pentagon. You know the night people who clean? And he retired
from that. They made more money and they probably had pensions.
Some felt that leveling East Arlington and Queen City to make way for the Pentagon was
an improvement. Ruth said: “Building that Pentagon was progress. We talked about
Queen City being torn down, leveled, but as years went on it made progress for this
area.”
Not all the participants agreed. Arlington’s black neighborhoods exhibited a strong sense
of community, forged during the trials of Segregation (Perry and Waters, 2012).
Participants who lived in the two settlements lamented the loss of their old neighborhood.
Florence, whose family was forced to move from East Arlington said:
Page 106
93
Do you know one thing, all of my friends that I went to school with, they
are gone. I have two friends that used to live in my neighborhood. They
live in DC. When we had to move from [East Arlington], that’s when they
went to DC. They never came back to this area. When East Arlington got
leveled, that really broke that community up.
6.4.4 General laborers and domestic workers While census data show farm laborers living in the northern enumeration districts and
brick yard laborers living in the southern districts, all enumeration districts were home to
general laborers and domestic workers. Figure 15 includes general laborers and day
laborers in the ‘Laborers’ totals while all servants, butlers, nannies, laundresses, and
cooks who said they worked for private families are included in the ‘Domestic’ totals.
Over time the number of general laborers leveled off, but during the ten year period
between the 1930 and 1940 census there was a sharp increase in the proportion of
domestic workers. This may reflect the adverse effect of the Great Depression. Virtually
all the participants mentioned the poverty their families experienced. The proportion of
the African American community that was employed grew from 47 percent in 1930 to 53
percent in the 1940 census. Perhaps this explains the increase in the number of domestic
workers, as girls and young women went to work as maids and domestics to help their
families make ends meet. Vincion discussed the lengths his parents went to provide for
their children during the Depression:
They worked hard to try to keep us together, to feed us and clothe us. My
dad was driving truck, and my mother worked. She took in ironing
Page 107
94
clothes for people and she was working over at Fort Myer, at the laundry
or dry cleaners over there…she ironed clothes for people and she made
beautiful hot rolls every weekend. That helped us to survive – she ironed
and she made hot rolls for people.
Career ambitions were truncated as students dropped out of college to support themselves
and their families. Orze reminisced:
At [the time that I got out of high school] jobs were hard to find. When I
first came out of high school I went to Miner Teachers College for one
semester. But I couldn’t afford to buy clothes to wear to school. I had to
keep wearing the same clothes day after day. My father was dead at the
time.
A sharecropper’s son explained why his family left the farm and moved to Halls Hill
(Williams, 2001):
We didn’t have nothing to eat half the time when we first came here,
wasn’t much to eat. During the Depression, between ’29 and ’30, ’31 we
didn’t have much to eat. [My father] didn’t have much of a job. [My
mother] stayed in Leesburg because she was working as a maid in a
kitchen, so she stayed there. But my father came because there was no
work or nothing like that. One of my older brothers, he would find
something so we could have something to eat. We went hungry many
days because we didn’t have much to eat. He’d pick up something just to
tide us over until my father got a real job.
Page 108
95
Ruth came home after one year of college in Richmond because her mother was too sick
to continue doing domestic work and could no longer afford to send her to school: “But
my mom took sick and when I came home she said ‘You probably will only make that
one year.’…She was not well. There were things at home…she just could not manage.
So I came home, and I went to work.”
The Depression impacted whites as well as African Americans. One Halls Hill resident
who worked as a domestic for a white couple in the early 1930s said (Graham, 2003):
I worked for Mrs. Smith first. Mr. Smith, bless his heart, they got too poor
to pay me. And the man, he had arthritis and he couldn’t even tie his
shoes…I lived with them. I lived in the house with them and I had to tie
his shoes, and after he got his shower and everything, I’d help him get his
shirt on because he had arthritis so bad, and then I left them and went to
work for Mrs. Martin, and that’s where I was when I got married.
Over time the types of jobs available to black workers increased. Ruby commented on
the increase in the variety of work available: “A lot of them from my mother’s and my
father’s generation worked those [laundress, brick yard, and domestic] jobs. But as we
came along there were more opportunities. When my children came along there were
just so many other things they could do.”
6.4.5 Working for the federal government in the Civil Service African Americans who did not choose to labor in the brick yards or on a farm, or who
were not interested in ironing a white family’s laundry had another option – working for
the government. The Pendleton Act, mentioned above, created the Civil Service –
Page 109
96
providing employment in trades and professions as well as in clerical and administrative
work. Figure 15 illustrates the popularity of the Civil Service career choice for
Arlington’s black workers. Eleven of the fourteen participants worked in the classified
Civil Service, many in clerical positions, for at least some portion of their careers (Figure
18). The three who never worked a Civil Service job left school before graduation to go
to work.
Figure 18: Arlington Civil Service employee.
Photo courtesy of Florence Ross.
Civil Service jobs were, in theory, available to African Americans in federal offices
nationwide. While the Civil Service Commission encouraged all federal hiring offices to
Page 110
97
treat job seekers equally, until the Ramspeck Act of 1940 was passed, prohibiting
discrimination in federal employment (Van Riper, 1958) many regional offices
discriminated on the basis of race. One Halls Hill resident who lived in Texas during the
Depression described the problems he had finding Civil Service employment in Texas
(Browne, 2001:11):
I was a messenger for the Veterans Administration and when I found out
they had electricians, a fella told me “You go down to see Mr. Mann, the
fella on the first floor.” So I went down and said “Mr. Mann, I’m a
graduate electrician and I notice you have electricians.” He said, “Son,
wait a minute. I’ll save your time and my time. It’s not the policy of the
United States government to hire Negroes as electricians.” And I said,
“Now that ain’t right. This is supposed to be Civil Service.” I went to
Civil Service. Civil Service people said, “They can hire whomever they
please.”
During segregation such positions were not open to African Americans in many regions,
but in the District that was not the case. Not all of the jobs required a high school
diploma, and others only required the applicant to demonstrate the ability to type.
Compared to the general labor and domestic work available to African Americans in
Arlington, the Civil Service positions paid well, and offered the security of a pension.
Many of Arlington’s black workers chose to stay in the Civil Service, rising to the highest
levels possible within the limits of their education and ability, until they retired.
Page 111
98
Getting hired, however did not guarantee that black employees would be treated
equitably. Ann, a former civilian employee of the Marine Corps, hired in 1942, recalled:
[Y]ou just move up. Somebody retires and you take your turn. It wasn’t
always that way and it wasn’t automatic – not by any means because I was
passed over many times and did not get jobs because Marine Corps was
one of the last and I think they resisted integration more than any of the
other branches, I believe. I certainly did experience it.
Most of the participants entered the Civil Service on the bottom rung as messengers,
clerks, and typists. In 1938, five percent of the District’s black population worked for the
Civil Service. Of those, 90 percent held custodial jobs, 9.5 percent held clerical jobs, and
only 0.5 percent held sub-professional rank jobs (Green, 1967). At the same time, 12.8
percent of Arlington’s African Americans were Civil Service workers. The existence of a
large group of African Americans who were willing to accept a low level job and a
government looking for workers to fill low level jobs was a happy coincidence. The
African Americans got steady employment, received what they considered a good salary,
and earned a pension. The government got employees who valued their job and worked
to keep it because there were so few other employment opportunities.
Isaiah, who worked for Civil Service after serving in the Coast Guard during World War
II, said:
Of course the blacks didn’t have the big jobs. I went in as a messenger. Back in
those days they had messengers carrying things around. They didn’t have
computers and everything, you know. So I went in as a messenger and worked in
Page 112
99
the post office where mail would come in at the War Department…That was a
good job.
James, who was drafted into the Navy during World War II, and returned home to work
for the Department of Veterans Affairs as a clerk for the rest of his career said:
It was a good job working for the government. They had a pension. That is what
I am living on now.
Anita’s father was a trained pharmacist who could not find work in any white owned
pharmacies. He too turned to Civil Service to support his family:
Anyway, [my father] went to work as a messenger in the State Department, which
was a good job for them then. It was a good job. Everybody was looking for a
good government job.
Three of the participants held Civil Service jobs when they were drafted to serve in
World War II (Figure 19). Thanks to the Veterans’ Preference Act, they resumed their
jobs on returning from the war. One participant from Halls Hill benefited further from
this Act. Prior to the draft he was turned down by the Civil Service for an apprenticeship
as a machinist because he was two years older than the cutoff age, so he took a Civil
Service job as a machinist helper instead. The Veterans’ Preference Act lifted the
apprenticeship age restrictions for returning veterans; on his return from the War the
participant began his apprenticeship and enjoyed a long career as a machinist for the
federal government.
Page 113
100
Figure 19: Black Arlington World War II servicemen.
After service in World War II black soldiers, sailors, and coastguardsmen returned to Arlington and the Civil
Service jobs they left behind. Photos courtesy of George E. Jones, Melvin Green, and Milton Rowe.
Most of the participants entered the Civil Service not by choice but by necessity. Anita,
who dreamed of studying fashion design, got her first taste of secretarial work in a New
Deal program for young adults:
They had a program for young people in high school. My mother got me
in the National Youth Administration program; it was a program
nationwide and I worked in an office at Howard University in the School
of Religion. I will never forget it. …So this was my introduction to office
work. …So when I took the [Civil Service] typing examination I was
ready.
Opportunities for African Americans in private industry were so scarce that Civil Service
positions were often the only choice. Ruby told why she took a government job:
I always wanted to be a secretary so I went to Cardozo Business High
School in D.C. After I graduated it was funny because you could look in
Page 114
101
the paper and it was saying ‘high school education’ and the first thing they
would ask you [when you called to apply for the job] was what school did
you graduate from and as soon as you said one of the black schools they
would say “Oh I’m sorry, that’s been filled.” …It was kind of hard to find
employment even after you came out of high school unless you went into
the federal government.
Some participants were inspired by their parents, such as Susan who reminisced:
The thing with my father was, when he worked [as a custodian] in the
government buildings he used to see the girls taking shorthand. He
thought that whatever you do, you must learn how to take shorthand. You
have got to learn how to do that. If you are going into business you have
got to do that. Those girls are really something.
Others were inspired to avoid the work their parents had done. Ruth, whose mother
worked six days a week as a domestic for private families, realized that she had to get the
necessary skills to avoid domestic labor:
And I remember one summer I didn’t have a job, and she worked for one
family and the sister said she needed somebody to iron so my mother said
“Take the clothes over to the house. [Ruth] will do it.” I was at home
during the day. I thought “I don’t want to do this for the rest of my life.”
That made an impression on me.
Living in a segregated society has a negative impact on career advancement. Information
about employment opportunities is often spread through a network of informal social
Page 115
102
contacts (Crain, 1970; Granovetter, 1974). In segregated Arlington African Americans
learned about job openings in the low level fields that their friends and neighbors worked,
not job openings in the high level fields occupied by white society. Ruby, who worked at
the National Security Agency (NSA), explained how she got her job as a key punch
operator: “I knew someone who worked there. They couldn’t get me the job, but they
could say ‘You know NSA is going to hire for such and such a thing.’” Albert described
how he helped a member of his social network find work: “Every time I moved up, one
of my high school friends did too. Every time I moved up I would pull him into the job I
vacated. When I left to go to the university I pulled him into my job.”
6.4.6 Working in Arlington – 1950-1970 Figure 20, Figure 21, and Figure 22 were created using aggregate data from the 1950 –
1970 censuses. The data used in this section compare census totals for workers living in
the three largely black census tracts with workers living in the 35 largely white census
tracts. In 1950 the black tracts were 81 percent black while the white tracts were 99
percent white. The figures depict the percent, not the count, of all African Americans and
all whites working in each particular occupation group. For example, in 1950 only five
percent of Arlington’s residents were black; ten percent African Americans worked as
craftsmen while eleven percent whites worked as craftsmen.
Page 116
103
Figure 20: Arlington African American occupational categories in 1950.
In 1960 the 35 white census tracts were 98 percent white. The three black tracts were 96
percent black. The percent of African Americans in the County rose to almost six percent.
Figure 21: Arlington African American occupational categories in 1960.
Page 117
104
In 1970 the 35 white census tracts were 96 percent white. The three black tracts were 92
percent black. The percent of African Americans in the County rose to slightly over six
percent.
Figure 22: Arlington African American occupational categories in 1970
By 1950 farmers, farm laborers, and brick yard workers no longer appeared in
Arlington’s census totals. The last farm was lost to residential development prior to the
1950 census; the last brick yard was lost to Pentagon construction in 1941. The authors
were unable to locate participants who had worked as farmers or brick yard laborers.
Ruby explained: “A lot of them from my mother’s and my father’s generation worked
those [farmer and brick yard] jobs. But as we came along there were more opportunities.
When my children came along there were just so many other things they could do.”
Comparison of the 1950 census totals in Figure 20 with Figure 15, and comparisons of
Figure 20 with Figure 21 and Figure 22, reveal a gradual improvement in the occupations
Page 118
105
worked by Arlington’s African American community in the waning years of de jure
segregation. The percent of workers in laborer positions gradually fell as the farm and
brick yard laborer positions disappeared and as other opportunities opened up. The
number of clerical and ‘office’ jobs increased. In 1940 the Civil Service employed
thirteen percent of Arlington’s workers. This total included all Civil Service workers,
including printers, soldiers, clerks, machinists, and laborers. By 1950, fifteen percent of
Arlington’s workers were doing clerical work, mostly working for the Civil Service, and
that number continued to increase in the succeeding censuses. The percent of black
domestic workers fell from an all time high of fifty percent in 1940. Other than ministers
and a few teachers and doctors, African Americans in 1940 held almost no jobs in
professional, managerial, and sales positions. Totals in those fields increased with
succeeding censuses.
The participants spoke with satisfaction about how their children and grandchildren, often
college educated, had more occupational opportunities than they had. George, who ran a
TV repair shop, said of his sons, both successful businessmen: “My kids are on a
different level than I am in terms of education. [My youngest son] is very, very good at
what he does. He has four or five people who work for him.”
6.5 Discussion The theories of occupational choice describe the process an individual experiences while
selecting a career. Variables peculiar to the individual, including environmental factors,
rule out many of the possible occupations. One such environmental factor is segregation.
This paper discussed how proximity to the District and to the federal government
Page 119
106
influenced career choice for the African American community in Arlington, Virginia
during Segregation.
The participants’ work lives were easier than the work lives of their parents. They
remembered their mothers working as domestics for private families six days a week and
taking in laundry to wash on the seventh day. They remembered their fathers coming
home after a day of carrying bricks out of a baking hot brick kiln at West Bros brick yard.
As their parents had done before them, the participants worked hard so their children
would do even better than they had. Appreciating the value of an education, many
expressed pleasure in the fact that they had sent their children to college, an opportunity
that most of the participants themselves lacked. Many of those children have gone on to
professional careers, doing their parents proud.
The story of Arlington’s African American community during this trying period would
have been so different if Arlington was not next door to Washington, D.C. The proximity
to the District gave many young Arlington African Americans the opportunity to attend
District high schools and learn saleable job skills, and the opportunity to then market
those skills, often to the federal government. Arlington was a magnet for whites fleeing
the congestion of the District. The whites required new residential developments where
there was once farm land, pushing African Americans out of their small settlements and
settlements into the black neighborhoods, and segregating them residentially. The arrival
of the whites spelled the loss of farm jobs and the gain in service jobs to support the new
white residents. The federal government, in building the Pentagon, destroyed the brick
Page 120
107
yards where African Americans had long worked, and replaced them with an abundance
of low level service jobs.
The participants were philosophical about the impact that segregation had on their
occupational choices. Segregation was all they had known all their working lives. Each
person was asked to talk about the limitations they experienced when entering the job
market but no one accepted the invitation to complain. Instead, they described how hard
their parents worked, how supportive their neighbors were, what an inspiration their
teachers had been, how proud they were to send their children to college. Several told
stories about a time in their lives when a white person helped them out. Segregation had
limited the career options of this group but it went unmentioned.
6.6 Conclusions The huge in-migration of white federal workers eliminated some occupational choices for
African Americans living in Arlington when farms were eliminated to make room for
residential developments. At the same time, the increased population created many more
low level service jobs. Proximity to the federal government eliminated other
occupational choices of African Americans when the last brick yards were leveled to
make room for the Pentagon. But once the Pentagon was completed it provided many
new Civil Service job opportunities for African Americans. Excellent job training was
available to the Arlington children who attended the black school system in the District.
Page 121
108
CHAPTER SEVEN: BUSINESSES4
The previous chapter examined the types of employment available to Arlington’s black
wage earners during Segregation. Some black residents chose to run businesses of their
own rather than seek employment elsewhere. Most of these could be considered
survivalist entrepreneurs, “persons who become self-employed in response to a desperate
need to find an independent means of livelihood” (Boyd, 2000a:648). This chapter
explores the types of businesses that were started by Arlington’s African Americans
during Segregation.
7.1 Abstract
7.1.1 Background During Segregation, African Americans were unwelcome to trade in almost any kind of
business in Arlington other than grocery stores. Some residents started their own
business, providing themselves an income and providing the neighbors the goods and
services they could not obtain from the white community. Because the black
neighborhoods were dispersed, lacking public transportation, the customer base
comprised only those living within the neighborhood where the business was located.
4 The majority of the material included in this chapter was submitted as a manuscript and
published: Perry, N. and Waters, N.M., 2012, Southern Suburb/Northern City: Black
Entrepreneurship in Segregated Arlington County, Virginia. Urban Geography, 33(2),
655-674. The data gathering and analysis were done by Nancy Perry, and the writing
mainly by Nancy Perry. All authors contributed important intellectual content and
provided critical review of the papers.
Page 122
109
For goods and services not available in their own neighborhoods, Arlington’s black
community traded in the extensive black-owned business establishments in nearby
Washington, D.C.
7.1.2 Methods Using aggregate census data and a Geographical Information System, three census tracts
were identified that were home to most of the black population. Using 1950 telephone
records, lists were compiled of businesses located within those tracts. During semi-
structured interviews of black residents who were adults during Segregation, the lists of
businesses were refined, removing white-owned businesses, adding businesses not on the
lists.
7.1.3 Results Almost all black-owned businesses built during the study period were small home-based
businesses that supplied immediate needs. These included restaurants, convenience
stores, beauty salons and barber shops, and repair shops, almost all located in the owner’s
home. Once Arlington integrated and African Americans were allowed to trade in white-
owned businesses, the small neighborhood businesses slowly disappeared.
7.1.4 Conclusions The nature of the businesses built by the African American community during
Segregation was largely determined by the County’s geography. The black
neighborhoods provided too small a customer base to support any but the small
businesses with low overhead. Lack of public transportation between the neighborhoods
made shopping in the District easier than shopping in another black neighborhood so
Arlington’s African Americans satisfied most business needs in the District.
Page 123
110
7.2 Background With the turn of the twentieth century, Arlington grew from a collection of small
integrated settlements into a majority white suburb. The spirit of Jim Crow settling on
the County made African Americans increasingly unwelcome in white society, including
in white-owned enterprises. Severely limited in their ability to work with or shop in the
white community, African Americans built businesses in their own neighborhoods.
Largely working out of their homes they supported their families and provided many of
the goods and services needed by their neighbors. In the process their neighborhoods
grew cohesive and self reliant. Black entrepreneurs faced many obstacles during
Segregation, including the inability to borrow money from white-owned banks, buy land
or buildings in white areas zoned for business, get business licenses from the County, hire
white workers, or work for white customers. Integration dismantled many of the barriers
to African Americans – where they could live, where they could shop, where they could
work. Integration also removed the need for many of the black-owned businesses built
during Segregation. While most of the small businesses eventually closed, the
communities they had served remained cohesive.
7.3 Methods This chapter uses aggregate census data from the 1950 through 2000 decennial censuses.
In 1950, 80 percent of Arlington’s African Americans lived in only three of Arlington’s
38 census tracts: tract 8 - Halls Hill, tract 31 - Green Valley, and tract 33 - Johnson’s Hill,
so those tracts were the focus of this chapter.
Abiding by state statute 010255, Arlington County is not required to retain business
license records for longer than three years or the date of the last audit, so no official
Page 124
111
records remain of black businesses from 1950.5 The business license records, had they
been available, would not have given a complete picture; African Americans applying for
business licenses during Segregation were frequently turned down. Therefore, they often
ran their businesses unlicensed out of their homes (African American Businesses in
Arlington, 2005).
Census tracts were selected as the area of enumeration because the boundaries around the
three black census tracts closely matched the boundaries of the three black
neighborhoods. Johnson’s Hill was completely black; the tract boundaries exactly
matched the neighborhood boundaries. The other two tracts were both 78 percent black;
the tracts were slightly larger than the neighborhoods. Another 20 percent of Arlington’s
African Americans lived in small settlements outside the three neighborhoods. Because
there is no way to relate the census totals to the settlements, (Arlington census data are
not available at a block group level or block level until 1990) the settlements were not
included in this chapter.
The names and addresses of businesses located within the three black census tracts came
from two sources. One source was a cross referenced telephone book from 1950. Using
a County map, a list was made of the names of the streets that ran through the tracts and
their address ranges within the tracts. Any business listed in the telephone book on any
of those streets within the address ranges was assumed to be black-owned. This gave
only a partial listing, as only those businesses that listed themselves in the telephone book
were included.
5 Telephone conversation with an employee at the Office of the Commissioner of
Revenue, Arlington County, 18 May 2010.
Page 125
112
The other source of business names came from semi-structured interviews with eighteen
residents of the three black tracts. The interviews were conducted during the summer of
2010. During the interviews the authors’ telephone book lists were discussed, the
participants identified businesses on the authors’ lists that in fact were not black-owned,
and those businesses were removed. Approximately half the businesses on the Halls Hill
and Green Valley lists were white-owned businesses on commercially zoned streets on
the boundaries of the tracts. Johnson’s Hill has no commercially zoned streets and no
white-owned businesses were identified. Most participants remembered every business
on the authors’ list and the race of the business owner. Several individuals from each
tract were interviewed, and their answers corroborated. Race was important during
Segregation and African Americans were as aware of it as were the whites. At least one
of the participants from each tract came prepared with a list of businesses located in
his/her neighborhood during Segregation. The participants’ lists were discussed and any
businesses that were not also on the authors’ list were added. In this way a master list for
each tract was created.
Snowball sampling was used to select the participants, including six males and twelve
females with an average age of 80 years. Sixteen of the participants were born in
Arlington, most of them prior to 1930; all reached adulthood in Arlington well before
Arlington desegregated. Some of the participants owned and/or ran businesses; others
were customers of black-owned businesses.
During the interviews, the participants mentally walked the streets of their neighborhood,
describing the businesses they remembered. Depending on their age, different
Page 126
113
participants remembered different businesses but all of the participants from a given
neighborhood remembered most of the same businesses. There was attrition among the
businesses. The participants often talked about a business, mentioning the business it
replaced at that site or the business that replaced it. The participants’ world was so
constrained by segregation, there were so many places that they were not allowed to go,
but they clearly remembered the places where they could go. Some businesses probably
were left out, but the authors feel the final list was suitable for our purposes. Table 8 is a
list of all the black-owned businesses in the three tracts that surfaced either from the 1950
telephone book or from the interviews with the participants.
Page 127
114
Table 8: Black-owned businesses in the three African American neighborhoods
7.4 Results From the time black families first bought land in the three tracts (Green Valley in 1844,
Halls Hill and Johnson’s Hill shortly after the end of the Civil War), the neighborhoods
Page 128
115
grew in parallel, but also in isolation from one-another. Until the 1940s there was no
cross-County bus service. The black-owned Hicks Bus Line ran a bus from Halls Hill to
a transfer point in Rosslyn, where passengers caught a bus going into the District. The
white-owned Arnold Bus Line ran a bus within walking distance of both Green Valley
and Johnson’s Hill to the same transfer point in Rosslyn. But no bus line ran between
North and South Arlington, with the result that traveling to the District was easier than
traveling to another black neighborhood. In 1950 the District had a much larger black
population than Arlington. Of the 802,178 residents of the District, 280,803 (35%) were
black. That large black population built a commercial infrastructure that African
Americans from Arlington were welcome to access (Birmingham, 1977; Ruble, 2010).
The participants reminisced about trips to the District to buy clothes, go to a restaurant, or
attend a performance. Every informant agreed that neither they nor their families ever
traveled to one of the other black neighborhoods in Arlington to shop.
The small businesses were perhaps the strongest influence in uniting each neighborhood.
As Ingham points out (2003:665) “It is a great irony that the evil of Jim Crow, under
which black Americans were subject to segregation, humiliation, and persecution,
encouraged black capitalism to flourish.” He notes that an unintended result of the
establishment of the black-owned businesses was the way they helped to unite the black
neighborhoods. In Arlington a number of businesses, mostly home-based enterprises,
catered to the people living in each settlement. Most of them offered services – few of
the residents had the resources to open a retail business.
Page 129
116
Locating the business in the home was born both of necessity and of convenience. It was
difficult and expensive to buy land and erect a shop to house a business. It was cheaper
and easier for the business owner, particularly women with young children, to run the
business from home (Boyd, 2000a). Some of the entrepreneurs were so ambitious that
they ran several businesses at one time. One Johnson’s Hill informant described a family
in her neighborhood that ran a beauty shop out of their living room and a restaurant out of
their dining room. The family of one Green Valley informant ran a taxi service, a
restaurant, and a beauty shop, and sold heating coal, oil, and ice.
The participants all agreed that no whites ever came into their business establishments.
The only exception was offered by Harriett, who ran a small restaurant in Green Valley.
Her restaurant was close to the lot where County snow removal equipment is stored. She
explained:
We never saw any white people unless they were delivering beer or
something. No whites came there to get anything. But the ones who
worked for the County – the ones who had to work with snow, men who
worked day and night, any color came. We made an agreement with the
County that we would serve them breakfast and dinner too.
7.4.1 Food The only white-owned businesses in Arlington where all the participants mentioned
feeling welcome were the grocery stores. No one remembered being turned away from a
Safeway or an A&P. Still, there were no Safeway or A&P stores in the black tracts; they
were all several blocks away. Therefore, small groceries and convenience stores opened
Page 130
117
in each tract. It was difficult for the small black grocery stores to compete with the
Safeway in price or selection. However, they had one advantage - a resident was allowed
to purchase groceries on credit. Ruth explained how the owner of the grocery store in her
neighborhood handled her credit customers: “She kept what we called weekly accounts
and people would pay her as they got the money. People would come in and want
something and she had that book and she would say ‘you still owe $5.’”
Many of the participants mentioned shopping at the ‘Jew store’, small groceries run by
Jewish proprietors. Every tract had a Jewish-owned grocery. Some of the groceries also
had small restaurants where beer and food were served. Hick’s Grocery in Halls Hill
(Figure 23), the Middleton Store in Johnson’s Hill, and the Green Valley Market are
examples of such store/restaurants.
Page 131
118
Figure 23: Hicks Restaurant and Market in Halls Hill in 1960.
This image was taken shortly before the building was demolished. Reproduced with permission of the Virginia
Room, Arlington Public library.
African Americans were unwelcome to eat in white-owned restaurants. Several
participants said that if their family went to a restaurant it would be to a black-owned
restaurant in the District. Every tract had a few small restaurants, some of these located
right in the owner’s kitchen. One informant, the operator of the Shady Dale Restaurant in
Green Valley, did all the cooking, dishwashing, and shopping herself, buying enough
food for a few days at a time. Her biggest sales were Fridays when she did a fish dinner
carry-out business for offices at the Pentagon. The Dun Movin’ Restaurant in Green
Page 132
119
Valley was described in a video about early black businesses as being so upscale that
African Americans from the District traveled to Arlington to eat there (African American
Businesses in Arlington, 2005).
7.4.2 Housing Because of the dearth of housing there was a big demand for the services of construction
craftsmen and builders. White builders were unwilling to build individual homes for
African Americans. George explained “When blacks needed a house built they could
only hire a black contractor so there was plenty of business. There was never a lack of
need for housing.” The construction trades were represented in every tract, including
bricklayers, plasterers, plumbers, electricians, and general building contractors.
Craftsmen worked directly out of their homes. Until integration, white builders refused
to hire blacks, so most black craftsmen worked for black builders. Without competition
from the white builders, the black builders had ample work – if they could find land to
build on and get financing.
Finding vacant land was problematic. The three tracts were limited in size and land
outside the boundaries of the three tracts was simply not for sale to African Americans.
Each informant, when asked to describe the black/white boundaries of his/her
neighborhood, could list the streets beyond which no African American could live (and
within which no white would live).
When lots did go on sale the problem was arranging the financing. Neither the builders
nor prospective homeowners could borrow money from an Arlington bank. Of his father,
George explained “[He] couldn’t go in an Arlington bank to borrow money. He could go
Page 133
120
to the District to get money but not for a loan to build in Virginia. Banks were chartered
in the area in which you lived so you couldn’t go to [the District] to get money to build in
Arlington.” Often, according to the participants, the seller lent the money to the buyer, or
the buyer found another person who would make a personal loan to him to buy the land
and/or house. Esther, who experienced such a sale in Green Valley, said: “If I had lots to
sell I sold it to someone black, so we made an agreement with each other. Then we had
to go to the Court House and register the sale.”
One businessman who needed a loan to build a repair shop in Green Valley told of
befriending a white man who eventually offered to lend him the money for his new shop,
as long as he promised never to mention where he got the money. The Green Valley
building contractor’s son discussed the secret to his father’s success. His father made
friends with a white man who was a partner in a white mortgage and real estate company.
This man funded the father’s construction projects and held the mortgages on the
buildings once they were sold.
7.4.3 Transportation Until the 1940s Halls Hill was physically isolated from both the other black settlements
and from the District. This isolation inspired two Halls Hill entrepreneurs to create taxi
companies. Crown Cab is still in existence. The black-owned Hicks Bus Line took
residents of Halls Hill to the transfer point in Rosslyn. This enabled the inhabitants of
Halls Hill to reach jobs, shopping, and school in the District. Green Valley also has a taxi
company, Friendly Cab, started in 1943. The son of Friendly Cab’s owner explained
about his father “Well, he had the restaurant. I guess people would come in the restaurant
Page 134
121
and talk about needing a ride here or there and he decided he could open the business for
them.” All the Friendly Cab drivers were black, many of them off-duty black firemen.
7.4.4 Personal Services Skilled and unskilled personal services were available in every tract. Many of these
businesses were home based, such as the two window cleaners, the six seamstresses, and
the thirteen home health care nurses. The watch, TV, and shoe repairmen operated out of
small shops (Figure 24).
Figure 24: Mr. Walker at his shoe repair shop.
If you were African American and your shoes needed to be repaired you took them to Mr. Walker. His store was
the only shoe repair shop in Arlington that served African Americans. © Lloyd Wolf/Arlington Photographic
Documentary Project. Reproduced with permission.
Page 135
122
Each tract had several black-owned beauty shops and barber shops, most of them
operated out of the barber or beautician’s home. Ruth, emphasizing that these were
professional hair care shops that just happened to be in the operator’s basement,
reminisced “They wore white uniforms. And when customers came, they rang the bell.”
One of the participants was the daughter of the founder of the Friendly Beauty School in
Green Valley (Figure 25). By the time her mother retired she had trained over 300
students. There was no lack of work for them once they graduated.
Figure 25: Mamie Brown’s Friendly Beauty School
Mrs. Brown graduated more than 300 students, who went on to own and operate beauty shops of their own.
Photo courtesy of Aaronita Brown.
Page 136
123
7.4.5 Professional Services The literature (Bates, 2007) describes the plight of professional African Americans, who
could only hope to work in black areas with black clients. Such was the case in
segregated Arlington. During the entire period of the study there were four doctors
available to the residents of the three tracts, two practicing in Halls Hill and two in Green
Valley. There were two lawyers, a single dentist and a single pharmacist serving the
entire Arlington black community during the lifetime of the participants. The two funeral
homes in Green Valley are still in operation (Figure 26), but the two private schools have
both closed. In addition to the beauty school, a kindergarten operated in Johnson’s Hill,
started when the owner was unable to enroll her child in a white-owned kindergarten.
Page 137
124
Figure 26: Chinn Funeral Home
Black-owned mortuaries were guaranteed to have customers because African Americans were unwelcome in
white-owned mortuaries. The Chinn family opened their funeral home in 1946. It is still in operation. © Lloyd
Wolf/Arlington Photographic Documentary Project. Reproduced with permission.
Page 138
125
7.4.6 Impact of desegregation on the black-owned businesses The strong sense of community that developed during Segregation survived integration.
Almost every informant still lives in the same neighborhood where he/she grew up.
When discussing their neighborhoods they remember virtually every address, every
business, and every family. They were amused by the suggestion that once the Fair
Housing Act was passed African Americans would move out of their tract into the white
neighborhoods. A Halls Hill informant explained “Those [black] people who moved into
the white areas of Arlington were people who came from out of state. People who moved
out of Halls Hill moved to another state. They didn’t move to other parts of Arlington.”
Half of the participants continued to operate their businesses for several years following
integration. All but 13 of the original owners of the businesses listed in Table 8 have
died. Of those who survive, only two continue to work in their business – the owner of
the pharmacy and the owner of a TV repair shop. Most of the businesses (100) died with
their original owner. A few (19) continued to operate for at least a limited period, some
run by relatives of the original owner, the others sold to outsiders. Of those, nine are still
in operation. These include the funeral homes, two taxi companies, four barber/beauty
shops, and one real estate agency. Only the businesses that required a large initial
investment (a building, a fleet of taxis) survived integration.
None of the home-based businesses is still open. Phyllis explained what happened to the
home-based businesses in Halls Hill:
Over time they disappeared but they certainly didn’t just immediately go
away. Even when Arlington integrated there wasn’t this overwhelming
‘please come in’ attitude. On our part there wasn’t this ‘I want to run over
Page 139
126
there because now I can’ attitude. So it took a while for those two pieces
to merge because people here still had this sense of community and all
these years they had been contained in Halls Hill. It took awhile for
people to branch out.
While the black residents began patronizing white businesses, the white community in
Arlington, much like the white communities in other recently desegregated areas (Bates,
1997), did not patronize the black businesses. This may have hastened the decline of the
black businesses.
The participants gave various explanations for why the businesses finally closed. One
successful Green Valley builder's children carried on their father’s business for a time,
but decided it was not to their liking. The son extolled the father’s work ethic and
explained “I didn’t have that tenacity that my father did.”
In several cases business owners sent their children to college. The owner of the Green
Valley TV repair shop explained “My kids are on a different level than I am in terms of
education. [My youngest son] is very, very good at what he does. He has four or five
people who work for him.”
Still, some of the business owners hope to hand their businesses down eventually to their
children. Asked what would happen to his Green Valley taxi company when he is no
longer able to run it, the owner said “I have a son and a nephew. They might want to take
it over. I have to have it in shape to hand over to them.”
Page 140
127
7.5 Discussion Arlington is a Southern city in a Southern state. The businesses built by black Arlington
entrepreneurs displayed some of the characteristics of a typical black settlement in a
Southern city as described by Ingham (2003) (small businesses selling services) but did
not display others (a main black shopping street, anchored by one or more large
businesses). Arlington’s black business model did not follow the pattern of Northern
communities either. African Americans in Northern cities tended to cluster in large
settlements, most of the businesses being located along a few streets. Although
Arlington’s black community was large enough (6500 African Americans in 1950) to
support a proper business district, the residents were dispersed in three small
neighborhoods and a few even smaller settlements.
Most of the businesses offered services rather than goods. The profusion of service
businesses and the paucity of retail stores reflect the general poverty of the
neighborhoods, and possibly the inability of shopkeepers to get business loans at white-
owned Arlington banks. Survivalist entrepreneurs offered services such as hair care,
tailoring, babysitting, or window washing – businesses that required very little
investment to get started. To minimize the expense of running such a business, the
owners often located the business in their homes. Eighty percent of Arlington’s black-
owned businesses were home-based.
Public transportation (bus) connected the neighborhoods to the District, but did not
connect them to each other. Because the individual neighborhoods were so small (the
largest had only 3000 residents in 1950) and because the lack of public transportation
meant that the only customers of a business were residents of that neighborhood, no
Page 141
128
business had a large enough customer base to enjoy anything more than a marginal
existence. The African American community survived these trying conditions because of
their proximity to the District, where a much larger black population had built an
extensive business infrastructure that welcomed black Arlington customers.
Black Arlington straddled North and South. Its business community had some of the
characteristics of a Southern black settlement and some of the characteristics of a
Northern one. Because the African American community grew as three neighborhoods
and several small settlements, and because there was no public transportation connecting
the neighborhoods and settlements until the early 1940s, the business community never
thrived. Traveling from the neighborhoods and settlements to the District was easier than
traveling between the neighborhoods and settlements. Because the District offered so
many attractive shopping and entertainment options, there was little incentive for African
Americans to build an extensive business infrastructure of their own. Only those things
that were not worth the effort of a bus trip to the District were obtained in one of the
small businesses in a resident’s neighborhood. Everything else was purchased in the
District.
Once Arlington integrated, the white-owned stores enticed black customers away from
the black-owned businesses. A few of the larger businesses still cling to existence, but all
the home-based businesses have disappeared.
7.6 Conclusions Arlington’s African American community displayed a business pattern unlike either a
Northern or a Southern town. The black-owned businesses were greatly influenced by
Page 142
129
their proximity to the District. Because the African American community was divided
into three widely dispersed neighborhoods, with no public transportation connecting
them, the residents seldom traded in other neighborhoods. Rather, residents of the
neighborhoods traveled into the District to conduct business. The District’s large,
successful African American community had built a large business infrastructure that
welcomed black customers from Arlington. The combination of proximity to the District,
lack of transportation between the neighborhoods, and the small size of individual
neighborhoods limited the types of businesses built by black entrepreneurs. Most
businesses were located in private homes, and most businesses provided services rather
than goods. Black Arlington shoppers traveled into the District to satisfy all but their
most basic needs.
Page 143
130
CHAPTER EIGHT: CONCLUSIONS
Arlington County lies between the Southern state of Virginia and the District of
Columbia, separated from the District only by the Potomac River. As a border
community Arlington could be expected to display patterns typical of the North or those
typical of the South. In fact, in all the areas this research studied, Arlington displayed
patterns that result from its unique geography. This geography proved to be crucial to the
survival of the African American community during Segregation.
This research explored three areas of life in black Arlington – where African Americans
lived, where they worked, where they did business. In each area, geography dominated
the story line. Arlington’s proximity to Civil Service work for the federal government,
proximity to white federal workers looking for homes in the suburbs, proximity to the
District’s large black business community, proximity to the District’s black school
system, proximity to a federal government looking for a site to build the new Pentagon,
are all a function of the County’s geography.
Most often, proximity to the federal government worked to the black community’s favor.
At a time when African Americans had a very difficult time getting Civil Service
employment in regional Civil Service offices around the country, they had no difficulty
finding Civil Service employment at national offices in the District. The Civil Service
jobs paid a modest but reliable salary and provided a pension that still supports most of
Page 144
131
the participants of this study, at a time when employment opportunities with civilian
white employers in Arlington were insecure, and poorly paying. The proximity to the
District gave many young Arlington African Americans the opportunity to attend District
high schools and learn saleable job skills, and the opportunity to then market those skills,
often to the federal government in the District, while Arlington’s black schools provided
only the minimum education and little job training. Proximity to the District’s large
black business community gave Arlington’s African Americans access to black-owned
banks, insurance companies, funeral homes, a department store, a hotel, a hospital,
theaters, and restaurants that were missing in Arlington. Without this conveniently
located business infrastructure, Arlington’s African American community would either
have had to go without those goods and services or travel much further to get them.
In some aspects, proximity to the federal government was not advantageous. The
government grew exponentially during Segregation to manage a number of emergency
situations, beginning with World War I, the New Deal, World War II, and the Cold War.
Arlington was a magnet for white federal workers fleeing the congestion of the District.
As soon as roads and trolley lines made a daily commute into the District possible, whites
began moving across the river. They required new residential developments where there
was once farm land, pushing African Americans out of their small settlements into the
black neighborhoods, segregating them residentially. The impact of their arrival on
occupational choice was the loss of farms and farm jobs and the gain in low salary
service jobs. The federal government also proved to be a liability. During World War II,
the War Department outgrew its many buildings and sought to put the entire department
Page 145
132
under one roof. Lacking a suitable plot of land to build the Pentagon in the District, the
government found a likely site across the Potomac River. To build it, the federal
government destroyed settlements where African Americans had long lived and
brickyards where they had long worked, and replaced them with an abundance of low
level service jobs to support workers at the Pentagon.
While geography was probably the most important factor in this history, timing was also
fundamental. The African American community has lived in Arlington for as long as the
white community, although their status vis-à-vis the whites changed over time. In the
1600s African Americans in Arlington were slaves, working for white farm owners. By
the beginning of the Jim Crow era, African Americans were well established in the
County, over half of them owning land and homes. If they had arrived after the white in-
migration, if they had come during the Great Migration for example, the trajectory of
their story would have been very different. The fact that they were established property
owners gave them some power over their lives that migrants in the Great Migration
lacked. And the few Great Migration migrants who came to Arlington benefitted from
the fact that there were black neighborhoods to welcome them.
A final factor that helped Arlington’s black community was their numbers. Whites might
have viewed a large black community as a threat, but Arlington’s black community was
so small, and therefore so non threatening, that whites did not resort to violence to keep
the community ‘in their place’. One participant talked about his white neighbors holding
a yearly Ku Klux Klan event, during which they marched in their robes down the street to
the ball field to burn a cross. That was apparently all it took to keep things peaceful.
Page 146
133
CHAPTER NINE: EPILOGUE
The story of Arlington and the story of Arlington’s African American community during
Segregation is a story of change. Arlington is a much more integrated city than it was in
1900. The former all black neighborhoods are now home to all races. In the 2010 census
75 percent of the County’s residents were white, nine percent were African American,
and sixteen percent were other races.
Each of the neighborhoods reflects the changes brought by desegregation. Halls Hill is a
neighborhood in transition. In the 40 years since 1970 the population not only became
considerably less black, but it declined by 49 residents. Because of its easy access to the
District, Halls Hill has become attractive to buyers and developers of every race. While
many of the original frame homes remain, interspersed amongst them are new, large,
expensive single-family houses (Figure 27). Green Valley is also in transition. Since
1970 the population has increased by 816 residents and dropped from 93 percent black to
38 percent black. In 1970 there were only two residents who were neither white nor
black. In the 2010 census 1365 non-black residents lived in the neighborhood. As with
Halls Hill, Green Valley is experiencing a wave of construction. A swath of land north of
Four Mile Run was totally razed and a large development of townhouses and single-
family homes is under construction. Since 1970 the proportion of African Americans in
Johnson’s Hill dropped from 99 percent black to 37 percent black. Johnson’s Hill does
Page 147
134
not appear to be in transition. The houses are well kept, but little construction is in
evidence.
Figure 27: Mix of old and new housing in Halls Hill in 2012
In no small part because of its proximity to the District, Arlington has become an
expensive place to live. The average County assessment on land occupied by the
participants increased almost 500 percent in the last fifteen years, and the real estate taxes
on that land also increased. Eventually the black neighborhoods could become so
expensive that the very families who were forced to live there during Segregation will no
Page 148
135
longer be able to afford to live there. One man interviewed for the Halls Hill oral
histories expressed it well (Pelham, 2001, 4:24):
[I]t makes me kind of sad to see what’s happening now because as the
people move in, as the whites move in, the property value is going to go
up and the blacks who are left here are going to have to pay a lot of money
that a lot of them will not be able to afford or not want to pay.
Jobs at the farms and brick yards are long gone, and work in the Civil Service has taken
their place. Many of the grandchildren and great grandchildren of the early African
Americans are college educated, some working in professional fields.
Almost all the black-owned businesses built during Segregation are gone. Once
Arlington integrated, the white-owned stores enticed their black customers away. A few
of the larger businesses, having invested in a building, a fleet of taxis, or expensive
equipment, are still clinging to existence. All the small home-based businesses have
disappeared. Lining the one commercially zoned street running through Halls Hill are
new fast food restaurants and other commercial establishments, all white-owned. In
Green Valley many of the buildings that formerly held small businesses sit vacant. A few
small businesses have taken their place, fewer of them black-owned. None of the streets
in Johnson’s Hill are commercially zoned and no new businesses have been built.
During Segregation the African American community in Arlington lived in the three
black neighborhoods because that was the only land available to them. They made their
lives there, raised their children there, established churches there. After passage of the
Civil Rights legislation they could have moved out of those neighborhoods, but for most
Page 149
136
of them the life they had built was too precious to give up, just for the opportunity to live
in a white neighborhood that was obligated to allow them to move in but was not
obligated to make them feel at home. While all of the African Americans alive in 1900
are gone, many of their descendents still live in Arlington. Most of them have chosen to
live out their lives in their old neighborhoods, surrounded by their church, their
neighbors, and in most cases by one or more of their children. The children, having
grown up in a racially integrated environment, have less reason to settle down in the
historically black neighborhoods. Whether they decide to stay once their parents pass on
only time will tell. Thus ends this chapter in the history of the community.
Page 150
137
APPENDIX
Jobs worked by Arlington blacks, as listed in 1900-1940 censuses
1900 1910 1920 1930 1940
ALMS house inmate beautician/barber beautician/barber actor architect
baker bartender bellman attendant army officer
beautician/barber blacksmith blacksmith beautician/barber attendant
blacksmith butcher bookbinder blacksmith awning hanger
butcher carpenter bookkeeper book binder beautician/barber
carpenter charlady/janitor bootblack brick mason bartender
clerical clerical brick layer bundle wrapper blacksmith
contractor contractor bus girl/bus boy bus girl/bus boy brick layer
cook/chef/baker cook/chef/baker carpenter butcher brick maker
cooper driver/teamster caulker caddy bus driver
driver/teamster dry cleaner charlady/janitor car painter bus girl/bus boy
engineer elevator operator clerical carpenter caddie
farm manager engineer contractor carpet layer car washer
farmer farmer/dairyman cook/chef/baker car washer carpenter
fireman farrier driver/teamster cashier CCC crew
foreman fireman electrician caterer cement contractor
gardener fire master elevator operator cement worker cement finisher
hostler florist expressman charlady/janitor charlady/janitor
insurance agent harness maker farmer/dairyman checker chemist
junk dealer had carrier farrier clerical clerical
justice of the peace horse trainer fireman contractor coat checker
laborer hostler foreman cook/chef/baker contractor
laundress/launderer huckster gardener delivery man cook/chef/baker
merchant laborer hostler dishwasher delivery man
messenger landscape gardener inmate driver/teamster dish washer
minister laundress/launderer insurance agent electrician ditch digger
nanny linesman ironer elevator operator drafter
painter merchant laborer farmer/dairyman driver/teamster
peddler messenger landlady/landlord fireman electrician
porter minister laundress/launderer garbage collector elevator operator
sailor moulder lawyer gardener engineer
sanitary engineer nanny machinist grocer examiner
seamstress/tailor painter manager harness maker farmer/dairyman
servant plasterer mechanic hauling fireman
shoemaker porter merchant hod carrier fitter
soldier postman messenger house painter floor finisher
teacher printer minister huckster florist
waitress/waiter seamstress/tailor nanny insurance agent foreman
watchman servant nurse/midwife kitchen helper gardener
water boy ship caulker oyster peddler laborer gas station attendant
shoemaker painter landlady/landlord grave digger
soldier photographer landscape gardener grounds keeper
stationary engineer physician laundress/launderer handyman
teacher plasterer locker boy hauling
Page 151
138
undertaker plumber lumber dealer hod carrier
waitress/waiter porter machinist house cleaner
watchman printer mail handler house demolition
well digger prisoner mailbag repair house painter
saleslady/salesman manager huckster
seamstress/tailor mechanic insurance agent
servant merchant junk collector
slate roofer messenger kindergarten teacher
soldier minister laborer
stable boss mortician landlady/landlord
stationary engineer musician landscaper
stock clerk nanny lather
stone mason newsboy laundress/launderer
teacher nurse locker room attendant
tinsmith operative lumber checker
waitress/waiter packer machinist
watchman painter mail handler
well digger pantry boy maintenance man
physician manager
plasterer marker
plumber mechanic
porter merchant
presser messenger
printer mill worker
real estate agent miner
saleslady/salesman minister
scaffold builder mortar mixer
seamstress/tailor musician
servant nanny
shipping clerk nurse aide
soldier office manager
stove shiner office nurse
teacher officer
trimmer operative
waitress/waiter orderly
wallpaper hanger packer
watchman painter
paper hanger
paving engineer
PE teacher
physician
pin setter
plasterer
plumber
policeman
porter
practical nurse
presser
printer
proprietor
Pullman porter
real estate agent
repairman
saleslady/salesman
sawyer
seamstress/tailor
section hand
servant
service man
Page 152
139
sexton
shipping clerk
shoe shiner
shoemaker
sign painter
silk finisher
soldier
stationary engineer
stoker operator
stone mason
stove operator
street sweeper
taxi driver
teacher
telephone operator
trash collector
trimmer
undertaker
utility worker
waitress/waiter
watchman
wrapper
yardman
Page 154
141
REFERENCES
1878 Alexandria County Virginia,
http://en.wikipedia.org/wiki/File:1878_Alexandria_County_Virginia.jpg, accessed 17
July 2012.
African American Businesses in Arlington, 2005, Arlington Reunion. Arlington Virginia
Network (AVN) (DVD).
Aldrich, H., Cater, J., Jones, T., McEvoy, D., and Velleman, P., 1985, Ethnic Residential
Concentration and the Protected Market Hypothesis. Social Forces, Vol. 63, 996–1009.
Ancestry.com, www.ancestry.com, accessed 1/3/2013.
Andrews, G.J., Kearns, R.A., Kontos, P., and Wilson, V., 2006, ‘Their finest hour’: older
people, oral histories, and the historical geography of social life. Social & Cultural
Geography, Vol. 7, 153–177.
Bates, T., 1997, Race, Self-Employment, and Upward Mobility: An Illusive American
Dream. Baltimore, MD: Johns Hopkins University Press.
Bates, T., Jackson, W.E., III, and Johnson, J.H., Jr., 2007, Advancing research on
minority entrepreneurship. The Annals of the American Academy of Political and Social
Science, Vol. 613, 10–17.
Baxter, J., and Eyles, J., 1997, Evaluating qualitative research in social geography:
establishing ‘rigour’ in interview analysis. Transactions of the Institute of British
Geographers, Vol. 22, 5–25.
Birmingham, S., 1977, Certain People: America’s Black Elite. Boston, MA: Little,
Brown and Company.
Blau, P.M., Gustad, J.W., Jessor, R., Parnes, H.S., and Wilcock, R.C., 1956,
Occupational Choice: A Conceptual Framework. Industrial and Labor Relations Review,
Vol. 9, 531–543.
Bourne, L.S. and Murdie, R.A., 1972, Interrelationships of social and physical space in
the city: A multivariate analysis of metropolitan Toronto. Canadian Geographer, Vol.
16, 211–229.
Page 155
142
Boyd, R.L., 1998, Residential Segregation by Race and the Black Merchants of Northern
Cities during the Early Twentieth Century. Sociological Forum, Vol. 13, 595–609.
Boyd, R.L., 2000a, Race, Labor Market Disadvantage, and Survivalist Entrepreneurship:
Black Women in the Urban North during the Great Depression. Sociological Forum, Vol.
15, 647–670.
Boyd, R.L., 2000b, Survivalist Entrepreneurship among Urban Blacks during the Great
Depression: A Test of the Disadvantage Theory of Business Enterprise. Social Science
Quarterly, Vol. 81, 972–984.
Boyd, R.L., 2010, Black Retail Enterprise and Racial Segregation in Northern Cities
before the “Ghetto”. Sociological Perspectives, Vol. 53, 397–417.
Boyd, R.L., 2011, New York, Chicago, and the ‘Black Metropolis’ of the Early 20th
Century. Urban Geography, Vol. 32, 1066–1083.
Brown, D., 2002, The Role of Work and Cultural Values in Occupational Choice,
Satisfaction, and Success: A Theoretical Statement. Journal of Counseling &
Development, Vol. 80, 48–56.
Browne, J., 2001, Rev. James E. Browne. High View Park Community Project, Arlington
County, Virginia, Department of Parks, Recreation and Community Resources, Cultural
Affairs Division, Vol. 1, 1–39.
Burgess, E.W., 1925, The growth of the city, in R.E. Park, E.W. Burgess, R.D. McKenzie
(eds), The City, Chicago, IL: University of Chicago Press, 47–62.
Burgess, E.W., 1928, Residential Segregation in American Cities. The ANNALS of the
American Academy of Political and Social Science, Vol. 140, 105–115.
Butler, J.S., 2005, Entrepreneurship and Self-Help among Black Americans: A
Reconsideration of Race and Economics. Albany, NY: State University of New York
Press.
Coates, L.H., 1991, Lucy Hicks Coates. Arlington County Library, Oral History
Program, Vol. 3, 1–35.
Coleman, J., 1990, Foundations of social theory. Cambridge, MA: The Belknap Press of
Harvard University Press.
Crain, R.L., 1970, School Integration and Occupational Achievement of Negroes.
American Journal of Sociology, Vol. 75, 593–606.
Page 156
143
Crew, S.R., 1987, Field to Factory: Afro-American migration 1915-1940. Washington,
DC: Department of Public Programs, National Museum of American History,
Smithsonian Institution.
Darden, J.T., 1995, Black residential segregation since the 1948 Shelley V. Kraemer
decision. Journal of Black Studies, Vol. 25, 680–691.
Deed Books, Arlington County Land Records, 1425 North Courthouse Road, Room
6200.
DeFina, R. and Hannon, L., 2009, Diversity, Racial Threat and Metropolitan Housing
Segregation. Social Forces, Vol. 88, 373–394.
Deskins, W.R., 2001, Welbe Riley Deskins. High View Park Community Project,
Arlington County, Virginia, Department of Parks, Recreation and Community Resources,
Cultural Affairs Division, Vol. 2, 1–33.
Drake, St.C. and Cayton, H.R., 1962, Black Metropolis: A Study of Negro Life in a
Northern City. New York, NY: Harcourt, Brace & World, Inc.
Duncan, O.D. and Duncan, B., 1955, A Methodological Analysis of Segregation Indexes.
American Sociological Review, Vol. 20, 210–217.
Fairchild, G.B., 2008a, Residential segregation influences on the likelihood of black and
white self-employment. Journal of Business Venturing, Vol. 23, 46–74.
Fairchild, G.B., 2008b, The influence of residential segregation and its correlates on
ethnic enterprise in urban areas. Journal of Business Venturing, Vol. 23, 513–527.
Farley, R., 1977, Residential Segregation in Urbanized Areas of the United States in
1970: An Analysis of Social Class and Racial Differences. Demography, Vol. 14, 497–
518.
Farley, R., Steeh, C., Jackson, T., Krysan, M., and Reeves, R., 1993, Continued racial
residential segregation in Detroit: “Chocolate City, Vanilla Suburbs” revisited. Journal of
Housing Research, Vol. 4, 1–38.
Fischer M.J., and Massey, D.S., 2000, Residential Segregation and Ethnic Enterprise in
U.S. Metropolitan Areas. Social Problems, Vol. 47, 408–424.
Ginzberg, E., 1988, Toward a Theory of Occupational Choice. The Career Development
Quarterly, Vol. 36, 358–363.
Page 157
144
Goldberg, A., 1992, The Pentagon: The First Fifty Years. Washington, D.C.: Historical
Office, Office of the Secretary of Defense.
Gottfredson, L.S., 1981, Circumscription and Compromise: A Developmental Theory of
Occupational Aspirations. Journal of Counseling Psychology Monograph, Vol. 28, 545–
579.
Graham, L.M., 2003, Lucy Mae Graham. Arlington County Library, Marymount
University, Hall’s Hill Oral History Program, Vol. 4, 1–27.
Granovetter, M., 1974, Getting a Job: A Study of Contacts and Careers. Chicago, IL: The
University of Chicago Press.
Green, C.M., 1967, The Secret City: A History of Race Relations in the Nation’s Capital.
Princeton, NJ: Princeton University Press.
Gregory, J.N., 2005, The southern diaspora: how the great migrations of black and white
Southerners transformed America. Chapel Hill, NC: University of North Carolina Press.
Groves, P.A. and Muller, E.K., 1975, The evolution of black residential areas in late
nineteenth-century cities. Journal of Historical Geography, Vol. 1, 169–191.
Guild, J.P., 1969, Black Laws of Virginia: A Summary of the Legislative Acts of Virginia
Concerning Negroes from the Earliest Times to the Present. New York, NY: Negro
Universities Press.
Harris, C.D. and Ullman, E.L., 1945, The nature of cities. The Annals of the American
Academy of Political and Social Science, Vol. 242, 7–17.
Harvey, A.M., 2005, Becoming entrepreneurs: Intersections of race, class, and gender at
the black beauty salon. Gender & Society, Vol. 19, 789–808.
Harvey-Wingfield, A., 2008, Doing Business with Beauty: Black Women, Hair Salons,
and the Racial Enclave Economy. New York, NY: Rowman & Littlefield Publishers, Inc.
Hill, 1950, Hill’s 1950 Arlington County Directory. Richmond, VA: Hill Directory
Company, Inc.
Holland, J.L., 1985, Making vocational choices: a theory of vocational personalities and
work environments (Second Edition). Englewood Cliff, NJ: Prentice-Hall.
House-Soremekun, B., 2002, Confronting the Odds: African American Entrepreneurship
in Cleveland. Ohio. Kent, OH: The Kent State University Press.
Page 158
145
Hoyt, H., 1939, The Structure and Growth of Residential Neighborhoods in American
Cities. Washington, D.C.: Federal Housing Administration.
Ingham, J.N., 2003, Building Businesses, Creating Communities: Residential Segregation
and the Growth of African American Business in Southern Cities, 1880-1915. The
Business History Review, Vol. 77, 639–665.
James, D.R. and Taeuber, K.E., 1985, Measures of Segregation. Sociological
Methodology, Vol. 15, 1–32.
Johnson, C.S., 1970, Backgrounds to Patterns of Negro Segregation. New York, NY:
Thomas &. Crowell Company.
Johnson, M.B., 2000, Mignon Bolden Johnson. High View Park Community Project,
Arlington County, Virginia, Department of Parks, Recreation and Community Resources,
Cultural Affairs Division, Vol. 3, 1–59.
Kollinger, P. and Minniti, M., 2006, Not for Lack of Trying: American Entrepreneurship
in Black and White. Small Business Economics, Vol. 27, 59–79.
Krislov, S., 1967, The Negro in Federal Employment: The Quest for Equal Opportunity.
Minneapolis, MN: University of Minnesota Press.
Kusmer, K.L., 1976, A Ghetto Takes Shape: Black Cleveland, 1870-1930. Chicago IL:
University of Illinois Press.
Lassiter, M.D. and Niedt, C., 2012, Suburban Diversity in Postwar America. Journal of
Urban History, Vol. 39, 3–14.
Leventhal, Michael, Historic Preservation Coordinator for Arlington County. Interview
by author, November 16, 2012.
Library of Congress, Prints & Photographs Online Catalog, www.loc.gov/pictures/,
accessed 2/10/2013.
Lieberson, S., 1963, Ethnic Patterns in American Cities. New York, NY: The Free Press
of Glencoe.
Light, I., 1979, Disadvantaged Minorities in Self-Employment. International Journal of
Comparative Sociology, Vol. 20, 31–45.
Light, I. and Rosenstein, C., 1995, Race, Ethnicity, and Entrepreneurship in Urban
America. New York, NY: Aldine de Gruyter.
Page 159
146
Logan, J. and Molotch, H., 1987, Urban fortunes. Berkley, CA: University of California
Press.
Mackey, C., 1907, Brief History of Alexandria County, Virginia. Falls Church, VA: The
Newell Printing Co.
Massey, D.S., 1979, Effects of Socioeconomic Factors on the Residential Segregation of
Blacks and Spanish Americans in U.S. Urbanized Areas. American Sociological Review,
Vol. 44, 1015–1022.
Massey, D.S. and Denton, N.A., 1987, Trends in the Residential Segregation of Blacks,
Hispanics, and Asians: 1970-1980. American Sociological Review, Vol. 51, 802–825.
Massey, D.S. and Denton, N.A., 1988, The Dimensions of Residential Segregation.
Social Forces, Vol. 67, 281–315.
Massey, D.S. and Denton, N.A., 1993, American Apartheid: Segregation and the Making
of the Underclass. Cambridge, MA: Harvard University Press.
Maxwell, J.A., 2005, Qualitative Research Design: An Interactive Approach (Second
Edition). Thousand Oaks, CA: Sage Publications, Inc.
Morris, J.M., 2001, A Chink in the Armor: The Black-Led Struggle for School
Desegregation in Arlington, Virginia, and the End of Massive Resistance. Journal of
Policy History, Vol. 13, 329–366.
Netherton, N. and Netherton, R., 1987, Arlington County in Virginia: A Pictorial History.
Norfolk, VA: The Donning Company.
NHGIS, Minnesota Population Center. National Historical Geographic Information
System: Version 2.0. Minneapolis, MN: University of Minnesota 2011.
https://www.nhgis.org, accessed 1/3/2013.
Osofsky, G., 1966, Harlem: The Making of a Ghetto: Negro New York, 1890-1930. New
York, NY: Harper & Row.
Pelham, W.H., 2001, William H. Pelham. High View Park Community Project, Arlington
County, Virginia, Department of Parks, Recreation and Community Resources, Cultural
Affairs Division, Vol. 4, 1–59.
Perry, N. and Waters, N.M., 2012, Southern Suburb/Northern City: Black
Entrepreneurship in Segregated Arlington County, Virginia. Urban Geography, Vol. 33,
655–674.
Page 160
147
Rose, C.B. Jr., 2009, Arlington County Virginia, A History. Baltimore, MD: Port City
Press, Inc.
Rose, H.M., 1969, Social Processes in the City: Race and Urban Residential Choice.
Washington D.C.: Association of American Geographers, 1–34.
Rose, H.M., 1985, The evolving spatial pattern of Black America: 1910-1980. In J.O.
McKee (ed), Ethnicity in Contemporary America: A Geographical Appraisal. Dubuque,
IA: Kendall/Hunt Publishing Company, 55–75.
Ruble, B.A., 2010, Washington’s U Street: A Biography. Baltimore, MD: The Johns
Hopkins University Press.
Schelling, T., 1971, Dynamic models of segregation. Journal of Mathematical Sociology,
Vol. 1, 143–186.
Seidman, I., 2006, Interviewing as Qualitative Research: A Guide for Researchers in
Education and the Social Sciences. New York, NY: Teachers College Press.
Sixty-Eighth Congress, 1925, Statutes at Large of the United States of America, Vol. 43
(I), 153–169.
Stake, R.E., 1995, The Art of Case Study Research. Thousand Oaks, CA: Sage
Publications.
Strauss, A. and Corbin, J., 1998, Basics of Qualitative Research: Techniques and
Procedures for Developing Grounded Theory. Thousand Oaks, CA: Sage Publications.
Tabb, W.K., 1971, Race Relations Models and Social Change. Social Problems, Vol. 18,
431–444.
Tabb, W.K., 2001, What happened to black economic development?. Review of Black
Political Economy, Vol. 9, 392–415.
Taeuber, K.E. and Taeuber, A.F., 1965, Negroes in Cities: Residential
Segregation and Neighborhood Change. Chicago, IL: Aldine Publishing
Company.
Taeuber, K.E., 1975, Demographic perspectives on housing and school segregation.
Wayne Law Review, Vol. 21, 833–850.
Tashakkori, A. and Teddlie, C., 1998, Mixed Methodology: Combining
Qualitative and Quantitative Approaches. London: SAGE Publications.
Page 161
148
Tolnay, S.E., 2003, The African American ‘Great Migration’ and beyond. Annual Review
of Sociology, Vol. 29, 209–232.
Uhlenberg, P., 1973, Noneconomic determinants of nonmigration: sociological
considerations for migration theory. Rural Sociology, Vol. 3, 298–311.
U.S. Department of the Interior, 1900, Twelfth Census of the United States: Instructions
to Enumerators. Washington, D.C.: Government Printing Office, 1–64.
Van Riper, P.P., 1958, History of the United States Civil Service. Evanston, IL: Row,
Peterson and Company.
Vogel, S.F., 2007, The Pentagon: a history. New York, NY: Random House.
Weiss, R.S., 1994, Learning from Strangers: The Art and Method of Qualitative
Interview Studies. New York, NY: The Free Press.
White, M.J., 1986, Segregation and Diversity: Measures in Population Distribution.
Population Index, Vol. 52, 198–221.
Wilkerson, I., 2010, The Warmth of Other Suns – The Epic Story of America’s Great
Migration. New York, NY: Random House.
Willett, J.A., 2000, Permanent Waves: The Making of the American Beauty Shop. New
York, NY: New York University Press.
Williams, M., 2001, Mervin Williams. High View Park Community Project, Arlington
County, Virginia, Department of Parks, Recreation and Community Resources, Cultural
Affairs Division, Vol. 5, 1–39.
Wilson, B.M., 2000, America’s Johannesburg: industrialization and racial
transformation. Lanham, MD: Rowman & Littlefield Publishers, Inc.
Woofter, T.J.,Jr., 1928, Negro Problems in Cities. College Park, MD: McGrath
Publishing Company.
Page 162
149
CURRICULUM VITAE
Nancy Perry received her Bachelor of Arts degree from the University of Washington in
Seattle, WA. She taught elementary school at the American School in Tokyo, Japan. She
received her Master of Science degree in Information Technology from George Mason
University and has worked as a computer programmer on imagery intelligence systems.
She worked at the National Geospatial Intelligence College, the National Reconnaissance
Office, the Open Source Center, and CIA University writing training materials and
teaching imagery collection. She received her Master of Science degree in Geographic
and Cartographic Science and has worked as a geospatial analyst.