Society for Conservation Biology The Influence of Geomorphological Heterogeneity on Biodiversity: I. A Patch-Scale Perspective Author(s): Michael R. Burnett, Peter V. August, James H. Brown, Jr., Keith T. Killingbeck Source: Conservation Biology, Vol. 12, No. 2 (Apr., 1998), pp. 363-370 Published by: Blackwell Publishing for Society for Conservation Biology Stable URL: http://www.jstor.org/stable/2387506 Accessed: 08/06/2009 22:02 Your use of the JSTOR archive indicates your acceptance of JSTOR's Terms and Conditions of Use, available at http://www.jstor.org/page/info/about/policies/terms.jsp. JSTOR's Terms and Conditions of Use provides, in part, that unless you have obtained prior permission, you may not download an entire issue of a journal or multiple copies of articles, and you may use content in the JSTOR archive only for your personal, non-commercial use. Please contact the publisher regarding any further use of this work. Publisher contact information may be obtained at http://www.jstor.org/action/showPublisher?publisherCode=black. Each copy of any part of a JSTOR transmission must contain the same copyright notice that appears on the screen or printed page of such transmission. JSTOR is a not-for-profit organization founded in 1995 to build trusted digital archives for scholarship. We work with the scholarly community to preserve their work and the materials they rely upon, and to build a common research platform that promotes the discovery and use of these resources. For more information about JSTOR, please contact [email protected]. Blackwell Publishing and Society for Conservation Biology are collaborating with JSTOR to digitize, preserve and extend access to Conservation Biology. http://www.jstor.org
Transcript
Society for Conservation Biology
The Influence of Geomorphological Heterogeneity on Biodiversity: I. A Patch-Scale PerspectiveAuthor(s): Michael R. Burnett, Peter V. August, James H. Brown, Jr., Keith T. KillingbeckSource: Conservation Biology, Vol. 12, No. 2 (Apr., 1998), pp. 363-370Published by: Blackwell Publishing for Society for Conservation BiologyStable URL: http://www.jstor.org/stable/2387506Accessed: 08/06/2009 22:02
Your use of the JSTOR archive indicates your acceptance of JSTOR's Terms and Conditions of Use, available athttp://www.jstor.org/page/info/about/policies/terms.jsp. JSTOR's Terms and Conditions of Use provides, in part, that unlessyou have obtained prior permission, you may not download an entire issue of a journal or multiple copies of articles, and youmay use content in the JSTOR archive only for your personal, non-commercial use.
Please contact the publisher regarding any further use of this work. Publisher contact information may be obtained athttp://www.jstor.org/action/showPublisher?publisherCode=black.
Each copy of any part of a JSTOR transmission must contain the same copyright notice that appears on the screen or printedpage of such transmission.
JSTOR is a not-for-profit organization founded in 1995 to build trusted digital archives for scholarship. We work with thescholarly community to preserve their work and the materials they rely upon, and to build a common research platform thatpromotes the discovery and use of these resources. For more information about JSTOR, please contact [email protected].
Blackwell Publishing and Society for Conservation Biology are collaborating with JSTOR to digitize, preserveand extend access to Conservation Biology.
MICHAEL R. BURNETT,* PETER V. AUGUST,** JAMES H. BROWN, JR.,* AND KEITH T. KILLINGBECKt *Department of Natural Resources Science, University of Rhode Island, Kingston, RI 02881, U.S.A.
tDepartment of Biological Sciences, University of Rhode Island, Kingston, RI 02881, U.S.A.
Abstract: Landscapes composed of spatially heterogeneous abiotic conditions should provide a greater diver- sity of potential niches for plants and animals than do homogeneous landscapes. We tested this hypothesis in a deciduous forest ecosystem in the northeastern United States. We created an index that summarizes the col- lective variation in terrain and soil properties in 2-ha study plots. We measured woody plant species richness and diversity in 20 study plots that had high geomorphological heterogeneity and 20 plots that had low geo- morphological heterogeneity. The richness and diversity of trees and shrubs were significantly higher in sites with high geomorphological heterogeneity than in sites that exhibited little change in terrain or soil condi- tions. Variation in aspect and soil drainage were especially important predictors of biotic diversity. Our re- sults demonstrate an intimate association between abiotic and biotic diversity and have significant implica- tions for long-term conservation strategies.
Influencia de la Heterogeneidad Geomorfol6gica en la Biodiversidad I. Una Perspectiva a Escala de Parcela
Resumen: Los paisajes compuestos de condiciones abioticas espacialmente heterogeneas deberfan proveer una gran diversidad de nichos potenciales para plantas y animales comparados con los paisajes homoge- neos. Probamos esta hipotesis en un ecosistema de bosque deciduo del noroeste de los Estados Unidos de Norteamerica. Creamos un indice que sumariza la variaci6n colectiva de las condiciones del terreno y las propiedades del suelo en dreas de estudio de 2 ha. Medimos la riqueza de especies de madera y la divresidad de 20 dreas de estudio con una alta heterogeneidad geomorfol6gica y 20 con baja heterogeneidad geomor- fol6gica. La riqueza y diversidad de especies de drboles y arbustosfue significativamente mayor en sitios con alta heterogeneidad geomorfol6gica en comparaci6n con sitios que exhibieron pocos cambios en las condi- ciones del terreno o del suelo. Variaciones en el aspecto y drenaje del suelofueron indicadores especialmente importantes de la diversidad bi6tica. Nuestros resultados demuestran que existe una asociaci6n intima entre diversidad bi6tica y abi6tica, teniendo implicaciones significativas en las estrategias de conservaci6n a largo plazo.
Introduction
The science behind the development of strategies to protect endangered species has matured to the point that there is a widespread realization that communities,
ecosystems, and landscapes must be the target of our ef- forts to conserve biodiversity (Noss 1983; Hunter et al. 1988; Franklin 1993; Scott et al. 1993; Kohn & Walsh 1994; Meilleur et al. 1994; Lombard 1995). There ap- pears to be resounding agreement among ecologists and resource managers that the maintenance of biological di- versity is a goal of paramount importance (Soul6 1986; Wilson & Peter 1988), yet the development of an effi- cient, comprehensive approach to the identification of biotically diverse landscapes has been elusive.
tAddress correspondence to P. V August; [email protected] Paper submitted July 8, 1996; revised manuscript accepted June 4, 1997.
363
Conservation Biology, Pages 363-370
Volume 12, No. 2, April 1998
364 Geomorphology Predicts Biodiversity (I.) Burnett et al.
We present a technique to estimate relative biological diversity that utilizes geographic information system (GIS) technology (August et al. 1996) to estimate the col- lective variation in edaphic and topographic characteris- tics of specific regions of a landscape. The result is an in- dex of geomorphological heterogeneity that quantifies spatial variation in abiotic conditions and that should be, we hypothesize, functionally related to biotic diversity.
Given the oft-cited linkage between biotic diversity and spatial heterogeneity (Huston 1994; Forman 1995; Rosenzweig 1995) and the specific proposition that geo- morphologically variable landscapes should support di- verse assemblages of plants and animals (Hunter et al. 1988; Samways 1990), we reasoned that geomorphologi- cal heterogeneity should be high in areas rich in biologi- cal diversity and low in areas with meager biotas. The empirical test of this hypothesis was carried out within an eastern deciduous forest in Rhode Island (U.S.A.). Bi- otic diversity was compared to abiotic diversity in 40 2-ha plots for which we calculated indices of geomor- phological heterogeneity and measured species richness and diversity of woody vascular plants.
Methods
Study Area
The study was conducted in the Biological Research Re- serve of the University of Rhode Island W. Alton Jones Campus, West Greenwich, Rhode Island (41?38'N, 71?41'W). The research area contains over 400 ha of eastern deciduous forest, ranging from poorly drained hardwood swamps to oak and oak-pine stands on well- drained glacial till. Pine and oak occur on excessively drained outwash deposits. The area has been protected from human disturbance for at least 70 years. Old stone walls suggest that past perturbations likely included cul- tivation and/or grazing. Known natural disturbances include a major fire that engulfed many of the ridge tops in 1942 and repeated gypsy moth (Lymantria dis- par) defoliations in the early 1980s. No part of the research area contains primary forest. Major topo- graphic features include two hills with steep slopes and a valley drained by a perennial stream. Elevation ranges from 60 m at the lower end of the valley to 146 m at the top of the hills. The valley contains steep sloped kames and eskers, flat outwash plains, and kettle holes, some of which contain water during the wet season (e.g., early spring).
Analysis of Geomorphology
Indices of geomorphological heterogeneity were com- puted for each of 234 2-ha cells that made up the study area and were based on digital representations of soils
obtained from the Rhode Island Geographic Information System (RIGIS) database (August et al. 1995) and topog- raphy obtained from the 1:24,000 U.S. Geological Survey Digital Elevation Model (DEM) database (U.S. Geological Survey 1987; Maune 1996). Soil data were recompiled onto 1:15,840 orthophotos from the Soil Survey of Rhode Island (Rector 1981) and digitized into the GIS. Thirty-seven soil types (e.g., map units) occurred as 160 discrete areas (polygons) in the study area. Slope and as- pect were derived from a triangular irregular network (TIN) model developed from the DEM. Soil depth con- sisted of five classes ranging from no true soil present to soils more than 82 cm deep. Slope was represented by five classes and ranged from less than 3.0% to more than 16.5%. Textures of the A and B horizons were each di- vided into seven classes, ranging from no soil present in the horizon to soils that were predominantly silt loams. Nine drainage classes were recognized, and these ranged from excessively drained soils to standing water. Aspect was divided into eight equal classes beginning with 0?N, with an additional class for level terrain. All GIS analyses were done by means of ARC/INFO software (Environ- mental Systems Research Institute, Redlands, California) on a Prime 9950 minicomputer and UNIX workstations.
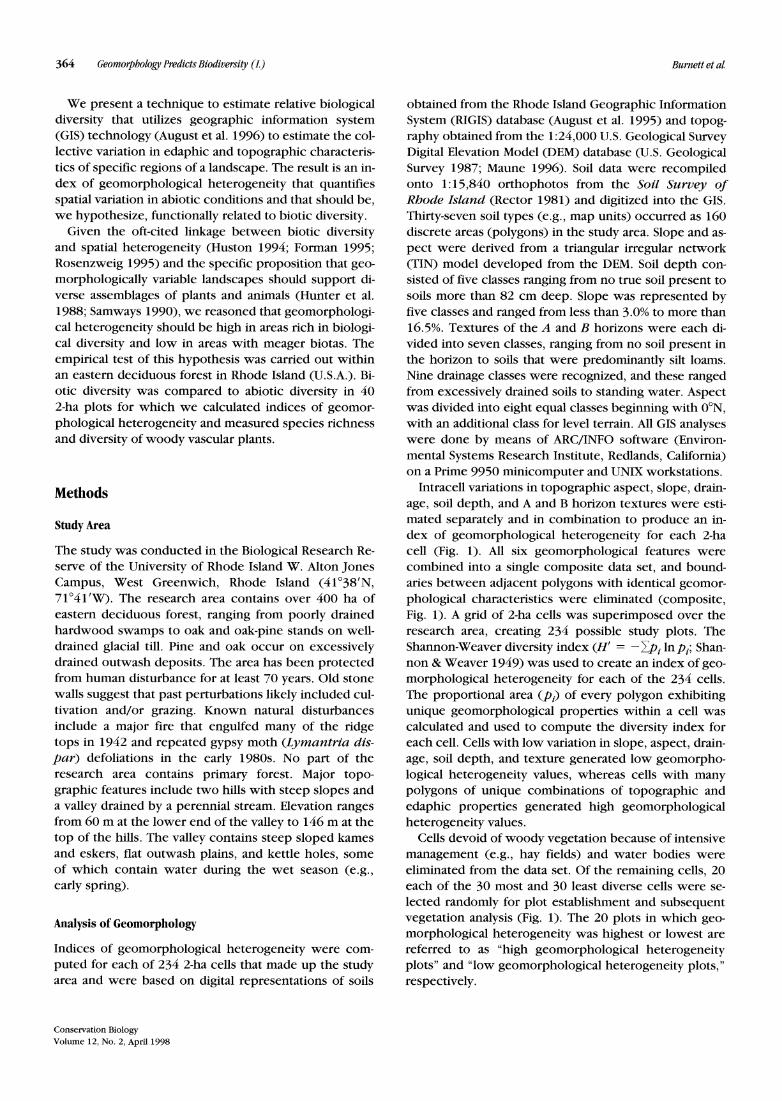
Intracell variations in topographic aspect, slope, drain- age, soil depth, and A and B horizon textures were esti- mated separately and in combination to produce an in- dex of geomorphological heterogeneity for each 2-ha cell (Fig. 1). All six geomorphological features were combined into a single composite data set, and bound- aries between adjacent polygons with identical geomor- phological characteristics were eliminated (composite, Fig. 1). A grid of 2-ha cells was superimposed over the research area, creating 234 possible study plots. The Shannon-Weaver diversity index (H' = - Zpi ln pi; Shan- non & Weaver 1949) was used to create an index of geo- morphological heterogeneity for each of the 234 cells. The proportional area (pi) of every polygon exhibiting unique geomorphological properties within a cell was calculated and used to compute the diversity index for each cell. Cells with low variation in slope, aspect, drain- age, soil depth, and texture generated low geomorpho- logical heterogeneity values, whereas cells with many polygons of unique combinations of topographic and edaphic properties generated high geomorphological heterogeneity values.
Cells devoid of woody vegetation because of intensive management (e.g., hay fields) and water bodies were eliminated from the data set. Of the remaining cells, 20 each of the 30 most and 30 least diverse cells were se- lected randomly for plot establishment and subsequent vegetation analysis (Fig. 1). The 20 plots in which geo- morphological heterogeneity was highest or lowest are referred to as "high geomorphological heterogeneity plots" and "low geomorphological heterogeneity plots," respectively.
Conservation Biology
Volume 12, No. 2, April 1998
Burnett et al. Geomorphology Predicts Biodiversity (I.) 365
-1A. Soil Drarnage B.MApect
0.5 D1 S
i Comoste i D. StudyPlos
Figure 1. Representation of the study area, plots sampled, and examples of geo- morphological heterogeneity: patterns of soil drainage (a). Well-drained soils are white or lightly shaded; poorly drained soils darkly shaded. The network of grid cells within the study area from which sample plots were derived is also shown. Patterns of aspect variation (b). Each polygon depicts an area in which the as- pect of the terrain falls into one of the nine classes described in the methods sec- tion. Patterns of all six geomorphological variables combined (c). Each polygon represents a unique combination of edaphic and topographic features that differfrom those of all adjacentpolygons. Grid cells where vegetation data were measured (d). The black cells indicate the location of the 20 plots in which geomor- phological heterogeneity was highest. The gray cells indicate the position of the 20 plots in which geomorphological hetero- geneity was lowest.
Analysis of Vegetation
Diversity of woody species and estimates of species dominance were determined in the 40 2-ha plots that represented the areas with the highest and lowest geo- morphological heterogeneity (Fig. 1). Plots were delin- eated in the field in 1992 by standard surveying tech- niques from reference points that existed in the GIS database (e.g., trail intersections, hydrographic features). To offset potential minor inaccuracies in identifying plot boundaries, vegetation sampling was done inside a 12-m buffer zone within the perimeter of each plot.
In late summer and fall of 1992, the diversity and dom- inance of shrubs (woody perennials with a diameter at breast height (Qdbh] of less than 10.2 cm) and trees (woody perennials with a minimum dbh of 10.2 cm) were measured at 25 sample points within each 2-ha plot. Each point was positioned randomly within one of five equally spaced intervals along each of five transects in the interior of each plot. Each transect was oriented
in a north-south direction, and each originated from a randomly located point within one of five equidistant in- tervals established along the north or south boundary of each plot. Species-area curves developed for shrub and tree species in a high geomorphological heterogeneity plot during a preliminary analysis indicated that a sam- ple size of 25 points per plot was more than adequate to accurately portray the diversity of woody perennials in this eastern deciduous forest.
Shrub species richness and dominance were deter- mined with the line-intercept technique (Canfield 1941). Data were coliected from one 3-m intercept line posi- tioned in a north-south direction at each of the 1000 points sampled. Dominance values for each species were measured as intercept coverage. Tree species richness and dominance were determined with the point-centered quarter method (Cottam & Curtis 1956). Dominance val- ues for each species were measured as stem diameter at breast height. For both trees and shrubs, the "evenness" component of diversity was calculated from dominance
Conservation Biology
Volume 12, No. 2, April 1998
366 Geomorphology Predicts Biodiversity (I.) Burnett et al.
data substituted into equations provided in Magurran (1988). These values were in turn substituted forpi in the Shannon-Weaver equation to create shrub and tree diversity indices for each plot.
Statistical Analyses
Data were tested to assess departures from a normal dis- tribution with the Shapiro-Wilk Normality Test (Shapiro & Wilk 1965), and the Fmax statistic was used to detect heteroscedasticity (Sokal & Rohlf 1981). Coefficients of variation were used as estimates of the variability in shrub intercept coverage and tree diameter at breast height. The Student's t test and Wilcoxon rank sum test were used to compare measures of geomorphological heterogeneity between plots with high and low levels of biodiversity. A matrix of Spearman rank coefficients of correlation was computed to assess the interrelatedness of the six measures of geomorphological heterogeneity, and stepwise regression was used to determine the rela- tive importance of the individual variables used to create our index of geomorphological heterogeneity. All statis- tical procedures were implemented with PC-SAS (SAS In- stitute, Cary, North Carolina) and Statistica (StatSoft, Inc., Tulsa, Oklahoma) software.
Results
Diversity in geomorphological features varied widely in an eastern deciduous forest in Rhode Island. The composite geomorphological heterogeneity index created for each 2-ha plot from data on aspect, drainage, soil depth, soil texture, and slope were significantly higher in the 20 plots with high geomorphological heterogeneity (H' = 2.53, SE = 0.04) than in the 20 plots with low geomorphologi- cal heterogeneity (H' = 0.46, SE = 0.06;p < 0.001).
The fundamental objective of this project was to de- termine whether or not measures of biological diversity would parallel the established differences in geomor- phological heterogeneity between high and low geo- morphological heterogeneity sites. The species richness of shrubs was significantly higher in high geomorpho- logical heterogeneity plots (22.2 species, SE = 1.2) than in low geomorphological heterogeneity plots (12.0 spe- cies, SE = 0.8;p < 0.001; Fig. 2a). The species richness of trees was also significantly higher in high geomorpho- logical heterogeneity plots (9.2 species, SE = 0.6) than in low geomorphological heterogeneity plots (5.8 spe- cies, SE = 0.4;p < 0.001).
Tree and shrub diversity differed significantly between low and high geomorphological heterogeneity plots (p < 0.001; Fig. 2b). Shrub and tree diversity were both higher in high geomorphological heterogeneity plots (H' = 2.3, SE = 0.06; H'= 1.4, SE = 0.08, respectively)
20
$ 15
. 10
Z5
O- High GMH Low GMH High GMH Low GMH
SHRUBS TREES
3
-,~ ~ i
4g2
B.
n
30
High GMH Low GMH High GMH Low GMH
SHRUBS TREES
i8 i y C.
42 1
36
30 1 High GMIH Low GMH High GMIH Low GAMH
SHRUBS TREES
Figure 2. Comparisons between geomorphological heterogeneity (GMH) and biotic diversity: richness of shrub and tree species in plots with high and low geo- morphological diversity (a); diversity of shrub and tree species in plots with high and low geomorphologi- cal heterogeneity (b); coefficients of variation of shrub coverage (based on intercept length); and tree diame- ter at breast height in plots with high and low geomor- phological heterogeneity (c). In all cases n = 20 and mean values are bracketed by one standard error.
than in low geomorphological heterogeneity plots (H' =
1.6, SE = 0.09; H' = 1.0, SE = 0.08, respectively). Variability in vegetation structure differed significantly
between plots with low and high geomorphological
Conservation Biology
Volume 12, No. 2, April 1998
Burnett et al. Geomorphology PredictsBiodiversity (I.) 367
heterogeneity (Fig. 2c). The coefficient of variation in shrub canopy coverage was higher in high geomorpho- logical heterogeneity plots (52.3%, SE = 2.8) than in low geomorphological heterogeneity plots (44.0%, SE = 2.3; p < 0.05), and the coefficient of variation in tree diame- ter at breast height was higher in high geomorphologi- cal heterogeneity plots (52.8%, SE = 2.6) than in low geomorphological heterogeneity plots (31.5%, SE = 1.6; p < 0.001).
We divided the analysis plots into those with species richness values larger than the median for shrub and tree species richness (high biodiversity) and those smaller than the median for species richness (low biodiversity; Table 1). All of the individual measures of geomorpholog- ical heterogeneity, except the diversity of texture in the A horizon of soils, were significantly greater in plots sup- porting high species richness of trees and shrubs.
A correlation matrix comparing all possible combina- tions of the six separate indices of geomorphological heterogeneity indicated that the six variables were sig- nificantly interrelated (p < 0.01). There were differ- ences, however, in the degree to which the six abiotic variables were related to the index of geomorphological heterogeneity. Topographic aspect accounted for more of the variation (partial r2 = 0.94) in the index of geo- morphological heterogeneity than did any of the other five components of abiotic diversity used to generate this index. Soil texture diversities for the A and B hori- zons were the only abiotic variables that did not explain significant variation in our index of geomorphological heterogeneity; neither variable met the p = 0.15 inclu- sion limit of our stepwise regression model.
Aspect and drainage accounted for more of the vari- ance in biotic richness and diversity than did any other abiotic variables. For example, aspect diversity ac- counted for the majority of all variance in shrub richness (partial r2 for aspect = 0.53; total multivariate R2 for all abiotic variables = 0.65) and shrub diversity (partial r2
for aspect = 0.55; total multivariate R2 for all abiotic variables = 0.59). When aspect was removed from re- gression models, drainage accounted for the majority of the variance in all biotic variables except tree diversity.
Discussion
Convergent patterns of geomorphological heterogeneity and woody plant species diversity in an eastern decidu- ous forest provide evidence in support of the hypothesis that biotic diversity is a function, in part, of environmen- tal diversity. Spatial heterogeneity is often cited as a fac- tor that affects biotic diversity (August 1983; Huston 1994; Lapin & Barnes 1995; Rosenzweig 1995), yet to our knowledge there has been only one previous ex- plicit test of this assumption in which multiple measures of landscape heterogeneity were compared to one or more components of biotic diversity (Harner & Harper 1976). Further, geomorphological parameters such as as- pect and slope have long been known to influence vege- tation (Cantlon 1953; Ayyad & Dix 1964; Killingbeck & Wali 1978; Forman 1995; Wu & Loucks 1995), but the specific influence of the spatial variability of these geo- morphological parameters on species diversity has been addressed only once (Harner & Harper 1976).
For all combinations of plant type (shrubs and trees) and diversity (richness and diversity), plots character- ized as having high geomorphological heterogeneity were the same plots that supported the highest plant di- versities. Furthermore, variability in independent mea- sures of species dominance was significantly higher in high geomorphological heterogeneity plots than in low geomorphological heterogeneity plots. Therefore, spe- cies richness, diversity, and dominance were all associ- ated with spatial heterogeneity of abiotic properties.
We believe that differences in geomorphology within this eastern deciduous forest were the cause rather than
Table 1. Mean (? 1 SE) levels of diversity for each of the measures of geomorphological heterogeneity (GMH) and the composite index of GMH for analysis cells above (high) and below (low) the median value for shrub and tree species richness.a
Shrub species richness Tree species richness
Variable high (n = 20) low (n = 20) high (n = 20) low (n = 20)
aProbabilities are from the Wilcoxon rank sum statistic and test the hypothesis thatgeomorphological diversity is the same for sites character- ized by high and low levels of biodiversity. bp < o.001. cp <0.05. dp < 0.01.
Conservation Biology
Volume 12, No. 2, April 1998
368 Geomorphology Predicts Biodiversity (I.) Burnett et al.
the effect of the observed patterns in plant diversity be- cause the topographic and edaphic features used in our comparisons were primarily the result of nonbiological forces. For example, plants can be expected to have lit- tle if any effect on topographic aspect and slope. It is well known that abiotic environmental parameters such as soil temperature and available moisture may have re- ciprocal interactions with vegetation (Daubenmire 1959; Geiger 1966), yet such parameters were excluded from our analysis. Even the edaphic variables we used, with the possible exception of soil depth, had origins that were almost exclusively geological rather than biologi- cal. Therefore, it is reasonable to conclude that woody plant species diversity was a product of geomorphologi- cal heterogeneity in this eastern deciduous forest.
Although no attempt was made to correlate geomor- phology with animal diversity, it is likely that geomor- phological diversity is related to the diversity of all or- ganisms, not just vascular plants (Wu & Loucks 1995). The reliance of many species of animals on species-spe- cific plant resources indicates the high degree of inter- connectivity between plant and animal diversity. Put simply, animal diversity "...is clearly due largely to the diversity provided by terrestrial plants" (Hutchinson 1959).
Of the organisms we studied, shrubs were somewhat more sensitive to geomorphological heterogeneity than trees. By virtue of the differences in their maximum sizes, these two forms of woody perennial plants react differently to environmental conditions (Carlile et al. 1989). The distribution, abundance, and diversity of the smaller, more numerous shrubs should more readily reflect small-scale deviations in microenviron- mental variables. Because smaller plants have been found to be progressively more sensitive than larger plants to topo-graphic variables, such as aspect (Cantlon 1953), it follows that our analysis is a conservative esti- mate of the strength of the relationship between the di- versity of all plants and the GIS-derived index of geomor- phological heterogeneity.
Among the six topographic and edaphic measures we used to estimate overall geomorphological diversity, all variables, except A-horizon soil texture class, were indi- vidually related to tree and shrub diversity. When all six variables were combined into a composite index of geo- morphological heterogeneity, the vast majority of vari- ance in plant richness and diversity was accounted for by aspect and drainage variation. Although soil drainage was an important correlate of biodiversity in our study area, the other edaphic and nonedaphic characteristics we measured may be equally or more important than drainage diversity at other sites. Furthermore, abiotic variables not measured here may also be instrumental in successfully predicting biotic diversity; this possibility should be explored. Nevertheless, the consistent effec- tiveness of aspect and drainage in predicting biotic di-
versity is indicative of both the strength of the funda- mental relationship between these abiotic variables and biotic diversity and the efficacy of using them to predict relative levels of biotic diversity (Burnett 1995).
The degree to which our technique can be applied universally is not yet known. A significant link between the spatial heterogeneity of abiotic characteristics and plant species diversity in pinyon-juniper ecosystems (Harner & Harper 1976) suggests that the relationship between abiotic and biotic diversity is not restricted to eastern deciduous communities, yet many general ques- tions about this relationship remain unanswered. For ex- ample, we need to know if indices of geomorphological heterogeneity predict relative levels of biotic diversity in sites that are (1) widely variable in total area covered, (2) dominated by community types other than eastern deciduous forest or pinyon-juniper shrubland, (3) domi- nated by a wide spectrum of community types, and/or (4) divergent in their disturbance histories. Site size (Johnson & Raven 1973; Rosenzweig 1995), community type (Fisher 1960; MacArthur 1972), and disturbance history (Armesto & Pickett 1985; Petraitis et al. 1989; Hobbs & Huenneke 1992) all play pivotal roles in deter- mining plant distribution and diversity, yet our analysis took place in relatively small plots of equal size that were dominated by eastern deciduous forest and that had similar recent disturbance histories. Encouraging re- sults from a test of this technique in large, discontinuous sites dominated by a wide variety of community types (Nichols et al. 1998) supports the tenet that regions of high geomorphological heterogeneity support more- diverse biotic communities than are found in nearby re- gions of low geomorphological heterogeneity.
Conclusions
The coupling of biotic and abiotic landscape traits that we observed in a Rhode Island forest enabled us to use simple edaphic and topographic variables to predict the relative richness and diversity of woody plant species. Areas inherently high in geomorphological heterogene- ity supported woody floras richer and more diverse than those of areas of low geomorphological heterogeneity. The ramifications of these findings are clearly significant with respect to ecological theory, but their implications with regard to the conservation of biological resources are equally important.
The supposition that biotic diversity is ecologically and aesthetically valuable has prompted conservation agen- cies and governments to suggest that protection be af- forded to landscape parcels that are biologically diverse. There appears to be ecological merit in this strategy (Naeem et al. 1994), but measuring levels of biological richness and diversity is often a costly, time-consuming process (Burbidge 1991). Our technique of estimating
Conservation Biology
Volume 12, No. 2, April 1998
Burnett et al. Geomorphology PredictsBiodiversity (I.) 369
relative biological diversity by examining variation in geomorphological properties based on easily obtained GIS databases offers an alternative to the time-consum- ing task of orchestrating field studies to prepare species checklists for multiple landscape parcels. The presence or absence of specific species cannot be definitively as- certained with our protocol, yet it should be possible to use the technique to identify probable locations of such species once their habitat requirements are known in detail (Clark et al. 1993; Cherrill et al. 1995; Sperduto & Congalton 1996). It is also true that protection of re- gions of high species richness is not always the goal of conservation agendas. When the focus of a conservation strategy is protection of endemic taxa, umbrella species, or keystone organisms (Wilcox 1984; Lombard et al. 1995; Kiester et al. 1996; Berger 1997), our protocol will have limited value. But in instances when relative esti- mates of biological richness are required, use of our method can increase the efficiency of field surveys by targeting areas of high potential diversity. Predicting po- tential patterns of species diversity in landscapes that have been denuded or subjected to severe disturbance is also a feasible application of our assessment strategy.
Our method of quantifying geomorphological hetero- geneity should be broadly applicable to most landforms and geographic regions, but the specific components of GMH that are most relevant will assuredly vary geo- graphically. For example, variation in terrain variables, such as slope and aspect, at the scale of our analysis (?3 m vertical resolution) is of little significance in plains or savanna habitats where topography varies little. Further- more, the availability of digital representation of basic geomorphological data, such as soils, geology, and ter- rain, varies considerably across regions and among coun- tries.
In the past few years there has been a strong emphasis on ecosystem or landscape-level conservation strategies (Noss 1983; Hunter et al. 1988; Franklin 1993; Kohn & Walsh 1994; Meilleur et al. 1994; Grumbine 1997). Pro- tection of landscapes based on the existence of specific species has obvious short-term benefits, but long-term changes in the environment (e.g., climatic changes) ren- der specific species assemblages transient, not static. Hunter et al. (1988) and Samways (1990) have recog- nized that landscapes of high geomorphological hetero- geneity have probably supported diverse biotic commu- nities in the past and will do so in the future, even though the species composition of these communities will invariably change over time. They argue that protec- tion of regions with unique geomorphological proper- ties is a desirable long-term conservation goal because these regions will always support unique biota. The pro- tocol we offer here provides a mechanism with which to identify areas of high geomorphological heterogene- ity, and our data on plant diversity and richness are con- sistent with the ideas of Hunter et al. (1988): sites with
high geomorphological heterogeneity support a diverse flora of woody plants.
Acknowledgments
This research was funded by the Rhode Island Agricul- tural Experiment Station and the Department of Natural Resources Science at the University of Rhode Island (UIRI). W. Wright provided expert advice on soil proper- ties. We thank H. Ginsberg, R. LeBrun, W. Nichols, M. Huston, M. Hunter, and an anonymous reviewer for their thoughtful reviews of the manuscript. T. Mitchell provided excellent logistic support at the W. Alton Jones Campus of URI. R. S. Burnett and M. R. Asaro as- sisted with the vegetation sampling. This is contribution number 3368 of the Rhode Island Agricultural Experi- ment Station.
Literature Cited
Armesto, J. J., and S. T. A. Pickett. 1985. Experiments on disturbance in old-field plant communities: impact on species richness and abundance. Ecology 66:230-240.
August, P. V. 1983. The effects of habitat complexity and heterogene- ity in structuring tropical mammal communities. Ecology 64:1495- 1507.
August, P. V., A. McCann, and C. LaBash. 1995. GIS in Rhode Island. Fact sheet 95-1. Rhode Island Cooperative Extension, Kingston.
August, P. V., C. Baker, C. LaBash, and C. Smith. 1996. Geographic in- formation systems for the storage and analysis of biodiversity data. Pages 235-246 in D. Wilson, F. R. Cole, J. D. Nichols, R. Rudran, and M. Foster, editors. Measuring and monitoring biological diver- sity: standard methods for mammals. Smithsonian Institution Press, Washington, D.C.
Ayyad, M. A. G., and R. L. Dix. 1964. An analysis of a vegetation- microenvironmental complex on prairie slopes in Saskatchewan. Ecological Monographs 34:421-442.
Berger, J. 1997. Population constraints associated with the use of black rhinos as an umbrella species for desert herbivores. Conservation Biology 11:69-78.
Burbidge, A. A. 1991. Cost constraints on surveys for nature conserva- tion. Pages 3-6 in C. R. Margules and M. P. Austin, editors. Nature conservation: cost effective biological surveys and data analysis. Commonwealth Scientific and Industrial Research Organisation, Australia.
Burnett, M. B. 1995. Using geomorphological variation to predict local biodiversity. M. S. thesis. University of Rhode Island, Kingston.
Canfield, R. H. 1941. Application of the line intercept method in sam- pling range vegetation. Journal of Forestry 39:388-394.
Cantlon, J. E. 1953. Vegetation and microclimates on north and south slopes of Cushetunk Mountain, New Jersey. Ecological Mono- graphs 23:241-270.
Carlile, D. W., J. R. Skalski, J. E. Batker, J. M. Thomas, and V. I. Culli- nan. 1989. Determination of ecological scale. Landscape Ecology 2: 203-213.
Cherrill, A. J., C. McClean, P. Watson, K. Tucker, S. P. Rushton, and R. Sanderson. 1995. Predicting the distributions of plant species at the regional scale: a hierarchical matrix model. Landscape Ecology 10:197-207.
Clark, J. D., J. E. Dunn, and K. G. Smith. 1993. A multivariate model of female black bear habitat use for a geographic information system. Journal of Wildlife Management 57:519-526.
Cottom, G., and J. T. Curtis. 1956. The use of distance measures in phytosociological sampling. Ecology 37:451-460.
Daubenmire, R. F. 1959. Plants and environment. 2nd edition. John Wiley & Sons, New York.
Fisher, A. G. 1960. Latitudinal variations in organic diversity. Evolution 14:64-81.
Forman, R. T. T. 1995. Land mosaics: the ecology of landscapes and re- gions. Cambridge University Press, Cambridge, United Kingdom.
Franklin, J. F. 1993. Preserving biodiversity: species, ecosystems, or landscapes? Ecological Applications 3:202-205.
Geiger, R. 1966. The climate near the ground. Harvard University Press, Cambridge, Massachusetts.
Grumbine, R. E. 1997. Reflections on "What is ecosystem manage- ment?" Conservation Biology 11:41-47.
Harner, R. F., and K. T. Harper. 1976. The role of area, heterogeneity, and favorability in plant species diversity of pinyon-juniper ecosys- tems. Ecology 57:1254-1263.
Hobbs, R. J., and L. F. Huenneke. 1992. Disturbance, diversity, and in- vasion: implications for conservation. Conservation Biology 6:324- 337.
Hunter, M. L., Jr., G. L. Jacobson, Jr., and T. Webb III. 1988. Paleoecol- ogy and the coarse-filter approach to maintaining biological diver- sity. Conservation Biology 4:375-385.
Huston, M. 1994. Biological diversity: the coexistence of species on changing landscapes. Cambridge University Press, Cambridge, United Kingdom.
Hutchinson, G. E. 1959. Homage to Santa Roslia, or why are there so many kinds of animals? American Naturalist 93:145-159.
Johnson, M. P., and P. H. Raven. 1973. Species number and endemism: the Galapagos archipelago revisited. Science 179:893-895.
Kiester, A. R., J. M. Scott, B. Csuti, R. Noss, B. Butterfield, K. Sahr, and D. White. 1996. Conservation prioritization using GAP data. Con- servation Biology 10:1332-1342.
Killingbeck, K. T., and M. K. Wali. 1978. Analysis of a North Dakota gallery forest: nutrient, trace element and productivity relations. Oikos 30:29-60.
Kohn, D. D., and D. M. Walsh. 1994. Plant species richness: the effect of island size and habitat diversity. Journal of Ecology 82:367-377.
Lapin, M., and B. V. Barnes. 1995. Using the landscape ecosystem ap- proach to assess species and ecosystem diversity. Conservation Bi- ology 9:1148-1158.
Lombard, A. T. 1995. The problems with multi-species conservation: do hotspots, ideal reserves, and existing reserves coincide? South African Journal of Zoology 30:145-163.
Lombard, A. T., A. 0. Nicholls, and P. August. 1995. Where should na- ture reserves be located in South Africa? A snake's perspective. Conservation Biology 9:363-372.
MacArthur, R. H. 1972. Geographical ecology. Princeton University Press, Princeton, NewJersey.
Magurran, A. E. 1988. Ecological diversity and its measurement. Prince- ton University Press, Princeton, NewJersey.
Maune, D. F. 1996. Introduction to digital elevation models (DEM). Pages 131-134 in digital photogrammetry: an addendum to the manual of photogrammetry. American Society for Photogrammetry and Remote Sensing, Bethesda, Maryland.
Meilleur, A., A. Bouchard, and Y. Bergeron. 1994. The relation be- tween geomorphology and forest community types of the Haut- Saint-Laurent, Quebec. Vegetatio 111:173-192.
Naeem, S., L. J. Thompson, S. P. Lawler, J. J. Lawton, and R. M. Wood- fin. 1994. Declining biodiversity can alter the performance of eco- systems. Nature 368:734-737.
Nichols, W. F., K. T. Killingbeck, and P. V. August. 1998. The influence of geomorphological heterogeneity on biodiversity. II. A landscape perspective. Conservation Biology 12:371-379.
Noss, R. F. 1983. A regional landscape approach to maintain diversity. BioScience 33:700-706.
Petraitis, P. S., R. E. Latham, and R. A. Niesenbaum. 1989. The mainte- nance of species diversity by disturbance. The Quarterly Review of Biology 64:393-418.
Rector, D. D. 1981. Soil survey of Rhode Island. Rhode Island Agricul- tural Experiment Station, Kingston.
Rosenzweig, M. L. 1995. Species diversity in time and space. Cam- bridge University Press, Cambridge, United Kingdom.
Samways, M. J. 1990. Land forms and winter habitat refugia in the con- servation of montane grasshoppers in southern Africa. Conserva- tion Biology 4:375-382.
Scott, J. M., F. Davis, B. Csuti, R. Noss, B. Butterfield, C. Groves, H. Anderson, S. Caicco, F. D'Erchia, T. C. Edwards, J. Ulliman, and R. G. Wright. 1993. Gap analysis: a geographic approach to protec- tion of biodiversity. Wildlife Monographs 123:1-41.
Shannon, C. E., and W. Weaver, editors. 1949. The mathematical the- ory of communication. University of Illinois Press, Urbana.
Shapiro, S. S., and M. B. Wilk. 1965. An analysis of variance test for nor- mality (complete samples). Biometrika 52:591-611.
Sokal, R. R., and F. J. Rohlf. 1981. Biometry. 2nd edition. W. H. Free- man and Company, San Francisco.
Soule, M. E., editor. 1986. Conservation biology: the science of scarcity and diversity. Sinauer Associates, Sunderland, Massachusetts.
Sperduto, M. B., and R. Congalton. 1996. Prediciting rare orchid (small whorled pagonia) habitat using GIS. Photogrammetric Engineering and Remote Sensing 62:1269-1279.
U.S. Geological Survey. 1987. Digital elevation models. Data user's guide 5. Reston, Virginia.
Wilcox, B. A. 1984. In situ conservation of genetic resources: determi- nants of minimum area requirements. Pages 639-647 in J. A. Mc- Neely and K. R. Miller, editors. National parks, conservation, and development. Smithsonian Institution Press, Washington, D.C.
Wilson, E. O., and F. M. Peter, editors. 1988. Biodiversity. National Academy Press, Washington, D.C.
Wu, J., and 0. L. Loucks. 1995. From balance of nature to hierarchical patch dynamics: a paradigm shift in ecology. Quarterly Review of Biology 70:439-466.