J. Zoof., Lond. (A) (1985) 206,311-320 The influence of habitat on behaviour in a group of St. Kitts green monkeys COLIN CHAPMAN Department of Anthropology, University of Alberta, Edmonton, Alberta, Canada (Accepted 9 October 1984) The relationships between specific ecological variables and the expression of behaviours were investigated in a group of green monkeys (Cercopirhecus aethiops) inhabiting an ecologically diverse home range on the dry savanna-like peninsula of St. Kitts, West Indies. The group’s behaviour was shown to vary between areas that differed with respect to four factors produced from a factor analysis of 20 ecological variables. A number of relationships between behaviour and ecology were found that have not been previously described. Social behaviours were negatively related to cover, while attention behaviours were positively related to cover. Agonistic behaviours and afiliative behaviours were positively related to food abundance. Open areas with edge proved to be important to the group, and a number of behaviours were expressed for longer durations and/or more frequently in these areas. Comparisons of this study with others illustrates a need to examine carefully behavioural ecological relationships using quantitative methodology. Contents Page Introduction ...................................... 31 I Methods ........................................ 312 Results .......................................... 314 Factor 1 : Food plant species providingcover ...................... 3 I4 Factor2:Openareawithedge .............................. 315 Factor 3: Dense vegetation .............................. 3 16 Factor 4: Food plant density .............................. 3 17 Discussion ........................................ 3 17 Summary ........................................ 3 19 References ........................................ 320 Introduction Although there is widespread acceptance of the idea that behaviour is influenced by the ecological conditions experienced by an animal, few studies have quantitatively analysed this relationship. A model depicting ecological conditions as selective forces on behaviour has frequently been employed to explain intra- and interspecific variability in primate behaviour. Patterns of ranging behaviour in primates are related to ecological conditions such as abundance and distribution of food resources, and intensity of predation (e.g. DeVore, 1963; Kummer, 1968; Crook 1970; Jorde & Spuhler, 1974; McGuire, 1974; Spuhler & Jorde, 1975; Dunbar, 1977; Fairbanks & Bird, 1978). Not only have behavioural ecological relations been proposed for behaviours which relate directly to the animal’s environment, such as ranging and foraging patterns, but social behaviours such as play and grooming have also been related to ecological conditions. For example, Altmann (1959) and Loizos (1965) hypothesized that play, which is 0022- 5460/85/0703 I 1 + 10 003.00/0 @ 1985 The Zoological Society of London 31 1
Transcript
J . Zoof., Lond. ( A ) (1985) 206,311-320
The influence of habitat on behaviour in a group of St. Kitts green monkeys
C O L I N CHAPMAN Department of Anthropology, University of Alberta, Edmonton, Alberta, Canada
(Accepted 9 October 1984)
The relationships between specific ecological variables and the expression of behaviours were investigated in a group of green monkeys (Cercopirhecus aethiops) inhabiting an ecologically diverse home range on the dry savanna-like peninsula of St. Kitts, West Indies. The group’s behaviour was shown to vary between areas that differed with respect to four factors produced from a factor analysis of 20 ecological variables.
A number of relationships between behaviour and ecology were found that have not been previously described. Social behaviours were negatively related to cover, while attention behaviours were positively related to cover. Agonistic behaviours and afiliative behaviours were positively related to food abundance. Open areas with edge proved to be important to the group, and a number of behaviours were expressed for longer durations and/or more frequently in these areas. Comparisons of this study with others illustrates a need to examine carefully behavioural ecological relationships using quantitative methodology.
Although there is widespread acceptance of the idea that behaviour is influenced by the ecological conditions experienced by an animal, few studies have quantitatively analysed this relationship. A model depicting ecological conditions as selective forces on behaviour has frequently been employed to explain intra- and interspecific variability in primate behaviour. Patterns of ranging behaviour in primates are related to ecological conditions such as abundance and distribution of food resources, and intensity of predation (e.g. DeVore, 1963; Kummer, 1968; Crook 1970; Jorde & Spuhler, 1974; McGuire, 1974; Spuhler & Jorde, 1975; Dunbar, 1977; Fairbanks & Bird, 1978). Not only have behavioural ecological relations been proposed for behaviours which relate directly to the animal’s environment, such as ranging and foraging patterns, but social behaviours such as play and grooming have also been related to ecological conditions. For example, Altmann (1959) and Loizos (1965) hypothesized that play, which is
0022- 5460/85/0703 I 1 + 10 003.00/0 @ 1985 The Zoological Society of London 31 1
311 C O L I N C H A P M A N
stated to require a surplus of energy, decreases when food becomes less available. Behavioural ecological models have also been used to explain variation in social organization. The social organization of primate species have been related to such ecological variables as the quality (Crook & G a r t h , 1966; Kummer. 1968; Dunbar, 1977) and distribution (Nishida, 1968; Klein & Klein, 1975) of food resources. While these studies offer a plausible explanation for the development of the observed behaviours, it is difficult to assess their value because details of the ecological factors involved have been poorly quantified.
Behavioural ecological relationships are commonly demonstrated by making comparisons between different studies on phylogenetically diverse taxa (e.g. Eisenberg ei af., 1972; Jorde & Spuhler, 1974; Clutton-Brock & Harvey, 1977~1, h). However, the value of such studies are limited by the precision with which behavioural and ecological variables are measured. Methodological differences between studies and large interspecific variation severely limit such comparisons. In addition, phylogeny sets inherent limits on the behaviours of species, further restricting between species comparisons.
To investigate the relationships between specific behavioural and ecological variables, it may prove more effective to examine behavioural changes expressed by one group as its members move between areas that express a range in the selected ecological variables. This research empirically investigates the existence of specific relationships between behaviours expressed by a social group of green monkeys (Cercopifhecus aefhiops) and selected aspects of their environment. A group of green monkeys living on the dry savanna-like peninsula of St. Kitts was selected as a study group because of its ecologically diverse home range.
Methods
Green monkeys were introduced to the island of St. Kitts in the 17th century. The population is probably descended from West African monkeys brought over to the island by slave traders (Sade & Hildrech, 1965). Since the original introduction, the population of green monkeys has grown, until today the monkeys inhabit virtually all of the uncultivated habitats on the island.
Data for this investigation were collected between April and November of 1982. The study group’s home range is a mosaic of distinct habitats. The majority of the area is a fire-affected community dominated by acacia (Acacia farnesiana), but drainage ravines coming from a hill within the group’s range support large stands of trees (up to I5 m high), such as Bursera simaruba, Tabebuia pallida and Hippomane mancinella. The range includes a small saline lake surrounded by a n extensive mangrove thicket (Rhizophora mangle), a mancineel grove (Hippomane rnancinella), and a large grassland area. Throughout the group’s range, there are intermittent stands ofclammy cherry trees (Cordia ohliqua), coconut palm (COCOS nucifera) and sea grape (Coccalobo uvifera). The climate of the area is dry; 46.1 cm of rain fell over the study period, and monthly levels ranged from 1.7 cm to 15.3 cm.
The study group contained, on average, 50 animals and had an agelsex composition of 9-10 adult males, 2-3 subadult males, 19 adult females, 3 subadult females, I 1 juveniles and 3-5 infants. The group occupied a home range of 0.51 kmz.
Behavioural data were gathered using a focal animal sampling technique that employed a 5 min test session (Altmann. 1974). If the subject was lost to sight prior to the end of the session. the data collected during the session were discarded. The subject for each focal animal session was chosen based on a fixed rotation between the agelsex classes. For the purpose of analysis, some of the behaviours that occurred rarely were combined with behaviours with similar functions (Chapman, 1983). For example, the behavioural category called agonistic behaviours was formed by combining headbob, bodybounce, open mouth threat, bite, grab, cuff, branchshaking display and attack. The focal animal’s location was noted a t the beginning of the session t o facilitate the comparison of the subject’s behaviour to the ecological conditions of the area it was in.
I N F L U E N C E O F H A B I T A T ON G R E E N M O N K E Y B E H A V I O U R 313
The habitats within the group’s home range were sampled using a system of 100 m by 100 m quadrats, each of which was scored on 20 ecological variables. Since the study group used 51 quadrats, it was impossible to sample the variables in each quadrat, so 10 m by 10 m plots were set up in each of 9 distinct types of habitat, and the values of the ecological variables were sampled in the plots. The level of each ecological variable for a quadrat was calculated by summing the proportion of each habitat type in the quadrat and multiplying it by the habitat’s value on each variable.
The ecological variables were measured as follows. Plant and food plant density and diversity were calculated for 3 sizes of plants (variables 1-12), small (0-0.5 m), medium (0.5 m-2.0 m) and large (> 2 m). Diversity was calculated using the Shannon-Weiner Index. A measure of cover (variable 13) was obtained by estimating how much of a 10 m vertical pole was visible to an observer seated 10 m from it. In each plot, the mean and maximum canopy height were determined (variables 14 and 15). Mean canopy height was estimated by averaging the height of all plants, except those plants that belonged to species that were very small and abundant, such as grasses and ground-level succulents. Maximum canopy height was simply the height of the tallest individual plant. Human disturbance and the structural complexity (variables 16 and 17) of the area were recorded using qualitative ranking procedures. Open pastures received the lowest rank for structural complexity, while areas with tall trees and dense understoreys received the highest rank. In addition, an estimate was made of the percentage of each quadrat covered by any vegetation and by food plants, and the amount of open ground was calculated (variables 18-20).
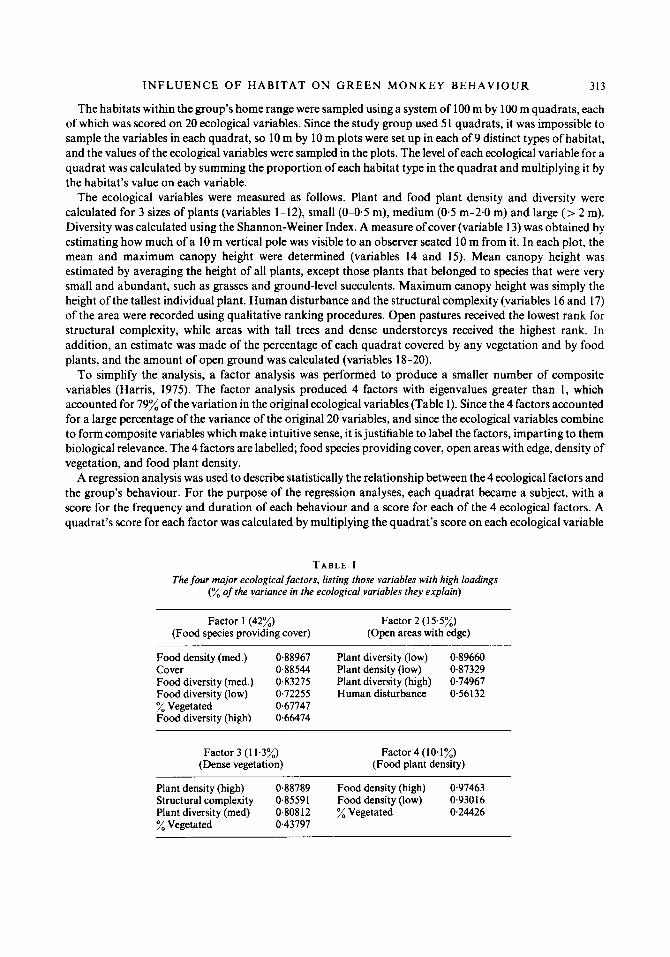
To simplify the analysis, a factor analysis was performed to produce a smaller number of composite variables (Harris, 1975). The factor analysis produced 4 factors with eigenvalues greater than 1, which accounted for 79% of the variation in the original ecological variables (Table I). Since the 4 factors accounted for a large percentage of the variance of the original 20 variables, and since the ecological variables combine to form composite variables which make intuitive sense, it is justifiable to label the factors, imparting to them biological relevance. The 4 factors are labelled; food species providing cover, open areas with edge, density of vegetation, and food plant density.
A regression analysis was used to describe statistically the relationship between the 4 ecological factors and the group’s behaviour. For the purpose of the regression analyses, each quadrat became a subject, with a score for the frequency and duration of each behaviour and a score for each of the 4 ecological factors. A quadrat’s score for each factor was calculated by multiplying the quadrat’s score on each ecological variable
T A B L E I The four major ecological factors, listing those variables with high loadings
(% of the variance in the ecological variables they explain)
Factor 1(42%) (Food species providing cover)
Factor 2 ( 1 5.5%) (Open areas with edge)
Food density (med.) 048967 Plant diversity (low) 0.89660 Cover 0.88544 Plant density (low) 0.87329 Food diversity (med.) 043275 Plant diversity (high) 0.74967 Food diversity (low) 0.72255 Human disturbance 0.56132
Food diversity (high) 0.66474 % Vegetated 0.67747
Factor 3 (1 1.3%) (Dense vegetation)
Factor 4 (10.1%) (Food plant density)
Plant density (high) 0.88789 Food density (high) 0.97463 Structural complexity 0.85591 Food density (low) 0.93016 Plant diversity (med) 0,80812 %Vegetated 0.24426 % Vegetated 0.43797
314 COLIN C H A P M A N
by the loading of that variable on the factor, dividing by the eigenvalue of that factor, and summing over all variables in the set composing the factor. Since the ecological factors are statistically derived compositions, each containing contributions from all the ecological measures, it is not suitable to use them as independent variables and look for combined effects. Therefore, in this analysis each ecological variable was designated as the dependent variable in a regression equation, where behaviours were inserted as independent variables. In this way, the regression equations illustrated which combination of behaviours best predicted each ecological factor. Inasmuch as the heuristic interpretation of the ecological factors are valid, the equations allow us to suggest relationships between qualities of the habitat and the expression of behaviour. The r values produced by this analysis depicted the strength with which the frequency and duration of the behaviours were related to each of the 4 factors. The mean frequency and duration with which each behaviour was exhibited in a quadrat was used in further analyses tocompensate for the fact that different quadrats had different numbers of focal animal sessions. Only those quadrats in which more than 10 focal animal sessions were conducted were used in the regression analysis.
Results
Fucror 1: Food plant species providing cover The first factor, called food plant species providing cover, was not found to be significantly
related to any of the behaviours observed (see Table I1 for the r and P values describing the relationships between factors and behaviours). This can largely be explained by the nature of this factor. The ecological conditions which load highly into this factor are not localized, consequently a high proportion of the quadrats load highly to it. This suggests that this factor represents an ubiquitous condition found throughout the group's home range, so it is unlikely that the green monkeys would differentially respond to it.
T A B L E I I Corrrlurion values describing relurionships herween facrors and hehaviours
Hehaviour
Play
Feed
Attention
Agonism
Groom
Rest
Alfiliative
Factor I ... . . -~
Fre. -0.19 Dur. -0.19 €re . 0.0 I Dur. 0.12 Fre. 0.20 Dur. - 0.09 Fre. -0.10 Dur. -0.27 Fre. 0.25 Dur. - 0.0 I Frc. 0.06 Dur. 0.03 Fre. ~ 0 . 1 2 Dur. -0.15
Factor 2 Factor 3 . .
0.50' -0.34* 0.25 0.38'
- 0.4X* 0.58*
-0.18 0.53* - 0.20 0.49*
0.29 - 0.20 0.40* -0.28 0.37* -0.15 0.52. -0.30 0.07 - - O . I O 0.2 1 - 0.31 0.40. -0.12
0.32 -0.14
0.23 -0.35'
Factor 4
0.05 0.04 0.20
- 0.0 I -0.10 -0.14
0 34' 0.01 0.10
-0 03 0.14
- 0.0 I 0.66* 0.38.
Factor I = Food species providing cover Factor 2 = Opcn area with edge Factor 3 = Density of vegetation Factor4 = Food plant density
Fre. = Frequency Dur. = Duration
* Probability < 0.05
INFLUENCE OF HABITAT O N GREEN MONKEY BEHAVIOUR 315
Factor 2: Open area with edge The second factor, called open area with edge, accounted for 15.5 % of the variation of all the
ecological variables examined. It was negatively correlated with the frequency of foraging ( r = - 0.480, P = 0.009), and showed a weak positive relationship with the duration of the feeding bout (r = 0-3 18, P = 0.065). This suggests that, in areas which are open and border on a number of different habitats, green monkeys rarely forage, but when they do, it is typically for a long dura- tion. Some of the most preferred fruiting trees, such as clammy cherry (Cordiu obliquu), are found on the edge of clearings. Clammy cherries are one of the most used food items for the green monkeys, and whenever an animal fed in these trees it would do so for a long time.
The open area with edge factor was correlated with both the frequency ( r = 0.371, P = 0.036) and duration ( r = 0.525, P = 0.004) of grooming. Bouts of grooming occurred in open areas, such as grassland, but in these areas grooming was relatively rare, and, when it did occur, the bouts were of short duration. However, long grooming sessions were frequently observed under the trees, immediately adjacent to open areas. Thus, this relationship is probably a response by the green monkeys to edge areas. There was not a relationship between this factor and either the frequency ( r = 0.0070, P = 0.380) or duration ( I = 0.213, P = 0.128) of resting. The frequency of affiliative behaviours was significantly related to the open area with edge factor ( I = 0.396, P = 0.028), however, duration of affiliative behaviours showed no relationship with this factor (r = 0.227, P = 0.143). Agonistic behaviours exhibited the opposite trend, duration was significantly related ( r = 0405, P = 0.025), but frequency was not related ( r = 0.291, P = 0.084). Thus, although agonism was infrequent, fights, both in the fruiting trees on the border of the open areas and in the clearings, often involved long chases.
It has frequently been suggested that primate species living in open areas, such as savannas, experience a higher risk of predation than forest primates (DeVore, 1963; Gartlan, 1968; Fairbanks & Bird, 1978). This suggestion can be tested by quantifying the frequency with which predator avoidance occurs, assuming that predator avoidance is a good measure of the actual risk of predation. Attention or surveillance behaviours should occur more frequently in open areas if, as suggested, the risk of predation is greater here. In this study, neither the frequency (r = 0.1 77, P = 0.205), nor the duration ( r = -0.204, P = 0.169) of attention behaviours were related to the open area with edge factor.
Animals were observed playing 125 times during the study, and the duration of the play bouts varied from a few seconds to the full five minute focal animal session. The frequency of play was related to the open area with edge factor (r = 0.503, P = 0.006), while the duration ofplay was not ( r = 0.255, P = 0.1 15) related to this factor.
Multiple regression analysis can analyse the relationship between a dependent variable, in this case the open area with edge factor, and a set of independent variables, in this instance the behaviours. It will generate the best linear predictive equation composed of the various independent variables, stating the amount of variation in the dependent variable accounted for by each independent variable. The regression equation performed for the open area with edge factor is composed of two significant variables. The first variable to go into the equation is the duration of grooming which accounts for 27.5% of the variation in this factor. When the next variable, the frequency of affiliative behaviour, is added into the equation a total of 37.6 % of the variation is accounted for. This procedure demonstrates the tendency for the green monkeys to use areas that are open and contain more than one habitat type for the frequent expression of affiliative behaviours and for long grooming bouts.
316 C O L I N C H A P M A N
Factor 3: Dense vegetation Since dense vegetation can decrease the ease with which a predator can detect green monkeys
and can provide abundant routes of escape (Fairbanks & Bird, 1978), it may provide a relatively high degree of safety. One might expect a positive correlation between the density of the vegetation and resting and grooming; and a negative correlation between this factor and attention behaviours. The analyses found no significant relationship between the density of vegetation factor and the frequency and duration of resting and grooming. However, both the frequency ( r = 0.533. P = 0.004) and duration ( r = 0.489, P = 0.008) of attention were positively correlated with the density of vegetation factor. Thus the green monkeys did not rest or groom longer or more frequently in densely vegetated areas, but they did exhibit significantly more and longer attention behaviours. An animal was considered to be exhibiting attention behaviours whenever it was observed to be in a state of vigilance, overtly observing its environment. This behaviour was directed at conspecifics, especially when they were engaged in agnostic interactions, or at potential predators. but often the focus of the subject’s attention behaviours was not apparent. The frequency and duration of attention should be positively correlated with the degree of anxiety. There was no significant relationship between either the frequency (r = -0.20, P = 0.18) or duration ( r = -0.28, P = 0.09) of agonistic behaviours and this factor. This suggests that the increased level of attention is not caused by an increase in the amount of attention behaviour directed to conspecifics engaged in agonism. The relationship between attention behaviour and the density of vegetation could be explained if, in densely vegetated areas, the green monkeys are con- cerned about the possibility of predation. Since humans are a major predator ofgreen monkeys on St. Kitts, and since the level of human disturbance of those quadrats in which attention was given at the lower frequency was not significantly different from quadrats having higher frequencies ( t = 04306, P > O.IO) , i t seems unlikely that the association between attention and density is re- lated to human predation. I t is possible that in dense vegetation visibility is reduced, so for an animal to have adequate awareness of what is happening in the immediate area, it is necessary to monitor the environment more frequently. If a disturbance does occur in dense vegetation, one would expect that it would take longer to identify its origin, or in the case of an agonistic encounter, to identify the participants. Since visibility is limited in densely vegetated areas, perhaps the green monkeys are just more obviously attentive to the observer in these areas or, in the open areas, they may be equally as attentive as in the densely vegetated areas, but they may monitor all dangers without exhibiting obvious signs of doing so. On a number of occasions, when the group was in open areas, i t would respond to people when they were first visible, at a distance of over 200 m.
The frequency ( r = -0.338, P = 0.050) and duration ( r = -0.384, P = 0.032) of play were both negatively correlated with the density of vegetation factor, as was the duration of affiliative behaviours ( r = -0.354. P = 0.045). Thus, in densely vegetated habitats, play occurred propor- tionately less often than in less dense habitats; and when i t did occur it was of short duration. In addition, affiliative behaviours tended to be of short duration in dense habitats. A positive relationship existed between this factor and the frequency of foraging ( r = 0.579, P < 0.001). Since there were no significant positive relationships between this factor and any of the behaviours examined. with the exception of attention. it seems reasonable to speculate that the main reason the green monkeys were using densely vegetated areas was to feed.
The regression equation. generated to express the relationship between the density of vegetation factor and the behaviours, exhibits a high overall accuracy of prediction. The frequency of feeding
INFLUENCE OF HABITAT O N GREEN MONKEY BEHAVIOUR 317
alone explains 33.5% of the variation in selection of this factor. With the addition of the frequency of attention behaviour to the equation, the amount of variation accounted for increased to 47.6%. The duration of play is the third variable to enter the equation, bringing the total explained variance up to 57.5%. The high accuracy level of this predictive equation demonstrates that the green monkeys tend to feed frequently in densely vegetated areas while often surveying their surroundings, but play rarely and, if they do so, for only short periods of time.
Factor 4: Food plant density The last factor, food plant density, explained 10% of the variation in all of the ecological
variables sampled. Contrary to what might be expected, this factor was not significantly related to either the frequency ( r = 0.198, P = 0.171) or duration of feeding ( r = -0.007, P = 0.488). This suggests that the green monkeys are making active selection of those areas in which to feed, based on characteristics of the plants other than simply abundance. The food plant density factor was related to the frequency ( r = 0.666, P -= 0401) and duration ( r = 0.334, P = 0.032) of affiliative behaviours and the frequency of agonistic behaviours. The high frequency of agonistic behaviours in areas of high food plant density provides evidence that suggests the green monkeys are competing over food in these areas. This, in turn, suggests an explanation for the relationship between affiliative behaviour and food plant density. The increase in frequency and duration of affiliative behaviours with increasing food plant density may be also in response to the frequent aggressive behaviours in areas of high food plant density. Only the frequency of affiliative be- haviours entered into the regression equation, which was generated to express the relationship between the food plant density factor and the behaviours. This behaviour alone accounted for 44.1% of the variation in the selection of this factor. If the speculation concerning the relationship between agonistic and affiliative behaviour and this factor is correct, then this rz value suggests that the unit increase in affiliative behaviours is much greater than the unit increase in agonistic behaviours.
Discussion
The behaviour of green monkeys on St. Kitts is closely associated with their ecological conditions. This research supports and quantifies a number of previously proposed behavioural ecological relationships and introduces some new relationships.
Predation is frequently considered to be an important variable in shaping primate social life, yet it has proven to be very difficult to assess. DeVore (1963) suggested that association with high levels of cover would decrease the risk of predation. This suggests that green monkeys should avoid open areas providing little cover, and when animals used these areas they would be anxious, frequently monitor their environment, and rarely take part in relaxed social behaviours, such as play and grooming. The green monkeys were frequently seen using open areas (Chapman, 1983) and in these areas they exhibited play, grooming and affiliative behaviours more frequently than in areas providing more cover. This suggests that in open areas green monkeys were either not experiencing greater risks of predation, or that these areas provided the green monkeys with benefits which outweigh the increased risks of predation. The open areas were characterized as having the highest levels of human disturbance, and are the areas where dogs were seen most frequently, which suggests that in these areas the probability of predation is relatively high. Also, on several occasions, attempted predation by hunters with dogs was observed. Both of the neighbouring groups lost members to human hunters. Also, a feral dog pack was seen hunting in
318 C O L I N C H A P M A N
the study group's area. In open areas, the green monkeys appeared to have an increased proba- bility of interacting with predators, but this does not necessarily mean that the risk of predation was increased in these areas. Improved visibility in open areas may reduce the chances of surprise attacks and reduce the need for vigilance. This reduced need for vigilance may have been the factor which encouraged the green monkeys to exhibit play, grooming and affiliative behaviours more frequently in areas which were open.
I t seems logical that the green monkeys would forage in areas with the highest density of food plants. Results did not support this prediction, suggesting that food abundance is not the basis of foraging site selection. Food quality, a variable not easily quantified, may influence the selection of feeding areas.
This study introduced some behavioural ecological relationships not previously described in the literature. For example. it was demonstrated that the green monkeys expressed affiliative behaviour more frequently, and for a longer duration, in both open areas with edge and in areas possessing high food plant density. They also tended to rest for longer periods along the edge of clearings than in any other situation. In addition, the density of the vegetation in an area in- fluenced the frequency with which the green monkeys fed and expressed attention behaviours.
The green monkeys selected clearings that were bordered by tall fruiting trees (Chapman, 1983). These areas are characterized by having high levels of human disturbance and large amounts of secondary growth. Also, these areas loaded most highly into the open area with edge factor, the factor associated with the greatest number of the observed behavioural ecological relationships. The nature of secondary growth areas are poorly understood, however, examining what is known about them provides some insights into how the green monkeys may relate to these areas. The tree fall is one of the most intensively studied areas of secondary growth in the tropics. Within the area of a recent tree fall, Hartshorn (1978) identified a tremendous increase in the diversity of plant species in comparison to the surrounding undisturbed forest. A similar result was found here; those quadrats that had recently been disturbed and contained secondary growth border areas had the highest level of diversity in all size classes of plants. Webb et al. (1972) described the events that occurred over 14 years following the experimental clearing of rain forest areas in Queensland, Australia. They discovered that leaf biomass production in the experimentally cleared areas rose rapidly following clearing to surpass leaf production in control areas. The fruit production of the experimentally cleared areas also increased rapidly, so that in seven years it was only slightly less than that of the control areas. This suggests that the selection of these secondary growth border areas by the green monkeys may be associated with the selection of areas of increased productivity. This is supported by the fact that when the green monkeys foraged in these areas, they did so for significantly longer than when they foraged in undisturbed areas. I t is also possible that green monkeys are selecting these secondary growth border areas because of the quality of food they provide. Plants in secondary growth areas have been shown to invest proportionately less energy into the production of wood than plants in undisturbed areas, so more energy is available to the consumer (Coley, 1983). In addition, plants of secondary growth areas invest less in predator defence mechanisms, such as toxins, than plants in undisturbed areas (Janzen, 1970, 1978; Coley, 1983). Thus green monkeys may be selecting these areas on the basis of food quality. This is supported by the fact that the green monkeys foraged in secondary growth border areas for a longer duration than in undisturbed areas. These studies of secondary growth demonstrate that, in comparison to undisturbed areas, secondary growth areas have higher plant diversity and produc- tivity. that a greater proportion of their productivity is available for primate consumption, and that they develop fewer predator defences.
I N F L U E N C E O F H A B I T A T O N G R E E N M O N K E Y B E H A V I O U R 319
Other studies of green monkeys have demonstrated a high reliance on areas of secondary growth. Moreno-Black & Maples (1977) observed that the diet of a group of green monkeys in the coastal forests of Kenya was dominated (67%) by items from secondary growth areas. Kavanagh (1980), based on his study of the West African green monkey, claimed that the green monkey is a species adapted to exploit newly created secondary growth environments. Other species of primates have similarly been shown to be dependent on secondary growth areas. Kano (1 979) observed that the pygmy chimpanzee (Panpaniscus) is found predominantly in areas of secondary growth, especially along rivers. Charles-Dominique (1971, 1977) suggested that the Angwantibo (Arctocehus cafabarensis) is confined to areas of regenerating forest, such as tree falls. He found that the distribution of the Angwantibos coincided exactly with the occurrence of tree fall areas.
The model which has been presented here, in which behaviours are related to particular ecological conditions, does not attempt to be an all-encompassing explanation of behavioural variation. It does attempt to provide an explanation of some of the variability that exists in the behaviours expressed under different ecological conditions. The examination of how the green monkey’s behaviour was influenced by the habitat has illustrated the importance of secondary growth areas for green monkeys. There remains a large amount of behavioural variability exhibited by the green monkeys in the study group which has not been explained. Some aspects of green monkey behaviour are likely to be dependent on ecological variables not examined, as well as on unexamined social variables such as kinship, dominance, demographic conditions, etc; which are themselves related to ecological conditions. The results of this study clearly illustrate the need to examine behavioural ecological relationships in a quantitative manner. Claims made from qualitative appraisals of the situation are simply not adequate. A number of the behavioural ecological relationships which this study revealed were not initially apparent from casual observations.
Summary
The relationships which exist between behaviours and specific characteristics of the habitat were investigated with a group of green monkeys. The behaviour of the green monkeys was shown to vary in relation to an area’s score on four factors constructed from a factor analysis of 20 ecolo- gical variables. The green monkeys frequently used open areas where they appeared to have an increased probability of interacting with predators. In these areas, they exhibited play, grooming and affiliative behaviours more frequently than in areas providing more cover. These relationships may be related to the improved visibility in open areas which could decrease the probability of predation by reducing the chances of surprise attacks. The green monkeys did not forage in areas of high food plant density, suggesting that they are selecting feeding areas based on some criteria other than simply the abundance of food. Lastly, a number of behaviours were expressed for longer durations and/or more frequently in open areas containing large amounts of secondary growth, suggesting that these areas are important to the green monkeys. The nature of these secondary growth areas provide insights into how the green monkeys relate to these areas.
I would like to thank Dr Linda Fedigan and Dr Laurence Fedigan for advice and help throughout the study. I am also grateful to Dr J. Addicott, Dr J. Murie, J . Bullard and L. Turner for helpful comments on drafts of this paper. The cooperation of the Government of St. Kitts in carrying out this study is greatly appreciated. This research was supported in part by a N.S.E.R.C. Postgraduate Scholarship.
320 C O L I N C H A P M A N
R E F E R E N C E S Altmann. S. A. (1959). Field observations on a howling monkey society. J. Mammal. 40: 317 330. Altmann. J . (I 974). Observational study of behaviour: Sampling methods. Behaviour 49: 227-267. Chapman. C. A. (1983). Behmioural ecology OJ the St. Ki1f.s green monkey. Unpublished M.A. Thesis, University of
Charles-Doniinique, P. (1971). Eco-ethologie et vie sociale des prosimiens du Gabon. Biologia gabon. 7: 121-228. Charles-Dominique, P. ( 1977). Ecolog~ and hehaviour oJ nocturnal prirnofes. Prosimians oJ equatorial Wesr Africa. New
York: Columbia University Press. Clutton-Brock. T. H. & Harvey. P. H. (1977~) . Functional aspects of species dilferences in feeding and ranging behaviour
in primates. In Primufr c~c'ologj~: studies oJjreding and ranging hrhaviour in lemurs, monke-vs and apes: 557-579. Clutton-Brock, T. H. (Ed.). London: Academic Press.
Alberta, Edmonton.
Clutton-Brock. T. H. & Harvey. P. H. (19776). Primate ecology and social organi7ation. J. Zool., Lond. 183: 1-39. Coley. P. P. ( 1983). Herbivory and defence characteristics of tree species in a lowland tropical forest. Ecol. Monogr. 53:
Crook. J. H. (1970). The SOcio-tTology of primates. In Social hehaviour in hirdsundmarnmals: 103 166. Crook, J. H. (Ed.).
Crook. J. H. & Gartlan. J . S. (1966). Evolution of primate societies. Nafure, Lond. 2 1 0 1200-1203. DeVore. I. ( I 963). A comparison of the ecology and behaviour of mon keys and apes. In Clussification und human evolution:
301 -319. Washburn. S. L. (Ed.). Chicago: Aldine Publ. Co. Dunbar, R. 1. M. (1977). Feeding ecology of gelada baboons: a preliminary report. In Primate ecology: sfudies of feeding
andranging hehaviour in 1emur.s. monke1.s and upes: 251 275. Clutton-Brock. T. H. (Ed.). London: Academic Press. Eisenberg. J . F., Muckenhirn. N. A. & Rudran. R. (1972). The relation between ecology and social structure in primates.
SrienrP. Wmh. 176 863 -874. lairbanks. L. A . & Bird. J . (1978). Ecological correlates of interindividual distance in the S t . Kitts green monkey
(('rrc~)pifhrc~u.s oethiops suhueus). Primates 19: 605 614. Gartlan. J . S. (1968). Structure and function in primate society. Folia primatol. 8 89 120. Harris. R. J. ( 1975). A primer in multivuriate statisfics. London: Academic Press. Hartshorn. C i . S. (1978). The treefalls and tropical forest dynamics. In Tropicaltreesarlivingsysrems: 234-251. Doyle, J. C.
Janzen. D. H. (1970). Herbivores and the number of tree species in tropical forests. Am. Naf. 104: 501 528. Janzen. D. H. ( 1978). New horizons in the biology of plant defences. In Herbivores: their inferactions wifh secondary plant
mefaholifes: 539 566. Rosenthal. G. A. & Janzen. D. 11. (Eds). London: Academic Press. Jorde. L. 9. & Spuhler. I. N. ( 1974). A statistical analysis of selected aspexts of primate demography, ecology and social
behaviour. J. anthmp. Res. 30: 199- 224. Kano, J . (1979). A pilot study on theecology of pygmy chimpanzees Panpaniscus. In The grear apes: 123-136. Hamburg,
D. A. & McCown. E. D. (Eds). London: Benjamin/Cummings Publ. Co. Kavanagh, M. (1980). Invasion of the forest by an African savannah monkey: behavioural adaptations. Behoviour 73:
238 - 260. Klein. L. L. & Klein, D. J . (1975). Social and ccological contrasts between four taxa of neotropical primates. In
Sor-ioecolog~ andpsychology oJprimates: 59-85. Tuttle. R. 11. (Ed.). Hague & Paris: Mouton Publishers. Kummer. H. ( 1968). Social organization of /he Hamadryus baboons. Chicago: University of Chicago Press. Loizos. C. ( 1965). Play in mammals. Symp. zool. Soc. Lond. 1 8 I 9. McGuire. M. (1974). The St. Kitts green monkey. Contr. primatol. 1: 1 199. Moreno-Black, G . & Maples. W. R. (1977). Differential habitat utilimtion of four Cercopithecidae in a Kenyan forest.
Nishida, T. 1968). The social group of wild chmpawees in the Mahali mountains. Primates 9: 167 224. Sade. D. S. & Hildrech. R. W. (1965). Notes on the green monkey (Cercopithecus mfhiops sahoeus) on St. Kitts, West
Spuhler. J . N. & Jorde. L. B. (1975). Primate phylogeny, ecology and social behaviour. J. anthrop. Res. 31: 376 405. Webb. L. J.. Tracey. J. G . & Williams, W. T. (1972). Regeneration and pattern in subtropical rainforest. Ecology 60: