Q. Ji exp. Physiol. (1969) 54, 129-140 THE INFLUENCE OF LUNG SHRINKAGE ON BREATH HOLDING TIME. By S. GODFREY, R. H. T. EDWARDS and D. A. WARRELL. From the Department of Medicine, Royal Postgraduate Medical School, London. (Received for publication 13th June 1969) The influence of lung shrinkage on the breath holding time was studied in three normal males. The rate of shrinkage was increased two to three fold either by slow expiration or by reducing gas density in a hypobaric chamber. For any given lung volume the relationship between breath holding time and pCO2 was defined by a rebreathing method which allowed breath holds to be performed at progressively increasing levels of pCO2. Hypoxia was avoided throughout and the ventilatory response to CO2 remained constant irrespective of ambient pressure. The breath holding time for any given pCO2 was usually longer the larger the lung volume. Increasing the rate of lung shrinkage by either method did not alter the relationship between breath holding time and pCO2. There was no constant relationship between the pCO2 and the lung volume at the breaking point of a breath hold. These findings are discussed in the light of previous work and it is concluded that the sensation arising during breath holding cannot be fully explained in terms of any combination of pCO2, lung volume and lung shrinkage. IT is well known that the breath holding time is shorter the smaller the lung volume [Muxworthy, 1951]. It has also been shown by Mithoefer [1959] that the lung volume of a breath hold interacts with the pCO2 and PO2 to determine the breaking point under the conditions of his experiment. The range of pCO2 covered in his work was relatively small and the initial PCO2 levels apparently differed by less than 5 mm Hg. Fowler [1954] and Godfrey and Campbell [1969] have shown that it is possible to resume a breath hold by rebreathing at breaking point, even though the pCO2 was higher at the start of the resumed breath hold than at the end of the first breath hold. These experiments must cast some doubt on the apparent unique relationship between lung volume at breaking point and pCO2, and we therefore determined to explore this problem another way. During a breath hold the lungs shrink [Stevens et al., 1946] because absorption of 02 continues while the excretion of CO2 is blocked by the loss of the tension difference between mixed venous blood and alveolar gas. We have increased this shrinkage either by having our subjects slowly expire throughout the breath hold, or by conducting the experiment at lowered ambient pressure. At a lower ambient pressure gas density is reduced so that a given number of 02 molecules absorbed occupies a larger volume; CO2 excretion is blocked as before and therefore the lungs shrink faster. We have then used the rebreathing-breath holding method described in the previous paper [Godfrey and Campbell 1969], to define the relationships between breath holding time and pCO2 under conditions of normal or increased rate of shrinkage. 129
Transcript
Q. Ji exp. Physiol. (1969) 54, 129-140
THE INFLUENCE OF LUNG SHRINKAGE ON BREATH HOLDINGTIME. By S. GODFREY, R. H. T. EDWARDS and D. A. WARRELL.From the Department of Medicine, Royal Postgraduate Medical School,London.
(Received for publication 13th June 1969)
The influence of lung shrinkage on the breath holding time was studied in threenormal males. The rate of shrinkage was increased two to three fold either by slowexpiration or by reducing gas density in a hypobaric chamber. For any givenlung volume the relationship between breath holding time and pCO2 was definedby a rebreathing method which allowed breath holds to be performed at progressivelyincreasing levels of pCO2. Hypoxia was avoided throughout and the ventilatoryresponse to CO2 remained constant irrespective of ambient pressure.
The breath holding time for any given pCO2 was usually longer the larger thelung volume. Increasing the rate of lung shrinkage by either method did not alterthe relationship between breath holding time and pCO2. There was no constantrelationship between the pCO2 and the lung volume at the breaking point of a breathhold. These findings are discussed in the light of previous work and it is concludedthat the sensation arising during breath holding cannot be fully explained in termsof any combination of pCO2, lung volume and lung shrinkage.
IT is well known that the breath holding time is shorter the smaller the lungvolume [Muxworthy, 1951]. It has also been shown by Mithoefer [1959]that the lung volume of a breath hold interacts with the pCO2 and PO2to determine the breaking point under the conditions of his experiment.The range of pCO2 covered in his work was relatively small and the initialPCO2 levels apparently differed by less than 5 mm Hg. Fowler [1954] andGodfrey and Campbell [1969] have shown that it is possible to resume abreath hold by rebreathing at breaking point, even though the pCO2 washigher at the start of the resumed breath hold than at the end of the firstbreath hold. These experiments must cast some doubt on the apparentunique relationship between lung volume at breaking point and pCO2, andwe therefore determined to explore this problem another way.
During a breath hold the lungs shrink [Stevens et al., 1946] becauseabsorption of 02 continues while the excretion of CO2 is blocked by theloss of the tension difference between mixed venous blood and alveolar gas.We have increased this shrinkage either by having our subjects slowlyexpire throughout the breath hold, or by conducting the experiment atlowered ambient pressure. At a lower ambient pressure gas density isreduced so that a given number of 02 molecules absorbed occupies a largervolume; CO2 excretion is blocked as before and therefore the lungs shrinkfaster. We have then used the rebreathing-breath holding method describedin the previous paper [Godfrey and Campbell 1969], to define the relationshipsbetween breath holding time and pCO2 under conditions of normal or increasedrate of shrinkage.
129
130 Godfrey, Edwards and Warrell
METHODSThe experiments were performed in a decompression chamber at the Institute ofAviation Medicine, Royal Aircraft Establishment, Farnborough, England. Breathholding time and the ventilatory response to C02 were measured at total barometricpressures of 753 mm Hg and 380 mm Hg. This corresponds to sea level and analtitude of approximately 18,000 feet (5,500 m).
Three subjects were studied. S.G. had a good knowledge of the physiologyof breath holding, D.W. had a little knowledge and I.B. was a lay airman. Allcommunication between the observer in the chamber and those outside was bytelephone from which the subject was excluded.
The method of defining the relationship between breath holding time and PCO2was that described in the previous paper [Godfrey and Campbell, 1969]. Thesubject rebreathed a C02/02 mixture from a 6 1. bag and the initial gas compositionwas adjusted to have a PCO2 of approximately 54 mm Hg and a P02 of 290 mm Hg,irrespective of ambient pressure. This mixture ensured that rapid equilibriumwas established between mixed venous blood, alveolar gas and bag gas, and that afterrecirculation the PCO2 of the blood-lung-bag system rose at a uniform rate. The02 content of the system was sufficient to avoid hypoxia at any time during rebreathingor breath holding. Between experiments the subjects breathed from aviationmasks set to deliver gas with a P02 of 150 mm Hg irrespective of ambient pressure.Gas was sampled at the mouth for analysis by a mass spectrometer (M.S.4, AEI Ltd.)outside the chamber. It was calibrated frequently with dry gas mixtures and theactual readings were corrected for water vapour pressure. Ventilation was recordedby means of a Bernstein spirometer. All information was displayed on a Devicesthermal recorder.
Each single experiment lasted about 3 to 4 min during which time the subjectrebreathed and held his breath alternately, so that a series of breath holds wereobtained at progressively higher levels of PCO2. A graph was then constructedrelating breath holding time to pCO2. Each subject performed the experimentat both ambient pressures, the breath holds being at residual volume. Two subjectsalso performed the experiments at both altitudes holding their breath at 1.3 1. aboveresidual volume. These subjects performed an additional experiment at 753 mm Hgin which each 'breath hold' begun at 1-3 1. above residual volume consisted of aslow controlled expiration. The expiration was sufficient to keep the spirometerbell horizontal while gas was leaked from it at a rate of 380 ml. per min. Thusfor these two subjects the rate of shrinkage was increased either by lowering ambientpressure or by slow expiration.
Ventilation-CO2 response curves were obtained for each subject by the methodof Read [1967] using the same circuit.
The shrinkage of the lung-bag system was obtained from the fall in level of thespirometer each time the subject expired to residual volume during breath holdingexperiments, and by having him expire to residual volume periodically during therebreathing ventilation-CO2 response experiments. There was insufficient time,because of the adjustment required, to obtain the shrinkage directly during breathholding experiments at the larger lung volumes.
RESULTS
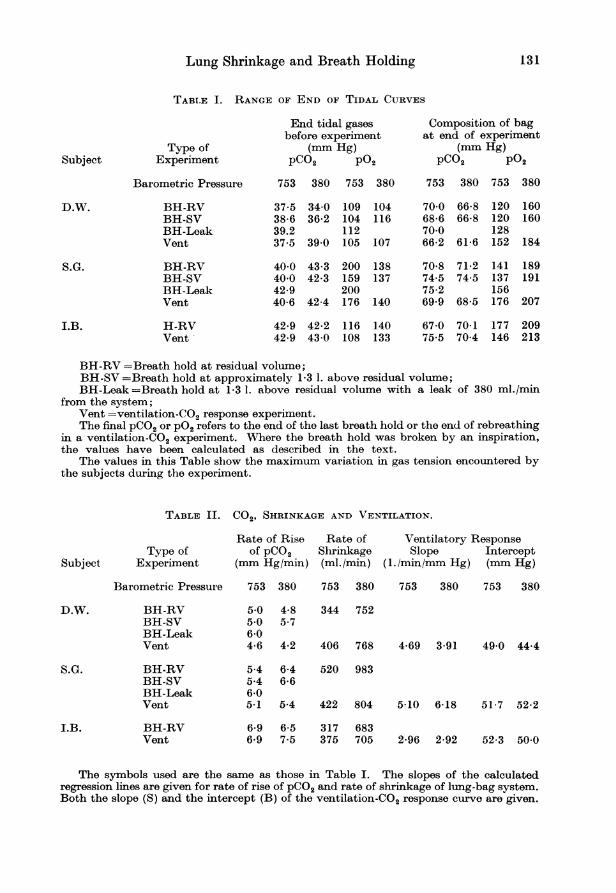
Gas mixtures; ventilatory response. -An aviation mask was used betweenexperiments and rebreathing mixtures were chosen so as to avoid hypoxiaand hyperventilation at all stages. The relatively constant end-tidal PCO2for any subject before the start of an experiment (Table I) attested the
BH-RV =Breath hold at residual volume;BH-SV =Breath hold at approximately 1-3 1. above residual volume;BH-Leak =Breath hold at 1-3 1. above residual volume with a leak of 380 ml./min
from the system;Vent =ventilation-CO2 response experiment.The final pCO2 or P02 refers to the end of the last breath hold or the end of rebreathing
in a ventilation-CO2 experiment. Where the breath hold was broken by an inspiration,the values have been calculated as described in the text.
The values in this Table show the maximum variation in gas tension encountered bythe subjects during the experiment.
The symbols used are the same as those in Table I. The slopes of the calculatedregression lines are given for rate of rise of pCO2 and rate of shrinkage of lung-bag system.Both the slope (S) and the intercept (B) of the ventilation-CO2 response curve are given.
132
-i
I-
=
I.-ui
J2
Godfrey, Edwards and Warrell
D.W. S.G.0/
/
/ /
.
0
- 0
I I I i
50 55 60Pco2 (mm.Hg.)
65 70Pco2 (mm.Hg)
i
I
19IsI
I
t
* At 753 mm.Hg.--
0 At 380 mm.Hg.100 - 1. B.
_80_-X
60
0~
O 40 _
20 _
55 60 65 70 75 80
Pco 2 (mm.Hg.)
Fig. 1. Ventilatory response to CO2 for each subject, at normal and low ambient pressure.The lines were calculated by the method of least squares. For any one subject the two linesare not significantly different.
Lung Shrinkage and Breath Holding 133
success of this control. In fact the lowest P02 recorded was 104 mm Hgand the lowest level at the end of a breath hold was 120 mm Hg (Table I).This latter value is above the threshold for a hypoxic effect on the breathholding time [Douglas and Haldane, 1909] and the vast majority of ourbreath holds ended well above this level. For those breath holds endingin an inspiration, the final P02 and pCO2 were calculated from the measuredrates of change during breath holds ending in expiration.
The rate of rise of pCO2 was calculated for all experiments in all subjects(Table II). Although there was a little inter-subject variation, for any onesubject the rate of rise of pCO2 was relatively constant and especially sofor any one type of experiment at either ambient pressure. Such differencesas occurred were not significant and would not have affected the results.The 'leak' experiment was not performed at 380 mm Hg.
In any study on breath holding in which the subject's environment ischanged it is important to ensure that the sensitivity to CO2 has not altered.The ventilatory response to CO2 by the rebreathing method was recordedin each of our subjects at both ambient pressures. The regression lines areshown in fig. 1 and the slopes and intercepts in Table II. Differencesbetween altitudes for any one subject were not significant.
Volume shrinkage and breath holding time. - During rebreathing or breathholding the volume of the bag-lung system fell. The shrinkage measuredby the spirometer for each subject is shown in fig. 2 where the lines aredrawn by eye to represent a mean rate of shrinkage at each ambient pressure.The slopes of the individual regression lines are given in Table II. Theoutstanding feature is the doubling of the shrinkage at low ambient pressure.The rate of shrinkage during the ventilatory response curve was usuallya little higher than during the breath holding response curve, possiblydue to the greater effort involved. No data are available for the shrinkageduring breath holding at the larger lung volume, but there seems little reasonto believe that the results could be very different. Indeed, from the 'open-loop' nature of the system, rebreathing could well be considered analogousto breath holding at a moderate lung volume as far as shrinkage is concerned.
The actual shrinkage during breath holding must in fact be a littlefaster than that indicated in Table II which represents combined breathholding-rebreathing shrinkages, since the lungs alone (breath holding) willhave to supply all the 02 consumed. We measured the residual volume ofD.W. in a body plethysmograph and were able then to calculate the actualrates of shrinkage during breath holding. At 380 mm Hg his actual rate ofshrinkage was 2-6 times that at 753 mm Hg. The ratio calculated from thedata in Table II is 2'2. This small difference does not affect the mainobjectives of this study.
The rate of lung shrinkage was also increased by leaking gas from thesystem, thus requiring the subject to expire throughout the breath hold.The normal shrinkage at 753 mm Hg was therefore increased by 380 ml./min.This is shown as the dotted lines in fig. 2 which lie very close to the shrinkageat the lower ambient pressure.
VOL. LIV, NO. 2. 1969 9
134 Godfrey, Edwards and Warrell
LA,1--
C/7
CX7
-J
2:
J
-I
cm
=LJ
LJ
TIME (sec.) TIME (sec.)
* Rebreathing at 753 mm.Hg.* Breath holding at 753 mm.Hg.o Rebreathing at 380 mm.Hg.o Breath holding at 380 mm. Hg.+ Breath holding at 753 mm. Hg.
with leak from system
100 150TIME (sec.)
250
Fig. 2. Loss of volume from the lung-bag system during simple rebreathing or alternatingrebreathing and breath holding, at normal and low ambient pressure. For simplicity one
solid line was drawn by eye through all points for any one pressure. The dashed lines representthe shrinkage when voluntary expiration at a rate of 380 ml./min was added at 758 mm Hg.Both lowering ambient pressure and voluntary expiration increased shrinkage by some 2-2times.
Lung Shrinkage and Breath Holding 135
70rK D.W. S. G.
60 -
(-@3
LUJ
~--
cJ==
LA
co
50 -
'40 _
30 -
20 _
10 -
n It- I I I rlI..v. _-i 145 50 55 60 65 50 55a
60 65Pco2 (mm.Hg.)
70Pco2 (mm.Hg.)
I. B. * Breath holding at 753 mm.Hg.O Breath holding at 380 mm.Hg.
CD)u-CL.j
-j
LUJ
m
30-
20k
10
n I I I I11 L- Iu .
%55 60 65 70 75Pco2 (mm.Hg.)
Fig. 3. Breath holding time at residual volume is plotted against PCO2 at the start ofthe breath hold. The results for each subject at each ambient pressure are given.There is no consistent difference between the two lines for any one subject.
136 Godfrey, Edwards and Warrell
The breath holding time for each subject was found to depend uponthe pCO2 whether measured at the beginning or the end of the breath hold.The higher the pCO2 the shorter the breath holding time, the actual timevarying from subject to subject. Either value of pCO2 could be used forconstructing breath holding-CO2 response curves, but we have chosen to usethe initial pCO2 because the final pCO2 depends upon the initial pCO2 and
B00 O.W. S.G.
70-
60 \ Breath holdat 753mm.Hg.
50\\\\\o0 Breath hold@50 \ \\ - \\\ at 380mm.Hg.
\i\\a\ \\* Breath hold_ 0 p \ p \ X \> at 753 mm.Hg.40 l with leak
C= 30
~20-
10
I I I I I5 50 55 60 65 55 60 65 70 75INITIAL Pco2 (mm. Hg.)
Fig. 4. Breath holding time at 1-3 1. above residual volume is plotted against pCO2 atthe start of the breath hold. The lines represent experiments with a normal rate of lungshrinkage at 758 mm Hg and with a two- to three-fold increase in shrinkage produced by(a) voluntary expiration throughout the breath hold, and (b) by lowering ambientpressureto 380 mm Hg. There is no consistent difference in the lines for any one subject.
the breath holding time is therefore a dependent variable [Godfrey andCampbell, 1968]. For breath holds begun at residual volume, the breathholding time at any given pCO2 was little changed by ambient pressure(fig. 3) and hence by rate of lung shrinkage. The breath holding time atlow ambient pressure was actually slightly higher in two subjects, one ofwhom was entirely unaware of the significance of the result. All threesubjects noted a crushing sensation in the chest as the lungs contractedbelow residual volume, especially at low ambient pressure.
In a similar way, the duration of breath holds begun 13 1. above residualvolume was not consistently affected by an increased rate of shrinkage,whether produced by slow expiration or by low ambient pressure (fig. 4).
In the past a good deal of attention has been given to the relationship
Lung Shrinkage and Breath Holding 137
between breaking point pCO2 and breaking point lung volume [Mithoefer,1959]. We have been able to calculate the whole volume/pCO2 history ofthe breath holds for one of our subjects (S.G.) whose residual volume wasmeasured in a body plethysmograph. By choosing breath holds begun atdifferent lung volumes and different levels of PCO2 (from the curves shown infigs. 3 and 4) and from the rate of rise of pCO2 and rate of shrinkage (Table II)
S.G. A- 753 mm.Hg.° 4 - 380 mm. Hg.
75 -A,
70
E 65 *
E
60 _
55 (D
507 I l10 15 2-0 2-5 30 3-5
LUNG VOLUME (l. BIPS.)Fig. 5. The changes in lung volume and PCO2during the course of a series of breath holds areshown for one subject (S.G.) at both ambientpressures. The arrows indicate the direction ofchange between the points representing the startand breaking point of selected breath holds. Itcan be seen that there is no constant relationshipbetween the breaking point PCO2 and lungvolume. The implications of this observationwith reference to the labelled breath holds arediscussed in the text.
the plots shown in fig. 5 were obtained. Each line joins the initial volume/PCO2 point to the final volume/pCO2 point for a single breath hold, the arrowindicating the direction of change. The point of this plot is to show thatthere is no constant relationship between breaking point volume and pCO2provided that a sufficiently wide range of initial values is used. Thuswhile a comparison of breath holds A with B or C suggests that the largerthe final volumes the higher the final pCO2, a comparison between C and Bshows that the final volume may be smaller and yet the final pCO2 may behigher. It can also be seen that it was possible to begin breath hold C at ahigher pCO2 and smaller volume than existed at the breaking point of B.A period of rebreathing, which enables a sufficiently wide range of PCO2to be studied, totally disproves any constant relationship between finalvolume and pCO2.
138 Godfrey, Edwards and Warrell
DIscusSION
In any experiment on breath holding it is important to consider the questionof individual variability and the nature of the sensation generated. Althoughwe only used three subjects, each served as his own control, and each breathholding-CO2 response curve was based on three or more breath holds. Wehave found that the relationship between breath holding time and initialPCO2 remains very constant for any one subject, with a coefficient of variationfor the slope of 8-6 per cent and for the intercept of 2-8 per cent [Godfreyand Campbell, 1969]. The data on which these calculations were based,were obtained on one of the subjects (D.W.) of the present study. Underthese circumstances, we believe it is reasonable to accept the similarityof the curves under different conditions of shrinkage as meaning that therate of shrinkage does not significantly affect the breath holding time.
The simplest method of increasing lung shrinkage is to expire slowlyduring the breath hold. However, during slow expiration the respiratorymuscles are active and alveolar pressure nearly atmospheric, while duringbreath holding the activity of the muscles is intermittent and the alveolarpressure varies. Because of the known effect of voluntary movements suchas swallowing (which we allowed) on breath holding, it is obviously importantto confirm that voluntary expiration does not act similarly. The onlymethod by which lung shrinkage can be increased under otherwise identicalconditions is by lowering ambient pressure.
Most previous studies at high altitude have been done under hypoxicconditions so that the pCO2 was lowered by hyperventilation. Acclimatisa-tion caused subsequent changes in C02 sensitivity [Otis et al., 1948; Severing-haus et al., 1963]. In one subject studied by Otis et al., [1948], theycommented that the breath holding time was not shortened by acute exposureto low ambient pressure while breathing 02- We were careful to avoid levelsof P02 likely to affect our experiments.
The experiments described here, in the previous paper [Godfrey andCampbell, 1969] and by Fowler [1954] all argue against specific chemical orlung volume thresholds for the breaking point of breath holding, or anyconstant relationship between final pCO2 and volume. The earlier findingof such a relationship [Mithoefer, 1959] can be explained by the fact thatall his breath holds were begun at approximately the same pCO2 and with alarger lung volume the breath holding time increased and hence the finalpCO2 was higher. The effect of hyperventilation [Mithoefer, 1959] wasto prolong breath holding time but not apparently to affect the relationshipbetween final pCO2 and volume, although the actual figures were not given.Hyperventilation lowers the initial pCO2, so that the rise in pCO2 duringthe breath hold only brings the final pCO2 up to relatively low levels, butduring the prolonged breath hold the lungs shrink to a relatively smallvolume. This means that the relatively low final pCO2 will correlate withthe relatively small lung volume, and both values might well fit on a 'normal'curve.
Lung Shrinkage and Breath Holding 139
Although we did not systematically investigate the effect of lung volumeon breath holding time, it can be seen from figs. 3 and 4 that the breathholding time for any given pCO2 was always longer at the larger lung volumefor S.G. and usually larger for D.W. Muxworthy [1951] studied this subjectusing a wide range of volumes and showed a nearly linear relationship.The greatest increase in shrinkage over control shrinkages in our experimentswas of the order of 300 400 ml. (for a breath hold lasting one minute).This is very small compared with the difference in volume of some 2000 ml.needed by subject S.G. to prolong his breath holding time in the experimentsat different volumes. D.W. was even less sensitive to the static volumeeffect. This argument suggests that the absolute shrinkage during a breathhold can hardly be expected to be large enough to influence holding time.This was found by Mithoefer [1959] in his breath holding experiment afterhyperventilation; in this breath hold the amount of shrinkage was large,yet the breath holding time was long.
We have been able to show that breath holding is affected by neitherthe magnitude nor the rate of shrinkage (which was unchanged in Mithoefer'sexperiment). This makes it very unlikely that the prolongation of breathholding time by vagal blockade [Guz et at., 1966] can be due to the removalof impulses from deflation receptors. The explanation remains obscure.
We conclude that large changes in lung volume and moderate changesin pCO2 do affect the breath holding time, but the magnitude and rate oflung shrinkage do not. No constant pCO2 or lung volume is found atbreaking point, and almost any combination of pCO2 and volume can beproduced by suitable manoeuvres.
ACKNOWLEDGEMENTS
We are grateful to Wing Commander J. Ernsting and the Ministry of Defence forpermitting us to use the altitude chamber at Farnborough. We thank Mr. W. J.Tonkins and Corporal R. Russel for their help in running the experiments, andJunior Technician I. E. Butcher for volunteering to be one of our subjects. We alsothank Dr. E. J. M. Campbell for his help in the preparation of this paper.
R.H.T.E. was supported from a grant by the Medical Research Council.
REFERENCES
DOUGLAS, J. G., and HALDANE, J. S. (1909). 'The regulation of normal breathing',J. Physiol. (Lond.), 38, 420-440.
FOWLER, W. S. (1954). 'Breaking point of breath holding', J. appi. Physiol., 6, 539-545.GODFREY, S., and CAMPBELL, E. J. M. (1968). 'The control of breath holding', Re&sp.
Physiol., 5, 385-400.GODFREY, S., and CAMPBELL, E. J. M. (1969). 'Mechanical and chemical control of
Guz, A., NOBLE, M. I. M., WIDDICOMBE, J. G., TRENCHARD, D., MusHIN, W. W., andMAKEY, A. R. (1966). 'The role of vagal and glossopharyngeal afferent nerves inrespiratory sensation, control of breathing and arterial pressure regulation in consciousman', Clin. Sci., 30, 161-170.
MITHOEFER, J. C. (1959). 'Mechanisms of pulmonary gas exchange and CO2 transportduring breath holding', J. appl. Physiol., 14, 701-705.
MUXWORTHY, J. F., (1951). 'Breath holding studies: Relationship to lung volume',A. F. Tech. Rep. 6528, 452-456. Wright-Patterson Air Force Base, Dayton, Ohio.
OTIS, A. B., RARN, H., and FENN, W. 0. (1948). 'Alveolar gas exchange during breathholding', Am. J. Physiol., 152, 674-686.
READ, D. J. C. (1967). 'A clinical method for assessing the ventilatory response tocarbon dioxide', Aust. Ann. Med., 16, 20-32.
SEVERINGHAUS, J. W., MITCHELL, R. A., RICHARDSON, B. W., and SINGER, M. (1963).'Respiratory control at high altitude suggesting active transport regulation ofC.S.F. pH', J. appl. Physiol., 18, 1155-1166.
STEVENS, C. D., FERRIS, E. B., WEBB, J. P., ENGEL, G. L., and LOGAN, M. (1946).Voluntary breath holding: 1. 'Pulmonary gas exchange during breath holding',J. Clin. Invest., 25, 723-728.