Presented at Brimstone Sulfur Conference – 2014 – Vienna The influence of mass transfer model parameters in CO 2 and H 2 S gas treating processes A.R.J. Arendsen 1 , P.J.G. Huttenhuis 1 , G.F. Versteeg 1 , R. Cota 2, G. Jacobs 3 , M. Manzulli 2 and M.A. Satyro 2 1) Procede Gas Treating B.V., P.O. Box. 328, 7500 AH Enschede, the Netherlands 2) Virtual Materials Group, Inc.#222, 1829 Ranchlands Blvd N.W., Calgary AB Canada T3G 2A7 3) Virtual Materials Group USA, Inc. 17171 Park Row Drive, Suite 273, Houston, TX 77084, USA Abstract The ever growing importance of chemically based separation processes for gas treatment and green house gases emmission control underline the importance of proper modeling of coupled mass transfer and chemical reaction kinetics in multiphase systems. The development of sound simulation models reside on algorithms that take into account the these phenomena in a rigorous and consistent manner. Moreover, in chemically reactive, mass transfer controlled phenomena, the correct description of vapor-liquid and liquid phase chemical equilibrium, including proper chemical speciation is very important. Thermodynamics are used for the calculation of the overall driving force for mass transfer as well as for the correct ionic compositions at equilibrium, necessary for the determination of meaningful reaction rates. Although multiple possible reaction sets can be proposed that will essentially provide the same equilibrium solution with respect to acid gas partial pressure, it is necessary to construct physically meaningful reaction sets that provide correct liquid compositions for reaction rate calculations. Details related to the construction of empirically determined mass transfer models are important since the interactions between their different governing equations and equation parameters are not always intuitive. Chemically reactive systems require the measurement of gas and liquid phase mass transfer coefficients together with specific interfacial mass transfer areas while physical separation processes require only the mass transfer and interfacial area products. Therefore understanding how these parameters collectively affect the calculated results from the mass transfer model is an important part of the training required by a process engineer to become proficient in using this type of technology and consequently realize the full benefits this technology provides. Quality experimental data used to determine these parameters is scarce and a discussion on how this type of data should be collected and incorporated into a simulation model will be presented, together with examples on how correct values of mass transfer and specific areas are not enough to provide meaningful values for process performance or for process design. Three case studies related to the capture of CO 2 and H 2 S are presented stressing some non-intuitive simulated performance in natural gas processing and carbon capture plants.
Transcript
Presented at Brimstone Sulfur Conference – 2014 – Vienna
The influence of mass transfer model parameters in
R. Cota 2, G. Jacobs3, M. Manzulli2 and M.A. Satyro2
1) Procede Gas Treating B.V., P.O. Box. 328, 7500 AH Enschede, the Netherlands 2) Virtual Materials Group, Inc.#222, 1829 Ranchlands Blvd N.W., Calgary AB Canada T3G 2A7 3) Virtual Materials Group USA, Inc. 17171 Park Row Drive, Suite 273, Houston, TX 77084, USA
Abstract The ever growing importance of chemically based separation processes for gas treatment and green house gases emmission control underline the importance of proper modeling of coupled mass transfer and chemical reaction kinetics in multiphase systems. The development of sound simulation models reside on algorithms that take into account the these phenomena in a rigorous and consistent manner. Moreover, in chemically reactive, mass transfer controlled phenomena, the correct description of vapor-liquid and liquid phase chemical equilibrium, including proper chemical speciation is very important. Thermodynamics are used for the calculation of the overall driving force for mass transfer as well as for the correct ionic compositions at equilibrium, necessary for the determination of meaningful reaction rates. Although multiple possible reaction sets can be proposed that will essentially provide the same equilibrium solution with respect to acid gas partial pressure, it is necessary to construct physically meaningful reaction sets that provide correct liquid compositions for reaction rate calculations. Details related to the construction of empirically determined mass transfer models are important since the interactions between their different governing equations and equation parameters are not always intuitive. Chemically reactive systems require the measurement of gas and liquid phase mass transfer coefficients together with specific interfacial mass transfer areas while physical separation processes require only the mass transfer and interfacial area products. Therefore understanding how these parameters collectively affect the calculated results from the mass transfer model is an important part of the training required by a process engineer to become proficient in using this type of technology and consequently realize the full benefits this technology provides. Quality experimental data used to determine these parameters is scarce and a discussion on how this type of data should be collected and incorporated into a simulation model will be presented, together with examples on how correct values of mass transfer and specific areas are not enough to provide meaningful values for process performance or for process design. Three case studies related to the capture of CO2 and H2S are presented stressing some non-intuitive simulated performance in natural gas processing and carbon capture plants.
1. Introduction The design of absorption processes based on complex aqueous chemical reactions such as CO2-capture, selective H2S-removal as well as rate limited physical separations like LNG pre-treatment are neither simple nor straightforward. Reaction kinetics, mass transfer rates and thermodynamics are coupled and their effects must be taken into account simultaneously. The development of sound simulation models reside on algorithms that take into account the aforementioned phenomena in a rigorous and consistent manner. Moreover, in chemically reactive, mass transfer controlled phenomena, the correct description of vapor-liquid and liquid phase chemical equilibrium, including proper ion speciation, is very important. How the mass transfer parameters collectively affect the results is an important part of the training required by a process engineer to become proficient in using this type of technology as provided in process simulators and consequently realize the full benefits this technology provides. Quality experimental information used to determine these parameters is scarce and a discussion on how this type of data should be collected and incorporated into a simulation model will be presented, together with examples on how correct values of mass transfer and specific areas are not enough to provide meaningful values for process performance simulation or for process design. Three case studies related to the capture of CO2 and H2S are presented stressing some non-intuitive simulated performance in natural gas processing and carbon capture plants. These cases will highlight the importance of a proper integration of thermodynamics, mass transfer and chemical kinetic models together with quality experimental data. The simulations are performed with a new flowsheeting tool, VMGRateBase. 2. VMGRateBase Virtual Materials Group in partnership with Procede Process Simulations developed a new flowsheeting tool, VMGRateBase, specifically designed for steady-state simulations of acid gas treating processes. This tool builds on previously developed gas treating technology from Procede, extensively used for CO2 capture process design and was originally called the Procede Process Simulator (PPS) [1]. The process models include all features relevant for the design, optimization and analysis of acid gas treating processes, including post-combustion and pre-combustion carbon dioxide capture. The simulator consists of a user-friendly graphical user interface and a powerful numerical solver that handles the rigorous simultaneous solution of thermodynamics, kinetics and mass transfer equations (this combination usually called a “rate-based” model). VMGRateBase also supports the main unit operations relevant for gas treating plants such as absorbers, strippers, flash drums, heaters, pumps, compressors, mixers and splitters as well as work flow tools such as automatic water and solvent makeup calculators. VMGRateBase has been extensively validated and used for several carbon capture projects [2, 3, 4]. A thorough and systematic comparison between the equilibrium based and rate based modeling approaches using the absorption of CO2 from flue gas produced by a coal-fired power plant into an aqueous MEA solution and for the selective removal of H2S from CO2 containing natural gas streams using an aqueous MDEA solution were presented in [5] and [6], respectively.
Presented at Brimstone Sulfur Conference – 2014 – Vienna
The program includes an extensive, carefully evaluated database of thermodynamic model parameters, binary interaction parameters, kinetics constants, chemical equilibrium constants, diffusivities and other required physical properties. The physical property models parameters were optimized to accurately predict the vapor-liquid equilibria (VLE), thermodynamic and physical properties and the kinetically enhanced mass transfer behavior of acid gases in amine based capturing processes. Several models for hydrodynamics and mass transfer such as the Higbie penetration model [7], are available. Thermodynamic equilibrium data was collected and carefully screened to cover the industrial ranges of interest (0 to 150°C and acid gas partial pressures from 10 Pa to 100 bar). The quality of the thermodynamic model is illustrated in figures 1 and 2. The thermodynamic model combines consistent liquid activity coefficient models derived from a Gibbs excess function with the necessary modifications to handle ions in aqueous solutions with a cubic equation of state for the gas phase. The program also includes an extensive database of various tray types, as well as a large collection of both random and structured packing data. Several mass transfer and hydrodynamic models were implemented that benefit from accurate physical property models for density, viscosity, surface tension, diffusivity and thermal conductivity specifically selected and validated for acid gas treating applications. This attention to detail allowed for the construction of a simulator able to describe complete acid gas treating processes, including complex processes with multiple (mixed or hybrid) solvent loops. This provides significant understanding of the performance of potential new solvents current operations and a rich environment to better understand and eventually optimize current operations as well as an useful tool to debug existing processes.
Figure 1: Partial Pressure of CO2 over solutions of MDEA at 40°C
Figure 2: Partial pressure of H2S over solutions of MDEA at 40°C
Presented at Brimstone Sulfur Conference – 2014 – Vienna
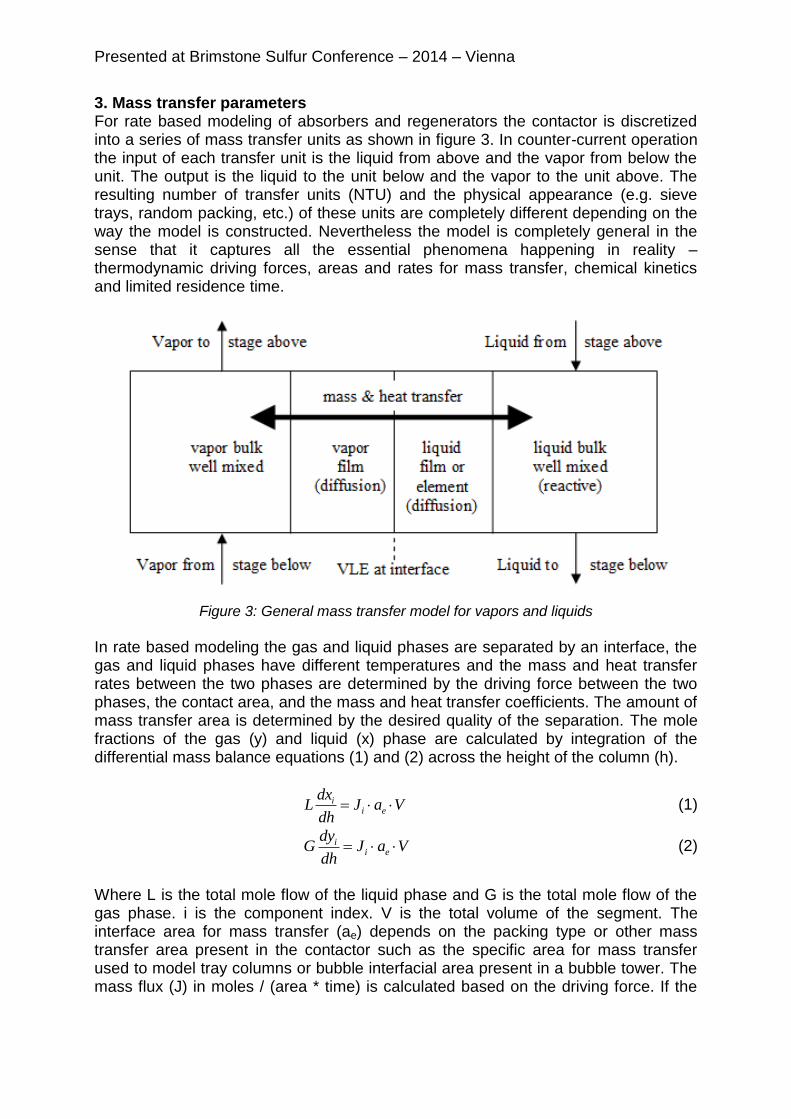
3. Mass transfer parameters For rate based modeling of absorbers and regenerators the contactor is discretized into a series of mass transfer units as shown in figure 3. In counter-current operation the input of each transfer unit is the liquid from above and the vapor from below the unit. The output is the liquid to the unit below and the vapor to the unit above. The resulting number of transfer units (NTU) and the physical appearance (e.g. sieve trays, random packing, etc.) of these units are completely different depending on the way the model is constructed. Nevertheless the model is completely general in the sense that it captures all the essential phenomena happening in reality – thermodynamic driving forces, areas and rates for mass transfer, chemical kinetics and limited residence time.
Figure 3: General mass transfer model for vapors and liquids
In rate based modeling the gas and liquid phases are separated by an interface, the gas and liquid phases have different temperatures and the mass and heat transfer rates between the two phases are determined by the driving force between the two phases, the contact area, and the mass and heat transfer coefficients. The amount of mass transfer area is determined by the desired quality of the separation. The mole fractions of the gas (y) and liquid (x) phase are calculated by integration of the differential mass balance equations (1) and (2) across the height of the column (h).
VaJdh
dxL ei
i (1)
VaJdh
dyG ei
i (2)
Where L is the total mole flow of the liquid phase and G is the total mole flow of the gas phase. i is the component index. V is the total volume of the segment. The interface area for mass transfer (ae) depends on the packing type or other mass transfer area present in the contactor such as the specific area for mass transfer used to model tray columns or bubble interfacial area present in a bubble tower. The mass flux (J) in moles / (area * time) is calculated based on the driving force. If the
driving force is defined as the concentration difference between the gas and liquid phase the flux is expressed as in equation 3.
i
iLiGiovi
m
xykJ
, (3)
Where m is the distribution coefficient based on the ratio of liquid and gas concentrations. If the integration of this set of equations is done numerically the height of one transfer unit depends on the numerical discretization used for integration. In the case of a packed column, with negligible axial dispersion, the NTU is set at a value that results in plug flow. In case of trays, with the assumption that at each tray the liquid and gas phase are ideally mixed, the NTU can be set equal to the number of trays. This results in less plug flow due to axial dispersion. It should be noticed that in this way the axial dispersion is described by ideally mixed contactors in series. In case of chemical absorption and the driving force is concentration based, the overall mass transfer coefficient kov is a function of the mass transfer coefficient of the gas phase (kG) and liquid phase (kL), the distribution coefficient based on concentrations (m). EA is the enhancement factor, which is the ratio of the flux with reaction and the flux without reaction at identical driving forces. For non-reactive systems the enhancement factor is by definition equal to one.
iaiLiiGiov Ekmkk ,,,,
111
(4)
Details related to the construction of empirically determined mass transfer parameters are important since the interactions between their different governing equations and equation parameters are not always intuitive. For example, in physical separation processes only the product of mass transfer coefficient and specific interfacial area for the gas and liquid mass transfer is required (kGae and kLae). For chemically reactive, mass transfer limited separation processes the individual values of mass transfer coefficients and specific mass transfer areas (kG, kL, ae) are required for the gas and liquid phases. A significant amount of experimental studies related to predict these mass transfer parameters in absorption columns have been carried out. From these studies several empirical or semi-empirical correlations are derived by regression of the correlations with the experimental (pilot) data or correlations are derived from theoretical hydraulic models. In general overall or volumetric mass transfer coefficients are determined from these experiments; however, a distinction between mass transfer coefficient (kL and kG) and effective interfacial area (ae) is basically not possible. For non-reactive processes, however, the distinction between these two parameters is not very relevant, because the product of these parameters determines the overall absorption rate. Contrary to gas-treating processes, where chemical solvents are used, both parameters must be known individually as will be shown in this paper. For chemically driven gas absorption the most important parameter is the effective interfacial area (ae). There are several definitions available to define the interfacial
Presented at Brimstone Sulfur Conference – 2014 – Vienna
mass transfer area in packed columns, for example geometric area, wetted area, effective area. If for example part of the liquid is not renewed on the packing material, the packing is wetted, but the wetted area is not the effective for mass transfer. Bravo and Fair [8] investigated that the effective area is not only determined by the wetted area, but also mist, gas bubbles, ripples and the column wall can contribute to the overall mass transfer rate. All these effects are dependent on the packing material and process conditions and will influence the column performance. Therefore, they should be determined as accurate as possible based on experiment. The first attempts to determine correlations for the calculation of effective area were based on studies to liquid flow profiles and distribution such as the Shetty and Cerro [9] model. They studied flow patterns and velocity profiles of thin, viscous liquid over surfaces at different angles and derived liquid hold-up and wetted area from this information. Penetration theory [7] was used to derive the mass transfer correlations. The individual contributions of kL and ae are derived form an overall kLae and are therefore a function of the procedure used by Shetty and Cerro [9]. Bravo et al. [10] measured the mass transfer in finely woven gauze packing material for systems like xylene and ethyl benzene/styrene desorption from water. However, from these experiments only the volumetric mass transfer coefficients, kLae and kGae, can be measured. Therefore the derived correlations for ae, kL and kG are dependent on how Bravo et al. [10] defined the contributions from individual parameters. Bravo et al. [10] assumed that the gauze packing was completely wetted during the experiments and therefore the effective area was set equal to the geometric area. In later work of these authors introduced correction to account for lower values of ae for the various packing material. It must be noted that these correlations are still used by many process engineers at the moment. Billet and Schultes [11] derived a theoretical expression to calculate the liquid hold-up in non-reacting systems. By incorporating the penetration theory both gas and liquid side mass transfer coefficients were calculated theoretically from this expression. The interfacial area was determined from experimental studies using 70 different packing elements, different packing material and 30 different chemical systems. From these studies the volumetric mass transfer coefficients were determined and with the already determined kL and kG from the liquid hold-up, the effective interfacial area was calculated. Another commonly used model, i.e. the Delft model, was developed by Olujic et al. [12] for corrugated packing. In this model the liquid flow is considered as a thin liquid film of uniform thickness, while the gas flow is traveling in a zig-zag profile through the packing. The kG is calculated from Sherwood numbers, while kL is calculated via the penetration theory. For the calculation of the effective interfacial area, it is assumed that the liquid is completely distributed. 4. Simulations A systematic comparison between non-reactive and reactive processes characteristics will now be presented using the removal of CO2 and H2S from natural gas streams with aqueous solutions of MDEA. MDEA is mostly used for the selective removal of H2S from natural gas.
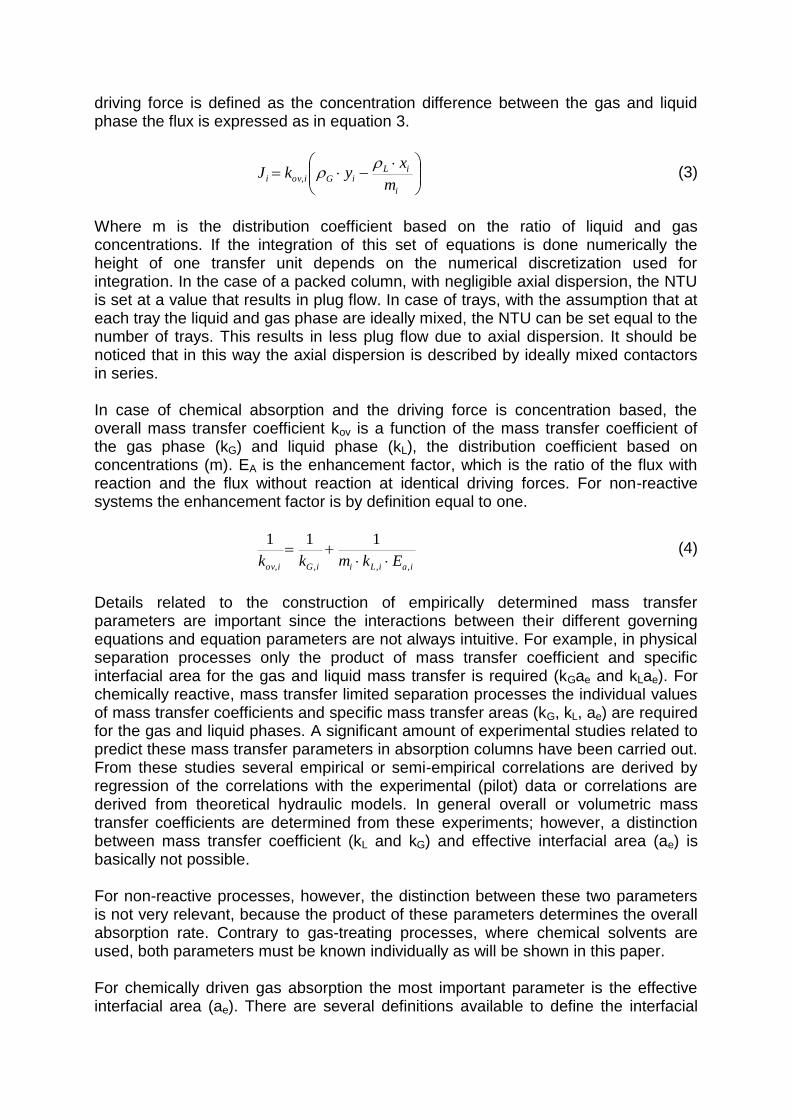
The conditions are given in Table 1 to 4 for three different cases. Under these conditions the kL and ae are varied simultaneously and the acid gas capture for non-reactive and reactive absorption is calculated. The non-reactive absorption is simulated via physical absorption at identical process conditions as for the reactive absorption. The value of kG is set at 0.003 m/s, based on the correlation of Bravo et al [10], for all simulations. Neither packing type, nor correlations are selected because ae and kL are set at specific values. The values of kL are based on the same correlation and varied with a factor 100 in this range. The variation of ae is based on variation of specific area for commercially available packing’s and possible variation in the wetting of the packing.
Table 1: Gas and liquid input parameters for Case 1
Gas Liquid
Pressure 70 bara 70 bara Temperature 40 °C 40 °C Flow rate 200,000 Nm3/hr 3,960 m3/hr CO2 15 vol% 0.02 mol CO2 / mol MDEA CH4 85 vol% - H2O 100 %Saturation 50 wt% (fresh solvent) MDEA 50 wt% (fresh solvent)
Table 2: Absorber input parameters for Case 1
Packing Depth 30 m Column Diameter 4 m kG 0.003 m/s
Table 3: Gas and liquid input parameters for Case 2 and 3
Gas Liquid (Case 2) Liquid (Case 3)
Pressure 70 bara 70 bara 70 bara Temperature 40 °C 40 °C 40 °C Flow rate 200,000 Nm3/hr 3,960 m3/hr 3,960 m3/hr H2S 15 vol% 0.01 mol H2S/ mol
Table 4: Absorber input parameters for Case 2 and 3
Packing Depth 5 m Column Diameter 4 m kG 0.003 m/s
The results of the various simulations will be discussed in the next paragraphs.
4.1 Results Case 1 (CO2 Capture) Figure 3 and 4 show the results of the calculated capture for non-reactive and reactive absorption. The capture is defined as the ratio of the amount of captured CO2 and the amount of CO2 in the inlet. The lines represent constant capture
Presented at Brimstone Sulfur Conference – 2014 – Vienna
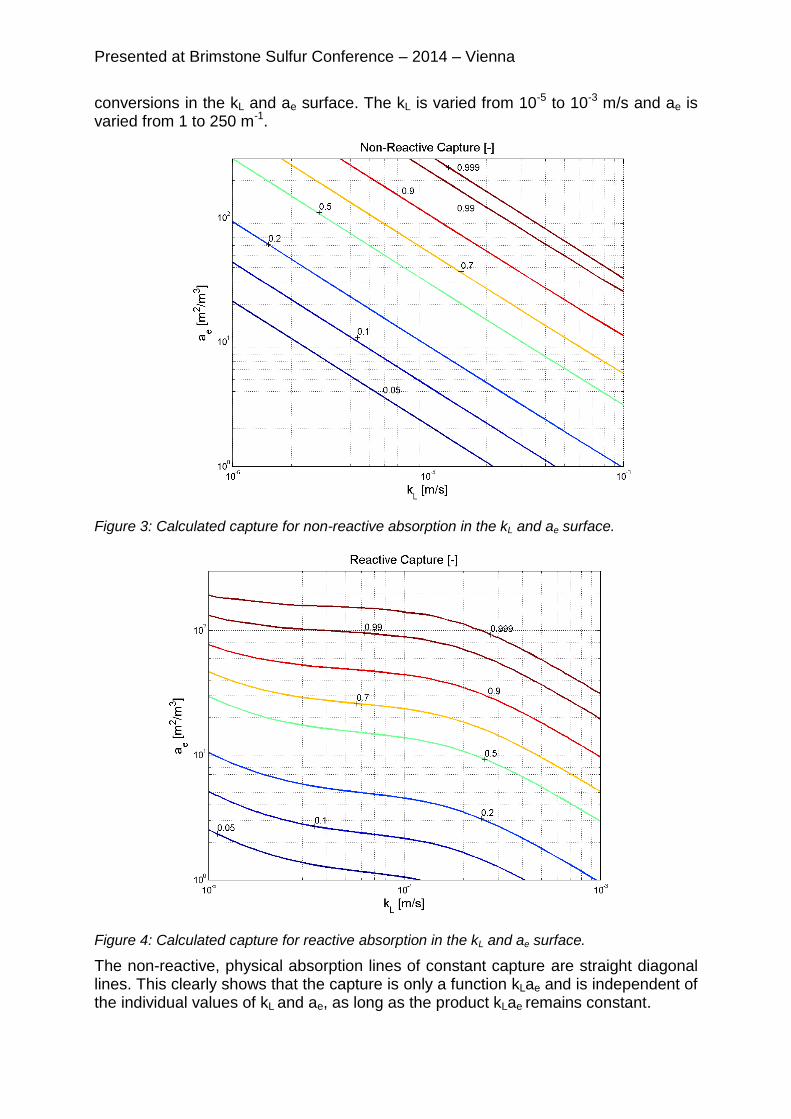
conversions in the kL and ae surface. The kL is varied from 10-5 to 10-3 m/s and ae is varied from 1 to 250 m-1.
Figure 3: Calculated capture for non-reactive absorption in the kL and ae surface.
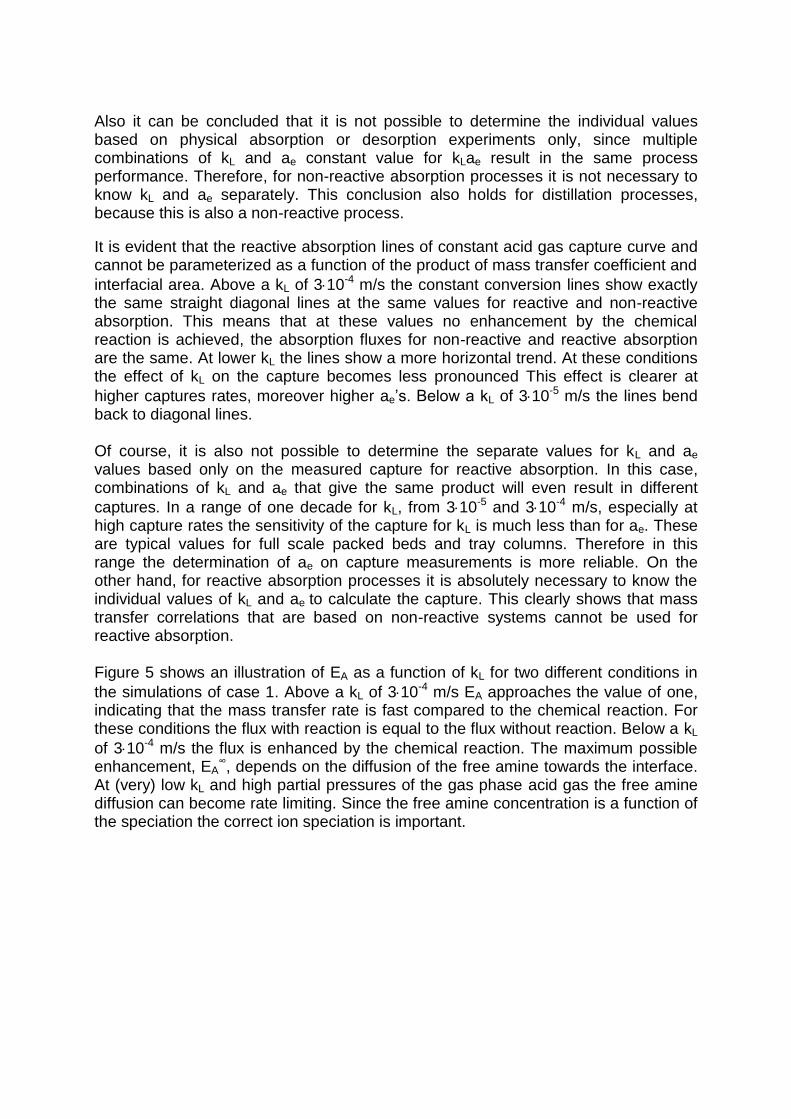
Figure 4: Calculated capture for reactive absorption in the kL and ae surface.
The non-reactive, physical absorption lines of constant capture are straight diagonal lines. This clearly shows that the capture is only a function kLae and is independent of the individual values of kL and ae, as long as the product kLae remains constant.
Also it can be concluded that it is not possible to determine the individual values based on physical absorption or desorption experiments only, since multiple combinations of kL and ae constant value for kLae result in the same process performance. Therefore, for non-reactive absorption processes it is not necessary to know kL and ae separately. This conclusion also holds for distillation processes, because this is also a non-reactive process.
It is evident that the reactive absorption lines of constant acid gas capture curve and cannot be parameterized as a function of the product of mass transfer coefficient and
interfacial area. Above a kL of 310-4 m/s the constant conversion lines show exactly the same straight diagonal lines at the same values for reactive and non-reactive absorption. This means that at these values no enhancement by the chemical reaction is achieved, the absorption fluxes for non-reactive and reactive absorption are the same. At lower kL the lines show a more horizontal trend. At these conditions the effect of kL on the capture becomes less pronounced This effect is clearer at
higher captures rates, moreover higher ae’s. Below a kL of 310-5 m/s the lines bend back to diagonal lines. Of course, it is also not possible to determine the separate values for kL and ae values based only on the measured capture for reactive absorption. In this case, combinations of kL and ae that give the same product will even result in different
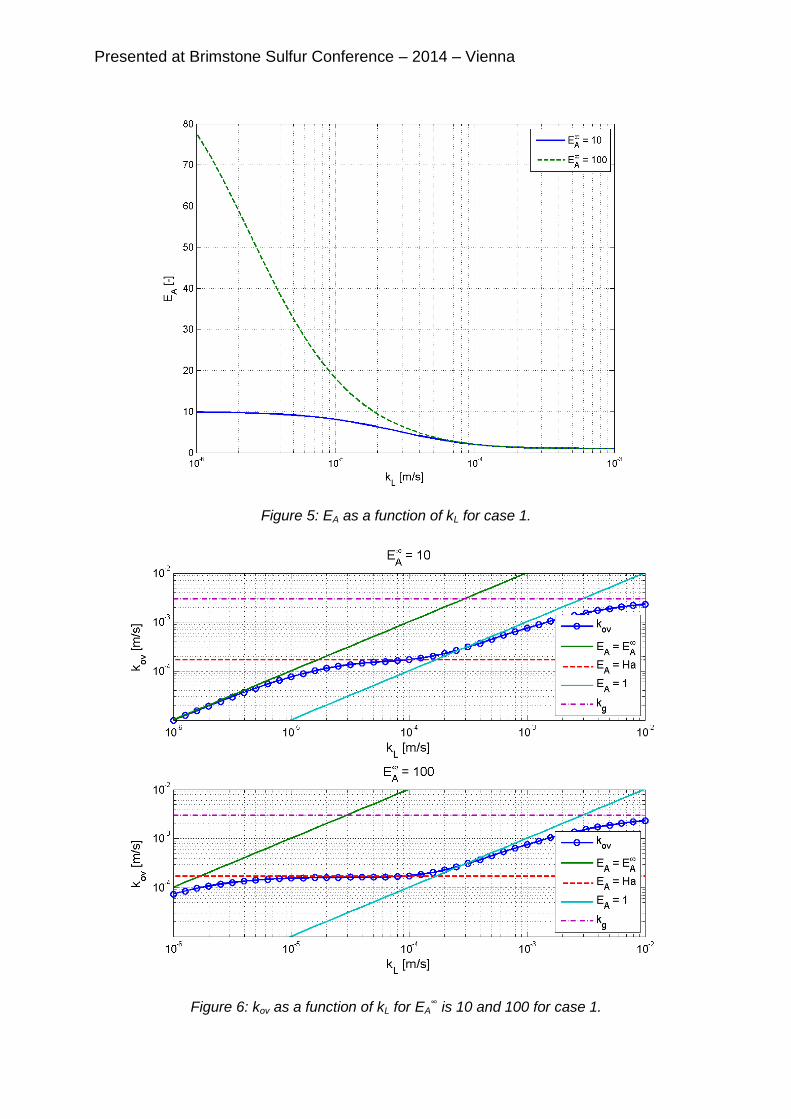
captures. In a range of one decade for kL, from 310-5 and 310-4 m/s, especially at high capture rates the sensitivity of the capture for kL is much less than for ae. These are typical values for full scale packed beds and tray columns. Therefore in this range the determination of ae on capture measurements is more reliable. On the other hand, for reactive absorption processes it is absolutely necessary to know the individual values of kL and ae to calculate the capture. This clearly shows that mass transfer correlations that are based on non-reactive systems cannot be used for reactive absorption. Figure 5 shows an illustration of EA as a function of kL for two different conditions in
the simulations of case 1. Above a kL of 310-4 m/s EA approaches the value of one, indicating that the mass transfer rate is fast compared to the chemical reaction. For these conditions the flux with reaction is equal to the flux without reaction. Below a kL
of 310-4 m/s the flux is enhanced by the chemical reaction. The maximum possible enhancement, EA
∞, depends on the diffusion of the free amine towards the interface. At (very) low kL and high partial pressures of the gas phase acid gas the free amine diffusion can become rate limiting. Since the free amine concentration is a function of the speciation the correct ion speciation is important.
Presented at Brimstone Sulfur Conference – 2014 – Vienna
Figure 5: EA as a function of kL for case 1.
Figure 6: kov as a function of kL for EA∞ is 10 and 100 for case 1.
Figure 6 shows kov as a function of kL for two different EA∞’s. Around a kL of 10-2 m/s
the mass transfer is almost completely gas phase limited. kov will never exceed kG.
Above a kL of 210-4 m/s the dotted line for kov approaches the EA=1 line. These lines correspond to the straight diagonals in figure 4 for reactive and non-reactive
absorption. Below a kL of 210-4 m/s kov approaches the EA=Ha line. In this case kov becomes almost independent of kL, because nearly all CO2 is converted near the interface. These lines correspond to the almost horizontal lines in figure 4. Because at higher captures EA
∞ increases the horizontal lines at high ae’s are more pronounced. At low kL’s kov approaches the EA=EA
∞ line and the contour lines in figure 4 bend back to diagonals again.
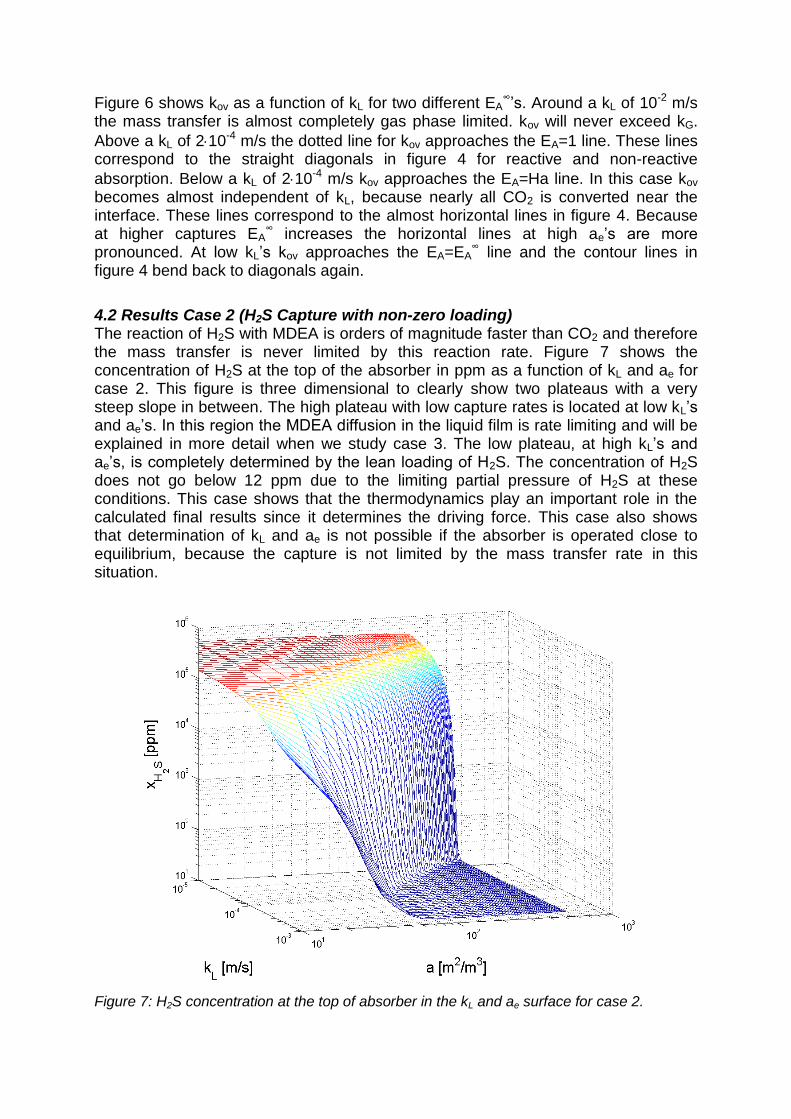
4.2 Results Case 2 (H2S Capture with non-zero loading) The reaction of H2S with MDEA is orders of magnitude faster than CO2 and therefore the mass transfer is never limited by this reaction rate. Figure 7 shows the concentration of H2S at the top of the absorber in ppm as a function of kL and ae for case 2. This figure is three dimensional to clearly show two plateaus with a very steep slope in between. The high plateau with low capture rates is located at low kL’s and ae’s. In this region the MDEA diffusion in the liquid film is rate limiting and will be explained in more detail when we study case 3. The low plateau, at high kL’s and ae’s, is completely determined by the lean loading of H2S. The concentration of H2S does not go below 12 ppm due to the limiting partial pressure of H2S at these conditions. This case shows that the thermodynamics play an important role in the calculated final results since it determines the driving force. This case also shows that determination of kL and ae is not possible if the absorber is operated close to equilibrium, because the capture is not limited by the mass transfer rate in this situation.
Figure 7: H2S concentration at the top of absorber in the kL and ae surface for case 2.
Presented at Brimstone Sulfur Conference – 2014 – Vienna
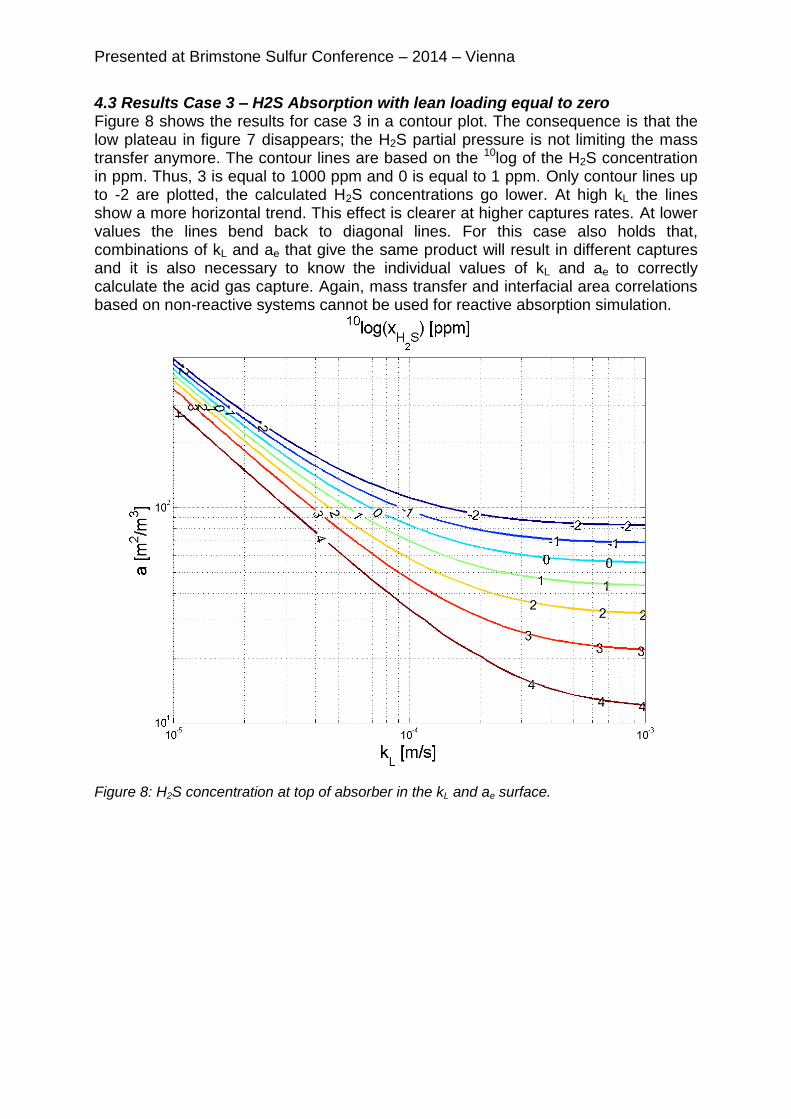
4.3 Results Case 3 – H2S Absorption with lean loading equal to zero Figure 8 shows the results for case 3 in a contour plot. The consequence is that the low plateau in figure 7 disappears; the H2S partial pressure is not limiting the mass transfer anymore. The contour lines are based on the 10log of the H2S concentration in ppm. Thus, 3 is equal to 1000 ppm and 0 is equal to 1 ppm. Only contour lines up to -2 are plotted, the calculated H2S concentrations go lower. At high kL the lines show a more horizontal trend. This effect is clearer at higher captures rates. At lower values the lines bend back to diagonal lines. For this case also holds that, combinations of kL and ae that give the same product will result in different captures and it is also necessary to know the individual values of kL and ae to correctly calculate the acid gas capture. Again, mass transfer and interfacial area correlations based on non-reactive systems cannot be used for reactive absorption simulation.
Figure 8: H2S concentration at top of absorber in the kL and ae surface.
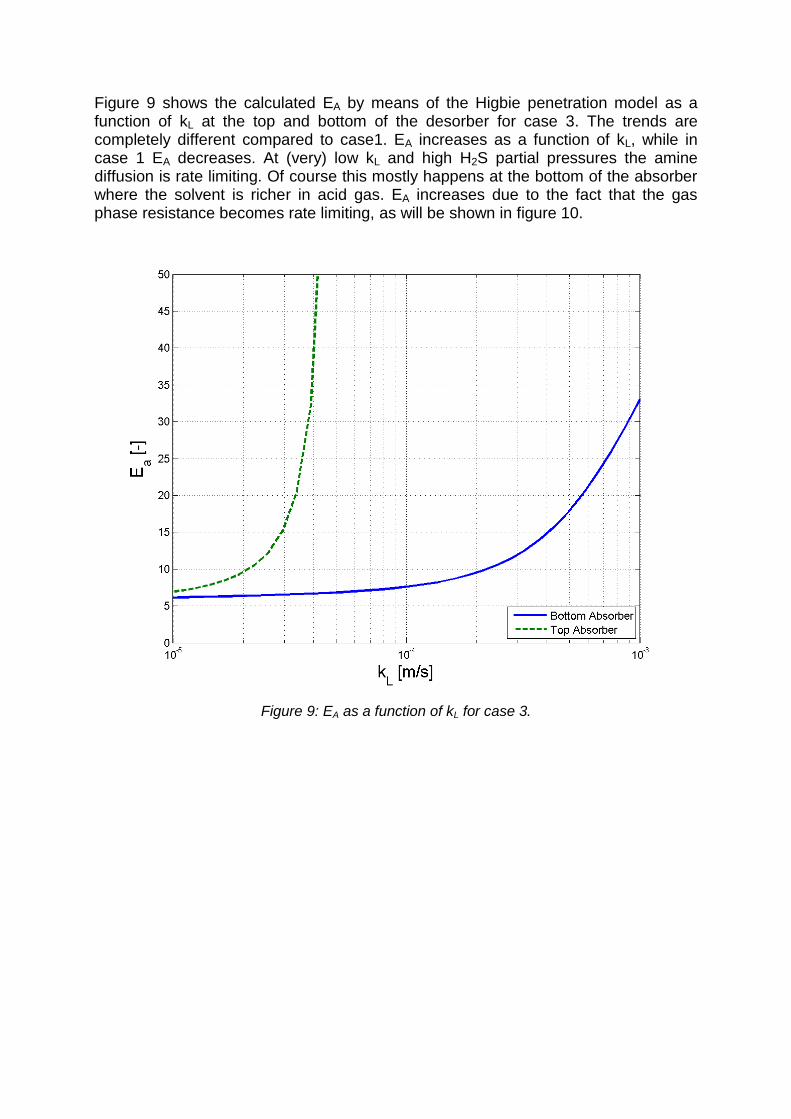
Figure 9 shows the calculated EA by means of the Higbie penetration model as a function of kL at the top and bottom of the desorber for case 3. The trends are completely different compared to case1. EA increases as a function of kL, while in case 1 EA decreases. At (very) low kL and high H2S partial pressures the amine diffusion is rate limiting. Of course this mostly happens at the bottom of the absorber where the solvent is richer in acid gas. EA increases due to the fact that the gas phase resistance becomes rate limiting, as will be shown in figure 10.
Figure 9: EA as a function of kL for case 3.
Presented at Brimstone Sulfur Conference – 2014 – Vienna
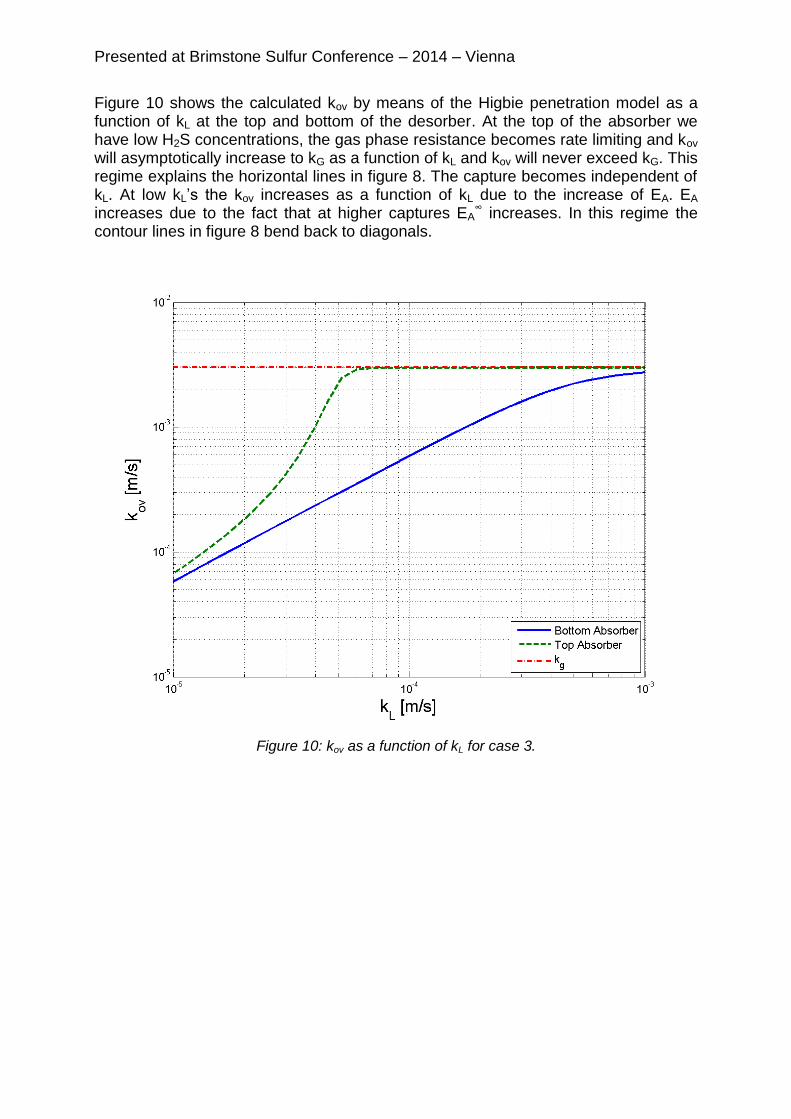
Figure 10 shows the calculated kov by means of the Higbie penetration model as a function of kL at the top and bottom of the desorber. At the top of the absorber we have low H2S concentrations, the gas phase resistance becomes rate limiting and kov will asymptotically increase to kG as a function of kL and kov will never exceed kG. This regime explains the horizontal lines in figure 8. The capture becomes independent of kL. At low kL’s the kov increases as a function of kL due to the increase of EA. EA increases due to the fact that at higher captures EA
∞ increases. In this regime the contour lines in figure 8 bend back to diagonals.
Figure 10: kov as a function of kL for case 3.
Finally, figure 11 shows the H2S concentration in the gas phase and the kov as a function of the absorber height. At low kL the concentration slowly decreases as a function of the absorber height, due to diffusion limitation of the amine.The kov is almost constant as a function of the height. At high kL the concentration decreases fast and the kov is mostly equal to kG. Between these two profiles, at moderated kL’s the kov is not constant as a function of the height. This phenomenon shows another challenge in the determination of mass transfer parameters based on an absorber capture measurements alone. If kov is not constant in the absorber it is not possible to determine one specific value.
Figure 11: H2S concentration and kov as a function of the absorber height at three different kL’s.
Presented at Brimstone Sulfur Conference – 2014 – Vienna
5. Conclusions A systematic comparison between non-reactive and reactive processes is presented using the removal of CO2 and H2S from natural gas streams with aqueous MDEA. For non-reactive absorption processes it is only necessary to know the product of kL and ae, all combinations of kL and ae that give the same product for kL and ae result in the same capture. For reactive absorption processes it is absolutely necessary to know the individual values of kG, kL and ae to calculate the capture. It is shown that mass transfer correlations that are based on non-reactive validations cannot be used for reactive absorption. It is also shown that a large combination of effects can result in the same capture and that kov not constant as a function of the absorber height. A complete model is needed that incorporates all effects, mass transfer and thermodynamics, as a function of the absorber height.
Nomenclature A Interfacial vapour-liquid mass transfer area m2
ae Specific interface are for mass transfer m2/m3 α Acid gas loading of moles per moles amine mol/mol C Concentration mol/m3 D Diffusion coefficient m2/s Ea Enhancement factor of mass transfer due to chemical reaction - EA
∞ Enhancement factor limited by amine diffusion - H Height of the column m Ha Ratio rate of reaction and diffusion in liquid film - J Mass transfer from vapor phase to liquid phase mol/m2/s kG Vapor phase mass transfer coefficient m/s kL Liquid phase mass transfer coefficient m/s kov Overall mass transfer coefficient m/s L Liquid flow mol/s m Partition coefficient (Cli/Cgi)Eq - G Vapor flow mol/s V Segment volume m3 xi Liquid phase molfraction - yi Vapor phase molfraction - ρG Gas phase density mol/m3 ρL Liquid phase density mol/m3
References 1. E.P. van Elk, A.R.J. Arendsen, G.F. Versteeg, A new flowsheeting tool for flue
gas treating, Energy Procedia 1, 1481–1488, 2009. 2. E.S. Hamborg, P.W.J. Derks, E.P. van Elk, G.F. Versteeg, Carbon dioxide
removal by alkanolamines in aqueous organic solvents. A method for enhancing the desorption process, Energy Procedia 4, 187-194, 2011.
3. J.C. Meerman, E.S. Hamborg, T. van Keulen, A. Ramírez, W.C. Turkenburg and A.P.C. Faaij, Techno-economic assessment of CO2 capture at steam methane reforming units using commercially available technology, To be published, 2012.
4. A.R.J. Arendsen, E. van Elk, P. Huttenhuis, G. Versteeg, F. Vitse, Validation of a post combustion CO2 capture pilot using aqueous amines with a rate base simulator, SOGAT, 6th International CO2 Forum Proceedings, Abu Dhabi, UAE, 2012.
5. A.R.J. Arendsen, G.F. Versteeg, J. van der Lee, R. Cota and M.A. Satyro, Comparison of the design of CO2-capture processes using equilibrium and rate based models, The Fourth International Acid Gas Injection Symposium, Calgary, 2013.
6. A.R.J. Arendsen, G.F. Versteeg, J. van der Lee, R. Cota and M.A. Satyro, Comparison of the design of an acid-gas treating process using equilibrium and rate based models, ADIPEC Technical Conference, Abu Dhabi, 2013.
7. G.F. Versteeg, J.A.M. Kuipers, F.P.H. van Beckum and W.P.M. van Swaaij, Mass transfer with complex chemical reactions. I. Single reversible reaction, Chemical Engineering Science, 44, 2295-2310, 1989.
8. Bravo, J. L.; Fair, J. R. Generalized Correlation for Mass Transfer in Packed Distillation Columns. Ind. Eng. Chem. Process Des. Dev. 1982, 21, 162.
9. Shetty, S.; Cerro, R. L. Fundamental Liquid Flow Correlations for the Computation of Design Parameters for Ordered Packings. Ind. Eng. Chem. Res. 1997, 36, 771
10. Bravo, J. L.; Rocha, J. A.; Fair, J. R. Mass Transfer in Gauze Packings. Hydrocarbon Process. 1985, 64, 91.
11. Billet, R.; Schultes,M. Predicting Mass Transfer in Packed Columns. Chem. Eng. Technol. 1993, 16, 1.
12. Olujic, Z. Development of a Complete Simulation Model for Predicting the Hydraulic and Separation Performance of Distillation Columns Equipped with Structured Packings. Chem. Biochem. Eng. Q. 1997, 11, 31.