+ All Categories
Home > Documents > THE INFLUENCE OF PROCESSING OF LUPINS AND CANOLA ON ...

THE INFLUENCE OF PROCESSING OF LUPINS AND CANOLA ON ...

Date post: 02-Jan-2022
Category:
Upload: others
View: 3 times
Download: 0 times
Share this document with a friend
101
THE INFLUENCE OF PROCESSING OF LUPINS AND CANOLA ON APPARENT METABOLIZABLE ENERGY AND BROILER PERFORMANCE. Liesl Breytenbach [Student 12478539] Thesis presented as partial fulfilment of the requirements for the degree of Master of Science in Agriculture Supervisor: Dr. M. Ciacciariello CoSupervisor: Dr. L.G. Ekermans Department of Animal Science December 2005
Transcript


THE INFLUENCE OF PROCESSING OF LUPINS AND CANOLA ON 

APPARENT METABOLIZABLE  ENERGY AND BROILER 

PERFORMANCE. 

Liesl Breytenbach 

[Student № 12478539] 

Thesis presented as partial fulfilment of the requirements for the degree of 

Master of Science in Agriculture

Supervisor: Dr. M. Ciacciariello

Co‐Supervisor: Dr. L.G. Ekermans 

Department of Animal Science 

December 2005 

DECLARATION

I, the undersigned, hereby declare that the work contained in this thesis is my own original work

and that I have not previously in its entirety or in part submitted it at any university for a degree,

and to the best of my knowledge, does not include material previously published or written by

another person, except where due reference is made in the text.

______________________________ ______________________ SIGNATURE DATE

Abstract

1. The influence of processing of Lupinus angustifolius and full-fat Canola seed on

Apparent Metabolizable Energy and broiler performance.

The extrusion and dehulling of sweet blue lupins (Lupinus angustifolius, cultivar Wonga) and the

expansion of full-fat canola seed were evaluated in terms of their effect on the nitrogen corrected

apparent metabolizable energy (AMEn) value and broiler performance. Two separate trials were

conducted for the lupin and canola test materials respectively. Four lupin products were tested and

consisted of: lupin meal (LM), dehulled lupin meal (DLM), extruded lupin meal (ELM) and

extruded dehulled lupin meal (EDLM). The two canola products were: canola full-fat (CFF) and

expanded canola full-fat (ECFF). In each trial two summit diets were formulated with similar

energy and crude protein values. The one did not contain any test material (control) and the other

contained either lupin meal (170 g/kg for the starter test diet and 174 g/kg for the finisher test diet)

or full-fat canola seed (169 g/kg for both the starter and finisher tetst diets). The other test diets

were then prepared by replacing the LM with equal quantities of DLM, ELM and EDLM

respectively and the CFF were replaced by ECFF. Each of these test diets were then blended with

the control diet at six inclusion levels (0, 20, 40, 60, 80 and 100%) to produce experimental diets

with increasing levels of the test material. These diets were fed to three groups of 80 as hatched

Ross 308 broilers in the lupin trial and 40 in the case of the canola trial. Each trial lasted 42 days.

Firstly, the influence of processing was measured in terms of its effect on the AME value of the test

material and secondly on broiler performance. Body weight, feed intake and feed conversion ratio

(g feed / g weight) were the parameters measured. The extrusion of lupin meal decreased AMEn

from 8.61 MJ/kg to 7.52 MJ/kg. The ELM also resulted in inferior broiler performance in

comparison with LM and DLM for all parameters measured. The combination of dehulling and

extrusion (EDLM) did not result in significant improvements above that observed for ELM. The

dehulling of lupin meal (DLM), however, increased the absolute value of lupin AMEn from 8.61

MJ/kg to 8.81 MJ/kg and this effect was also seen when ELM was compared to EDLM (7.52 MJ/kg

to 8.04 MJ/kg). The expansion of full-fat canola (ECFF) increased the AMEn from 15.51 MJ/kg to

19.20 MJ/kg, but it did not significantly improve the body weight, feed intake or feed conversion

ratio of broilers. Dietary levels above 10% CFF resulted in lower body weights and feed intakes

were reduced in comparison to birds on the control diet from 6.8% CFF. The utilization of canola

diets (FCR) were superior to those of the control from the 6.8% inclusion level of CFF.

Thus, the dehulling of lupins rendered a more nutrient dense product and this was reflected in the

superior broiler performances observed with DLM in comparison with the other lupin products. If

body weight is the main criteria, ground, raw canola seeds can be included in broiler diets up to

10%, but dietary levels of up to 16.9% will perform well in terms of feed conversion ratios.

ii

Uittreksel

1. Die invloed van prosessering van Lupiene (Lupinus angustifolius) en Volvet Kanola op

die Skynbare Metaboliseerbare Energie en braaikuiken prestasie.

Die invloed van ekstrusie en ontdopping van soet blou lupiene (Lupinus angustifolius, kultivar

Wonga) en die ekspandering van volvet kanola saad is ge-evalueer in terme van hul effek op die

stikstof gekorregeerde skynbare metaboliseerbare energie (SMEn) waarde asook

braaikuikenprestasie. Twee aparte proewe is uitgevoer vir die lupiene en kanola toetsmateriale

afsonderlik. Vier lupien produkte is getoets naamlik: lupienmeel (LM), ontdopte lupienmeel

(DLM), geëkstrueerde lupienmeel (ELM) en geëkstrueerde ontdopte lupienmeel (EDLM). Die twee

kanola produkte is: volvet kanola saad (CFF) en geëkspandeerde volvet kanolasaad (ECFF). Vir

elke proef is twee rantsoene met dieselfde energie en proteïen waardes geformuleer. Die een bevat

geen toetsmateriaal nie (kontrole) en die ander een bevat óf lupiene (170 g/kg in die

aanvangsrantsoen en 174 g/kg in die afrondingsfase) óf kanola saad (169g/kg vir beide die

aanvangs- en afrondingsrantsoene). Die ander toetsrantsoene is voorberei deur die lupienmeel met

gelyke hoeveelhede DLM, ELM of EDLM te vervang, terwyl die CFF met ECFF vervang is. Elk

van hierdie toetsrantsoene is dan met die kontrole rantsoen vermeng in verskillende verhoudings (0,

20, 40, 60, 80 en 100%) om sodoende eksperimentele rantsoene te skep met toenemende vlakke van

die toetsmateriaal. Die rantsoene is aan drie groepe van 80 Ross 308 braaikuikens gevoer tydens die

lupien-proef en 40 in die geval van die kanola-proef. Die afsonderlike proewe is in ‘n 42-dag siklus

uitgevoer. Die invloed van prosessering van die toetsmateriaal is gemeet in terme van die

veranderng in SME, asook in braaikuikenprestasie. Liggaamsmassa, voerinname en

voeromsettingsverhouding (g voer / g massa) is gebruik as maatstawwe vir braaikuikenprestasie.

Die ekstrusie van lupienmeel het die SMEn van 8.61 MJ/kg tot 7.52 MJ/kg verlaag. In vergelyking

met LM en DLM het die ELM ook ‘n swakker liggaamsmassa en voeromset tot gevolg gehad. Die

invloed van beide ontdopping en ekstrusie van lupiene (EDLM) het nie tot enige betekenisvolle

verbetering gelei in vergelyking met dié van ELM nie. Die ontdopping van lupienmeel (DLM) aan

die ander kant, het die absolute waarde van SMEn van lupiene van 8.61 MJ/kg tot 8.81 MJ/kg

verhoog. Hierdie effek is ook waargeneem tydens die vergelyking van ELM met EDLM (7.52

MJ/kg tot 8.04 MJ/kg).

iii

Die ekspandering van volvet kanola het die SMEn van 15.51 MJ/kg tot 19.20 MJ/kg verhoog, maar

dit het nie die liggaamsmassa, voerinname of voeromsettings verhouding (VOV) van braaikuikens

betekenisvol verbeter nie. Insluitingsvlakke bo 10% CFF het ‘n laer liggaamsmassa tot gevolg

gehad, terwyl voerinnames noemenswaardig verlaag het in vergelyking met die braaikuikens op die

kontrole dieët vanaf 6.8% CFF. Die benutting van kanola rantsoene (VOV) was egter beter as dié

van die kontrole vanaf die 6.8% insluitingspeil van CFF.

Die ontdopping van lupiene het dus ‘n meer nutriënt-digte produk daargestel en is weerspieël in die

beter braaikuikenprestasie wat waargeneem is met DLM in vergelyking met die ander lupien

produkte. Indien liggaamsmassa as die hoof kriteria beskou word, kan rou, gemaalde kanolasaad by

braaikuikenrantsoene ingesluit word tot en met 10%, maar insluitingspeile van tot 16.9% sal goed

presteer in terme van voeromsettings verhoudings

iv

This Thesis is dedicated

to my soul partner, my husband and friend André

for his patience, trust and understanding

to my mother and father for their support and encouragement.

v

Acknowledgements

To the Protein Research Trust who provided the financial support for this research

project and without whose help this would not have been possible.

To Scott Millar and Equifeeds for the facilities to process the raw material; as well as

Boy Cekiso who helped me through the night to process the lupins and canola.

To Herman Claasen and Degussa Africa Pty. (Ltd.) for analyzing the amino acids.

To Steven Payne, Michael, Selwyn and the rest of the Mariendahl team who assisted me

with the practical work for these experiments.

To Resia for her assistance with the amino acid preparation and to Nicholas and

Raymond for making lab work a pleasant experience.

To Prof. Daan Nel and Gail Jordaan for their help with the statistical analysis of the data.

To my supervisor, Dr Mariana Ciacciariello for her guidance, positive outlook and

enthusiastic personality that made this project worthwhile.

vi

CONTENTS

GENERAL INTRODUCTION ................................................................................................................... 2

CHAPTER 1 ................................................................................................................................................. 3

LITERATURE REVIEW............................................................................................................................ 3

1.1 INTRODUCTION TO LEGUMES AND OILSEEDS ................................................................................ 3

1.2 GLOBAL PRODUCTION AND TRADE ................................................................................................ 6

1.3 PRODUCTION AND TRADE IN SOUTH AFRICA................................................................................. 8

1.4 NUTRITIONAL VALUE OF LUPINS (LUPINUS ANGUSTIFOLIUS) FOR BROILERS............................... 10

1.4.1 Chemical evaluation........................................................................................................... 11 1.4.2 Bioassays - Energy ............................................................................................................. 15 1.4.3 Bioassays – Amino acids .................................................................................................... 16 1.4.4 Anti-nutritional factors in Lupins....................................................................................... 22 1.4.5 Processing of Lupins .......................................................................................................... 25

1.5 NUTRITIONAL VALUE OF CANOLA SEED (BRASSICA SPP.) FOR BROILERS..................................... 33

1.5.1 Chemical Evaluation .......................................................................................................... 34 1.5.2 Bioassays - Energy ............................................................................................................. 37 1.5.3 Bioassays – Amino acids .................................................................................................... 38 1.2.1 Anti-nutritional factors in Canola ...................................................................................... 40 1.2.2 Processing of Canola ......................................................................................................... 44

1.6 DISCUSSION.................................................................................................................................. 51

CHAPTER 2 ............................................................................................................................................... 52

THE INFLUENCE OF EXTRUSION AND DEHULLING OF LUPINUS ANGUSTIFOLIUS ON

APPARENT METABOLIZABLE ENERGY (AME) AND BROILER PERFORMANCE. .............. 52

2.1 INTRODUCTION ............................................................................................................................ 52

2.2 MATERIALS AND METHODS......................................................................................................... 53

2.2.1 AME Bioassay .................................................................................................................... 53 2.2.2 Broiler Performance Trial.................................................................................................. 54

2.3 RESULTS AND DISCUSSION .......................................................................................................... 56

3.3.1 AME Bioassay .................................................................................................................... 56 2.3.2 Broiler Performance Trial.................................................................................................. 58

2.4 CONCLUSION................................................................................................................................ 64

CHAPTER 3 ............................................................................................................................................... 65

THE INFLUENCE OF EXPANSION OF FULL-FAT CANOLA SEED ON APPARENT

METABOLIZABLE ENERGY (AME) AND BROILER PERFORMANCE. ..................................... 65

3.1 INTRODUCTION ............................................................................................................................ 65

3.2 MATERIAL AND METHODS........................................................................................................... 65

3.2.1 AME Bioassay .................................................................................................................... 66 3.2.2 Broiler Performance Trial.................................................................................................. 66

3.3 RESULTS AND DISCUSSION .......................................................................................................... 68

3.3.1 AME Bioassay .................................................................................................................... 68 3.3.2 Broiler Performance Trial.................................................................................................. 69

3.4 CONCLUSION................................................................................................................................ 72

CHAPTER 4 ............................................................................................................................................... 73

GENERAL CONCLUSION ...................................................................................................................... 73

REFERENCES ........................................................................................................................................... 75

1

General Introduction

Increased global poultry production and the pressure it exerts on conventional protein sources has driven

the need to investigate locally produced protein sources as an economic alternative. In this instance, lupins and

canola have been identified as being well adapted to the Western Cape. This study aims to contribute

information towards the suitablility of these feedstuffs as protein sources, by means of assessing the nutritive

value thereof for broilers.

The most important lupin species cultivated today are Lupinus albus, Lupinus luteus and Lupinus

angustifolius. Recent cultivars of lupin has been genetically engineered towards a far superior composition and

reduced alkaloid content (less than 0.01%) and are referred to as sweet lupins. Large variation exists between

lupin species and even cultivars from different areas or parts of the world. In order to make the best prediction

of its nutritional value, the feed compounder should be aware of the specific type and composition of lupins that

are being used. Lupinus angustifolius have been selected for this study, seeing as little work has been done on

estimating its nutrient availability for broilers.

The use of canola meal in poultry diets have far exceeded that of the canola seed. Moreover, a general

lack of information therefore exists regarding the inclusion of this oilseed in its full-fat form in poultry diets.

Currently, the market capacity for protein concentrates for animal feed exceeds that of the oil-pressing capacity

in the Western Cape and provided further grounds for selecting canola seed for this study. It also provides the

added advantage of utilizing a commodity that is not only a good source of protein, but one that is high in

energy. This could prove especially beneficial for poultry nutrition in the hot South African climate.

Firstly, the goal is to provide information regarding the nutritive value and inclusion of Lupinus

angustifolius and full-fat canola seed in broiler diets. Secondly, it investigates ways of improving its nutritive

value. This study was done on a semi-commercial scale and consisted of two trials. In both trials the available

energy were evaluated by means of an AME-bioassay with a total faecal collection procedure. The

improvement in nutritional value of lupins and canola due to processing was measured by means of broiler

performance. Body weight, feed intake and feed conversion ratio (g feed / g weight) were recorded weekly. In

the first trial, the effect of dehulling and extrusion of Lupinus angustifolius was evaluated. It was expected that

the dehulling of lupins will greatly improve the energy-diluting effect of the high fiber contents of these

legumes. The thermo-mechanical extrusion treatment was expected to improve the nutritive value of lupins for

broilers through the increased accessibility of nutrients to digestive enzymes. In the second trial, the expansion

of full-fat canola was tested. Unprocessed whole canola seed is not warranted for use in poultry diets due to the

presence of myrosinase that hydrolyses the glucosinolates into toxic and goitrogenic components upon crushing

or grinding of the seed. The heat treatment was therefore expected to inactivate this enzyme as well as

modifying the protein structure, thus rendering it more readily assimilable by poultry.

The following chapter reviews the literature pertaining to oilseeds and legumes in a global context, as

well as summarising the relevant literature on the nutritional values of Lupinus angustifolius and Canola.

2

CHAPTER 1

Literature Review

1.1 Introduction to Legumes and Oilseeds

Global poultry production makes substantial use of plant protein sources to satisfy their dietary protein

requirements. Legumes and oilseeds are especially important in providing valuable protein of vegetable origin

(Liener, 1990; Larbier & Leclercq, 1994). According to FAO forecasts (Gillin, 2003), the total world poultry

meat production will reach 100 million tonnes by 2015 and increase even further to approximately 143 million

tonnes by 2030. The global per capita consumption of poultry meat (kg / person / year) is also expected to

continue its upward trend and was reported to average around 10.9 kg in 2000 (Gillin, 2003). This growth in

demand for livestock products has been largely fuelled by the growth that occurred in the developing world,

most notably in China and South-East Asia (Dean, 2002). The developing world will be contributing more than

60% of the world poultry meat production by 2030 (Gillin, 2003). Population growth, income growth, cultural

factors as well as urbanization, all play a role in determining the demand for livestock products.

To be able to sustain the high rates of increase in livestock production, the manufacturing feed industry

must match the increasing demand by increased levels of feed production. Since almost 70% of the total world

industrial feed tonnage is intended for the pig and poultry industry (Gill, 2003), it places additional pressure on

the feedstuff resources for monogastric nutrition. The high costs of animal protein sources such as fish meal

(McDonald et al., 1995), and the BSE-imposed ban on the feeding of meat-and-bone-meal by the European

Union in 2001, dramatically altered the feed protein market in Europe, increasing demand for vegetable protein

sources (Jurgens, 2001; Partridge & Hruby, 2002). Table 1.1 indicates some of the potential legume and oilseed

crops of the world.

Legume seeds represent an extremely important source of protein for poultry (Wiseman & Cole, 1988)

and contain approximately 20 to 25 % crude protein (Elkin, 2002). Some leguminous seeds, such as beans and

peas are low in oil, but rich in starch and can be directly incorporated into poultry diets (Larbier & Leclercq,

1994). Other oil- and legume seeds with higher oil content, such as canola and soya, are employed as raw

materials in the edible oil industry, but may also be used as full-fat seeds. These by-products of the oil food

industry, also known as oilseed meals, have varying levels of oil content, depending on whether mechanical

force (expeller-extraction) or solvent (hexane) extraction methods were used to extract the oil from the seeds

(McDonald et al., 1995). The latter being the method most widely implemented, but produces the least amount

of residual oil in the oilseed meal. This usually averages around 1 to 2 %, compared with the 4 % or more of

residual oil in expeller-extracted oilseed meals (Salunkhe et al., 1992). Oilseed meals are, however, high in

protein and provide the feed compounder with a valuable source of protein. Oilseeds are thus all subjected to

manufacturing processes (Dale, 1996) and even though the quality of protein in a particular oilseed is relatively

constant, that of the meal derived from it may vary depending on the conditions of processing (McDonald et al.,

1995). This also holds true for the amino acid composition of oilseed meals (McDonald et al., 1995). It has

generally been accepted to consider soyabean meal as the universal standard for comparison with other protein

3

supplements (Ravindran & Blair, 1992; Kohlmeier, 1997 and Leeson & Summers, 2001). The successful

incorporation of soyabean meal in monogastric diets can be attributed to various factors. It has a high protein

content, usually standardized at 44% or 48% crude protein, depending on the fraction of hulls included, and an

amino acid profile that is especially complementary to that of low-lysine cereal-based diets (Elkin, 2002). The

amino acid availabilities in soyabean meal are higher than those for other oilseed meals (Aherne & Kennelly,

1982) and the anti-nutritional factors are eliminated in properly processed soyabean meal (Ravindran & Blair,

1992). These valuable characteristics are reflected in the fact that it accounts for 75% of all protein used in

industrial feeds (Gill, 2003). The whole group, legumes and oilseeds, constitute an important source of protein,

which may or may not be associated with oil production.

Table 1.1 Potential Legume and Oilseed crops of the world

Scientific Name

Oilseeds1 Castor Ricinus communis

Coconut Cocos nucifera

Cottonseed Gossypium spp.

Linseed / Flax seed Linum usitatissimum

Palm kernel Elaeis guineensis

Peanut/ Groundnut Arachis hypogaea

Rapeseed / Canola Brassica campestris / napus

Safflower Carthmus tinctorius

Sesame Sesamum indicum

Soyabean Glycine max

Sunflower Helianthus annus

Legume seeds2

Chick pea Cicer arietinum

Common dry bean Phaseolus vulgaris

Cowpeas Vigna unguiculata

Faba bean Vicia faba

Field pea Pisum sativum

Green gram Vigna radiata

Lupin Lupinus spp.

Lentil Lens culinaris 1. Salunkhe et al. (1992); 2. Ravindran & Blair (1992).

As livestock production becomes more commercialized in response to increased consumer demand, a

major consideration will be the extent to which a particular country can satisfy increased demand for feedstuffs

on its own account and the extent to which it will have to rely on imports. Europe has been relying substantially

on soyabean meal imports, but the strong drive towards non-GMO feedstuff sources and the high cost involved

in soyabean meal imports, prompted them to investigate the production and use of alternative protein-rich

4

ingredients (Gatel, 1994). This phenomenon is also found in other countries, such as South Africa where

expensive soyabean meal imports are required to satisfy local demand (Jurgens, 2001), and in other areas of the

world where soyabean meal is primarily intended for the human food chain and thus not readily available for

animal feed use, such as Asia and the Pacific (Ravindran & Blair, 1992). The partial or complete replacement

of soyabean meal by indigenous protein sources could be an economically attractive alternative and may lead to

savings in valuable foreign exchange.

Grain legumes are potential substitutes for soybean meal because of their similar amino acid profiles

(Gatel, 1994). Although the use of grain legumes in poultry production is mostly directed towards supplying a

source of protein (Brandt, 1998), due to the carbohydrate (mainly starch) and oil content of some of the legume

seeds, they can also be viewed as potential sources of energy (Reddy et al., 1984; Ravindran & Blair, 1992).

Table 1.2 compares the nutritional value of selected protein concentrates in terms of protein, fat (ether extract)

and fiber content. It is evident from these values that the various methods of oil-extraction had an influence on

the protein and fat content of these sources, the solvent extraction method yielding a concentrate source with

higher protein and lower fat values than the expeller-extraction method.

Table 1.2 Average protein, fat and fiber contents (% dry matter) of selected protein concentrates utilized in poultry nutrition

Protein Concentrate Sources Protein (%)

Ether extract

(%)

Crude Fiber (%)

Source*

Soyabean meal, expeller-extracted 42.0 6.0 8.0 1 Soyabean meal, pre-press, solvent 49.4 0.9 8.2 2 Soyabean meal, dehulled, solvent 53.9 1.1 4.3 2 Rapeseed/ Canola meal, expeller-extracted 36.0 7.0 12.0 1 Rapeseed/ Canola meal, pre-press, solvent 37.2 1.9 13.2 2 Cottonseed meal, expeller-extracted 38.0 6.0 14.0 1 Cottonseed meal, pre-press, solvent 45.0 1.6 12.3 2 Peanut/ Groundnut meal, dehulled, expeller-extracted 44.0 7.0 13.0 1 Peanut/ Groundnut meal, pre-press, solvent 52.2 1.3 14.6 2 Sunflower meal, dehulled, expeller-extracted. 36.0 8.0 13.0 1 Sunflower meal, dehulled, pre-press, solvent 45.2 3.1 13.1 2 Common dry bean 24.0 2.0 4.0 1 Chick pea 22.0 4.0 9.0 1 Faba bean 23.0 2.0 7.0 1 Field pea 25.0 1.5 6.0 1 Lupin meal, whole seed 33.7 5.0 18.7 3 Lupin meal, dehulled 43.7 8.2 5.5 3 * Source: 1. Ravindran & Blair (1992); 2. Aherne & Kennelly (1982); 3. Fernández & Batterham (1995).

Despite their favourable amino acid profile and relatively high energy content, the use of grain legumes

in commercial poultry production is still limited because of uncertainty about their effective nutritional quality

(Wiryawan & Dingle, 1995). A major constraint in the use of grain legumes (Wiseman & Cole, 1988) and

5

oilseeds (Aherne & Kennelly, 1982) in poultry diets is that they contain anti-nutritional factors (ANFs) that

depress poultry performance. Some of the ANFs of these plant protein sources are displayed in Table 1.3.

Table 1.3 Anti-nutritional Factors in Seeds (Huisman & Tolman, 1992)

Anti-nutritional Factors Seeds

Trypsin Inhibitors Lectins Polyphenolic compounds Other ANFs

Legume seeds Soya ++ / +++ ++ - ++ / +++ A, C

Vicia faba bean + + + / ++ / +++ + / ++ / +++ B

Ph. Vulgaris bean - / + / ++ + / ++ / +++ + / ++ + / ++ / +++ A

Pisum sativum + / ++ + / ++ + / ++ - Lentils, cowpeas, chick peas + / ++ + / ++ - / + / ++ -

Lupins - - - + / ++ / +++ C

Other seeds Rapeseed/ Canola - - + / ++ + / ++ / +++ D

Sunflower seed - / + - + / ++ E - Cotton seed - / + - - + / ++ / +++ F

Peanut - - + / ++ G - below detection level; + low level; ++ medium level; +++ high level. Different varieties of the same material may have different characteristics. A, antigenic proteins; B, vicine/convicine; C, alkaloids; D, glucosinolates and sinapins; E, 3-3.5 % phenolic compounds; F, gossypol; G, 16-18 % in the shell around the nut.

Various treatments have been tested to improve the nutritive value of grain legumes to their full potential.

The nutritional value depends not only on the chemical composition of the plant protein source, but also on the

extent to which nutrients are digested, absorbed and utilized. ANFs interfere with these digestion, absorption

and utilization processes (Huisman & Tolman, 1992), but could be reduced or eliminated by means of suitable

processing techniques, enzyme supplementation and plant breeding (Wiseman & Cole, 1988; Liener, 1990;

D’Mello, 1995). The resulting improvements in nutritive value are related to increases in metabolizable energy

values and in the digestibilities of the legume proteins (Wiryawan & Dingle, 1999).

In the context of the global trading economy, it is appropriate to look at oilseed and legume production

and utilization on a worldwide basis.

1.2 Global production and trade

World trade in oilseeds and oilseed products rose steadily in the years following the Second World War.

The rate of growth showed a continuous increase in the following decades with rape and soya contributing the

greatest proportional volume increases. This is clearly visible from the data of world oilseed production in

Table 1.4. It is noteworthy that not all seeds are processed to obtain oil. A part of the produce is used as seed;

some are fed unprocessed to animals, or used directly for human consumption.

6

Table 1.4 Calculated world production (million tonnes) of selected oilseeds (Weiss, 2000)

1960 1970 1980 1990 2000*

Castor 0.7 0.9 1.0 1.3 1.5

Copra 4.0 4.0 5.0 5.0 5.0

Cottonseed 20.0 21.0 24.0 34.0 35.0

Groundnut 12.0 12.0 14.0 17.0 20.0

Linseed 4.0 4.0 3.0 2.5 2.5

Rapeseed 4.0 7.0 12.0 25.0 40.0

Safflower 0.5 0.6 1.0 1.0 0.5

Sesame 2.0 2.0 3.0 3.0 3.0

Soya 27.0 45.0 93.0 104.0 180.0

Sunflower 7.0 10.0 15.5 23.0 28.0

Total 81.2 106.5 171.5 215.8 315.5

* Estimate

The great increase in rape and soya production is a major factor affecting international trade in oilseeds.

Traditionally, the availability of soya or its products, especially from the USA and Argentina, dominated the

world oilseed trade and had a direct impact on the price levels of competitive crops (Willemse, 2004). This

dominance was put on hold by the growth in Malaysian palm oil production as well as the introduction of

canola oil from Canada. Meal and oil from double zero rapeseed cultivars can now directly substitute for soya

bean products (Weiss, 2000). The worlds major producers of selected oil crop meals are listed in Table 1.5.

Table 1.5 Major producers of selected oilcrop meals around the world Oilseed meals Major Producers1

Soyabean meal USA, Brazil, Argentina Rape/Canola seed meal Canada, EU*, China, India, Japan Cottonseed meal China, India, Russia, USA Groundnut meal India, China Sunflower meal Argentina, EU, Russia Copra meal Philippines, Indonesia Linseed meal Argentina, China, EU, Asia Lupinseed meal Australia2

1. Weiss (2000); 2. Cox (1998); * EU – European Union

Lupins have shown to be an excellent substrate for both bacterial and fungal fermentations, used in

making foods such as Indonesian tempe, miso and traditional soy sauces (Petterson, 1998). Apart from its use

in foods, lupins are generally utilized as a source of protein and energy in livestock feeds (Edwards &

Barneveld, 1998). The utilization of oilseeds (Salunkhe et al., 1992) can take the form of either the whole seeds

or the products that are derived by a partial removal of one of the major seed components. The seeds can be

directly processed into various edible products, including roasted, fermented and cooked products. Although

the oils are mostly utilized as edible oils for the human food chain, many oils are also used for industrial

purposes (Sonntag, 1995) and include coconut, soybean, linseed and castor oil. Coconut oil is mostly utilized in

7

cosmetics, soaps, detergents, pharmaceuticals and as base material in paints, whereas soybean and linseed oils

are used as plasticizers or stabilizers for vinyl plastics (Weiss, 2000). Castor oil is used in lubricants,

plasticizers, coatings, surfactants and pharmaceuticals (Weiss, 2000). The demand for oilseed meals have

exceeded that for vegetable oils and can be contributed to the rise in demand by the intensive livestock

production sector especially pigs, poultry and aquaculture.

1.3 Production and trade in South Africa South Africa relies strongly on imports of oilseeds and oilseed products to satisfy local demand for

protein sources. As with global trends, the demand for these protein sources has also increased in South Africa.

The oilcake inclusion rate for animal feed in South Africa increased by 0.48% during the 2002/2003 period

(Briedenhann, 2003) and resulted in increased oilcake imports. According to Table 1.6 the total available

oilcakes increased by 5.3% during the period 2001/2002 and 2002/2003 and pushed the available oilcakes to

over 1,2 million tonnes for the first time.

Table 1.6 Summary of total available oilcake (tonnes) in South Africa from 1999/2000 to 2003/2004 (Briedenhann, 2003)

Year cal ion rts Total Lo

Product Impo

1999 / 2000 03 35 38 554 9 508 4 1,063,32000 / 2001 20 34 54

02 48 76 24 03 11 85 96 4* 59 41 00

514 0 635 1 1,149,12001 / 20 482 4 666 7 1,149,22002 / 20 472 3 738 0 1,210,32003 / 200 417 3 782 6 1,200,0

*estimate

The largest contributor towards total available oilcake in South Africa is soya, followed by sunflower,

cotton, canola, lupins and groundnuts. These are the major plant protein sources and their respective

contributions during 2002/2003 are visually represented in Figure 1.1. The other oilcakes include copra,

linseed, palm and rapeseed.

Figure 1.1 Breakdown of total available oilcakes in SA for 2002/2003.

Cotton11%

Sunflower25% Groundnut

1%

Soya58%

Canola2%

Other oilcakes 2%

Lupins1%

8

The estimated local production of oilseeds and oilcakes for the marketing season 2003/2004 is shown in

Table 1.7. From this data it is clear that even though soya is the largest contributor towards total oilcake

availability, it is sunflower that is produced on the largest scale in South Africa. The four most important

oilcrops for poultry production in particular, are sunflower, soya, canola and lupins.

Table 1.7 Estimated availability of oilcakes (Tonnes) for the period: 1 April 2003 – 31 March 2004 (Briedenhann, 2003) OILSEEDS 2002/03 CROP

ESTIMATES 1AVAILABLE FOR CRUSHING

CONVERSION RATE (SEED)

EQUIVALENT OILCAKE

LOCAL PRODUCTION Sunflower 706,700 706,700 42.0% 296,814 Soya 3 139,420 90,320 80.0% 72,256 Groundnut 66,205 15,000 53.5% 8,025 Cotton seed 26,081 26,081 50.0% 13,041 Canola 2 40,770 40,770 55.0% 22,424 Lupins 2 4,800 4,800 100% 4,800 ESTIMATED LOCAL PRODUCTION 417,359 Total Estimated Requirements 1,200,000 IMPORT REQUIREMENT 782,641 Sources: 1. Crop Estimates Committee (20 August 2003). 2. Crop Estimates Committee - Preliminary area estimate (20 August 2003 - calculation). 3. 44 000 tonnes for human consumption. 5100 tonnes for seed.

This thesis aims to investigate some of the most promising locally produced protein sources for

utilization in broiler diets and will specifically focus on the winter oilseed crops lupins and canola. It could be

especially advantageous to the South African conditions to provide a concentrated source of protein and energy

for the feeding of poultry in relatively hot climates. In the Western Cape in particular, it is often more

economical to import energy and protein sources from countries such as Argentina, than it is to transport

similar products from the Highveld. Locally produced conventional protein sources are also becoming less

available and more expensive (Wiryawan & Dingle, 1995), and thus driving the importance of investigating all

possible alternatives that could provide an adequate source of protein and energy in broiler diets. Lupins (Brand

& Brundyn, 2001) and canola (Grobbelaar, 1999) have been identified as being well adapted to the winter

rainfall area of the Western Cape and if successfully cultivated, have the possibility of providing a much

needed local supply of protein. With this study it is intended to determine the nutritional value of Lupinus

angustifolius and Canola for broilers and to investigate whether any additional processing of the full-fat seeds

will lead to improvements in the nutritional value and thus a further savings effect on the expensive imports.

The following sections summarise the relevant literature on lupins and canola respectively, and provide grounds

for the research conducted for this thesis.

9

1.4 Nutritional value of Lupins (Lupinus angustifolius) for broilers

Lupins (Lupinus spp.) belong to the family Leguminosae and have been cultivated by ancient cultures of

the Mediterranean basin and the Andean highlands. Several hundred different species of lupins exist, but only a

few are actually cultivated (Todorov et al., 1996). Some, such as Lupinus albus and Lupinus mutabilis, have

been cultivated for human consumption since the earliest of times (Petterson, 1998), but others have only come

into cultivation more recently (Olver, 1994). The type of lupin being produced today bears little resemblance to

its predecessors and has been genetically engineered towards a far superior composition and reduced alkaloid

content. These new cultivars have been reported to contain less than 0.01% alkaloids and are referred to as

sweet lupins (Leeson & Summers, 1997). The high alkaloid content of the more traditional bitter lupin cultivars

suppress both food intake and growth, but a significant decrease in food conversion efficiency for broilers fed

increasing levels (25, 50, 75 & 100%) of bitter lupins was also found (Guillaume et al., 1979). Olver (1994)

defined alkaloids as nitrogen-containing, water soluble compounds that are produced in the chloroplasts of

certain plants and serve to repel or kill insect parasites. Cultivars of sweet varieties must be strictly controlled

to assure that cross-pollination does not occur and result in bitter progeny (King et al., 1985). Sweet lupins can

either be of the white (Lupinus albus), yellow (Lupinus luteus) or blue seeded (Lupinus angustifolius) varieties.

These are currently the most important lupin species cultivated and are shown in Figures 1.2, 1.3 and 1.4

respectively. The colours refer to the colour of the lupin plant flower and together with the shape of the plant

leaves (narrow-leaved or broad-leaved) can be used to distinguish between the species. Lupins are widely used

as a source of protein and energy in livestock feeds (Edwards & Van Barneveld, 1998), but it is especially the

low alkaloid lupins that are increasingly being investigated as an alternative protein feedstuff for poultry.

Figure 1.2. Lupinus albus Figure 1.3. Lupinus luteus Figure 1.4. Lupinus angustifolius (white lupins) (yellow lupins) (narrow-leaved or blue lupins)

Wide variation exists in the compositional characteristics of lupin seeds between species as well as

between cultivars of the same species and may primarily be due to genetic differences between them (Sathe et

al., 1982). Variation also exists within cultivars from different areas and are mostly influenced by

environmental and location effects (Jimenez et al., 1991). This makes animal feeding trial-comparisons

10

between lupin species and even cultivars from different areas or parts of the world extremely difficult and the

feed compounder should therefore be aware of the specific type and composition of lupins that are being used,

in order to make the best prediction of its nutritional value. The chemical and amino acid composition of the

three best known lupin species: Lupinus angustifolius, Lupinus albus and Lupinus luteus have been summarized

from literature and are presented in Table 1.8 as minimum and maximum reported values for the individual

lupin species respectively. In the following section the chemical composition of lupins will be discussed in

more detail.

Table 1.8 The chemical (% dry matter) and amino acid composition of three major lupin species

L.angustifolius 1,2, 3, 4, 5, 6, 7, 8, 9, 10

L. Albus 2, 5, 6, 8, 9, 11, 12, 13, 14, 15

L. Luteus 1, 5, 9, 16, 17

Components Min. Max. Min. Max. Min. Max.

DM 91.5 94.29 90.20 94.43 90.30 93.00 Protein (N x 6.25) 28.33 34.70 31.45 41.3 35.74 45.41 Fat 4.71 6.50 8.13 10.89 4.50 5.89 Crude Fiber 16.26 18.66 12.80 16.50 15.53 17.70 ADF 21.65 25.02 16.06 18.01 20.06 20.06 NDF 23.65 27.70 17.31 21.22 22.80 22.80 Ash 2.90 4.10 3.00 4.23 3.91 4.60 Ca 0.19 0.33 0.16 0.22 0.15 0.27 P 0.33 0.42 0.33 0.45 0.48 0.51 Mn (ppm) 17.00 70.8 404.97 3750 59.13 115

Amino acids (% Protein) Arginine 9.77 11.30 8.14 11.60 9.10 13.63 Cystine 0.80 2.10 1.08 2.29 1.49 2.47 Histidine 2.30 3.00 1.74 2.35 3.30 5.58 Isoleucine 3.40 4.51 3.10 5.01 3.50 4.99 Leucine 5.82 8.11 5.67 7.30 7.14 7.61 Lysine 4.11 5.49 3.73 5.70 4.10 6.41 Methionine 0.39 0.90 0.45 0.90 0.51 1.43 Phenylalanine 3.11 4.18 3.29 4.01 3.51 6.07 Threonine 3.11 3.85 3.39 4.29 2.71 5.05 Valine 3.40 4.23 3.07 4.30 3.65 4.25 1 Hove, 1974; 2 Batterham, 1979; 3 Barnett & Batterham, 1981; 4 Batterham et al., 1986a; 5 Múzquiz et al., 1989a; 6 Prinsloo, 1993; 7 Fernández & Batterham, 1995; 8 Brand, 1996; 9 Brand & Brundyn, 2001; 10 Steenfeldt et al., 2003; 11

Aguilera et al., 1985; 12 Kemm et al., 1987; 13 Brand et al., 1995; 14 Brenes et al., 1993;15 Olver & Jonker, 1997; 16

Petterson, 1998; 17 Seabra et al., 2001; ADF - Acid detergent fiber; NDF - Neutral detergent fiber 1.4.1 Chemical evaluation

The crude protein content of lupin seeds generally fall in the range from 28 to 45 % (dry matter) with

both L.albus and L.luteus averaging higher crude protein contents than L.angustifolius (Table 1.8). Mossé et al.

(1987) analyzed 20 samples of Lupinus albus seeds from 10 different cultivars and found an even wider

variation in protein content (23.8 – 48.4%) for that particular species. Petterson (1998) reported the typical

11

average protein values (air-dry basis) for the major lupin species to be 32.16% for L.angustifolius, 36.10% for

L.albus and 41.3% for L.luteus. The protein content of lupins compare well to the 37% protein of full fat

soyabeans (NRC, 1994), and can thus also be seen as a valuable source of protein for broiler diets. The major

proteins of lupin seeds can be divided into two main classes: albumin and globulin (conglutin), with the latter

comprising about 85% of the total protein and the remaining 15% consists of albumins. The globulin fraction

can be separated into three major proteins: conglutin α, conglutin β and a lupin-specific protein conglutin δ.

These are similar to the storage proteins of field peas, soyabeans and other legumes in terms of size and

physical properties (Petterson, 1998). There is, however, variation in the proportion of conglutin fractions

among the different lupin species (Van Kempen & Jansman, 1994), which could contribute to the differences in

functional properties of the various lupin proteins.

It is well known that pigs and poultry do not have a requirement for crude protein per se, but rather for

specific levels of amino acids. Despite this, crude protein level is often used as a guide to the amino acid

content of lupins. This could, however, affect the efficiency of use of lupins in pig and poultry diets, since large

variation exists in the crude protein content. Typical amino acid profiles for the domesticated lupin species

(Table 1.8) show that they resemble that of many other legume proteins in being low in methionine (0.39-1.43 g

/100g protein) as well as lysine (3.73-6.41 g /100g protein), but are viewed as a good source of arginine (8.14-

13.63 g /100g protein). Comparable average amino acid values (% protein) for methionine, lysine and arginine

from soyabeans are 1.38, 6.49, and 7.57 % respectively (Waldroup, 1982). Mossé et al. (1987) reported that

the proportion of lysine and alanine in each lupin species falls as the total nitrogen content increases, whereas

that of some of the non-essential amino acids rises. It should be noted that genetic engineering of some of the

more recently domesticated species of lupins have generated amino acid levels that are significantly higher than

the more traditional varieties (Atkins et al., 1998).

Energy storage within the lupin seed cotyledons comes from variable proportions of oil, oligosaccharides

and non-starch polysaccharides. The oligosaccharides provide available energy to the bird through the

successful absorption of its fermentation products (Carré et al., 1995). Lupins contain a significant amount of

oil (Table 1.8) in comparison with other grain legumes such as peas (1.37 – 2.80%) and field beans (1.20 –

1.90%) (Welch & Griffiths, 1984). The extraction thereof is, however, not economically justifiable, but it

makes a valuable contribution to the metabolisable energy value of the seed (Múzquiz et al., 1989a). Within

lupin species the oil content of L.albus (8-11%) is almost double that of L.angustifolius and L. luteus (4-7%).

According to Hansen & Czochanska (1974), the fatty acid composition of lupin oil is similar to that of

soyabean seed, but the absolute quantity and profile of lupin fatty acids was found by Jimenez et al. (1991) to

vary substantially between different species and cultivars according to environmental influences. Jimenez et al.

(1991) reported a total unsaturated fatty acid content for Lupinus albus to be between 70 and 80 %, with oleic

acid (C18:1) comprising 53 % of the total oil content. The total fat and oleic acid contents were also found to be

positively correlated. The high level of oleic acid found in Lupinus albus oil is typical for this species, whereas

Lupinus angustifolius and L.luteus usually contain more linoleic acid (C18:2), which is also characteristic of

plant oils such as corn and soyabean (Watkins et al., 1988). The linoleic acid content of L.angustifolius ranges

12

from 33.7 to 48.3 % of total oil content (Hansen & Czochanska, 1974; Jimenez et al., 1991) and provides a

valuable source of the precursor needed for the biosynthesis of the essential fatty acid arachidonic acid.

It can be seen in Table 1.8 that lupins have a high crude fiber content (12 to 18%). This is a consequence

of the thick seed coats of lupin seeds, which comprise about 30% of the seed weight for L.luteus, 25% for

L.angustifolius and 15% for L.albus (Petterson, 1998). According to classical fiber analysis for monogastric

diets, feed ingredients are analyzed for crude fiber (CF) by means of extractions with alkali and acid. Within

these CF fractions, variable portions of insoluble non-starch polysaccharides (NSPs) are also incorporated, but

it does not allow for the inclusion of soluble NSPs (Smits & Annison, 1996). Pectic substances like galactans

are abundant in lupin cell walls, but are solubilized and lost during fibre measurements, suggesting that it could

underestimate the ‘unavailable’ carbohydrate content of lupins. NSPs generally include all the polysaccharide

molecules except for starch and are classified according to Choct (2002) into an insoluble cellulosic

component, and components that are partially soluble, consisting of non-cellulosic and pectic polymers (Figure

1.5). The total NSP content of whole lupin seed (Lupinus angustifolius) is about 38% with the insoluble portion

comprising almost 89% thereof (Smits & Annison, 1996). These insoluble components have a minimal effect

on nutrient utilization by monogastrics and contribute to the maintenance of normal gut motility, due to their

ability to hold large quantities of water (Petterson, 1998). Many authors, however, have reported on the adverse

effects of soluble NSPs on nutrient availability for poultry, and this will be discussed in more detail at a later

stage. From the three major lupin species in Table 1.8, Lupinus angustifolius generally contains the highest CF

levels (16.3-18.7%), followed by Lupinus luteus (15.3-17.7%) and Lupinus albus (12.8-16.5%). Bitter lupin

varieties are also known to contain more CF than their sweet counterparts (Olver & Jonker, 1997).

Lupin seed hulls and cotyledons contain different types of carbohydrates. Lupin hulls are low in lignin

and consist predominantly of structural polysaccharides such as cellulose, hemi-cellulose and pectins, whereas

the cotyledons consist mainly of the non-structural polysaccharides of cell walls, including galactose, arabinose

and uronic acid residues (Brillouet & Riochet, 1983). They account for approximately 67%, 13% and 10%

respectively of total cotyledon NSP (Evans et al., 1993). These constituent sugars of lupin NSPs are similar to

those found in cereal grains, but are not necessarily linked in the same way. Most legumes contain pectic

polysaccharides as their main NSP, but these polymers also differ widely in terms of their molecular structures

(Choct, 2002). It is noteworthy that the cell wall material content of lupin seed cotyledons varies greatly

among species and cultivars, ranging from 7.5% to 32.1% dry matter (Brillouet & Riochet, 1983). In lupins,

the major polysaccharide is β-(1-4)-galactan, consisting of a mixture of D-galactose, L-arabinose, L-rhamnose

and galacturonic acid (Van Kempen & Jansman, 1994). Only trace amounts (0.4%) of starch are found in lupin

species (Cerning-Beroard & Filiatre, 1976; Steenfeldt et al., 2003).

13

Figure 1.5 Classification of non-starch polysaccharides (Choct, 2002).

The calcium content of lupin seeds (1.5 – 3.3 g kg -1) is higher than that for peas but lower than that of

soyabean meal, and the total phosphorous content (3.3 – 5.1 g kg -1) is similar to that of peas but much lower

than for soybean meal (Petterson, 1998). The lupin seed coats are unique in having no detectable phosphorous

(Hove, 1974). The percentage of phytate phosphorous in lupin species is comparable to the other grain

legumes. The trace mineral content of lupins is sufficiently high to make them a valuable contributor of these

essential nutrients, but is influenced by genotype and also tends to reflect the soil types on which they are

grown (Petterson, 1998). The accumulation of manganese by L.albus is well known and levels of up to 6900

ppm have been reported (Van Kempen & Jansman, 1994). That is a rather extreme value, however, and the

average manganese content for this lupin species grown in Australia (Victoria) was closer to 2287 ppm, with a

range including values from 900 to 3920 ppm (Karunajeewa & Bartlett, 1985). Very high manganese values

(4000 ppm) will reduce feed intake and growth (NRC, 1994) and may cause toxicity and lead to the oxidation

of oils and vitamins in feeds (Van Kempen & Jansman, 1994).

The availability of a raw material in a particular area plays an important role and influences the feed

compounders choice of raw materials, and thus the cost-effectiveness of feed formulation in terms of utilizing

local resources. For this thesis, one of the predominant sweet lupin species of the Western Cape namely

Lupinus angustifolius was used. The nutritional value for this particular species have been summarized from

the literature and are presented in Table 1.9. It includes the highest and lowest reported values for each nutrient

from various cultivars.

In this section, the chemical composition of lupin seeds have been described. However, quantifying these

components is only the first step in evaluating the nutritional value of lupins, and are usually well documented

in literature as indicated in Table 1.9. When dealing with poultry, however, the nutritional value of a feed

ingredient is more adequately described by the available nutrient content and should reflect closely on broiler

performance parameters such as body weight gain, feed intake and feed conversion efficiency. Unfortunately,

little work has been done on estimating the nutrient availability of Lupinus angustifolius for broilers in

particular, as illustrated by the few authors reporting on apparent or true metabolizable energy in Table 1.9. The

14

following section reviews the pertaining literature on biological analysis for poultry in terms of assessing the

available energy content of lupins.

Table 1.9 Summary of reported nutritional values for Lupinus angustifolius Components (10 % moisture basis)

Lowest reported

value

Highest reported

value

Average

Source

Ash % 2.14 3.69 2.96 1,2,3,5,8,9,12,14,15,16,17,18,19, 20

Crude Protein % 24.03 32.03 29.33 1,2,3,4,5,6,8,9,10,11,12,13,14,15,16,17,18,19, 20

Ether Extract % 3.84 7.52 5.02 1,4,5,8,9,10,11,12,13,14,15,16,17,18,19,20 C rude Fiber % 13.00 19.22 15.89 3,4,6,9,10,11,12,13,16,17,19,20 A DF % 16.29 24.64 21.04 1,3,6,8,9,11,13,14,16,17,19 N DF % 19.57 30.55 24.52 1,3,6,8,9,11,12,13,16,17 G E MJ/kg 17.47 18.53 18.02 6,9,12,14,18 A ME MJ/kg 6.71 10.46 8.73 4,13,14 T ME MJ/kg 11.07 11.07 11.07 10 TMEn MJ/kg 9.41 12.47 10.46 1,5,8 T ot Alkaloid % 0.002 0.008 0.005 7,10,16 C a % 0.17 0.30 0.22 1,4,5,9,10,11,13,20 P hosphorous % 0.29 0.41 0.36 1,4,5,9,10,11,13,20 a vail. P % 0.20 0.20 0.20 4,5,9,10,11,20 N a % 0.04 0.27 0.16 5,8,15,18,20 M g % 0.14 0.18 0.16 1,5,8,15,18,20 C u mg/kg 3.07 5.94 4.21 1,5,8,15,18,20 Z n mg/kg 31.18 39.78 34.08 1,5,8,15,18,20 M n mg/kg 24.24 63.72 38.14 1,5,8,15,18,20 F e mg/kg 39.06 51.63 46.04 1,5,8,15,18,20 1 Brand et al., 2004; 2 Steenfeldt et al., 2003; 3 Mariscal-Landín et al., 2002; 4 Swick, 2001; 5 Brand & Brundyn, 2001; 6 Edwards & Tucek, 2000; 7 Brand & Brandt, 2000; 8 Brandt, 1998; 9 Petterson, 1998; 10 Olver & Jonker, 1997; 11 Brand, 1996; 12 Fernández & Batterham, 1995; 13 Prinsloo, 1993; 14 Johnson & Eason, 1991; 15 Múzquiz et al., 1989a; 16 Batterham et al., 1986a; 17 Barnett & Batterham, 1981; 18 Batterham, 1979; 19 Pearson & Carr, 1976; 20 Hove, 1974; ADF-Acid detergent fiber; NDF-Neutral detergent fiber; GE-Gross Energy; AME-Apparent metabolizable energy; TME-True metabolizable energy; TMEn-nitrogen corrected true metabolizable energy.

1.4.2 Bioassays - Energy

Apart from species and age differences, there are a large number of factors that can influence the

bioavailable energy content of a feedstuff. The assaying method applied, the expression of results as true or

apparent metabolizable energy, correction for the nitrogen status of the bird, as well as the interaction of the

dietary components of the test ingredient with those of the assay diet are but to name a few. Consequently,

detailed information regarding the analytical methods and procedure applied should be included at all times in

order to facilitate reasonable comparisons between results.

A species difference in the bioavailable energy value of foodstuffs were investigated by Sibbald et al.

(1983) and a very close relationship between the apparent digestible energy (ADE) value for pigs and the true

metabolizable energy value (TME) for adult cockerels were found. Similar results were obtained by Sibbald et

al. (1990) when they analyzed 84 feedstuffs for available energy content and compared the results obtained

from adult cockerels (TMEn) with those from pigs (AMEn). A linear relationship was found between these

parameters in cereal-based and mixed diets.

15

Literature findings regarding the influence of age on the metabolizable energy (ME) value of poultry

diets are inconclusive, but the influence thereof was found to be negligible. Carré et al. (1995), however,

studied the differences in various nutrient digestibilities between adult cockerels and 3-week old broilers, and

found the greater apparent digestion of carbohydrates and lipids in adults to have the biggest contribution

towards the difference experienced in the AMEn value of the diet. Zelenka (1968) found a rapid decrease in the

ME of practical diets during the first days after hatching and it lasted until the 7th or 9th day, whereafter it

progressively increased until the 14th day. Thus, differences between ME values observed are dependent on the

age that is chosen for the balance periods under comparison.

Johnson & Eason (1991) reported the apparent metabolizable energy (AME) of two cultivars of

Australian sweet lupins (L.angustifolius) to be 7.2 and 9.6 MJ kg –1 DM (Table 1.9), using a rapid broiler assay

technique. Other authors also reported AME values for L.angustifolius that fall within this range, but it was

either determined with layers (Perez-Maldonado et al., 1999) or a calculated estimate using regression

equations with nutrient values of European origin (Olkowski et al., 2001). Brand & Brundyn (2001)

determined the average nitrogen corrected true metabolizable energy content (TMEn) of eight samples of

L.angustifolius for roosters (10.46 MJ kg –1 DM), and indicated a significantly higher (P< 0.05) TMEn content

for L.albus (12.49 MJ kg –1 DM). A number of authors also found L.albus to be superior to L.angustifolius in

terms of AME content for adult roosters (Guillaume et al., 1979; Karunajeewa & Bartlett, 1985; Perez-

Escamilla et al., 1988) and this could partly be contributed to the higher fat content and lower hull:kernel ratio

of L.albus in comparison with L.angustifolius. Generally, the AME of L.angustifolius for poultry is inferior to

that of other grain legumes such as field peas (11.70 MJ kg –1) and faba beans (11.04 MJ kg –1), and could be

contributed to the absence of any appreciable hindgut recovery of energy (Petterson, 1998). The high fiber

contents of lupins are also responsible for a decrease in the available energy content, but this energy-diluting

effect could be greatly improved by the dehulling of lupins. The nutritional significance of dehulling and other

processing methods that can enhance the available energy content of lupins will be discussed at a later stage in

this chapter. Similar to this section where the available energy content of lupins were discussed, the following

section will review literature on biological analysis for poultry in terms of assessing the available amino acid

content of lupins.

1.4.3 Bioassays – Amino acids

Available amino acids represent the proportion of amino acids that are in a form suitable for utilization

and are certainly a much more effective basis than ‘total amino acid content’ to formulate poultry diets with.

Unfortunately, this approach has not been widely adopted due to the lack of uniform and accurate methods of

determining amino acid availability (Papadopoulos, 1985) as well as a general lack of need and confidence on

the part of the nutritionist to switch over to formulating with digestible amino acids rather than total amino

acids (Creswell & Swick, 2001a). These authors have published a series of articles with regards to formulating

with digestible amino acids and provides important information for the nutritionist (see Creswell & Swick,

2001a; 2001b; 2001c). Methods of determining available amino acids include in vivo and in vitro approaches,

16

and must generally conform to three main criteria as described by Johnson (1992): precision, sensitivity and

ease of execution. The most common and accurate method for determining available amino acids are by means

of in vivo digestibility studies and are divided into either ileal or faecal digestibility. The advantages and

disadvantages of using these digestibility techniques, together with that of intact or caecectomized cockerels

have been discussed in detail by Johnson (1992). The combining and averaging of digestibility values as

determined by different techniques and laboratories are also strongly discouraged by Johnson (1992). The

author recommends that amino acid digestibility measurements be specifically adapted for a particular

feedstuff, since the large variation in protein contents between feedstuffs utilized in poultry nutrition, as well as

the fiber content and its influence on endogenous secretions, may lead to considerable inaccuracies.

The total amino acid composition (% protein) of Lupinus angustifolius is summarized in Table 1.10, but

due to the lack of a complete set of digestibility values for this lupin species, the reported values in Table 1.10

have been pooled to include values determined by true excreta digestibility (Prinsloo, 1993; Brand et al., 2004)

as well as apparent ileal digestibility (Creswell & Swick, 2001b). The apparent ileal digestibility method tends

to give lower estimates than those based on true digestibility measurements, and in particular lower digestibility

coefficients for threonine due to the high threonine content of intestinal secretions (Creswell & Swick, 2001b).

A high degree of variability in total amino acid values between laboratories may also be expected for

identical samples (Engster et al., 1985). There are a number of factors that contribute to the increased

variability of results. They include the specific bioassay- and analytical methods applied, expression of results

as apparent or true digestibility, the age or physiological stage of experimental animals used, as well as

between- or within-species variability (Gatel, 1994). Literature findings tend to reveal only selective

information regarding the methodology used, thereby masking some of the effects of the factors that contribute

to the increased variability of results. A need therefore exists to establish a standard, practical method for

determining and reporting the amino acid digestibility of feedstuffs, particularly for lupins and other grain

legumes.

17

Table 1.10 Summary of reported values for amino acid composition (% protein) and digestibility of Lupinus angustifolius

Amino acid composition 1 - 15Minimum reported

value Maximum

reported value Average Arginine 9.88 12.00 11.17 Histidine 2.39 2.75 2.52 Isoleucine 3.29 4.52 3.86 Leucine 6.25 7.24 6.60 Lysine 4.32 5.47 4.83 Methionine 0.41 0.72 0.58 Phenylalanine 3.43 4.25 3.74 Threonine 2.98 3.39 3.28 Tyrosine 3.11 3.51 3.31 Valine 3.04 4.25 3.68

Amino acid digestibility 1,5, 9 (%) Arginine 87.99 95.36 92.48 Histidine 87.90 92.11 89.63 Isoleucine 80.00 92.74 84.30 Leucine 86.50 93.91 89.60 Lysine 75.30 84.40 83.04 Methionine 75.30 82.35 78.96 Phenylalanine 82.90 93.16 87.60 Threonine 77.01 92.31 84.16 Tyrosine 94.87 95.79 95.28 Valine 79.04 90.08 83.57

1 Brand et al., 2004; 2 Steenfeldt et al., 2003; 3 Mariscal-Landín et al., 2002; 4 Brand & Brundyn, 2001; 5Creswell & Swick, 2001b; 6 Petterson, 1998; 7 Olver & Jonker, 1997; 8 Fernández & Batterham, 1995; 9Prinsloo, 1993; 10 Múzquiz et al., 1989a; 11 Batterham et al., 1986; 12 Barnett & Batterham, 1981; 13 Batterham, 1979; 14 Pearson & Carr, 1976; 15 Hove, 1974

What separates the inclusion of these feedstuffs from other raw material sources, is the influence of their

anti-nutritional factors on digestive functions, which results in altering the release of endogenous secretions

(Gatel, 1994). This has specific reference when using true digestibility values. These values generally takes into

account the endogenous contribution of animals fed an experimental protein-free diet, but this contribution

could differ substantially from animals fed a natural diet, especially those containing grain legumes such as

lupins, and may lead to inaccuracies in the estimation of the endogenous secretion component (Gatel, 1994).

However, one could argue that this characteristic should be taken into account when establishing a nutritional

value for lupins, and therefore it has been suggested that apparent digestibility values may be more reliable.

When using apparent digestibility values, the level of food (protein) intake becomes critical, with too low

intakes resulting in the endogenous secretion amounting to a proportionately larger part of the total digesta, thus

leading to severe underestimation of digestibility for certain amino acids. The effect of a species difference was

indicated by Batterham et al. (1986a), who found a higher digestibility coefficient for chickens (0.81-0.95) than

for pigs (0.53). Ten Doeschate et al. (1993) evaluated the influence of age on nutrient digestibility values with

18

broilers. They concluded that even though an age effect was observed, it was rather inconsistent regarding its

effect on both nitrogen and amino acid digestibilities and indicated that nitrogen does not describe true protein

digestion accurately. The authors also indicated that the method of determining faecal nitrogen (i.e. with or

without uric acid) influenced the results. If urinary nitrogen excretion is not constant (as in the case of older

chickens that tend to experience increased excretion), differences between amino acid and nitrogen

digestibilities could be observed, resulting in an underestimation of N digestibility with older chickens. This

could possibly explain the significantly lower apparent protein digestibility (N x 6.25) values for adult birds

that were observed by Carré et al. (1991), when they fed peas (Pisum sativum) to young and adult birds.

Factors that influence the availability of nutrients from lupins are mostly associated with the energy

diluting effect of CF as well as the anti-nutritive properties of oligosaccharides and NSPs. These NSPs can

influence the digestion of fat and protein in broilers (Edwards & Van Barneveld, 1998), thereby influencing the

available energy and amino acid contents. Semino et al. (1989), for instance, have characterized carbohydrates

in lupins that were bound to proteins, and resulted in interference with proteolysis. It is thus important to not

only include CF as a nutritional constraint when formulating diets for monogastrics, but also to make provision

for other dietary fiber components. Lupins have a carbohydrate content of more than 40% (Bach Knudsen,

1997), which consists of a wide range of components, including oligosaccharides and soluble NSPs. These

components do not affect digestion in the same way and to the same extent, and not even the same category of

NSP always exerts the same effect. The α-galactosides of lupins were found to produce flatulence for instance,

but the α-galactosides of peas did not (Gatel, 1994). The large variation in the physicochemical properties of

NSPs could account for their variable effect on nutrient digestibilities. Unfortunately, the relationship between

the structure and physiological activity of these polysaccharides are still poorly understood (Åman & Graham,

1990). Hence, when lupins are used in monogastric diets, the physiological effects of other dietary fiber

components must be accounted for.

It is therefore, not surprizing to find similar variation amongst literature findings regarding the maximum

inclusion level of lupins in monogastric diets. Brenes et al. (1993) found that broiler chickens can tolerate up to

25% of low-alkaloid lupin seed meal without adversely affecting growth, provided that adequate supplements

of lysine and methionine are given. The importance of supplementing lupin diets with methionine and lysine

were also indicated in several reports. Zaviezo & McGinnis (1980) fed unsupplemented diets containing sweet

L.albus seeds to day-old chicks, and found it resulted in poor growth performance. Subsequent

supplementation of methionine resulted in a significant improvement in growth and feed conversion efficiency,

however, the birds showed no response to the addition of lysine. Karunajeewa & Bartlett (1985) concluded that

broiler starter diets could contain 22.4% L.albus cv. Hamburg with no adverse effect on growth performance

when adequately supplemented to meet the chick’s requirements for methionine, lysine and metabolizable

energy. These synthetic amino acids are now competitively priced and could be added to improve the protein

value of lupins. Some authors reported a maximum inclusion level of sweet L. albus seeds in broiler diets of up

to 30% (Watkins et al., 1988; Perez-Escamilla et al., 1988) and even as high as 40% (Olver, 1987; Olver &

19

Jonker, 1997) and found no significant differences in growth and feed efficiency when compared with a lupin-

free control diet.

The level of inclusion for L.angustifolius for broiler diets has been reported to be slightly different to that

of L. albus, which could be due to the small number of authors reporting on the nutritive value and maximum

inclusion level for broiler diets of this particular species of lupin. Yule & McBride (1976) observed that

broilers fed diets containing up to 24% ground lupin seed (L.angustifolius cv. Uniwhite) grew as rapidly as

those fed wheat-based diets when these were balanced for amino acids and energy. Johnson & Eason (1990)

also found similar results with L.angustifolius cv. Yandee. The inclusion of 180 g/kg resulted in growth and

performance of broilers equal to those of the soyabean-control. A year later, the same authors observed a 2%

reduction in liveweight of broilers at 42 days when they were fed diets containing only 150 g/kg L.angustifolius

from Victoria, Australia (Johnson & Eason, 1991). Although this difference was not significant, the authors

suggested that such inclusion levels could result in an economic loss. When interpreting these results, however,

it should be noted that the diets were formulated on a total amino acid basis, and no allowance were made for

differences in nutrient digestibilities between that of lupins and soybean meal. The use of different

L.angustifolius cultivars could also have influenced the results and highlights the need to establish a complete,

reliable database of nutritional information regarding the local lupin species and cultivar. The highest inclusion

level of L.angustifolius for broilers was at 40%, when Olkowski et al. (2001) fed diets containing the cultivar

Troll for 21 days and experienced significant decreases in feed intake and growth rate in all birds fed lupin-

based diets. Acute signs of toxicity were also observed in some individuals. This was, however, the only study

reporting on adverse effects of such magnitude due to the feeding of sweet L.angustifolius to broilers. The

feeding of bitter varieties of lupins should be avoided, since the anti-nutritive properties of the alkaloids

suppress both feed intake and growth (Guillaume et al., 1979). Results reported by Olver & Jonker (1997),

support these findings, as the 6-week old broilers fed on the 40% bitter lupin diet weighed only 72% of and

consumed only 88% of the food eaten by those broilers on the soyabean control diet. These effects were also

more marked during the initial 3-week feeding phase. Halvorson et al. (1983) found that the inclusion of 20%

L.albus cv. Ultra had no adverse effects on the growth performance of young turkeys, but 30% or more white

lupins depressed weight gains significantly. These findings were also supported by Perez-Escamilla et al.

(1988), who showed that diets containing 40% or 60 % lupins significantly reduced food intake and weight gain

for turkey poults.

Farrell et al. (1999) recommended an optimum inclusion of sweet lupins (L.angustifolius cv. Gungurru)

for broiler starter diets to be less than 10% but slightly higher (12-15%) for finisher feeds. The reason being

that older birds appear to be better adapted to withstand the incidence of increased gut viscosity and wet

droppings that are usually associated with the feeding of high levels of lupins. Constraints on the maximum

inclusion level of lupins in broiler diets are not necessarily due to drops in production above this level, but due

to the incidence of wet-sticky droppings that may be promoted by high levels of lupin NSPs. These wet-sticky

droppings pose a health risk to broilers through adverse affects on litter moisture levels and respiratory stress

from high ammonia levels.

20

The high incidence of wet-sticky droppings is not of great concern for caged laying birds. Edwards &

Van Barneveld (1998) indicated that a maximum inclusion level of 25-35% of raw L.angustifolius or L.albus

will not affect laying performance. The results are in agreement with those of Prinsloo et al. (1992), where the

inclusion of 30% raw, sweet L.albus seeds had no deleterious effect on performance and egg quality of laying

hens. Perez-Maldonado et al. (1999) concluded that sweet lupins (L.angustifolius cv. Gungurru) also support

excellent production when included in layer diets at 25%, but warns that the incidence of increased digesta

viscosity could warrant even lower inclusions. Watkins & Mirosh (1987), however, found that the inclusion of

25% raw lupins (L.albus cv. Ultra) resulted in lower egg weights and egg production also dropped when 30%

raw lupins were fed for 32 weeks. Similar to broiler diets, it is recommended that raw lupins should not be

included in excess of 10-15% in layer diets, since the higher inclusion levels may increase the incidence of dirty

eggs as a result of the wet droppings, even though laying performances are not jeopardized. Lupins appear to

be an excellent source of egg yolk pigment. El-Difrawi & Hudson (1979) determined the carotenoid content of

several lupin species with L.angustifolius containing 133 mg/100g β-carotene and 500 mg/100g zeaxanthin,

which suggest that they are good sources of provitamin A for animal feeds. The mean egg yolk colour score

was significantly (P<0.001) affected by lupins as well as the level of lupins, with the highest yolk colour score

of 8.86 (Roche yolk colour fan) observed when hens were fed 25% lupins (Watkins & Mirosh, 1987).

Other applications of lupins in monogastric nutrition include that of a protein source for pig diets. The

Standing Committee on Agriculture in Australia recommends an inclusion level of L.angustifolius for pig

starter or weaner diets at 10-15%, for grower diets at 20-25%, for finisher diets at 30-35% and dry and lactating

sow diets can include 20% lupins. This recommendation have been supported by various authors who have

successfully incorporated seeds of L.angustifolius in diets for grower-finisher pigs (Taverner, 1975; Pearson &

Carr, 1976; Batterham, 1979; Barnett & Batterham, 1981) when these diets were adequately supplemented with

the limiting amino acids lysine and methionine. Pearson & Carr (1977) evaluated the inclusion of

L.angustifolius and L.albus in diets for growing-finishing pigs and found considerable differences between the

species regarding their suitability as protein sources. They concluded that either of the two L.angustifolius

cultivars (Uniwhite or Uniharvest) could be included at levels of up to 43%, supporting similar growth rates

and feed efficiency of the barley-based control, but that the inclusion of L.albus cv. Neuland resulted in severe

feed refusal. The high manganese content (1303 ppm) as well as the alkaloid content (0.09%) and composition

(Ruiz et al., 1977) of this particular lupin cultivar has contributed to the undesirable effects. Other authors

experienced similar results of depressed feed intake and growth with the inclusion of various cultivars of

L.albus seeds in pig diets (Kemm et al., 1987; Donovan et al., 1993; Ferguson et al., 2003). Together with the

more variable results obtained with L.albus than with L.angustifolius (Farrell et al., 1999) it has lead to the

conclusion that pigs do not perform as well on L.albus when compared to L.angustifolius, and this specific

lupin species is currently not recommended for use in pig diets.

21

1.4.4 Anti-nutritional factors in Lupins

All legumes contain a number of ANFs which interfere with nutrient availability to various extents, and

whose presence is responsible for reports of suboptimal animal performance and sometimes even toxicity. It

should be kept in mind that the sensitivity to these ANFs appears to be influenced by species and age of

animals, and varies according to the different ANFs under consideration. For instance, chickens were found to

be more sensitive to saponins than pigs, but in the case of tannins they were less sensitive than piglets

(Huisman & Tolman, 1992). On the other hand, older birds appear to be more tolerant towards the ANFs of

chick peas than younger birds (Farrell et al., 1999), but this is again dependent on the source of ANFs, since the

opposite has been found for beans (Davidson, 1973), where chicks seem to be the least effected between the

two age groups.

The main ANF that limits the use of lupins in monogastric diets is their alkaloid content (Edwards & Van

Barneveld, 1998). Alkaloids reduce the palatability of lupin-containing diets, and for monogastric animals even

relatively low alkaloid contents can suppress feed intake and growth (Olver, 1994). Poultry appear less

sensitive to alkaloids than pigs (Huisman & Tolman, 1992). Guillaume et al. (1979) observed a significant

decrease in food intake, growth and food efficiency of broiler chickens, when the amount of sweet lupins in

their diet were replaced by increasing levels of lupin alkaloids, mainly lupanine.

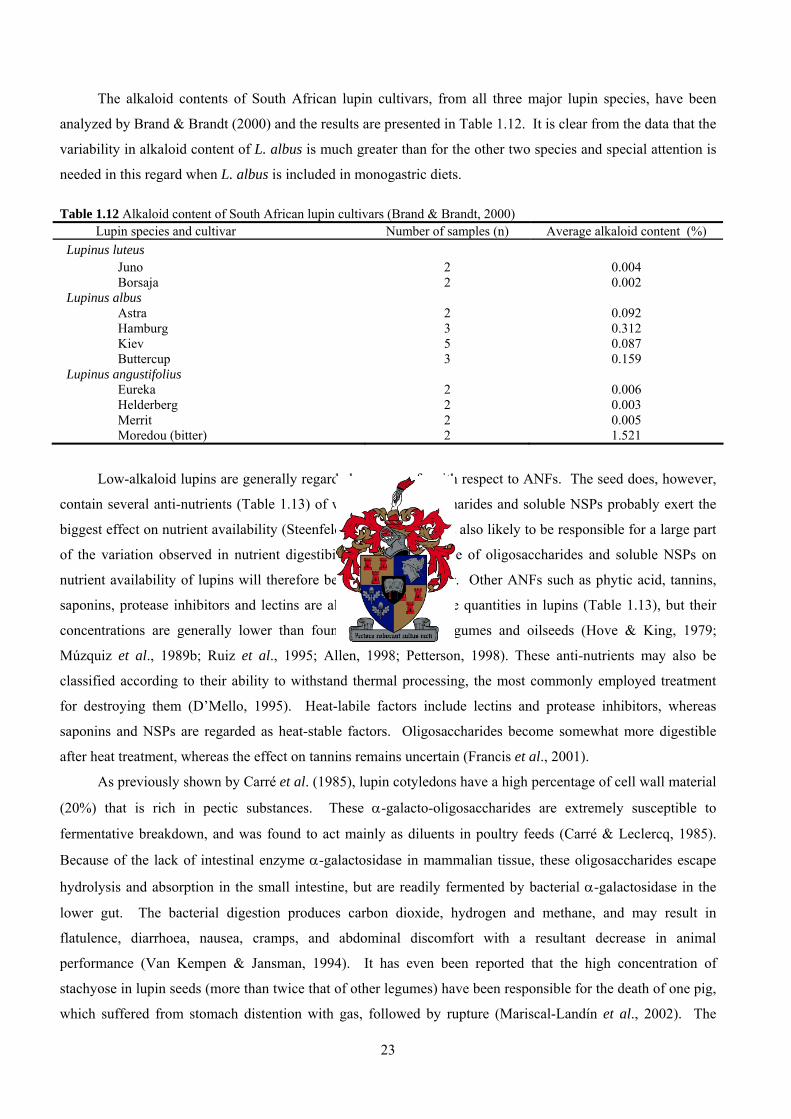
Lupins contain variable levels of quinolizidine alkaloids with the total content varying from 0.1-4% in

bitter varieties to < 0.1% in sweet varieties. The most common alkaloids are lupanine, sparteine, lupinine and

angustifoline (Petterson, 1998). The various proportions of these alkaloids in three species of lupins are

presented in Table 1.11. In L.albus and L.angustifolius the major alkaloid present is lupanine, while in L.luteus

it is lupinine.

Table 1.11 Total alkaloid contents (g/kg) and proportions of alkaloid components (%) in three species of Lupinus (Múzquiz et al., 1989b) L.angustifolius L. albus L.luteus Total alkaloid content (g/kg) 0.0 – 15.0 0.0 – 38.0 0.4 – 19.0

Lupanine (%) 21.8 – 66.6 80.7 – 98.7 _ Angustifoline (%) 20.2 – 49.5 0.0 – 0.8 _ Sparteine (%) _ _ 0.0 – 2.5 Lupinine (%) _ _ 35.2 – 100.0 Gramine (%) _ _ 0.0 – 11.0

Plant breeders have successfully cultivated sweet lupin varieties with low (< 0.1%) alkaloid contents and

even with prolonged intake of these sweet lupin seeds, there should be no concern regarding toxicity.

Contamination with bitter seeds, however, could result in lupinosis (Olver, 1994). Lupinosis is a mycotoxicosis

that is primarily recognized as a disease of sheep, but natural outbreaks have also been reported in cattle, goats,

donkeys, horses and pigs (Allen, 1998). It is mainly characterized by severe liver damage, which results in

inappetence, loss of condition, lethargy and often death. Neural inhibition have been reported as the primary

metabolic effect of alkaloids (Huisman & Tolman, 1992).

22

The alkaloid contents of South African lupin cultivars, from all three major lupin species, have been

analyzed by Brand & Brandt (2000) and the results are presented in Table 1.12. It is clear from the data that the

variability in alkaloid content of L. albus is much greater than for the other two species and special attention is

needed in this regard when L. albus is included in monogastric diets.

Table 1.12 Alkaloid content of South African lupin cultivars (Brand & Brandt, 2000)

Lupin species and cultivar Number of samples (n) Average alkaloid content (%) Lupinus luteus

Juno 2 0.004 Borsaja 2 0.002

Lupinus albus Astra 2 0.092 Hamburg 3 0.312 Kiev 5 0.087 Buttercup 3 0.159

Lupinus angustifolius Eureka 2 0.006 Helderberg 2 0.003 Merrit 2 0.005 Moredou (bitter) 2 1.521

Low-alkaloid lupins are generally regarded as very safe with respect to ANFs. The seed does, however,

contain several anti-nutrients (Table 1.13) of which the oligosaccharides and soluble NSPs probably exert the

biggest effect on nutrient availability (Steenfeldt et al., 2003). It is also likely to be responsible for a large part

of the variation observed in nutrient digestibilities. The influence of oligosaccharides and soluble NSPs on

nutrient availability of lupins will therefore be discussed hereafter. Other ANFs such as phytic acid, tannins,

saponins, protease inhibitors and lectins are also found in variable quantities in lupins (Table 1.13), but their

concentrations are generally lower than found in most other legumes and oilseeds (Hove & King, 1979;

Múzquiz et al., 1989b; Ruiz et al., 1995; Allen, 1998; Petterson, 1998). These anti-nutrients may also be

classified according to their ability to withstand thermal processing, the most commonly employed treatment

for destroying them (D’Mello, 1995). Heat-labile factors include lectins and protease inhibitors, whereas

saponins and NSPs are regarded as heat-stable factors. Oligosaccharides become somewhat more digestible

after heat treatment, whereas the effect on tannins remains uncertain (Francis et al., 2001).

As previously shown by Carré et al. (1985), lupin cotyledons have a high percentage of cell wall material

(20%) that is rich in pectic substances. These α-galacto-oligosaccharides are extremely susceptible to

fermentative breakdown, and was found to act mainly as diluents in poultry feeds (Carré & Leclercq, 1985).

Because of the lack of intestinal enzyme α-galactosidase in mammalian tissue, these oligosaccharides escape

hydrolysis and absorption in the small intestine, but are readily fermented by bacterial α-galactosidase in the

lower gut. The bacterial digestion produces carbon dioxide, hydrogen and methane, and may result in

flatulence, diarrhoea, nausea, cramps, and abdominal discomfort with a resultant decrease in animal

performance (Van Kempen & Jansman, 1994). It has even been reported that the high concentration of

stachyose in lupin seeds (more than twice that of other legumes) have been responsible for the death of one pig,

which suffered from stomach distention with gas, followed by rupture (Mariscal-Landín et al., 2002). The

23

energetic efficiency of the volatile fatty acids that are generated by hindgut fermentation of cell wall

polysaccharides, is considerably lower than the sugar release in the small intestine, and in the case of pigs, this

could create a wider disparity between the apparent digestible energy and the net energy values for lupins

relative to other feedstuffs. The oligosaccharides, however, also play a role in the osmotic regulation of the

gastrointestinal tract, which may be beneficial (Petterson, 1998).

Table 1.13 Comparing anti-nutritional factors in lupins to those of other legumes (Allen, 1998)

LUPINS SOYABEAN FIELD PEA

ANTI-NUTRITIONAL FACTORS L.angustifolius L.albus Glycine max Pisum sativum

Oligosaccharides (%) 5.16 6.69 5.75 3.69 Phytic acid (%) 0.58 0.79 1.59 0.48 Tannins total (%) 0.32 0.37 0.57 0.25 Tannins condensed (%) < 0.01 0.01 - 0.06 Saponins (%) 573 10 – 23 3500 1800 Trypsin inhibitors (mg/g) 0.14 0.13 17.9 1.01 Chymotrypsin inhibitors (mg/g) 0.08 - - 1.60 Lectins (dilutions) ND ND > 4 4 ND = not detected

The anti-nutritive properties of some NSPs for poultry have been clearly demonstrated with rye (Bedford

et al., 1991), wheat (Choct & Annison, 1992) and barley (Campbell et al., 1989). It is especially the water-

soluble portion, about 4-7% of L.angustifolius (Evans et al., 1993) that is considered to have an anti-nutritional

effect. The mechanisms by which soluble NSPs exert their anti-nutritive effect are complex and have been

studied by various authors (Smits & Annison, 1996; Chesson, 1990). In addition to the direct impairment of

nutrient absorption by high gut viscosity (Mohanna et al., 1999), the detrimental effect of soluble NSPs on bird

performance appears to be indirectly related to a proliferation of fermentative microflora in the small intestine

(Carré et al., 1995; Choct et al., 1996). These microflora can compete directly with the host for potentially

absorbable substrates if the absorption rates are reduced by the presence of viscous polysaccharides (Chesson,

1990). As a result of these microbial effects, an overestimation of nutrient uptake by the bird can occur when

faecal digestibility values are estimated for diets that are high in soluble NSPs, and have special reference when

determining the AME value of a diet (Choct et al., 1996). The soluble portion of total NSP content in sweet

lupins (6.7%) is almost twice that of other grain legumes such as field peas (3.25%) and faba beans (3.1%) and

Perez-Maldonado et al. (1999) found these high NSP contents to be in accordance with the higher gut viscosity

observed in laying hens. The increased digesta viscosity will decrease the rate of diffusion of substrates and

digestive enzymes, as well as interfering with their effective interaction at the mucosal surface. Viscous NSPs

may also be able to entrap bile salts and thereby reducing their effectiveness in solubilizing the fat components

and subsequently lipid absorption (Smits & Annison, 1996). These soluble polysaccharides are also related to

the incidence of wet-sticky droppings, which as discussed in this section is one of the major factors limiting the

inclusion of lupins in broiler diets (Chesson, 1990).

24

Theoretically, the adverse effects of soluble NSPs on growth could be diminished with the addition of

enzymes that depolymerize the NSPs, leading to reduced viscosity of the gut contents and improved nutrient

absorption. The addition of exogenous enzymes to lupin diets has, however, been met with variable results.

Reported improvements ranged from no effect to a significant increase in digestibility, AME content and

performance (Brenes et al., 1993; Annison et al., 1996 and Kocher et al., 2000). The use of exogenous

enzymes is beyond the scope of this study, but in the following section dealing with processing methods of

lupins, some literature findings regarding the use of exogenous enzymes will briefly be mentioned.

1.4.5 Processing of Lupins

Even though sweet lupins do contain a few ANFs, they are mostly at low concentrations. Unlike whole

soybeans and many other grain legumes, lupins do not require specific heat treatments to destroy the heat labile

ANFs that may interfere with nutrient availability. It is, however, evident from the literature that the nutritive

value of lupins is not as high as would be predicted from knowledge of its chemical composition. Several

methods of processing have been tested to improve the nutritional value of lupins, particularly through the

destruction of anti-nutritional factors and possibly through increased accessibility of protein to enzymatic

hydrolysis.

One way to counteract possible anti-nutritive effects caused by both the NSPs and α-galactose-

containing oligosaccharides in lupins is to supplement the diets with enzymes to degrade these carbohydrates.

The response to mixed enzyme supplementation is extremely variable, but tends to be greater for diets with a

high cell wall content (Wiryawan et al., 1997), as well as high NDF and low ME values (Wiryawan et al.,

1995). Brenes et al. (1993) supplemented lupin-based diets with crude enzyme preparations (combinations of

carbohydrases, proteases and galactosidases) and found that it resulted in substantial improvement in terms of

weight gains and feed efficiency for chickens. The same improvement in nutritive value, however, was not

observed when α-galactosidase was added to dehulled lupins (Brenes et al., 2003). It has been suggested that

the α-galacto-oligosaccharides (raffinose and stachyose) do not greatly affect chick performance, and this may

contribute to the lack of significant response in chick performance when these enzymes are added (Brenes et

al., 2003). Protease, xylanase and cellulase enzymes were added to broiler mash diets, containing 40% L.albus

seeds, to investigate the possible improvement in the growth depression and reduced feed efficiency that was

induced by the lupin-based diet. Supplementation of the diet with either xylanase or cellulase improved

performance, by reducing the deleterious effects of cellulose and NSP, but no benefit was observed with the

addition of protease or a mixture of the enzymes (Naveed et al., 1998). Kocher et al. (2000) also showed that

the addition of a commercial enzyme preparation to a lupin-based diet for broilers resulted in a significant

increase in the ileal digestibility of NSP. This was mainly related to the digestibility of glucose, xylose,

arabinose and polymers that were found predominantly in the hull fraction. The effect of enzymes on the NSPs

of lupins could have resulted in an improvement in their fermentability in the hindgut (increased solubility),

leading to an improvement in AME of the diet (Annison et al., 1996). The inclusion of pectinases, however,

maintained high digesta viscosity, but this in turn did not result in a depression of growth performance or

25

protein digestion (Annison et al., 1996; Kocher et al., 2000). The mechanism of enzymatic hydrolysis is

substrate specific, and because of the highly variable content and composition of non-starch polysaccharides in

lupins, it is not surprizing to find just as many inconclusive results regarding the effect of enzyme

supplementation. The benefits, in terms of improved bird performance, that have occasionally been observed

with the appropriate enzyme supplementation, provides a challenge for further research into this field, but the

difficulty in determination of individual NSP components that serve as substrates, will first have to be

addressed.

The lupin seed coat has a negligible protein value and more than 50% CF, which is of limited nutritional

value to monogastrics. At 20 to 25% of the seed, the hull substantially dilutes the protein nutritional value

(Hove, 1974). In pigs there are partial recovery of the energy in lupin hulls via hindgut fermentation, but in

poultry they act mainly as diluents. Removing the hull, will therefore lead to an increase in the CP and fat

content with a decrease in the CF content. The chemical and amino acid composition of whole lupin seed, -

kernels and -hulls of L.angustifolius cv. Gungurro are presented in Table 1.14.

Table 1.14 The chemical and amino acid composition (%, air-dry basis) of whole lupin seed, dehulled lupin seed and lupin hulls (Fernández & Batterham, 1995)

Composition (%) Whole lupin seed meal Dehulled lupin seed (kernel)

Lupin hulls

Approximate yield 100.00 75.00 25.00 Dry matter 92.20 92.60 94.00 Crude protein (N x 6.25) 31.10 40.50 5.60 Crude Fat 4.60 7.60 1.50 Crude Fiber 17.20 5.10 61.90 NDF 31.30 11.00 7.47 S-NSP 15.00 19.70 7.60 I-NSP 31.50 13.00 70.90 Ash 3.00 2.86 6.67 Alkaloids 0.07 0.13 <0.01 Gross energy (MJ/kg) 17.90 19.30 15.80

Essential amino acids Lysine 1.60 2.00 0.39 Methionine 0.16 0.21 <0.4 Cystine 0.25 0.31 <0.3 Valine 1.30 1.70 0.29 Threonine 1.20 1.50 0.24 Histidine 0.80 1.10 0.13 Isoleucine 1.40 1.90 0.25 Leucine 2.20 2.90 0.40 Tyrosine 1.20 1.60 0.18 Phenylalanine 1.30 1.70 0.25

NDF, Neutral detergent fiber; S-NSP, Soluble non-starch polysaccharides; I-NSP, Insoluble non-starch polysaccharides.

It should be noted that the actual kernel:hull ratio in lupin seed is approximately 80:20 but in the

commercial dehulling process the yields are closer to 75:25 due to some kernel chips and flour being removed

with the hulls during the dehulling process (Edwards & Van Barneveld, 1998). For the same reason the protein

content of the lupin seed components (kernels and hulls) as reported in Table 1.14, are not always achieved

with commercial dehulling, where values closer to 35% for the kernel and 7-10 % for the hulls are more

common (Petterson, 1998). The dehulling of L.angustifolius increased the protein (40.5 vs. 31.1%), fat (7.6 vs.

26

4.6%) and lysine content (2.0 vs. 1.6%) in relation to the whole lupin seed. The removal of the fibrous hull of

lupin seed also resulted in a kernel component with a substantially reduced CF (5.1 vs. 17.2%) and insoluble

NSP content (13.0 vs. 31.5%). Fernández & Batterham (1995) also reported that dehulled lupins increased the

digestible energy content and the ileal digestibility of amino acids (lysine, 0.88 vs. 0.82) for pigs.

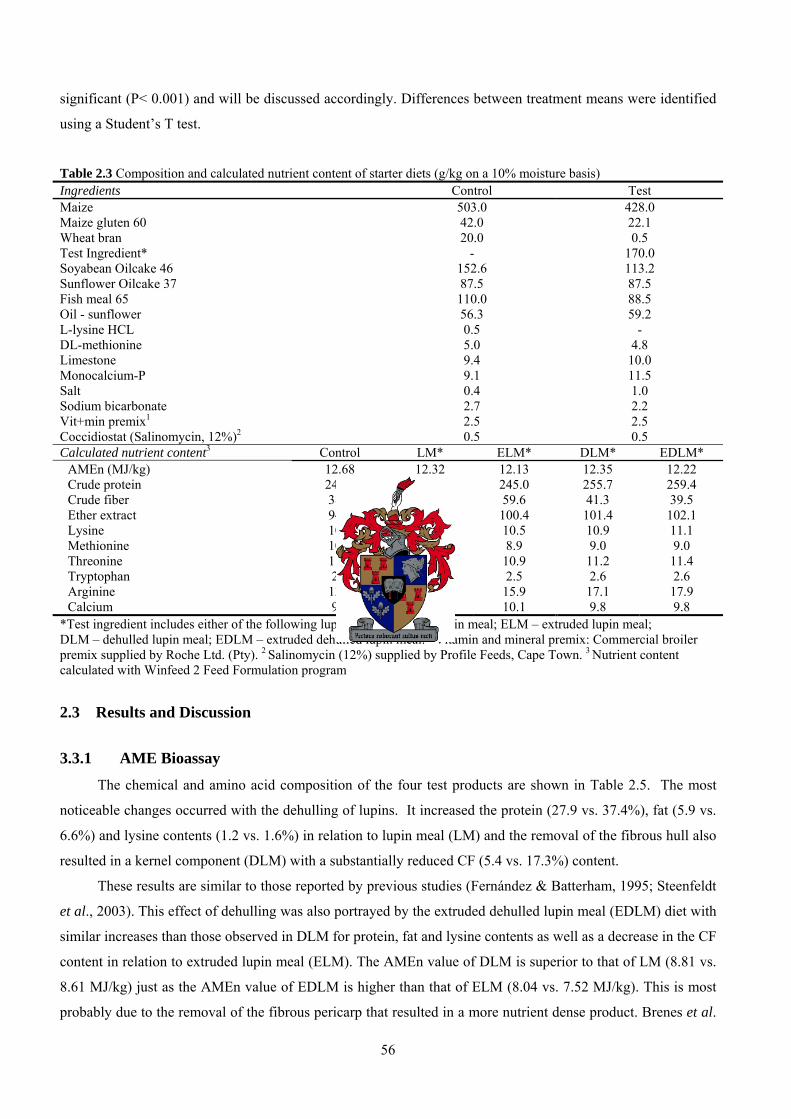
Steenfeldt et al. (2003) reported a 30% increase in the protein value (445 g/kg DM) as well as the fat

content (94 g/kg DM) of L.angustifolius cv. Emir with dehulling. The total NSP content of the seed was also

reduced from 45% to 32.3%, seeing as though the major portion of NSPs are located in the hull (824 g/kg DM).

This could explain the higher digestibility of energy (+18%) and that of protein (+7%) observed when Brenes et

al. (1993) compared dehulled to whole lupins. Improved broiler weight gains (151g vs. 135g) and feed to gain

ratios (1.66 vs.1.78) were also observed for the dehulled lupin diet after an 8-day feeding trial (from 10 to 17

days of age), but these differences were not significant when compared to the whole lupin diet. Lupin kernels

tend to be of greater economic value to poultry than the whole lupin seed, but the economics of dehulling are

dependent on the opportunity to be able to utilize the hull component effectively. Lupin hulls could be

incorporated into ruminant or sow diets, and even as diluent in pig finisher diets (Edwards & Van Barneveld,

1998). Brand (1996) concluded that the dehulling of lupins could increase its value by 30%.

The successful processing of lupins also depends on the physical properties of the seed and to what

extent it complements the processing techniques. The spherical character of the seed provides good flowing

attributes and ease of handling at the processing plant and can easily be crushed or ground. The fine grinding

of lupins is especially important when included in pig diets, since it has been found that coarse crushing reduces

the digestible energy value of lupins (Edwards & Tucek, 2000). Consequently, the authors recommended a

hammer mill screen size of 3.0 to 3.25 mm in diameter. The high fiber content of the lupin hull and the rubbery

nature of the kernel fraction provides some resistance to grinding, and usually results in a lower throughput rate

for lupins than for grain. The production rate through the pellet press on the other hand, depends largely on the

conditioning parameters such as temperature, time and steam, with high steam and fine grinding accentuating

the “stickiness” associated with the high NSP content of lupins (Edwards & Tucek, 2000). This property is

extremely useful as a pellet binder and improves pellet quality. Edwards & Tucek (2000) suggested that these

advantages will even offset the reduced throughput rate of lupins at the pellet press. Another positive attribute

of lupins is the deep golden colour of the lupin seed endosperm, which enhances the physical presentation of

the feed, especially in mash diets.

The absence of significant levels of heat-labile ANFs in lupins, such as protease inhibitors and lectins

that are found in other legume species, could limit the improvement in the nutritive value of lupins when

subjected to heat treatments. The benefits of thermo-mechanical treatments such as pelleting or extrusion are

therefore more likely to be contributed to the breakdown of the cell walls, which allows accessibility of

nutrients to digestive enzymes, rather than to the inactivation of ANFs (Gatel, 1994). This was illustrated by

Farrell et al. (1999) who steam-pelleted (70 – 80°C) legume diets and observed improved broiler growth rates

and feed conversion ratios for all diets fed from 0 to 42 days. While the beneficial influence of steam pelleting

on the productive energy value of some poultry diets have been shown (Reddy et al., 1962), it appears as if the

27

effects are more pronounced when the feedstuff contains high levels of fiber or heat labile growth depressants.

The differences in energy availability attributed to the steam pelleting process may reflect differences in energy

expenditure during the act of eating (birds spend more time and energy consuming a mash diet than pellets), as

well as differences in feed consumption, since broilers are known to consume more food in pelleted form than

in a mash form (Reddy et al., 1962). This effect on voluntary feed intake could have influenced the increased

AME values observed for pelleted vs. mash diets, but due to the fact that TME values are independent of feed

intake levels, it is not surprizing to find that steam pelleting will not influence the TME value of poultry diets

(Sibbald, 1977b).

To use heat treatments effectively, the temperature and duration of processing have to be carefully

controlled. Excessive heating can result in reduction of protein solubility and may even destroy or reduce the

availability of certain amino acids, especially lysine. Van Barneveld et al. (1993) reported that the availability

of lysine from heat-treated peas for pigs was decreased by 21% when the heating temperature was increased

from 110 to 150 °C for 15 min. With prolonged or elevated heating, basic amino acids such as lysine, undergo

a Maillard reaction that reduces their digestibility and biological availability. This process is characterized by

the nonenzymatic browning reactions that occur between the ε-amino group of lysine and the carbonyl groups

of reducing sugars such as the oligosaccharides raffinose and stachyose (Parsons et al., 1992). Consequently,

the heat treatment of feedstuffs such as lupins with a high content of these sugars will have to be monitored

carefully. However, the damage to proteins that are heated in the absence of carbohydrates have also been

studied (Bjarnason & Carpenter, 1969; Varnish & Carpenter, 1975), and it has been found that cross-linkages in

proteins can also occur with the amide groups of asparagine and glutamine during severe heat treatment. These

cross-linkages generally reduce the rate of protein digestion by hindering enzyme attack in vivo (Hurrel et al.,

1976). The influence of temperature and duration of heat treatment on the nutritional value of oilseeds such as

soyabeans (Herkelman et al., 1993; Perilla et al., 1997) and sunflowers (Zhang & Parsons, 1994) have been

well documented and guidelines exist regarding the optimum processing conditions. However, when it comes

to legumes and other feedstuffs that are not readily heat treated, very little information exists. The biological

response to heat treatment will depend on the composition of the feedstuff as well as the presence of heat-labile

ANFs. The extended steam heating of Phaseolus vulgaris beans from 40 to 80 min. resulted in lower weight

gains and higher feed conversion ratios in piglets (Van der Poel, 1990). It is therefore important to find the

exact conditions of heating for a specific feedstuff that will maximize the improvement of the nutritive value,

but without implicating the economics of processing.

Heat treatment of L.albus seed has been shown to produce variable effects on nutrient utilization (Boldaji

et al., 1986) and hen performance (Watkins & Mirosh, 1987). The treatment procedure used by Boldaji et al.

(1986) included cooking the lupin seeds in boiling water for 30 or 60 minutes, as well as autoclaving at 120°C

for 15, 30 and 60 min. respectively. The GE, TME and TMEn content for White Leghorn roosters were

determined and the results are presented in Table 1.15.

It is noteworthy that these procedures were conducted at different time periods (Experiment 1 & 2 in

Table 1.15). The authors reported a significant improvement in the TME and TMEn values when the

28

autoclaving time was increased from 15 to 30 min. During experiment 2, they found that the TME and TMEn

values for lupin seed could be improved with 30 minutes cooking and 60 minutes autoclaving, but that

prolonged cooking (60 min.) resulted in a small numerical decrease in the available energy content. In

aggreement with these results Ravindran & Blair (1992), showed that a relatively short period of cooking could

improve the biological value of protein, whereas extended cooking, on the other hand, could adversely affect

protein quality and should be avoided. Other researchers have also examined the effect of autoclaving on the

nutritive value of lupins for poultry (Watkins & Mirosh, 1987; Perez-Escamilla et al., 1988; Brenes et al.,

1993) and pigs (Batterham et al., 1986a,b), but have either showed no beneficial effects, or the results were

inconsistent. The potential damage of protein with autoclaving, however, is high because of the long treatment

times. It is also an impractical process for large-scale commercial production and are only used on an

experimental basis.

Table 1.15 Effect of autoclaving and cooking on gross energy (GE), true metabolizable energy (TME) and nitrogen corrected TME (TMEn) content of Lupinus albus seed (adapted from Boldaji et al., 1986) Treatment GE TME1 TMEn1

MJ/kg MJ/kg Experiment 1

Raw 20.21 12.05 ab 9.46ab

Autoclaved, 15min. 20.50 10.50 a 8.45 a

Autoclaved, 30 min. 21.63 13.26 b 10.84 b

Experiment 2 Raw 20.20 10.96 a 9.58 a

Cooked, 30 min. 20.05 11.80 a 10.25 a

Cooked, 60 min. 20.38 10.59 a 9.50 a

Autoclaved, 60 min. 20.59 11.92 a 10.75 a

1Each value is the mean of 3 determinations. abMean values within a column with different superscripts are significantly different (P<0.05).

Other alternative processes have been developed where feed or feed components are treated by extrusion.

The extrusion method utilizes friction as the sole source of heat, accompanied by pressure. Heat and pressure

are developed by passing the product through an extruder barrel by means of a screw with increasing

restrictions. Then, the sudden decrease in pressure when the product is discharged through the die into the

atmosphere results in expansion of the product. By vaporizing moisture, cell structures are ruptured. The

amount of expansion depends on several factors, such as the composition of the product, temperature, pressure

and the amount of moisture (Woodroofe, 1999). Traditionally the dry extruder was used solely for the

processing of whole soybeans, since the high internal oil content of the beans acted as lubricant during the

extrusion process and the addition of moisture was thus not necessary (Woodroofe, 1999). However, more

recently it has been shown that preconditioning the soyabeans with steam prior to extrusion, has lead to more

efficient processing of the oilseed (Woodroofe, 1999). Extruders are simple screw machines, but can be

extremely versatile in their application, with or without steam preconditioning. During extrusion it is the

cooking process (as the product moves through the barrel with increasing heat) as well as the expansion process

(as the product explodes from the die opening to the atmosphere) that are responsible for the changes occurring

29

in the major constituents of feed materials. These changes that occur with extrusion have been researched by

Woodroofe (1999) and will briefly be discussed in terms of protein, starch, fat and fiber.

The cooking action of extrusion creates sufficient heat to break down the secondary bonds of protein, but

does not adversely affect the primary bonds between amino acids. It is this effect of denaturization that is

useful, since the mild breakdown of protein structure could improve digestibility. Also many proteinaceous

constituents inhibit normal digestion (trypsin inhibitors in soyabeans) or reduce shelf life of products (lipase in

rice bran), and could therefore be inactivated by extrusion.

Raw starch has little water holding capacity, but when heated in the presence of water, the starch

granules swell and then break up to form a more homogenous, loosely packed structure that resembles a gel.

This process of conversion of starch from the raw state to the gel state is known as gelatinization. Gelatinized

starches have a strong binding ability and tend to be more digestible than raw starch. The relevance of

gelatinization in monogastric nutrition has been reviewed by De Wet (2000), but this is not considered to be of

special interest to our study with lupins, since the legume contains too little starch to influence the nutritive

value thereof through extrusion.

The main effect of extrusion processing on fats are the release of the fat or oil that is encapsulated within

the cells by either the shear force or expansion of the product once it makes contact with the atmosphere. The

fat quality in terms of off odors and oxidation, will also not be adversely affected by the heat generated from

extrusion.

The effect of extrusion on fiber is related primarily to its bulk density. The mechanical action of the

extruder breaks up and compresses the fibrous material, thereby changing their bulk density. High fiber

ingredients such as lupins are normally low in moisture and also take on moisture slowly. These materials

usually require some type of pre-conditioning with extrusion.The beneficial nutritional effects of extrusion will

vary with species, age and type of ration being fed, but in general these benefits can be summarized in terms of

the change that occurs in the protein, energy and fiber content of the ration.

Plavnik & Sklan (1995) examined the effect of short time extrusion processing on the digestibility of

energy and nutrients of feeds and grains in 18-21 day old broiler chicks (Table 1.16). A complete maize-based

feed or wheat or barley were exposed to extrusion (125°C) and compared with the same untreated material. All

diets were subsequently milled to equal size. The results are presented in Table 1.16.

The extrusion of complete diets enhanced the GE digestion and increased the AME and AMEn values by

1.5 and 3.5% respectively. The extrusion of wheat or barley and their addition to basal diets also resulted in

similar increases in their AME and AMEn values. The main contributor towards the increases observed for

AME and AMEn values of maize-based diets was due to enhanced fatty acid digestion. It is the mechanical

shear force during extrusion processing that ruptures oil cells and thereby influencing the fatty acid digestion.

Since this was not the case for the wheat- and barley diets, it has been suggested that a change in the digestion

of other non-starch carbohydrate fractions could have resulted from the heat treatment, as was previously

demonstrated by Choct & Annison (1992). This could have important implications for legumes such as lupins

that are high in NSPs.

30

Table 1.16 Effect of extrusion on apparent digestibilities of nitrogen (N), fatty acids, starch, gross energy (GE), apparent (AME) and nitrogen-corrected (AMEn) metabolizable energy of maize or wheat/barley based diets (Plavnik & Sklan, 1995)

N Fatty acids Starch GE AME AMEn % % % MJ/kg MJ/kg MJ/kg

Maize-based diets Mash 68.0 75.8b 96.9 79.4 b 14.19 b 13.04 b

Extruded 69.8 81.3a 97.7 80.2 a 14.40 a 13.55 a

Wheat-/barley based diets Mash 67.3 77.8 97.6 76.8 b 13.57 b 12.58 b

Extruded 66.7 77.7 98.0 77.5 ab 13.84 a 12.81a

ab Means within the same column (per diet) with different superscripts differ significantly (P<0.05)

Mariscal-Landín et al. (2002) examined the effect of extrusion on the apparent ileal digestibility (AID) of

protein and amino acids of winter peas for pigs and found a significant increase in the dry matter, protein and

amino acid ileal digestibilities. A large part of the improvement in amino acid digestibility, however, was

related to the inactivation of trypsin inhibitors found in winter peas. Some of the improvement that was

observed for the AID of protein from extruded peas, were attributed to the gelatinization effect of extrusion on

starch as well as the denaturing of the protein structure due to the heat treatment, which enhances the action of

digestive enzymes on seed protein. It is especially the effect of extrusion on the protein structure of peas that

could prove beneficial to similar treatments for lupins, since lupins do not contain any significant levels of

trypsin inhibitors or starch. Unfortunately no details were given regarding the time, temperature or pre-

conditioning that were used in the extrusion processing for this trial.

There are very few studies that have reported on the influence of extrusion of lupins on broiler

performance. Watkins et al. (1988), extruded lupin meal (L.albus cv. Ultra) by heating the ground seed at 80°C

for 20 seconds under pressure and formulated broiler diets to contain either raw or extruded lupins at 10, 20 and

30% of the basal diet by partial substitution of corn and soyabean meal. These diets were supplemented with

DL-Methionine and L-lysine. Similar inclusion levels were used for autoclaved lupin meal (121°C for 30

min.). The diets were fed for 18 days and the body weight gains, feed efficiencies and mortalities of broilers

were determined for the experimental period. The results are shown in Table 1.17. The gain and feed

efficiency of chicks fed diets containing raw, extruded or autoclaved lupins were not inferior to those of the

control diet. Extruding lupins also improved the feeding value of the seed over autoclaved and raw lupins,

resulting in a significant improvement (P<0.05) in chick growth. The 10% extruded lupin diet yielded growth

performance values superior to the control diet.

Watkins & Mirosh (1987) used the same method of processing (extruding lupins at 80°C for 20 min.) and

included it at levels of 10 and 20% of a corn-soya diet, but did not observe any significant (P<0.05)

improvements in egg production, egg weight and feed consumption of laying hens.

31

Table 1.17 Average gains, feed efficiencies (total gain/total feed) and mortality of chicks fed raw, extruded and autoclaved lupin diets (Watkins et al., 1988) % Inclusion

Average gain (g) Total gain / total feed

Mortality (No./total)

Lupin % 0 428bc 0.671 ab 0/32 Average 428 0.671

Raw 10 418 c 0.675 ab 4/32 20 431 abc 0.680 ab 0/32 30 428 abc 0.671 ab 1/32 Average 428 0.675

Extruded 10 462 a 0.689 ab 0/32 20 445 abc 0.680 ab 0/32 30 460 ab 0.704 a 2/32 Average 456* 0.689*

Autoclaved 10 418 c 0.662 b 1/32 20 450 abc 0.680 ab 0/32 30 441 abc 0.675 ab 1/32 Average 436 0.675 Pooled SEM 10 0.02

a-cValues within columns with different superscripts are significantly different (P<0.05). *Average values significantly different from other average values within column (P<0.05).

Very little information is published regarding the effect of heat treatment on the nutritive value of lupins

for broilers. There are, however, indications that extrusion processing could enhance the AME value through

its influence on the digestibility of non-starch carbohydrates as well as increasing the protein and amino acid

availability through the denaturing of the protein structure. The following section will summarise the relevant

literature on canola seed and provide grounds for the research conducted for this thesis.

32

1.5 Nutritional value of Canola seed (Brassica spp.) for broilers.

Over the past couple of decades Brassica oilseed production has increased to become the world’s third-

most important source of oil for human consumption and second-most important source of protein meal for

animals (Arkcoll et al., 1998). Brassica rapa (formerly known as Brassica campestris) was introduced to

Canada in 1936 from Poland and a few years later Brassica napus was introduced from Argentina (Bell, 1984).

Even though the origin of the different Brassica species is not entirely clear, it is believed that Brassica rapa is

the oldest species with the widest distribution, and that Brassica napus was derived from a cross between B.

rapa and B. oleracea (Kimber & McGregor, 1995). B.rapa and B.napus subsequently became the source of

seeds in Canada on which extensive research was done in order to improve on the unacceptably high levels of

erucic acid and glucosinolates that was common to rapeseed. The first low erucic acid cultivar was produced in

Canada in 1968, followed by another improvement in 1974, with a cultivar that was low in both erucic acid and

glucosinolates (Bell, 1984). The Canola Council of Canada decided to distinguish the nutritionally superior

seed and oil derived from these double low rapeseed cultivars from those of the original high erucic acid and

high glucosinolate rapeseed cultivars by referring to them as Canola (Clandinin et al., 1989). The remarkable

history of rapeseed in Canada has been reviewed by Bell (1982) and special recognition has been given to the

breakthroughs achieved in plant breeding. Canola generally refers to rapeseed containing less than 2% of the

total fatty acids in the oil as erucic acid and less than 30 μmoles of glucosinolates per gram of oil-free dry

matter (DM) of the seed (Bell, 1993).

Canola seed contains about 40% oil (Fenwick & Curtis, 1980), which are usually removed by crushing,

solvent extraction or a combination of both techniques. As described previously in this chapter, the quality and

composition of the residual meal is affected by the method of processing and could vary considerably. The

prepress solvent extraction method is widely used in Canada and the various processing stages of this oilseed

into its oil and meal components are described by Pickard et al. (1989) and Carr (1995). The meal represents

about 60% of the original weight of the seed (Bell, 1995) and is mainly used as a protein supplement for animal

feeding. It contains between 36 and 39% protein (Aherne & Kennelly, 1982)

and a good balance of essential amino acids. However, its potential use for

broiler feeds may be decreased due to the relatively high CF content (see Table

1.18) which results in a relatively low level of ME (Dale, 1996). The

introduction of yellow seeded cultivars with a thinner, less fibrous seed coat,

resulted in a 4% reduction in fiber content (Fenwick & Curtis, 1980) and could

prove highly beneficial in poultry nutrition. These cultivars are sometimes

referred to as the “000” cultivars (Van Kempen & Jansman, 1994).

Figure 3.1 Canola flower.

33

In addition to the meal, certain other by-products of canola crushing and oil refining are useful in animal

feeds and are sometimes blended with the meal at the crushing plant. These include gums (containing

glycolipids, phospholipids, sterols, etc.) and acidulated fatty acids, also termed soapstocks (Pickard et al., 1989;

Bell, 1995). In Canada, gums are frequently added back to canola meal at levels of 1.5%, but even levels of 6%

have been shown to have no detrimental effects on the feeding value of canola for broilers and layers (Robblee

et al., 1989). Such additions serve to reduce the dustiness of the meal and increase its ME value.

The incorporation of full-fat canola seed in poultry diets have also been investigated due to its increased

contribution towards the ME content of the diet when compared to that of oil-extracted canola meal (Olomu et

al., 1975b; Summers et al., 1982). Full-fat canola seed contains approximately 40% ether extract (fat) and 21

to 23% crude protein (Robblee et al., 1989) and could thus have potential as a high energy and protein feed

ingredient for poultry diets.

It is evident from literature that the use of canola meal in poultry diets has been researched far more

extensively than full-fat canola in terms of composition, inclusion levels, as well as the influence of processing

conditions on the nutritional value thereof. Some form of heat treatment is necessary to inactivate the enzyme

myrosinase that is present within the seed and that hydrolyses the glucosinolates into their goitrogenic and toxic

components when the seeds are crushed (Bell, 1984). Heat treatment in the form of cooking/conditioning is

usually applied prior to the expeller or solvent extraction phase in the processing of canola meal for the purpose

of inactivating myrosinase (Pickard et al., 1989). The role of glucosinolates and their undesirable breakdown

products will be discussed in more detail in further sections.

Canola meal is classified as a protein supplement in the feed trade and usually competes directly with

soyabean meal. For this reason a comparison of the chemical and amino acid composition of canola, in its full-

fat and meal form with that of soyabean meal is presented in Table 1.18 (with both meals obtained from solvent

extraction). Variation in chemical composition of canola meal and full-fat seed, as with many other feed

ingredients, are the result of many factors and include the cultivar of Brassica used, the soil type on which they

are grown, the weather and other environmental effects, as well as the processing conditions applied in the

crushing plant in the case of canola meal (Bell & Keith, 1991; Bell, 1995). In the following section the

chemical composition of canola will be evaluated in more detail.

1.5.1 Chemical Evaluation

Canola protein is generally of high nutritional value as indicated by the levels of essential amino acids

(Table 1.18) and compares well with that of soyabean meal. Uppström (1995) reported that the protein content

of Brassica seed shows an inverse relationship to its oil content, with the protein content being higher and oil

content lower when the seeds are grown under warm dry conditions, and vice versa. The absolute quantity of

amino acids in canola vary in proportion to the CP content, which in turn also varies considerably according to

the factors mentioned previously, especially environmental factors during seed development (Bell, 1995). This

variation in amino acid content is more pronounced for specific amino acids in canola meal than for full-fat

canola because of the additional influence of processing conditions (Bell & Keith, 1991). Apart from the

34

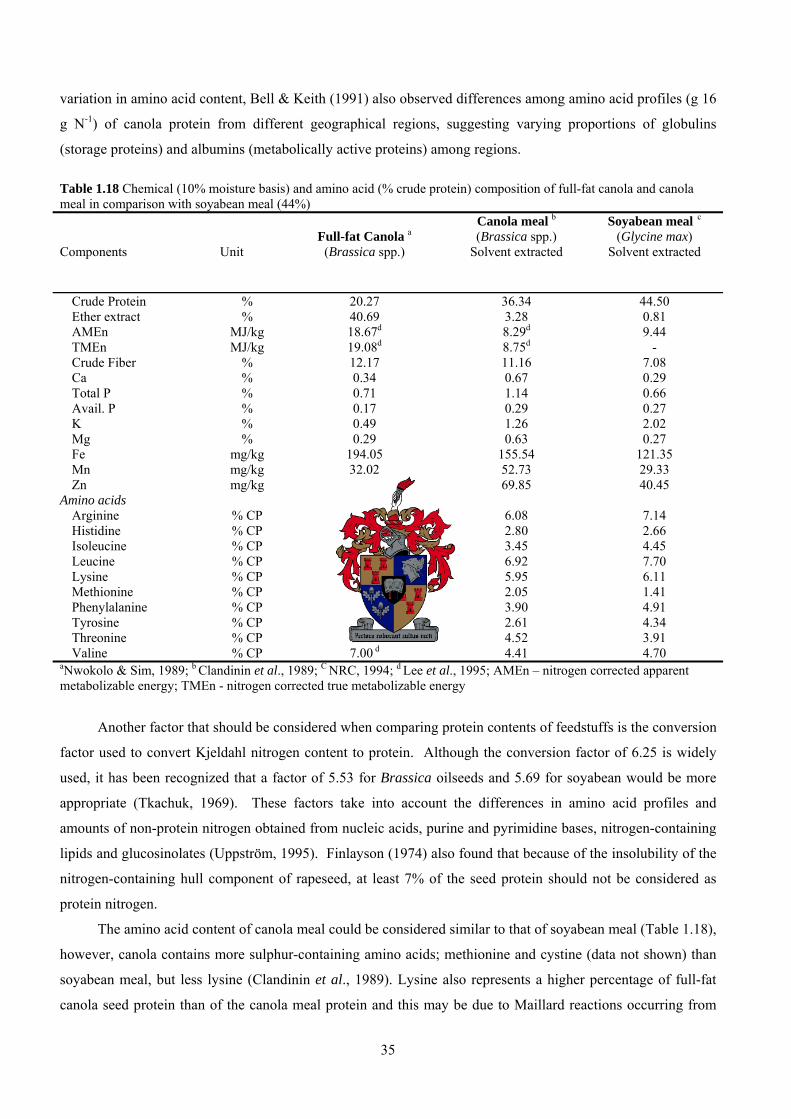
variation in amino acid content, Bell & Keith (1991) also observed differences among amino acid profiles (g 16

g N-1) of canola protein from different geographical regions, suggesting varying proportions of globulins

(storage proteins) and albumins (metabolically active proteins) among regions.

Table 1.18 Chemical (10% moisture basis) and amino acid (% crude protein) composition of full-fat canola and canola meal in comparison with soyabean meal (44%) Components

Unit

Full-fat Canola a

(Brassica spp.)

Canola meal b

(Brassica spp.) Solvent extracted

Soyabean meal c

(Glycine max) Solvent extracted

Crude Protein % 20.27 36.34 44.50 Ether extract % 40.69 3.28 0.81 AMEn MJ/kg 18.67d 8.29d 9.44 TMEn MJ/kg 19.08d 8.75d - Crude Fiber % 12.17 11.16 7.08 Ca % 0.34 0.67 0.29 Total P % 0.71 1.14 0.66 Avail. P % 0.17 0.29 0.27 K % 0.49 1.26 2.02 Mg % 0.29 0.63 0.27 Fe mg/kg 194.05 155.54 121.35 Mn mg/kg 32.02 52.73 29.33 Zn mg/kg 24.26 69.85 40.45

Amino acids Arginine % CP 7.35 d 6.08 7.14 Histidine % CP 3.23 d 2.80 2.66 Isoleucine % CP 5.63 d 3.45 4.45 Leucine % CP 9.55 d 6.92 7.70 Lysine % CP 8.22 d 5.95 6.11 Methionine % CP 1.96d 2.05 1.41 Phenylalanine % CP 5.83 d 3.90 4.91 Tyrosine % CP 3.53 d 2.61 4.34 Threonine % CP 6.56 d 4.52 3.91 Valine % CP 7.00 d 4.41 4.70

aNwokolo & Sim, 1989; b Clandinin et al., 1989; C NRC, 1994; d Lee et al., 1995; AMEn – nitrogen corrected apparent metabolizable energy; TMEn - nitrogen corrected true metabolizable energy

Another factor that should be considered when comparing protein contents of feedstuffs is the conversion

factor used to convert Kjeldahl nitrogen content to protein. Although the conversion factor of 6.25 is widely

used, it has been recognized that a factor of 5.53 for Brassica oilseeds and 5.69 for soyabean would be more

appropriate (Tkachuk, 1969). These factors take into account the differences in amino acid profiles and

amounts of non-protein nitrogen obtained from nucleic acids, purine and pyrimidine bases, nitrogen-containing

lipids and glucosinolates (Uppström, 1995). Finlayson (1974) also found that because of the insolubility of the

nitrogen-containing hull component of rapeseed, at least 7% of the seed protein should not be considered as

protein nitrogen.

The amino acid content of canola meal could be considered similar to that of soyabean meal (Table 1.18),

however, canola contains more sulphur-containing amino acids; methionine and cystine (data not shown) than

soyabean meal, but less lysine (Clandinin et al., 1989). Lysine also represents a higher percentage of full-fat

canola seed protein than of the canola meal protein and this may be due to Maillard reactions occurring from

35

processing conditions, especially during the desolventizer toaster stage of processing of canola meal (Bell &

Keith, 1991). The complementary amino acid profile of canola and soyabean makes the combination of these

protein-rich feedstuffs well suited in poultry nutrition.

The ether extract of full-fat canola is generally around 40% and are the biggest contributor towards the

available energy content of canola. Other benefits include a reduction in the dustiness of the feed as well as

modification of the fatty acids in eggs, meat and milk products (Bell, 1995). In recent times, with consumer

health at the forefront, the increased n-3 fatty acid content of poultry products, due to the inclusion of canola in

the diet, was found to be especially beneficial. Full-fat canola seed is a good source of α-linolenic acid

(C18:3n3) and Ajuyah et al. (1991) found that the inclusion of this oilseed in poultry diets significantly

modified tissue fatty acid composition of broiler carcasses. The ether extract of canola meal (Table 1.18) tends

to be higher than that of soyabean meal, mostly because of the addition of gums to canola meal (Clandinin et

al., 1989).

The CF content of canola meal is higher (11.16%) than that of soyabean meal (7.08%) and is partly

responsible for the relatively low ME value of the meal. Most of the fiber is present in the hulls with lesser

amounts present in the embryo (Bell & Shires, 1982). The hulls comprise about 16% of the seed weight and

30% of the weight of the oil-free seed meal (Bell, 1984). The carbohydrates of canola meal comprise almost

50% of the dry matter (Bell, 1995) and therefore have an important influence on the nutritional value. The

main components of the available carbohydrate fraction include sugars such as sucrose, stachyose, D-fructose

and D-glucose. Sucrose and starch are readily digested by monogastric animals in their free form and

contributes to the ME value. The starch content of the seed is relatively high during early development, but as

the seed matures, it declines and Blair & Reichert (1984) found only trace amounts in the seed cotyledons. The

carbohydrate constituents of rapeseed have been reviewed by Siddiqui & Wood (1977). The cellulose content

of canola meal is about 5%, the NDF 26%, total dietary fiber 33% and over 90% of the NSPs are insoluble

(Bell, 1995). The seed or meal from brown canola cultivars are known to have higher ratios of insoluble to

soluble fiber (Bell, 1995) and this has provided further encouragement for the conversion to yellow-seeded

cultivars. These yellow-seeded cultivars have a thinner seed coat with resultant lower CF content in the meal

derived from it and it is viewed that the future use of these cultivars will have improved nutritional value

(Slominski et al., 1994; Simbaya et al., 1995). Another approach to reducing the CF content of canola is by

means of dehulling. Bell (1993) found a significant reduction in the CF and ADF content of dehulled canola

meal, as well as improved digestibility of energy (79 vs. 66%) and protein (86 vs. 76%) for pigs when

compared to oil-free canola meal. The removal of the hull fraction of canola meal, however, also alters the

amino acid profile of the meal since the protein of the hull fraction contains more lysine than the embryo

fraction (Bell, 1995). An important consideration for the improvement of canola meal quality is also to keep

the processing costs low enough to remain competitive with soyabean meal and since the offset for canola hulls

is rather limited, this method is probably only second best to the use of yellow-seeded canola cultivars. There

may also be less polyphenols, lignin and tannins in the hulls of these light-coloured canola seeds, which would

be desirable for improving digestibility (Bell, 1995).

36

The mineral content of canola meal (Table 1.18) generally exceeds that of soyabean meal, especially with

regard to phosphorous, calcium, magnesium, selenium and manganese that are about double the amount. The

sulphur content is also higher in low glucosinolate canola meal than in soyabean meal, but this varies with the

glucosinolate level (Bell, 1995). While 70% of the phosphorous in canola meal is present in the inorganic

form, it has been shown that the phytic acid and fiber in canola meal reduce the availability of P, Ca, Mg, Zn,

Cu and Mn (Clandinin et al., 1989). However, in spite of the lower availability of minerals in canola meal

versus those of soyabean meal, canola meal is still a better source of available Ca, Fe, Mn, P, Mg and Se.

ME has been widely used as an index of the available energy in feedstuffs for poultry and it is knowledge

of this availability of nutrients (energy) that is essential when formulating diets for poultry. The following

section reviews the pertaining literature on biological analysis for poultry in terms of assessing the available

energy content of canola.

1.5.2 Bioassays - Energy

Unfortunately, estimates of ME for canola seed vary widely and even more so for canola meal due to the

influence of the different oil extraction methods used during processing (Nwokolo & Bragg, 1978; Salmon,

1984 and Bell, 1995). A large number of other variables should also be kept in mind when comparing ME

values of canola and include the following: the method used to assess the energy content (chick growth assay or

rooster force feeding), whether provision is made for endogenous energy losses (TME) or not (AME), and

whether a correction is made for protein stored or lost during the trial (Fenwick & Curtis, 1980). Differences

between samples in their energy components and CF content usually account for most of the differences

observed in ME values (Nwokolo & Bragg, 1978). It has been found that the age of the chicken also influences

the results (Lodhi et al., 1968; March et al., 1973), where about 10% greater ME values have been found for

adult hens compared to chicks (Bell, 1993). Bayley et al. (1974), however, concluded that the wide variations

observed in the ME values of rapeseed could be attributed to factors other than the ones they have investigated,

such as the level of rapeseed meal in the diet, its variety and subsequent processing, the duration of feeding and

the age of the birds. It has also been postulated that variations in the response to rapeseed meal might be due to

differences in the microflora present in the digestive tract of the birds (March et al., 1975). It is thus very

difficult to assign a single energy value to canola, since so many variables could influence it.

There is considerable variation among values reported in the literature and this is demonstrated in Table

1.19. Even though these authors all used a rooster force-feeding assay to determine TME and a total faecal

collection assay to determine AME, there are considerable differences between the different Brassica species,

between the seeds fed as ground or whole seeds, as well as whether the seeds were fed alone or in combination

with an assay diet. Muztar et al. (1978) found that the major discrepancy in ME values observed for whole

seeds apparently resulted form the differing responses of individual birds to the palatability and texture of the

seeds. Grinding the seed has also been shown to reduce the variability in TME and AME between birds for

both the Tower and Candle cultivars of canola seed and this was recommended for future energy evaluations

(Muztar et al., 1978). In addition, low glucosinolate levels in modern cultivars have apparently resulted in an

37

improved ME value, as well as the reduction in fiber contents by means of breeding (yellow seeded cultivars)

or dehulling (Bell, 1993).

Table 1.19 Reported values of Metabolizable energy of full-fat Canola seed (dry matter basis)

Species, Cultivar & Form

Units

Range (MJ / kg)

Reference

(B.napus), Tower, Ground TME 1 20.38 – 21.30 Sibbald, 1977a;Muztar et al.,1978 (B.napus), Tower, Ground TME 2 21.05 Sibbald & Price, 1977 (B.napus), LELG, Ground TME 2 20.30 – 21.39 Sibbald & Price, 1977 (B.napus), Tower, Whole TME 1 20.38 – 22.77 Muztar et al., 1978; Muztar et al., 1980 (B.napus), Tower, Whole TME 2 19.46 – 23.18 Muztar et al., 1978; Muztar et al., 1980 (B.rapa), Candle, Ground TME 1 22.43 Muztar et al., 1978 (B.rapa), LELG, Ground TME 2 16.36 – 19.96 Sibbald & Price, 1977 (B.rapa), Candle, Whole TME 1 18.33 – 22.81 Muztar et al., 1978; Muztar et al., 1980 (B.rapa), Candle, Whole TME 2 17.79 – 21.09 Muztar et al., 1978; Muztar et al., 1980 (B.rapa), Candle, Ground AME 1 18.33 Muztar et al., 1978 (B.rapa), Candle, Ground AMEn1 18.04 Muztar et al., 1978 (B.rapa), Candle, Whole AME 1 11.51 – 12.64 Muztar et al., 1978 (B.rapa), Candle, Whole AMEn1 11.59 – 12.43 Muztar et al., 1978 (B.napus), Tower, Ground AME 1 18.87 Muztar et al., 1978 (B.napus), Tower, Ground AMEn1 18.54 Muztar et al., 1978 (B.napus), Tower, Whole AME 1 15.19 Muztar et al., 1978 (B.napus), Tower, Whole AMEn1 15.02 Muztar et al., 1978 TME – True metabolizable energy; AME – Apparent metabolizable energy; AMEn – nitrogen corrected AME; 1 Test ingredient assayed with basal diet; 2 Test ingredient fed alone; LELG – low erucic acid low glucosinolate

1.5.3 Bioassays – Amino acids

The digestibility of protein (and amino acids) are generally more difficult to evaluate than energy

because of the differences in digestive systems and requirements for essential amino acids among various

species and ages of animals (Bell, 1995). It is common practice to use the same TME force-feeding procedure

of Sibbald (1979) to determine true protein (and amino acid) availability and therefore the factors influencing

the variability of TME assays are also applicable to the evaluation of protein and amino acid availabilities. A

second method that is also used to determine apparent or true amino acid availability is the total excreta

collection assay (Nwokolo & Sim, 1989). The true amino acid availability (TAAA) values are usually higher

than the apparent amino acid availability (AAAA) values, since compensation is made for the metabolic faecal

and endogenous urinary amino acid excretions in the TAAA assay (Lee et al., 1995). Again, as with the ME

values, a lot more research has been done on the availability of amino acids from canola meal when compared

to that of full-fat canola seed (FFCS). A few authors have evaluated amino acid availabilities of both canola

products and found the amino acids in the seeds to be more available than those in the meal form (Muztar et al.,

1980; Lee et al., 1995), conversely Barbour & Sim (1991) found these values to be similar for both the seed and

38

meal products. A summary of true amino acid availability values for FFCS is presented in Table 1.20. These

values were all determined with a rooster force feeding assay where the test ingredient (FFCS) was fed alone

(Muztar et al., 1980; Barbour & Sim, 1991 and Lee et al., 1995). Nwokolo & Sim (1989) used a total excreta

collection assay on broiler chicks, in which the test ingredient (FFCS) was blended 50:50 with a nitrogen-free

diet. In order to determine the metabolic faecal and endogenous urinary losses, the nitrogen-free diet was used

as a control.

Table 1.20 Summary of true amino acid availabilities (% dry matter) of full-fat canola seed. Muztar et al.

(1980) Nwokolo & Sim

(1989) Barbour & Sim

(1991) Lee et al.

(1995)

Average Arginine 94.0 84.8 100.0 90.5 92.33 Histidine 92.0 83.6 90.0 93.7 89.83 Isoleucine 91.0 85.3 93.0 84.6 88.48 Leucine 93.0 87.8 94.0 86.8 90.38 Lysine 89.0 81.9 95.0 87.9 88.45 Methionine 94.0 n.a. 89.0 90.4 91.13 Phenylalanine 92.0 87.4 96.0 87.6 90.75 Serine 90.0 83.5 94.0 84.3 87.95 Threonine 86.0 72.9 n.a. 82.2 80.37 Tyrosine 90.0 84.4 n.a. 84.1 86.17 Valine 90.0 85.6 93.0 83.6 88.05 n.a. – not assayed

From Table 1.20 it can be seen that the availability of amino acids from full-fat canola seed generally

falls within the range of 80.4 to 92.3%. Muztar et al. (1980) and Barbour & Sim (1991) also found that the

availability of some of the amino acids in canola seeds and -meal were similar to those in soyabean meal. This

could prove highly beneficial for the incorporation of canola in poultry diets. Muztar et al. (1980) observed

that the standard errors of the TAAA values were higher when the test ingredient were mixed with a basal diet

than when fed alone and this was confirmed by Lee et al. (1995). Muztar et al. (1980) also suggested that the

use of ground canola seed will reduce the variability between birds, and an excreta collection period longer than

24 hours, as well as an increased number of replicates will improve the reproducibility of TAAA assay results.

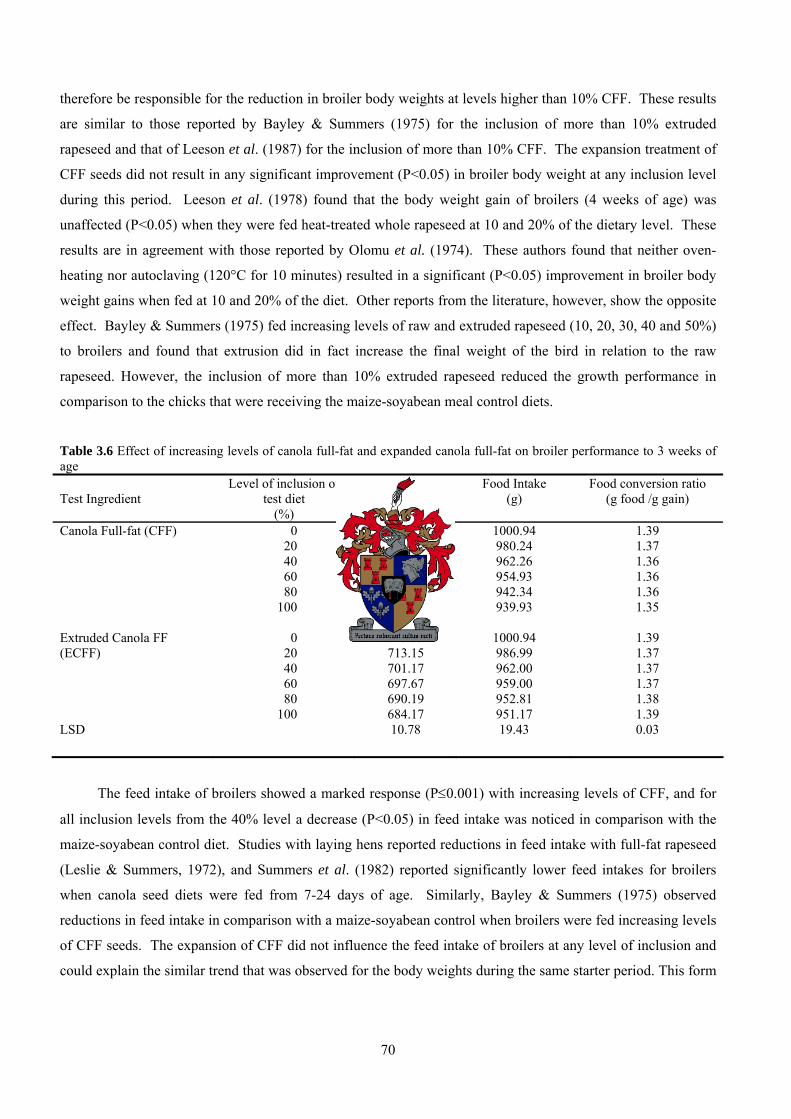
Robblee et al. (1989) conducted broiler trials to evaluate the use of canola seed in broiler rations. Raw

and flaked canola seed was included in the rations at levels of 10, 15 and 20%. Body weights and feed:gain

ratios were evaluated against that of chickens fed a wheat-soyabean control diet. The broiler performance

results are presented in Table 1.21.

Table 1.21 Effect of different levels of flaked canola seed on the performance of broiler chickens (Robblee et al., 1989) Rations Body weight (g) Feed/gain Control, Wheat-soyabean meal 1740 1.99

+ 10% flaked canola seed 1733 1.95 + 15% flaked canola seed 1666 1.97 + 20% flaked canola seed 1563 2.02

These authors recommended that 10% raw flaked canola seed may be used in broiler rations without

negatively affecting performance. These results are in agreement with Leeson et al. (1987) who also found that

39

a 10% inclusion level was suitable to sustain similar broiler growth rates as those fed a soyabean control diet.

In another study, however, broiler body weight gain was reduced by the inclusion of 10% FFCS when

compared to a barley-based diet, but no significant differences were found for feed consumption or feed:gain

ratio (Nwokolo & Sim, 1989). In a study by Ajuyah et al. (1991) the inclusion of 20% FFCS did not result in

any adverse effects on growth, carcass weight or cut-up yields, but affected the fatty acid composition of the

carcass by enriching it with linolenic acid (C18:3n3), docosapentaenoic acid (C22:5n3) and docosahexaenoic

acid (C22:6n3). To present, no consensus has been reached regarding the maximum inclusion level of FFCS in

broiler diets, since some studies supported the finding that the feeding of a diet with 20% raw, canola seed did

not result in growth depression (Leeson et al., 1978; Lee et al., 1991), whereas others showed that more than

17.5% FFCS resulted in reduced feed intake and weight gain (Summers et al., 1982). The latter authors

concluded that the major problem associated with the reduced performance of broilers consuming full-fat

canola-based diets, was the reduced feed intake and that it could be connected to a palatability problem. Some

of the conflicting reports concerning the value of full-fat rapeseed for poultry are most likely due to the level of

erucic acid and glucosinolates, since these vary from cultivar to cultivar. Olomu et al. (1975a) observed a

decreased weight gain, increased feed:gain ratios and leaner carcasses for broilers when they were fed diets

containing 20% of a low erucic acid cultivar (Span), but these effects were reduced when the seed was

autoclaved for 10 minutes at 120°C. In a companion paper the importance of these ANFs was highlighted

when they fed broilers on a diet with 20% raw Span (a low erucic acid variety of B.rapa) or raw Bronowski (a

low glucosinolate variety of B.napus) rapeseed and observed depressed weight gains and feed conversion ratios

with both cultivars when compared to that obtained from the control (Olomu et al., 1975b). A superior weight

gain and feed conversion ratio for Bronowski was observed in comparison with Span rapeseed. Clement &

Renner (1977) showed that high erucic acid rapeseed oils resulted in significant depressions in growth, while

low erucic acid rapeseed oil did not result in any depression in growth performance. This should theoretically

not be a problem with canola cultivars, since they are bred for low erucic acid as well as low glucosinolate

levels. However, as seen from the previous studies, conflicting results of broiler performance with the

inclusion of FFCS in broiler diets still exists and further research is needed in order to clarify this issue.

Promising results have been obtained with ways to improve the nutritive value and inclusion levels of canola

seed and are mostly directed at the effect of various heat treatments and grinding of the seeds. These studies

will be discussed in section 1.5.5.

1.2.1 Anti-nutritional factors in Canola

One of the remarkable events that distinguish modern canola from its more traditional rapeseed varieties

is the breakthrough that has been achieved in the 1970’s when plant breeders succeeded in breeding a variety of

rapeseed that has a low erucic acid content in the oil as well as low glucosinolate content in the meal. In the

animal feeding industry it is especially the low glucosinolate canola meal that has guaranteed its future use in

animal feeds, since glucosinolates are most toxic and has been known to reduce feed intake and growth

performance in animals, as well as interfering with thyroid activity (Van Kempen & Jansman, 1994).

40

1.5.4.1 Glucosinolates

More than 100 glucosinolates have been identified in the plant kingdom, of which six occur in Brassica

napus and Brassica rapa seeds. They can generally be divided into aliphatic and indole glucosinolates with the

former being more predominant in Brassica seeds. The aliphatic glucosinolates consists of butenyl, pentenyl

and their 2-hydroxy analogues, whereas the indole glucosinolates consists of 3-indolylmethyl and 4-hydroxy-3-

indolylmethyl (Uppström, 1995).

The problems concerning glucosinolates are related to both the total amount of glucosinolates present as

well as the type of glucosinolates and their breakdown products (Olsen & Sørensen, 1980). Earlier varieties of

rapeseed contained 110-180 μmoles of aliphatic glucosinolates per gram of oil-free dry matter and with the

advent of the low glucosinolate cultivars, these glucosinolates have been reduced to 10-20% of their former

levels (Bell, 1995). New canola varieties today contain less than 30 μmol of glucosinolates per gram of oil-free

dry matter and generally refer to the aliphatic glucosinolates, since the indole glucosinolates are not primarily

goitrogenic and are thus of less concern (Bell, 1995). It is not the intact glucosinolates that are toxic per se.

The presence of the enzyme myrosinase (β-thioglucosidase, EC 3.2.3.1) in separate compartments within the

seed, hydrolyses the glucosinolates into their goitrogenic and toxic compounds when the seeds are crushed

during processing. This enzyme may also be present in weed seeds contaminating rapeseed or may be produced

by microflora in the intestinal tract of animals (Van Kempen & Jansman, 1994). The hydrolysis of one of the

hydroxy analogues of aliphatic glucosinolates (2-hydroxy-3-butenyl) produces goitrin, which is the most active

compound of the goitrogenic factors. It results in a net reduction in circulating tri-iodothyronine and thyroxine,

consequently leading to the stimulation of the hypophysis to produce more thyroid-stimulating hormones and

finally results in the enlargement of the thyroid gland (Fenwick & Curtis, 1980). Another goitrogenic factor is

isothiocyanate that is converted to thiocyanate and tends to prevent active uptake of iodine. Thus, the effects of

thiocyanate are most noticed when iodine is limiting (Aherne & Kennelly, 1982). Depending on the nature of

the glucosinolates and the reaction conditions, such as low pH, nitriles and thiocyanate ions are also formed

(Van Kempen & Jansman, 1994). Aside from the goitrogenic and other anti-nutritional properties of

glucosinolates (or rather their breakdown products), they are regarded as generally unpalatable and responsible

for reduced feed intake with diets containing rapeseed meal (Bell, 1995). Animal species also appear to differ

in response to ingestion of glucosinolates and this may in part be explained by differences in intestinal

microflora activity (Bell, 1993). It has also been suggested that the myrosinase originating from the bacteria in

the gastro-intestinal tract of laying hens may contribute to the incidence of liver haemorrhage when

glucosinolates are ingested (Slominski et al., 1988).

Numerous attempts have been made to remove, reduce or counteract the effects of the goitrogenic

products by inactivating myrosinase before glucosinolate hydrolysis can occur. This usually takes place during

the cooking phase prior to expeller or solvent extraction in the processing of canola meal. A reduction of 15 to

77% in glucosinolates compared with original seed levels have been obtained at some crushing plants (Table

1.22).

41

Table 1.22 Effect of commercial processing on glucosinolate content of canola meal (Bell, 1995). Glucosinolate content

(μmol g-1 of oil extracted meal) Glucosinolate Seed Meal Aliphatic glucosinolates

3-Butenyl 7.44 4.97 4-Pentenyl 2.55 1.67 2-Hydroxy-3-butenyl 13.44 8.82 2-Hydroxy-4-pentenyl 0.99 0.74 Total 24.42 16.20

Indole glucosinolates 3-Indolylmethyl 0.63 0.38 4-Hydroxy-3-indolylmethyl 13.37 4.48 Total 14.00 4.86

Overall total, canola origin 38.42 21.06 Contaminant glucosinolates

2-Propenyl (allyl) 1.41 1.05 4-Hydroxybenzyl 2.31 2.25

The development of low glucosinolate canola cultivars has been a major improvement on the high

glucosinolate rapeseed cultivars of the past and the prospect of reducing the glucosinolate content even further

is very promising. A recommended maximum dietary level of 2.5 μmol g-1 has been established and levels as

low as 1.43 5 μmol g-1 diet are advised to minimize the liver haemorrhage problem in laying hens (Bell, 1995).

Three other types of anti-nutritional factors may also be found in canola and include sinapine, tannins

and phytic acid (Table 1.23).

Table 1.23 Sinapine, tannin and phytic acid contents of canola meal and their main effects on animals (Bell, 1993).

Compound Amount in canola meal (%) Effects on animals Sinapine 0.6 – 1.8 Bitter flavor

“Fishy eggs” (susceptible layers) Tannins 1.5 – 3.0 Impairs digestion, especially protein

Phytic acid 3 - 6 Binds minerals

1.5.4.2 Sinapine

Sinapine is the major compound among several phenolic choline esters present in the embryo of rapeseed

and has a bitter flavour. This may affect feed intake, even though it has been found that glucosinolates have a

greater adverse effect on palatability or feed intake than either sinapine or tannins (Bell,1995). Probably the

most important effect of sinapine is the production of off-flavour or “fishy eggs” by susceptible hens, which

lack the liver enzyme trimethylamine (TMA) oxidase. These hens cannot effectively handle the high yield of

choline following hydrolysis of sinapine in the gut, and results in a build-up of trimethylamine that is

transferred to the developing egg (Goh et al., 1979). “Fishy eggs” are usually observed if the diet contains

more than 1g of sinapine per kilogram of diet. This problem appears to relate mainly to hens that lay brown-

shelled eggs and the inclusion of canola should thus be restricted for these layers, since the sinapine content of

canola meal exceeds the minimum acceptable level (Blair & Reichert, 1984). The value of canola meal could

42

be considerably enhanced with the development of new cultivars with reduced sinapine contents (Fenwick &

Curtis, 1980).

1.5.4.3 Tannins

These compounds can be subdivided into hydrolysable and condensed tannins and exist mainly in the

seed coat. They are more abundant in dark-hulled canola cultivars than in the yellow-seeded cultivars and are

known to interfere with digestive enzymes, especially those affecting protein hydrolysis (Bell, 1993). This

effect is, however, disputed by other authors who failed to show any effect of rapeseed meal tannins on protein

digestibility and growth of chickens (Van Kempen & Jansman, 1994). Bell & Shires (1982) found that the

protein in hulls of the yellow-seeded canola cultivars were more digestible for pigs than those of the dark

varieties and contributed it to the lower tannin and lignin contents of the hulls. There are also indications that

tannins may have other anti-nutritional effects and that it could be involved with sinapine in the “fishy egg”

syndrome by inhibiting TMA oxidase, thereby preventing the enzyme from converting trimethylamine to a

water-soluble odourless oxide (Bell, 1995). Tannins may also form complexes with carbohydrates such as

starch and may impair absorption of certain minerals and vitamins in the digestive tract of poultry (Bell, 1995).

1.5.4.4 Phytic acid

Phytic acid is found mainly in the embryo of cereal grains and oilseeds. This compound is strongly

negatively charged at the usual pH of feeds, and can therefore react with positively charged groups such as

cations and proteins. Depending on the pH, phytic acid may form complexes (phytates) with certain mineral

ions of varying solubility and thereby reducing the availability of certain minerals (Nwokolo & Bragg, 1977).

In rapeseed the presence of phytates have caused Zn, Ca and Mg deficiency syndromes in chickens (Nwokolo

& Bragg, 1977). They may also form complexes with proteins in the food, with digestive enzymes or with

proteins closely associated with starch (Bell, 1995). Phytic acid may account for 60-90% of the total

phosphorous and exists mainly as salts of calcium, magnesium and potassium (Bell, 1993). Canola meal

contains about 1.22% total P of which 0.53 is phytate-bound (Bell, 1993). The corresponding values for

soyabean meal (SBM) are 0.66% and 0.38, indicating that even though canola meal contains more phytate than

SBM, it provides about twice as much non-phytate P due to its higher levels of minerals. Dietary

supplementation with phytase could significantly improve phosphorous availability for broiler chicks and have

been described by Żyła & Korelski (1993). The hydrolysis of phytate in canola meal with phytase is, however,

not a simple matter and continuous research is being done to improve the process. Newkirk & Classen (1998)

have reported on additional meal pre-treatment that is necessary for the effective hydrolysis of phytate in canola

meal.

Canola does contain a few other anti-nutritional factors such as trypsin inhibitors and saponins, but the

levels are too low to be of any nutritional significance. The only other component that could have an anti-

nutritional effect are pectins. They comprise approximately 14.5% of dehulled rapeseed and because of its

effect on the viscosity of the digesta, may retard digestion and absorption of nutrients (Bell, 1984). The

43

addition of pectinases may therefore be useful in increasing the nutritive value of rapeseed, but for the purpose

of this study we have concentrated on the use of heat treatment to try and improve the nutritive value and these

methods will be discussed in the following section.

1.2.2 Processing of Canola

Previous research regarding the processing of canola has almost been exclusively devoted to its oil and

meal components, as well as the influence of every stage of the prepress solvent extraction method on the

various nutritional and anti-nutritional components of this feed (Fenwick et al., 1986; Pickard et al., 1989;

Campbell & Slominski, 1990; Carr, 1995 and Mustafa et al., 2000). Even though full-fat canola has the

potential of being a high-energy high-protein ingredient for poultry, the use of unprocessed whole canola seed

is not warranted due to the presence of myrosinase that hydrolyses the glucosinolates into their toxic and

goitrogenic components upon crushing or grinding of the seed. It has therefore been considered essential that

the seed be processed with some form of heat treatment prior to inclusion in poultry diets in order to inactivate

this enzyme.

Pickard et al. (1989) have outlined a few basic principles that should be followed when processing canola

to keep the hydrolysis of glucosinolates to a minimum:

Moisture content should be kept between 6 and 10%, since levels above that will enhance hydrolysis and

levels. Temperature should be raised as quickly as possible to the optimum temperature, since the rate of

enzymatic hydrolysis increases with increasing temperature until inactivation occurs. A slow rate of heating

will thus favour hydrolysis. Temperatures should be monitored and excessive heating must be avoided to

control thermal decomposition of the glucosinolates.

Fenwick et al. (1986) have reported that dry extrusion of rapeseed at 150°C effectively inactivated

myrosinase but had little effect on glucosinolate content. However, it was emphasized that successful

detoxification should maintain the biological and nutritional value of the product and that this was unlikely to

be the case with such high temperatures. A decrease in protein quality and digestibility due to Maillard-product

formation are more likely to occur. The authors have also found that the effectiveness of extrusion as a means

of removing glucosinolates can be increased by the addition of chemicals such as formaldehyde, alkali or

ferrous sulphate prior to the extrusion process. There are, however, certain risks that the products formed as a

result of the chemical treatments may differ from those produced upon enzymatic hydrolysis and that these may

in fact be even more toxic.

Indole glucosinolates are more susceptible to heat treatment than aliphatic glucosinolates (Slominski &

Campbell, 1989) and upon hydrolysis yields products such as thiocyanate ion (SCN) and indoleacetonitriles

that are also more toxic than the breakdown products of aliphatic glucosinolates (Campbell & Slominski, 1990).

These authors have determined the thermal degradation products of indole glucosinolates during the processing

of canola and have established that there are as of yet unidentified breakdown products present. The presence

in canola meal of some products, which releases SCN upon hydrolysis in the gastro-intestinal tract of poultry,

has also been demonstrated by Campbell & Slominski (1989).

44

Pigs seem to be somewhat more sensitive than poultry to low levels of glucosinolates and Keith & Bell

(1983) found that steam treatment reduced the total glucosinolate content of canola from 40 to 15 μmol/g and

that it had a positive response on the growth performance of the pigs. Heat treatment such as extrusion also had

no significant influence on other anti-nutritional factors of canola such as the sinapine or tannin content (Van

Kempen & Jansman, 1994).

Heat treatment may also cause a certain modification of the protein structure and this is generally

considered as desirable since it renders the protein more readily assimilable by poultry (Pickard et al., 1989).

Excessive heat treatment may, however, result in the loss of some of the essential amino acids of which lysine

is the most susceptible (Gray et al., 1957). Pickard et al.(1989) have described two types of damage that can

occur. Firstly, the amino acids may become bound in such a form that they are not liberated by digestion in vivo

or by enzyme hydrolysis in vitro, but are liberated by acid hydrolysis. Secondly, the amino acids are

irreversibly altered and are not recovered by acid hydrolysis.

Gray et al. (1957) determined the effect of heat treatment, in the form of autoclaving and dry heating

(115-120°C), on the lysine content of rapeseed and concluded that both heat treatments resulted in the reduction

of lysine with the latter resulting in a lesser degree of destruction. They have also reported that autoclaving

improved chick growth despite the lowered level of lysine in the raw seed. As for other oilseeds such as

soyabeans (Kohlmeier, 1997), it has been suggested that a protein solubility test might be applicable to

determine the effectiveness of canola processing. Goh et al. (1980), however, have established that the protein

solubility of rapeseed meal in 0.2% KOH is not a reliable test for indicating the protein quality, since it showed

poor correlation with total protein efficiency (TPE – calculated as: weight gain of chicks divided by the total

weight of protein consumed by the chicks) as determined by a chick growth assay. These results support the

relevance of assessing the effectiveness of canola processing in terms of the bioavailability of nutrients by

means of a chick growth assay.

Woodly et al. (1972) indicated that heat treatment was indeed necessary to improve the nutritive value of

full-fat canola and that it resulted in a marked improvement in the average weight gain and feed:gain ratios

from those obtained by feeding raw canola. These findings were supported by Olomu et al. (1974) who found

that autoclaving raw canola at 120°C for 10 minutes gave the best results and significantly improved broiler

weight gain and feed conversion efficiency over that of raw canola.

Bayley & Summers (1975) extruded rapeseed at 120°C and formulated broiler diets containing graded

levels (10, 20, 30, 40 and 50%) of either raw or extruded rapeseed. Broiler performance was measured in terms

of feed intake, body weight and feed:gain ratio and compared with an isocaloric and isonitrogenous corn-

soyabean control diet. The results (Table 1.24) showed that the extrusion of rapeseeds did improve the value of

the oilseed in diets for growing chicks, but that the inclusion of more than 10% extruded rapeseed have reduced

the growth performance in comparison to the chicks that were receiving the corn-soyabean meal control diets.

45

Table 1.24 Effect of adding raw or extruded rapeseeds to the diet of growing light hybrid chicks on performance from 7 to 21 days of age (Bayley & Summers, 1975)

Control Rapeseed (%)

Corn-soy

Corn-soy-rapeseed

10 20 30 40 50 Sx* HSD**

Feed consumed (g/bird/day) Raw rapeseed 16.5 13.8 11.6 9.4 8.2 19.0 19.9 Extruded rapeseed 19.2 18.1 16.9 15.2 14.9 0.44 2.2

Final weight (g/bird) Raw rapeseed 162 133 119 96 88 191 189 Extruded rapeseed 188 177 167 153 149 2.99 14.7

Feed:gain Raw rapeseed 2.44 2.92 3.20 4.52 5.75 2.14 2.26 Extruded rapeseed 2.21 2.30 2.37 2.53 2.57 0.13 0.64

*Based upon error mean square from analysis of variance 33 df. **Honestly significant difference, Tukey (12 means, 33 df P = 0.05).

Heat treatment of canola diets in the form of steam-pelleting has also proven to be beneficial (Summers

et al., 1982; Shen et al., 1983). However, when diets are given in a meal form, it is advisable that the canola

seeds are well ground. Shen et al. (1983) have examined their ground canola material and found approximately

4% whole seeds in the “once ground” batch, 0% in the “twice ground” batch, 26% in the 50:50 maize:canola

mix “once ground” and 3.5% in the same mixture “twice ground”. There were also a number of seeds that were

in various stages or degrees of pulverization for all ground samples. The level of grinding had a marked

influence on the fat digestibility of canola seed (mashed diets), with twice ground canola resulting in the

highest fat digestibility of the canola seed diets. The performance of broilers fed these canola seed diets in

mashed form was, however, consistently lower that those obtained from either the maize-soya control or the

steam-crumbled canola seed diets, highlighting the need for heat treatment when full-fat canola seeds are used.

Apart from heat treatments, there are also other processing methods that are being investigated regarding

the improvement of the nutritional value of canola. One such method is the reduction of the CF content by

means of dehulling. Leslie et al. (1973) showed that the dehulled fraction of canola seed had a higher protein

and fat content with a lower fiber content than the whole seed, consequently leading to an increased digestible

nitrogen and digestible energy content of dehulled canola seed. Zuprizal et al. (1991) showed that in adult

roosters the true digestibilities of protein and total amino acids were increased when dehulled meal were

compared to whole canola meal (82.3 vs. 72.7% and 85.7 vs. 80.2%, respectively). Bell (1993) also found

that the digestible energy content for pigs of dehulled canola meal was superior to that of whole canola meal

(13.57 MJ/kg). The results look promising, but the difficulty in dehulling such a small seed effectively as well

as the high processing cost involved, will more than likely offset these nutritional benefits. Another method of

improving the nutritional value of canola involves the use of exogenous enzymes such as phytases and

carbohydrases. This is mainly due to the anti-nutritional impact of phytic acid and non-starch polysaccharides

such as pectin. Promising results have been obtained in this field (Bell, 1993; Newkirk & Classen, 1998), but

will not be discussed as part of this study.

46

The potential effect of expansion on the nutritional quality of canola will be discussed hereafter. Very

little information exists for this particular heat treatment on full-fat canola, but relevant results of the expansion

of other oilseed products and whole diets will be given in the hope of possibly predicting the outcome of the

expansion of full-fat canola.

During expander processing steam- or liquid-conditioned meal is fed into a mixing and conveying screw.

A cone-shaped valve is mounted near the end of the mixing tube and can be hydraulically or electrically

controlled to ensure that the expansion process can be adapted to appropriate requirements, with regard to the

nutritional, hygienic and physical quality of the end product (Van Zuilichem et al., 1997). The feedstuff is

subjected to increasing pressure and shear action caused by the rotating single screw and when it leaves the

expander, a sudden drop in pressure occurs and some of the added water evaporates spontaneously. This, along

with the sudden increase in volume of the material as it leaves the expander, is known as “expansion”.

Expander processing has been used in the poultry industry for some time (Kwakkel & Van der Poel,

1997) and is generally considered as being a cheaper form of heat treatment than both single- and twin-screw

extrusion processes (Van Zuilichem et al., 1997). There are in fact many variables during or after the

expansion process that can influence the nature of the final product and this makes it very difficult to evaluate

the efficiency of the expansion treatment (Bos et al., 1997). Some of the advantages of expander processing for

the feed manufacturer will include improved pellet durability, the inactivation of ANFs, sterilization of the

feed, increased fat addition, gelatinization of starch and reduced dust levels (van Zuilichem et al., 1997).

The effects of processing – both desired and undesired – on the nutritional properties of feed are highly

dependent on the conditions during thermo-mechanical processes such as pelleting or expander treatments. The

time/temperature combination is in most instances the major factor influencing the extent of reactivity of the

various chemical components of the feed ingredients (Bos et al., 1997). It is thus essential to optimize

processing conditions in order to limit the occurrence of undesirable reactions such as denaturation,

caramelization, oxidation and maillard reactions. Some of the more desirable effects of expansion on protein,

amino acids, fat and cell wall structures will be discussed hereafter

.

1.5.5.1 Effect on proteins and amino acids

Expander processing has no significant influence on the feed protein content as well as on the stability

and availability of certain amino acids (Peisker, 1992). Up to a temperature of 120 0C neither the total lysine

nor the reactive lysine changed when a pig diet was exposed to expander treatment, but at 130 0C there was a

slight reduction in the content and availability of the amino acids even though it was not significant.

Considering the widespread use of synthetic amino acids such as lysine and methionine in poultry rations today,

the fact that they have proven to be “expander stable” during high processing conditions are of extreme

importance (Peisker, 1992).

Expander processing may also be employed to reduce the levels of proteinaceous ANFs, thereby

increasing plant protein digestibility (Bos et al., 1997). Many basic treatment procedures exist and are

dependent on various parameters. The effectiveness of such treatment is therefore related to a complete

47

knowledge of both the ANFs and composition of a specific feed material as well as the process technologies

involved.

1.5.5.2 Effects on fat and fatty acids

Expander processing can influence the quality of fatty acids in feed by inactivating the naturally

occurring lipases, thereby limiting the amount of free fatty acids that are formed as well as the extent of

hydrolysis taking place (Peisker, 1992). This is especially important in high-oil feedstuffs such as canola where

the amount of free fatty acids increases with the duration of storage (Table 1.25).

Table 1.25 Free fatty acid content (g/kg) in different stored products with and without expander treatment a (Peisker, 1992). Storage time (weeks) Treatment 0 4 8 Untreated Beans 12.9 14.7 18.9 Rapeseed 1.9 8.6 11.1 Expanded Mixture 50:50 2.7 2.5 2.8 a No additional processing conditions were described.

As can be seen from Table 1.25 the free fatty acid content of the expanded feedstuffs did not exceed the

initial value of the untreated feedstuffs even after 8 weeks of storage. The oxidation of fat in feeds and

feedstuffs may also occur due to the enzyme, lipoxidase that causes the fats to turn rancid (Bos et al., 1997).

The products formed during this oxidation give the feed a characteristic taste and smell, and usually result in

reduced feed intakes. According to the work of Peisker (1992), expander processing reduces the incidence of

fat oxidation by inactivation of the relevant enzymes during treatment.

1.5.5.3 Effects on cell wall structures

Cell walls of older plants contain pectins, hemicellulose, cellulose and some lignin and have a very low

digestibility for poultry (Bos et al., 1992). Just like milling and pelleting could result in the disruption of cell

walls due to the high shear forces of these treatments, the same could be applied to expansion with a resultant

increase in the digestibility of cell walls.

1.5.5.4 Effect on micro-organisms

The high temperatures reached during the expansion of feed ingredients or complete diets will lead to a

reduction in the amount of micro-organisms present (Beumer & Van der Poel, 1997). Temperature, treatment

time, moisture content or a combination of these is certainly the most important parameters determining the

extent of the reduction in microbial numbers (Beumer & Van der Poel, 1997). It is important to control and

understand these variables in order to successfully reduce the amount of micro-organisms such as E.coli and

moulds. Expander treatment also appears to be an effective means of eliminating Salmonella spp. from animal

feeds, but this needs to be supported by a quality control system such as HACCP or the “farm-to-fork”concept

throughout the production chain.

48

The influence of expansion on other nutrients such as starch has been well researched (Bos et al., 1997;

Thomas & Van der Poel, 1997), but since it is not completely relevant to our study of the expansion of canola,

it will not be discussed here. Unfortunately, information on the expansion of single feed ingredients, especially

canola seed, is not available in the literature.

1.5.5.5 Effect on nutritional value and broiler performance

It is well known that young broiler chicks have a restricted feed intake capacity and needs to consume

highly digestible and concentrated feeds in order to satisfy their rapid growth potential (Kwakkel & van der

Poel, 1997). High CF fractions, such as those in canola, will have a negative effect on the apparent digestibility

of protein and amino acids and can severely impair their growth. Exposure of the feed to expander treatment

may reduce these negative effects (Kwakkel & van der Poel, 1997).

The effects of pelleting, expanding and expanding-pelleting on broiler performance have been

investigated and the results are shown in Table 1.26.

Table 1.26 Effects of dietary treatments on feed characteristics 1 and broiler performance at 36 days of age (Kwakkel & van der Poel, 1997) Pelleting Expander Treatment Expander-Pelleting Body weight at 36 d (g) 1504a 1432 b 1523 a

Cumulative feed intake (g) 2551b 2433 c 2592 a

Feed conversion ratio 1.74 1.75 1.75 a,b,c Values with different superscripts in the same row are significantly different (P<0.05) 1 No additional processing conditions were described.

The best growth performance was observed for the group fed the expanded-pelleted feed, with the single

expanded feed resulting in inferior growth. The expansion of the feed increased its bulkiness and due to the

restricted feed intake capacity of broilers, it resulted in a reduction in feed intake. This problem can be avoided

with the pelleting of expanded feeds. The feed conversion ratios were not affected by treatment.

In another trial, the influence of pelleting, expansion-pelleting and first expanding the maize portion and

then pelleting the whole diet was determined on nutrient digestibilities. The results are shown in Table 1.27.

49

Table 1.27 Digestibility coefficients of crude nutrients in differently treated broiler mixed feeds1 (Peisker, 1992) Processing Digestibility coefficients Standard pelleted Expanded-pelleted Maize expanded Mix pelleted Organic matter 68.6 ± 3.4 70.2 ± 1.2 67.7 ± 2.3 Crude protein 78.5 ± 1.9 77.2 ± 0.8 76.9 ± 0.8 Crude fat 70.6 ± 4.5b 82.3 ± 6.1a 67.7 ± 10.0b

Starch 97.8 ± 0.7b 98.9 ± 0.1a 98.1 ± 0.7ab

NDF 8.4 ± 2.1b 13.8 ± 3.5a 13.8 ± 4.6a

ADF 19.8 ± 4.5 22.3 ± 6.0 20.0 ± 3.2 1 Mixture consisted mainly of maize (40%), soyabean meal (14.4%) and maize gluten feed (10%); counter pressure in expander was 80 bar; mixture was conditioned at 70°C; no further processing conditions were described a,b Values with different superscripts in the same row differ significantly (P<0.05)

No significant differences were observed in either organic matter or CP digestibilities. Expander-

pelleting did, however, increase starch, fat and NDF digestibility and could be contributed to the rupture of fat

containing cells and possibly starch gelatinization.

Plavnik & Sklan (1995) examined the effect of expansion processing on the digestibility of energy and

nutrients of feeds and grains in 18-21 day old broiler chicks. A complete maize-based feed or wheat or barley

were exposed to expansion (90°C) and compared with the same untreated material. All diets were subsequently

milled to equal size. The results are presented in Table 1.28.

Table 1.28 Effect of expansion on apparent digestibilities of nitrogen (N), fatty acids, starch, gross energy (GE), apparent (AME) and nitrogen-corrected (AMEn) metabolizable energy of maize or wheat/barley based diets (Plavnik & Sklan, 1995).

N Fatty acids Starch GE AME AMEn % % % MJ/kg MJ/kg MJ/kg

Maize-based diets Mash 68.0 75.8b 96.9 79.4 a 14.19 b 13.04 b

Expanded 66.1 79.8a 97.2 79.6 a 14.33 a 13.26 a

Wheat-/barley based diets Mash 67.3 77.8 97.6 76.8 b 13.57 b 12.58 b

Expanded 67.6 78.1 97.9 77.9 a 13.96 a 12.90 aab Means within the same column (per diet) with different superscripts are different (P<0.05)

The expansion of complete maize-based diets as well as that of wheat or barley and their addition to

basal diets increased the AME and AMEn values of the diets by 1.5 - 2.5% (P<0.05). From the research

findings presented here it seems that expander processing can be successfully employed to destroy anti-

nutritional factors and enhance nutrient and energy utilization. Its main effect is through the rupturing of fat

containing cells as well as the breakdown of cell walls. From a physical point of feed quality, it also has a

positive effect on pellet quality and durability.

50

1.6 Discussion

From the literature it is evident that a large variation exists in the chemical composition (especially

protein and fibre content) of different species and cultivars of lupins. This could lead to considerable

inaccuracies when establishing the nutritional value of a particular lupin species for broilers. It is therefore

necessary to specifiy between the different species and cultivars of lupins that were used in a particular trial.

When dealing with poultry, however, the nutritional value of a feed ingredient is more adequately

described by the available nutrient content and should reflect closely on broiler performance parameters such as

body weight gain, feed intake and feed conversion efficiency. From the previous literature review it is evident

that very few reports have been made on the apparent or true metabolizable energy value of Lupinus

angustifolius for broilers. This study will aim to provide that information.

Detailed information regarding analytical methods and procedures applied during animal-feeding trials

are necessary in order to facilitate accurate comparisons between results. This was seldom found in the

literature. In the following two chapters, all details regarding the analytical methods used and the procedures

applied in the trials with Lupinus angustifolius and Canola are included.

It is also evident from the literature that the nutritive value of lupins is not as high as would be predicted

from knowledge of its chemical composition. Several methods of processing have been tested to improve the

nutritional value of lupins. Dehulling typically resulted in a product with lower fibre and higher protein and fat

values. Thermo-mechanical treatments such as pelleting or extrusion are likely to contribute to the breakdown

of the cell walls, thereby allowing greater accessibility of nutrients to digestive enzymes. Very few studies in

the literature have, however, reported on the influence of extrusion of Lupinus angustifolius on broiler

performance. In this study the possible improvements in chick growth and feed conversion efficiency with

additional heat treatment of dehulled lupin seeds were investigated.

As seen from the literature studies, conflicting results of broiler performance with the inclusion of full-fat

canola seed in broiler diets exist and further research is needed in order to clarify this issue. Various heat

treatments and the grinding of the seeds showed promising results in improving the nutritive value of canola. In

the work conducted for this study full-fat canola seed were subjected to heat treatment and the influence thereof

assessed by broiler performance. Initially extrusion was tried, but due to the high oil content of full-fat canola,

it was found that expansion resulted in a better product and less oil-clogging of the equipment. The expander

treatment in this study was without the traditional pre-conditioning phase since the addition of moisture before

heat has been found to accelerate the hydrolysis of glucosinolates.

These shortcomings from the literature review will be addressed in the following two chapters dealing

with the influence of processing of lupins and canola respectively on the apparent metabolizable energy and

broiler performance.

51

CHAPTER 2

The influence of extrusion and dehulling of Lupinus angustifolius on apparent metabolizable

energy (AME) and broiler performance.

2.1 Introduction South Africa relies strongly on imports of oilseeds and oilseed products to satisfy local demand for

protein in animal feed. As with global trends, the demand for these protein sources has also increased in South

Africa (Briedenhann, 2003). Local conventional protein sources are becoming less available and more

expensive (Brand & Brundyn, 2001), thus driving the need to investigate possible alternatives in providing an

adequate source of protein and energy for broiler diets. Lupinus angustifolius have been identified as being

well adapted to the winter rainfall area of the Western Cape and have a high concentration of protein that could

possibly provide a much needed local supply of this nutrient for inclusion in broiler diets. Like most legume

proteins, however, the methionine content of lupins is low, and diets must be supplemented with the sulphur-

containing amino acid to optimize broiler performance (Zaviezo & McGinnis, 1980).

The inclusion of lupin seeds in poultry diets have been limited in the past due to high levels of toxic and

bitter alkaloids that suppresses both feed intake and growth (Guillaume et al., 1979). Since most modern

varieties of L.angustifolius contains low levels of alkaloids (<0.01%), the main constraint seems to be the high

level of CF and possibly NSPs that influence the availability of nutrients for broilers (Brenes et al., 1993). At

20 to 25% of the seed, the hull substantially dilutes the protein nutritional value (Hove, 1974). Dehulling have

increased both the fat and protein content, as well as reduced the total NSP levels of L.angustifolius cv. Emir

(Steenfeldt et al., 2003). The beneficial effect of dehulling on apparent metabolizable energy (AME) and

broiler performance has, however, only been determined with Lupinus albus (Brenes et al., 1993).

The nutritive value of sweet L.angustifolius is not as high as would be predicted from knowledge of its

chemical composition. Even though this legume species does not contain sufficient levels of heat-labile ANFs,

the benefit of thermo-mechanical treatments such as pelleting or extrusion are more likely to be contributed to

the breakdown of the cell walls, which allows accessibility of nutrients to digestive enzymes, rather than to the

inactivation of ANFs (Gatel, 1994). Very little information exists regarding the influence of heat treatment on

L.angustifolius, but positive results in terms of chick growth have been obtained with extrusion (Watkins et al

1988).

The suitability of various levels of L.angustifolius in broiler diets have been evaluated in several studies

(Yule & McBride, 1976; Johnson & Eason, 1990 and Olkowski et al., 2001), but no consensus have been

reached with respect to the maximum level of this lupin species that could sustain broiler growth rates similar

to those of a control diet. Constraints on the maximum inclusion level are not necessarily due to drops in

production above this level, but due to the incidence of wet-sticky droppings that may be promoted by high

levels of lupin NSPs (Chesson, 1990; Farrell et al., 1999).

52

Given their potential future importance to the poultry industry, there is a surprising lack of information

on L.angustifolius in broiler diets under local conditions and the aim of this study is to evaluate the effect of

processing methods such as dehulling and extrusion on improving the AME value, broiler growth rates and feed

conversion efficiency.

2.2 Materials and Methods

Sweet blue lupins (Lupinus angustifolius) cultivar Wonga, used in these experiments were grown in the

Western Cape, South Africa and screened for alkaloids at Irene (Agricultural Research Center, Pretoria) by the

method of Ruiz (1976). The concentration of total alkaloids was found to be less than 0.01%. Some of the

lupins were then dehulled at Nola (Randfontein, Johannesburg) with the percentage hulls reported as 13.7%.

Due to technical difficulties with the equipment, the lupins had to be sent through the rollers twice, resulting in

a rather large powder component of 27.8% and the kernels thus making up only 58.5% of the total weight. All

the lupin seeds were first milled in a hammer mill to pass a 3 mm screen, whereafter a part of the whole and

dehulled seeds were extruded at Equifeeds (Fisantekraal, Cape Town) using a single screw extruder at a barrel

jacket temperature of 120°C. This resulted in four test products: lupin meal (LM), extruded lupin meal (ELM),

dehulled lupin meal (DLM) and extruded dehulled lupin meal (EDLM).

2.2.1 AME Bioassay

Ground test samples of the lupin products were analyzed for dry matter, ash, CP, ether extract and CF by

methods detailed by the Association of Official Analytical Chemists (AOAC, 2000). NDF and ADF fractions

of the products were analyzed according to the procedures described by Goering & Van Soest (1970) and

Robertson & Van Soest (1981). All analyses were performed in triplicate. AME values were determined

according to the European reference method described by Bourdillon et al. (1990). Three hundred and fifteen

21-day-old broilers (Ross 308) were used in the AME bioassay. Five birds were allocated per cage and housed

in an environmentally controlled facility. The test products (LM, ELM, DLM & EDLM) were assayed by

means of a 50:50 blend with yellow maize and each test diet were fed at four levels of intake (45, 60, 75 & 90%

of ad libitum). A treatment consisted of a test diet fed at a specific intake level. Each treatment was replicated

three times. A summary of the treatments used in the AME bioassay is shown in Table 2.1. Energy retention

was calculated according to the method of Bourdillon et al. (1990) and AMEn was obtained by applying the

factor 34.4 kJ/g nitrogen retained or excreted (Hill & Anderson, 1958).

53

Table 2.1 Summary of treatments used in the AME bioassay.

Treatment Description Level of intake (% of ad libitum) 1 Control (Maize) 40 2 Control (Maize) 50 3 Control (Maize) 60 4 Control (Maize) 75 5 6

Control (Maize) 50% LM : 50% Maize

90 45

7 50% LM : 50% Maize 60 8 50% LM : 50% Maize 75 9

10 50% LM : 50% Maize 50% ELM : 50% Maize

90 45

11 50% ELM : 50% Maize 60 12 50% ELM : 50% Maize 75 13 14

50% ELM : 50% Maize 50% DLM : 50% Maize

90 45

15 50% DLM : 50% Maize 60 16 50% DLM : 50% Maize 75 17 18

50% DLM : 50% Maize 50% EDLM : 50% Maize

90 45

19 50% EDLM : 50% Maize 60 20 50% EDLM : 50% Maize 75 21 50% EDLM : 50% Maize 90

LM-Lupin meal; ELM-Extruded Lupin meal; DLM-Dehulled Lupin meal; EDLM-Extruded Dehulled Lupin meal

The test diets were fed in a mash form during the energy determination. Gross energy content of the test

diets and excreta samples was measured using an adiabatic bomb calorimeter (Calorimeter CP500, Digital Data

Systems, Randburg, South Africa). Complete amino acid analysis was done on the test products by Degussa

Africa (Pty) Ltd. The amino acids were analyzed with a Biochrom 20 Amino Acid Analyzer (Amersham

Biosciences) according to the official method 994.12 of the Association of Official Analytical Chemists

(AOAC, 2000).

2.2.2 Broiler Performance Trial

The broiler performance trial was conducted in a starter phase (from day 1 to 20) and a finisher phase

(from day 21 to 42). For each phase two basal diets were formulated to contain all nutrients to fulfill or exceed

the nutritional requirements of broiler chickens for that specific developmental period (NRC, 1998). The one

diet was without any lupin product (control) and the other contained 170g/kg lupin meal (test diet) in the starter

phase and 174 g/kg lupin meal in the finisher phase. These diets were formulated with Winfeed 2 Feed

Formulation to contain similar energy and nitrogen values, using the analyzed values for AMEn, chemical and

amino acid content of the test products and main ingredients. Three more test diets were formed by replacing

the lupin meal with equal quantities of either extruded lupin meal (ELM), dehulled lupin meal (DLM) or

extruded dehulled lupin meal (EDLM). Each of the four test diets were then blended with the control diet at

54

five levels (20%, 40%, 60%, 80%, 100%), resulting in a total of 20 treatments plus a control diet. The summary

of all experimental diets is shown in Table 2.2.

Table 2.2 Summary of treatments used in the broiler performance trial for both the starter and finisher phase.

Treatment % of Control diet % of Test diet 1 80 20% of LM Test Diet 2 60 40% of LM Test Diet 3 40 60% of LM Test Diet 4 20 80% of LM Test Diet 5 6

0 80

100% of LM Test Diet 20% of ELM Test Diet

7 60 40% of ELM Test Diet 8 40 60% of ELM Test Diet 9 20 80% of ELM Test Diet

10 11

0 80

100% of ELM Test Diet 20% of DLM Test Diet

12 60 40% of DLM Test Diet 13 40 60% of DLM Test Diet 14 20 80% of DLM Test Diet 15 16

0 80

100% of DLM Test Diet 20% of EDLM Test Diet

17 60 40% of EDLM Test Diet 18 40 60% of EDLM Test Diet 19 20 80% of EDLM Test Diet 20 21

0 100

100% of EDLM Test Diet 0% of Test Diet

LM-Lupin meal; ELM-Extruded Lupin meal; DLM-Dehulled Lupin meal; EDLM-Extruded Dehulled Lupin meal

Each of the dietary treatments was fed to three replicate groups of 80 as hatched Ross 308 broilers. Five

thousand and forty day-old broiler chicks were housed in 63 litter pens at a stocking density of 21 birds/ m2.

Wood shavings at a depth of 60mm was used as floor material and checked regularly by means of visual

inspection for wetness. The birds were housed in a closed, environmentally controlled unit with localized

brooding. Initial starting temperature was 33°C, decreasing gradually to 21°C at 21 days of age and maintained

at that level. A 23-hour light: 1 hour dark lighting programme was followed. The diets were fed ad libitum in

the starter (Table 2.3) and finisher phase (Table 2.4) and were crumbed for the starter and cold pelleted for the

finisher diets. The birds were starved for 3 to 5 hours prior to weighing to reduce the error associated with the

digesta contents of the individual birds.

Body weight gain and feed consumption were recorded weekly, with mortalities being recorded daily to

correct the calculated feed conversion ratio (FCR) values. The experiment had a factorial design with main

effects being the processing procedure and blend. The results obtained from the experiment were subjected to

analysis of variance using the General Linear Models (GLM) procedure of SAS ® software (SAS Institute,

2000). The interaction between blends and treatments for both the starter and finisher diets were found to be

55

significant (P< 0.001) and will be discussed accordingly. Differences between treatment means were identified

using a Student’s T test.

Table 2.3 Composition and calculated nutrient content of starter diets (g/kg on a 10% moisture basis) Ingredients Control Test Maize 503.0 428.0 Maize gluten 60 42.0 22.1 Wheat bran 20.0 0.5 Test Ingredient* - 170.0 Soyabean Oilcake 46 152.6 113.2 Sunflower Oilcake 37 87.5 87.5 Fish meal 65 110.0 88.5 Oil - sunflower 56.3 59.2 L-lysine HCL 0.5 - DL-methionine 5.0 4.8 Limestone 9.4 10.0 Monocalcium-P 9.1 11.5 Salt 0.4 1.0 Sodium bicarbonate 2.7 2.2 Vit+min premix1 2.5 Coccidiostat (Salinomycin, 12%)2

2.5 0.5 0.5

Calculated nutrient content3 Control LM* ELM* DLM* EDLM* AMEn (MJ/kg) 12.68 12.32 12.13 12.35 12.22 Crude protein 244.8 239.6 245.0 255.7 259.4 Crude fiber 38.3 61.6 59.6 41.3 39.5 Ether extract 94.9 100.3 100.4 101.4 102.1 Lysine 10.7 10.3 10.5 10.9 11.1 Methionine 10.0 8.9 8.9 9.0 9.0 Threonine 11.7 10.8 10.9 11.2 11.4 Tryptophan 2.6 2.4 2.5 2.6 2.6 Arginine 13.1 15.1 15.9 17.1 17.9 Calcium 9.9 10.1 10.1 9.8 9.8

*Test ingredient includes either of the following lupin products: LM – lupin meal; ELM – extruded lupin meal; DLM – dehulled lupin meal; EDLM – extruded dehulled lupin meal. 1 Vitamin and mineral premix: Commercial broiler premix supplied by Roche Ltd. (Pty). 2 Salinomycin (12%) supplied by Profile Feeds, Cape Town. 3 Nutrient content calculated with Winfeed 2 Feed Formulation program

2.3 Results and Discussion

3.3.1 AME Bioassay

The chemical and amino acid composition of the four test products are shown in Table 2.5. The most

noticeable changes occurred with the dehulling of lupins. It increased the protein (27.9 vs. 37.4%), fat (5.9 vs.

6.6%) and lysine contents (1.2 vs. 1.6%) in relation to lupin meal (LM) and the removal of the fibrous hull also

resulted in a kernel component (DLM) with a substantially reduced CF (5.4 vs. 17.3%) content.

These results are similar to those reported by previous studies (Fernández & Batterham, 1995; Steenfeldt

et al., 2003). This effect of dehulling was also portrayed by the extruded dehulled lupin meal (EDLM) diet with

similar increases than those observed in DLM for protein, fat and lysine contents as well as a decrease in the CF

content in relation to extruded lupin meal (ELM). The AMEn value of DLM is superior to that of LM (8.81 vs.

8.61 MJ/kg) just as the AMEn value of EDLM is higher than that of ELM (8.04 vs. 7.52 MJ/kg). This is most

probably due to the removal of the fibrous pericarp that resulted in a more nutrient dense product. Brenes et al.

56

(1993) also observed a higher digestibility of energy when comparing dehulled to whole lupins. Steenfeldt et al.

(2003) postulated that another possible beneficial effect of dehulling on the AME value of lupins could be

related to the reduction of NSPs that occurs with dehulling, thereby leading to the alleviation of their anti-

nutritional effect on the availability of ME (Choct et al., 1996). It is also interesting to note that the dehulling of

lupin meal resulted in a substantial reduction in the Ca content of DLM, but that the P content remained similar

(Table 2.5). This could be due to the fact that the lupin seed coats are unique in having no detectable

phosphorous (Hove, 1974).

Table 2.4 Composition and calculated nutrient content of finisher diets (g/kg on a 10% moisture basis) Ingredients Control Test Maize 574.6 499.5 Maize gluten 60 10.0 15.0 Wheat bran 10.6 9.0 Test Ingredient* - 174.0 Soyabean Oilcake 46 151.0 128.7 Sunflower Oilcake 37 71.0 21.5 Fish meal 65 103.3 59.8 Oil - sunflower 53.8 59.7 L-lysine HCL - 0.3 DL-methionine 5.0 4.7 Limestone 8.2 10.5 Monocalcium-P 7.6 12.1 Salt 0.6 2.4 Sodium bicarbonate 2.7 1.3 Vit+min premix1 3.0 3.0 Calculated nutrient content2 Control LM* ELM* DLM* EDLM*

AMEn (MJ/kg) 12.84 12.48 12.29 12.51 12.38 Crude protein 218.8 207.4 212.9 223.8 227.6 Crude fiber 35.6 53.7 51.7 32.9 31.1 Ether extract 93.4 100.8 100.9 101.9 102.6 Lysine 9.7 8.8 8.9 9.4 9.6 Methionine 9.4 8.0 8.0 8.1 8.1 Threonine 10.6 9.1 9.2 9.5 9.7 Tryptophan 2.4 2.1 2.1 2.2 2.3 Arginine 12.1 13.0 13.8 15.1 15.9 Calcium 8.9 9.1 9.1 8.9 8.8

*Test ingredient includes either of the following lupin products: LM – lupin meal; ELM – extruded lupin meal; DLM – dehulled lupin meal; EDLM – extruded dehulled lupin meal 1 Vitamin and mineral premix: Commercial broiler premix supplied by Roche Ltd. (Pty) 2 Nutrient content calculated with Winfeed 2 Feed Formulation program

From Table 2.5 it can be seen that the extrusion of lupin products (ELM and EDLM) resulted in an

increased protein and fat content when compared to their raw counterparts (LM and DLM). Woodroofe (1999)

indicated that the cooking action of extrusion is responsible for the mild breakdown of the protein structure and

that either the shear force during extrusion processing or the expansion of the product once it makes contact

with the atmosphere, ruptures the oil cells and releases the additional fat. As can be expected, the amino acid

content of the extruded lupin products showed similar increases to that of the CP contents when compared with

LM and DLM. The increase in protein content (31.05% vs. 27.88%) of the ELM compares well to that

observed by Prinsloo (1993), where the extrusion of L.angustifolius under similar conditions resulted in an

57

increase in protein content from 27.81% to 30.91% (10% moisture basis). It was expected that the extrusion of

LM would result in an increased AMEn value, especially in the light of the increased fat contents. Plavnik &

Sklan (1995) have observed that such an increase are one of the main contributors towards an increased ME

value. This was, however, not found with either the ELM or the EDLM products. Prinsloo (1993) evaluated

the effect of extrusion of L.angustifolius on the AME value with adult cockerels and reported an increase from

6.71 MJ/kg to 7.58 MJ/kg. This AME value for LM is lower than the value observed for AMEn in this study

(8.61 MJ/kg). The expansion that occurs during extrusion could have resulted in a product with increased

bulkiness. Due to the mash form in which the products were presented during the energy assay, it may have led

to a decreased energy intake of the extruded products (with a more constant energy excretion) and could thus

have contributed to the decreased AMEn value observed. For future energy assays, extruded lupin products

should be pelleted in order to minimize differences in feed intake.

Table 2.5 Chemical and amino acid composition of different lupin products (10% moisture basis) Composition1

Lupin Meal (LM) Extruded Lupin Meal (ELM)

Dehulled Lupin Meal (DLM)

Extruded Dehulled Lupin Meal (EDLM)

Crude Protein 27.88 31.05 37.35 39.53 AMEn MJ/kg 8.61 7.52 8.81 8.04 Ether extract 5.89 5.95 6.55 6.94 Crude Fiber 17.25 16.10 5.35 4.30 ADF 2 24.93 22.88 11.07 9.84 NDF 3 27.09 24.54 10.59 7.38 Ash 3.31 3.35 3.05 3.05 Ca 0.31 0.28 0.15 0.12 P 0.38 0.44 0.44 0.53 Mn (mg/kg) 37.39 39.99 32.13 38.50 Amino acids Arginine 2.67 3.15 3.88 4.36 Aspartic acid 2.58 2.90 3.52 3.85 Glutamic acid 5.16 6.04 7.25 8.20 Glycine 1.09 1.21 1.45 1.58 Histidine 0.76 0.83 1.04 1.11 Isoleucine 1.04 1.15 1.45 1.58 Leucine 1.75 1.94 2.37 2.58 Lysine 1.22 1.32 1.58 1.68 Methionine 0.15 0.16 0.19 0.19 Phenylalanine 1.01 1.13 1.39 1.51 Threonine 0.92 1.00 1.18 1.26 Tryptophan 0.23 0.25 0.31 0.33 Valine 1.05 1.13 1.46 1.52 1 % DM unless stated otherwise; 2 Acid detergent fiber; 3 Neutral detergent fiber

2.3.2 Broiler Performance Trial

The broiler performance results have been divided between the effects observed with the starter diets at

the end of 3 weeks of age (Table 2.6) and those with the finisher diets at the end of 6 weeks of age (Table 2.7).

The trends evident at 3 weeks of age were generally very similar to those observed for 6 weeks of age,

especially for feed intake and broiler body weight.

58

2.3.2.1 0 to 3 Weeks

There was a significant (P<0.001) interaction between treatments (LM, DLM, ELM, EDLM) and blends

(0, 20, 40, 60, 80 & 100%). Body weight at 21 days of age (Table 2.6), for birds that were fed diets containing

up to 80% of the LM test diet were heavier (P<0.05) than the control birds, but the 100% inclusion of the LM

test diet resulted in broiler body weights that were lower (P<0.05) than the control birds. Most of the increased

body weights that were observed can be explained by the higher feed intakes of broilers fed various levels of

the LM test diet, when compared to those of the control birds, even though only the 60, 80 and 100% blends

resulted in significant increases (P<0.05). It is also apparent from the data that LM does not contain any ANFs

that could negatively influence the feed intake of broilers, since the increasing levels of LM test diet did not

result in equally significant (P<0.05) reductions in feed intake. These findings are in agreement with those

reported by Olver & Jonker (1997), indicating that when the alkaloid level of sweet lupin seed is less than 0.1

g/kg, there are no deleterious effects on broilers in terms of feed intake. It is, however, also possible that the

anti-nutritional effect of the lupin NSPs on the availability of nutrients such as lysine may have resulted in the

increased feed intake that was observed for broilers fed diets containing LM. FCR was positively affected

(P<0.05) up to 60% inclusion of LM in the test diet. The decreased body weight (P<0.05), despite the increased

feed intake of the 100% inclusion of LM test diet, resulted in a higher (P<0.05) FCR. This demonstrates that

the inclusion of 17% lupin meal in a broiler starter diet does have a significant (P<0.05) influence on the

efficiency with which broilers are able to convert the feed ingested into body weight. Perez-Maldonado et al.

(1999) found that the high NSP contents of lupins are in accordance with the higher gut viscosity (P<0.05) they

have observed in laying hens. This increased digesta viscosity could result in a decreased rate of diffusion of

substrates and digestive enzymes as well as interfering with their effective interaction at the mucosal surface

(Mohanna et al., 1999), thereby influencing the efficiency with which nutrients are absorbed and utilized by the

bird. This anti-nutritional effect of the high NSP content of lupins might thus be responsible for a lower lysine

availability than was anticipated. Since lupins already contain a rather limiting amount of lysine (Larbier &

Leclercq, 1994) and the starter test diets were only supplemented with DL-methionine, it could have

contributed to the increased feed intakes that was observed with increasing levels of LM. It is to be noted that

the incidence of wet-sticky droppings, which are normally associated with high levels of soluble

polysaccharides (Chesson, 1990), were observed in all the pens fed a 100% blend of the LM test diet.

59

Table 2.6 Effect of increasing levels of lupin meal, dehulled lupin meal, extruded lupin meal and extruded dehulled lupin meal on broiler performance to 3 weeks of age Lupin Test Ingredient

Level of inclusion of test diet

(g/kg)

Body weight (g)

Feed Intake (g)

Feed conversion ratio (g feed /g weight)

Lupin Meal (LM) 0 709.79 1011.34 1.423 20 738.49 1028.61 1.390 40 727.11 1020.50 1.404 60 741.88 1036.34 1.396 80 728.10 1029.28 1.416 100 691.82 1037.25 1.501 Dehulled Lupin Meal 0 709.79 1011.34 1.423 (DLM) 20 744.19 1025.21 1.377 40 777.76 1069.99 1.373 60 788.01 1077.15 1.364 80 804.87 1085.96 1.348 100 793.98 1066.38 1.345 Extruded Lupin Meal 0 709.79 1011.34 1.423 (ELM) 20 711.41 1006.76 1.416 40 713.68 1012.14 1.417 60 709.62 1010.77 1.425 80 699.55 1003.73 1.437 100 687.50 994.04 1.445 Extruded Dehulled 0 709.79 1011.34 1.423 Lupin Meal (EDLM) 20 715.59 1015.23 1.419 40 719.57 1013.23 1.411 60 718.36 1012.18 1.408 80 716.57 1009.91 1.409 LSD

100 710.50 9.51

1000.21 14.34

1.407 0.015

Broilers fed DLM performed better (P<0.05) than the control group in terms of body weight for all levels

of inclusion of the test diet. Body weight of broilers fed DLM was also higher (P<0.05) than those fed LM

from the 40% inclusion level. This effect could be explained by the higher feed intakes (P<0.05) that were

observed from the same inclusion level when DLM were compared to the LM test diets. The reduction in CF

content with the dehulling of lupin meal resulted in a more nutrient dense product with an increased protein,

energy and fat content (Table 2.5). The broilers fed the DLM diets thus performed better (P<0.05) at each level

from the 40% inclusion level in terms of body weight, feed intake and FCR when compared with the LM diets.

Similar improvements in broiler performance was also observed by Brenes et al. (1993) when they compared

dehulled to whole lupins in an 8-day feeding trial (from 10 to 17 days of age), but the differences were not

found to be significant.

The use of ELM up to 80% inclusion did not affect body weight. However, 100% inclusion resulted in a

significant decrease in body weight (P<0.05). These differences in body weight can be explained by the similar

pattern in feed intake observed in birds fed LM. There were no differences (P<0.05) in feed intake when birds

60

were fed the test diets up to the 80% level. Birds fed the diet containing 100% ELM consumed less (P<0.05)

feed than those on the control diet. Since FCR is dependent on both these variables, it is not surprizing to find

that the FCR was also similar to that of the control up until the 80% inclusion of ELM test diets, whereafter the

ratio increased (P<0.05). In comparison with the LM diets, it is clear that the ELM diets did not perform as

well. For body weight, the broilers fed ELM diets performed worse (P<0.05) at all levels of inclusion of the

test diet and for the other performance parameters, feed intake and FCR, the birds also performed worse at all

levels, but only significantly so (P<0.05) for the 20, 60, 80 and 100% inclusion of ELM test diets. Prinsloo

(1993) also investigated the effect of extrusion of L.angustifolius on broiler performance and found significant

reductions (P<0.05) in body weight, feed intake and feed conversion efficiency at 25 days of age. Conversely,

Watkins & Mirosh (1987) observed an improvement (P<0.05) in broiler growth rate and feed efficiency when

they compared extruded vs. raw lupins. The decreased feed intake that was observed in this study for ELM in

comparison with LM, may have resulted from the increased bulkiness of the feed due to the extrusion process.

In addition, the high oil content of the diets (± 10%) resulted in a relatively high breakage of the starter crumbs

and may have negatively influenced the feed intake of the birds.

The combination of dehulling and extrusion of lupin meal (EDLM) performed similar to that of the ELM

diets for feed intake, body weight and FCR. Even though the EDLM diets resulted in numerically superior

results for all inclusion levels in all the performance parameters, the only significant differences (P<0.05)

between the two diets were found to be at levels 80 and 100% for body weight and 60, 80 and 100% for FCR.

The reduction in CF level with the additional dehulling of ELM may have been responsible for the slightly

better response observed in comparison with ELM diets, but as mentioned before the results are not significant

at all levels of inclusion. When comparing the results from the inclusion of DLM with those of the EDLM, it is

clear that the additional extrusion process resulted in significantly (P<0.05) lower broiler performances for all

parameters at all inclusion levels, except the 20% level for feed intake. Reasons for the decreased performance

of broilers with the EDLM are similar to those given for comparison between LM and ELM diets.

The interaction between blends and treatments for the starter diets is highly significant (P<0.001).

Dehulling increased broiler performance at all levels, while extrusion decreased the nutritional value of lupins

for broilers.

2.3.2.2 3 to 6 Weeks

The finisher diets were fed from day 21 until 42 days of age and broiler performance was measured in

terms of body weight, food intake and feed conversion ratio (g feed / g weight). The results at the end of 6

weeks are shown in Table 2.7. A significant (P<0.001) interaction was also observed between all treatments

(LM, DLM, ELM, EDLM) and blends (0, 20, 40, 60, 80 & 100%). The 6-week body weight of broilers being

fed the LM test diets were higher (P<0.05) than those of the control group for all levels of inclusion up to the

80% level, whereafter it decreased to less (P<0.05) than those of the control group. These results are similar to

those recorded during the starter period. With increasing levels of LM test diet, the feed intake of broilers also

increased, but was only significantly higher than the control group from the 60% inclusion level of LM test

61

diet. It is possible that the anti-nutritional effect of the lupin NSPs on the availability of nutrients such as lysine

may have influenced the feed intake of broilers with diets containing LM. The FCR at 42 days of age

progressively increased with increasing levels of LM, but was only significantly higher (P<0.05) than those of

the control group from the 60% inclusion level. These results are somewhat different from those observed at

the end of 3 weeks of age, suggesting that despite the increased feed intakes of the birds during the finisher

phase, they still could not compensate for their increased requirements. This is especially significant (P<0.05)

for the 60%, 80% and 100% inclusion levels of LM test diet. The 100% inclusion of LM test diet also showed

similar results at the end of 6 weeks than was observed at the end of 3 weeks and again demonstrates that the

inclusion of 17.4% LM in a broiler finisher diet does have a significant (P<0.05) influence on the efficiency

with which broilers are able to convert the feed ingested into body weight.

Table 2.7 Effect of increasing levels of lupin meal, dehulled lupin meal, extruded lupin meal and extruded dehulled lupin meal on broiler performance to 42 days of age Lupin Test Ingredient Level of inclusion of

test diet (g/kg)

Body weight (g)

Food Intake (g)

Feed conversion ratio (g feed /g weight)

Lupin Meal (LM) 0 2278.51 4020.17 1.77 20 2295.88 4071.36 1.77 40 2301.25 4080.12 1.78 60 2284.24 4098.92 1.80 80 2272.04 4113.76 1.82 100 2214.22 4138.26 1.87 Dehulled Lupin Meal 0 2278.51 4020.17 1.77 (DLM) 20 2303.72 4069.36 1.77 40 2372.47 4197.95 1.77 60 2359.40 4206.47 1.77 80 2359.58 4209.12 1.78 100 2341.73 4183.22 1.79 Extruded Lupin Meal 0 2278.51 4020.17 1.77 (ELM) 20 2264.37 4027.96 1.78 40 2271.91 4044.79 1.78 60 2259.25 4035.99 1.79 80 2239.92 4047.88 1.81 100 2194.20 4046.35 1.84 Extruded Dehulled 0 2278.51 4020.17 1.77 Lupin Meal (EDLM) 20 2282.83 4025.30 1.77 40 2276.31 4038.54 1.77 60 2263.09 4020.18 1.78 80 2243.15 4010.23 1.79 LSD

100 2227.05 23.70

3989.75 40.69

1.79 0.01

The body weight of broilers fed DLM test diets were higher (P<0.05) than the control group from the

40% inclusion level upwards and can be explained by the higher feed intakes (P<0.05) that were observed at all

inclusion levels when DLM were compared to the control diets. In comparison with the control group, the

broilers that were fed the DLM test diets had similar FCRs up until the 60% inclusion level, whereafter it

62

increased significantly (P<0.05). Similar to the 3-week results, the broilers fed the DLM test diets performed

better (P<0.05) than those on the LM test diets in terms of body weight and feed intake from the 40% inclusion

level. For FCR, however, the trend as seen at 3 weeks of age was reversed in that the ratio increased

significantly (P<0.05) with increasing levels of DLM from the 60% inclusion level. The improved body weight

and feed intake of broilers fed DLM in comparison with LM could be explained by the effect of dehulling on

the nutrient density of the lupin product, but the reason for the change from 3 to 6 weeks in the efficiency with

which broilers can convert high levels of DLM into body weight is not exactly clear. A possible explanation

might be that at these high intake levels (almost four times as much as the starter feeds), the anti-nutritional

influence of NSPs might exert a bigger effect on the FCR. Unfortunately, no other broiler performance studies

with similar comparisons between increasing levels of dehulled and whole lupins have been reported that could

support these findings.

When ELM was fed to broilers up until the 60% inclusion level, it resulted in body weights that did not

differ significantly from those of the control group, but the 80 and 100% levels did result in lower body weights

(P<0.05). Feed intake of broilers fed the ELM test diets was similar to that of the control birds for all levels of

inclusion, with the FCR being increased (P<0.05) in comparison to the control group for all levels of inclusion

of ELM. This effect might indicate that the intake of ELM not only have a negative effect on the FCR from the

80% inclusion level as seen at 3 weeks of age, but that the higher feed intakes needed at 6 weeks of age could

have resulted in the overall negative effect on FCR observed for all levels of inclusion of the ELM test diets.

The bulkiness of the feed and the possible negative effect of extrusion processing (Maillard reaction) on the

availability of lysine might also have reduced the potential growth of broilers at these high intake levels. The

ELM diets did not perform as well when compared with the LM diets. Similar results were observed at 3

weeks. At each inclusion level, the broilers fed the ELM diets weighed less than those on the LM diets and

significantly (P<0.05) so up to the 80% inclusion level. The broilers also consumed less of the ELM feed than

the LM at all inclusion levels, but only the 20, 60, 80 and 100% levels proved to be significant (P<0.05). The

FCR of broilers fed the ELM test diets were, however, similar to those of the LM test diets at all levels of

inclusion, except for the 100% blend where the LM test diet resulted in a higher (P<0.05) average value.

Broilers fed EDLM performed similar to that of the ELM diets. There were no differences (P<0.05) in

body weight for these birds compared to those of the control group up to the 60% inclusion level, but the 80

and 100% inclusion of EDLM test diets resulted in lower (P<0.05) body weights. Similar feed intakes to the

control group were observed for all levels of inclusion of the EDLM test diets and just as with the ELM diets,

the FCR also increased progressively with increased inclusion levels of EDLM, but this was only significant

from the 80% level when compared with the control group. In comparison with the ELM diets, broilers fed the

EDLM diets weighed more and ate less at each level of inclusion, but these were only significant (P<0.05) at

the 100% inclusion level for both these parameters. It is thus not surprizing that the FCR for EDLM diets were

generally lower than those obtained from the ELM diets for all inclusion levels, but again these were only

found to be significantly (P<0.05) lower for the 20, 80 and 100% levels. The reduced CF level of EDLM vs.

ELM (Table 2.5) also resulted in test diets with a lower CF content (Table 2.4) and thus a more nutrient dense

63

diet that will reduce the amount of feed intake and increase broiler weight per unit of feed intake (i.e. reducing

FCR). Since the advantage of the additional processing procedure (EDLM) were not significant (P<0.05)

throughout the inclusion levels, it is unlikely that the additional cost will benefit broiler production above that

of using only ELM. When comparing the results from the inclusion of DLM with those of EDLM, it is clear

that the additional extrusion process resulted in lower (P<0.05) broiler body weights at all inclusion levels as

well as lower (P<0.05) feed intakes from the 40% inclusion level of EDLM. The difference in FCR between

EDLM and DLM at all levels of inclusion was, however, not significant (P<0.05) and might indicate that the

beneficial effect of dehulling could override the negative response seen with the extruded lupin products.

2.4 Conclusion

It can be concluded from the results presented that the dehulling of lupins have resulted in superior

broiler performance in terms of body weight, feed intake and feed conversion ratio (g feed / g weight) when

compared with LM, ELM or EDLM. The dehulling of lupin meal produced a more nutrient dense product and

was also responsible for the highest AME measured for the lupin products. The extrusion of lupins on the other

hand did not perform as well when compared to LM and DLM and this method of processing, under the

specific conditions as indicated for this trial, is not recommended for lupins at this stage. The combination of

extrusion and dehulling of lupins did not produce any further benefits in terms of a better broiler response.

64

CHAPTER 3

The influence of expansion of Full-fat Canola seed on apparent metabolizable energy (AME)

and broiler performance.

3.1 Introduction

Full-fat canola seeds contain approximately 40% oil and 21 to 23% CP (Robblee et al., 1989) and its

inclusion in poultry diets as a high energy-high protein feed ingredient could prove especially beneficial in the

hot South African climate. It is, however, evident from literature that research on the use of canola meal in

poultry diets have far exceeded that of the canola seed and a general lack of information therefore exists

regarding the inclusion of this oilseed in its full-fat form in poultry diets.

The amino acid content of canola compares favourably with that of soyabean meal, with canola

consisting of more of the sulphur-containing amino acids methionine and cystine (Clandinin et al., 1989). The

lysine content of the canola seed protein is also superior to that of soyabean meal (Lee et al., 1995). The

complementary amino acid profile of canola and soyabean therefore makes the combination of these protein-

rich feedstuffs well suited in poultry nutrition. Appreciable variation exist amongst reported values for ME of

canola seed (Sibbald, 1977a; Sibbald & Price, 1977; Muztar et al., 1978 and Muztar et al., 1980) and have been

contributed to differing responses of individual birds to the palatability and texture of the seeds as well as the

influence of grinding of the seed (Muztar et al., 1978).

Even though it has been recommended that canola seeds are grinded to reduce the variability in ME

values (Muztar et al., 1978), it also results in the activation of myrosinase that hydrolyses the glucosinolates

into their toxic and goitrogenic components with resultant detrimental effects for the birds ingesting these

components (Pickard et al., 1989). It has, however, been found that some form of heat treatment of the canola

seed prior to inclusion in poultry diets will inactivate myrosinase and lead to an improvement in broiler

performance (Woodly et al., 1972; Leeson et al., 1978). Bayley & Summers (1975) have also reported that

extrusion resulted in an improvement in the nutritional value of this oilseed in diets for growing chicks above

that of a maize-soyabean control diet, but only to a maximum 10% inclusion level. The literature provides

conflicting results in broiler performance trials with the inclusion of full-fat canola (Leeson et al., 1978;

Summers et al., 1982 and Lee et al., 1991) and further research is needed to establish a maximum inclusion

level of canola seed that will optimize broiler performance. The aim of this study is to contribute information

regarding the influence that a heat treatment, such as expansion, has on the AME value of full-fat canola and to

establish whether an improvement in broiler performance is evident with such treatment.

3.2 Material and Methods

Full-fat canola seeds (Brassica rapa) cultivar Outback, were obtained from a producer in the Western

Cape, South Africa. The canola seeds were mixed in a 50:50 ratio with maize and milled in a hammermill to

pass a 3 mm screen. The batch had to be sent through the mill twice in order to reduce the amount of whole

canola seeds in the mixture. The addition of maize to the canola seeds assisted with the processing of the seeds,

65

since the high oil content of the canola could hamper the efficiency of the machines during processing

(Summers et al., 1982). The canola-maize mixture was then expanded at Equifeeds (Fisantekraal, Cape Town).

Initially extrusion was tried, but due to the high oil content of full-fat canola, it was found that expansion

resulted in a better product and less oil-clogging of the equipment. The expander treatment (120°C) was

without a pre-conditioning phase, since the addition of moisture before heat has been found to accelerate the

hydrolysis of glucosinolates (Pickard et al., 1989). This resulted in two test products: canola full-fat (CFF) and

expanded canola full-fat (ECFF).

3.2.1 AME Bioassay

The AME determination for the test ingredients was performed as described in Chapter 2. A total of 195

21-day-old broilers (Ross 308) were used in this trial. A summary of the treatments used in the AME bioassay

is shown in Table 3.1.

Table 3.1 Summary of treatments used in the AME bioassay

Treatment Description Level of intake (% of ad libitum) 1 Control (Maize) 40 2 Control (Maize) 50 3 Control (Maize) 60 4 Control (Maize) 75 5 6

Control (Maize) 50% CFF : 50% Maize

90 45

7 50% CFF : 50% Maize 60 8 50% CFF : 50% Maize 75 9

10 50% CFF : 50% Maize 50% ECFF : 50% Maize

90 45

11 50% ECFF : 50% Maize 60 12 50% ECFF : 50% Maize 75 13 50% ECFF : 50% Maize 90

CFF-Canola full-fat; ECFF-Expanded Canola full-fat

3.2.2 Broiler Performance Trial Two basal diets were formulated to contain all nutrients to fulfill or exceed the nutritional requirements

of broiler chickens (NRC, 1998) during a starter phase (from day 1 to 20) and a finisher phase (from day 21 to

42). The one diet was without any canola product and served as the control, while the other contained 169g/kg

CFF (test diet) in both the starter and finisher phase. Another test diet was formed by replacing the CFF with

an equal quantity of ECFF. The diets were formulated and blended as described in Chapter 2. A summary of all

experimental diets used in this broiler performance trial is shown in Table 3.2.

Each of the dietary treatments was fed to three replicate groups of 40 as hatched Ross 308 broilers. One

thousand three hundred and twenty day-old broiler chicks were housed in 33 litter pens at a stocking density of

21 birds/ m2. Wood shavings at a depth of 50mm was used as floor material. The birds were housed in a closed,

environmentally controlled unit with localized brooding. Initial starting temperature was 33°C, decreasing

66

gradually to 21°C at 21 days of age and maintained at that level. A 23-hour light: 1 hour dark lighting

programme was followed. The diets were fed ad libitum in the starter (Table 3.3) and finisher phase (Table 3.4)

and were crumbed for the starter and cold pelleted for the finisher diets. The birds were starved for 3 to 5 hours

prior to weighing to reduce the error associated with the digesta contents of the individual birds.

Table 3.2 Summary of treatments used in the broiler performance trial for both the starter and finisher phase

Treatment % of Control diet % of Test diet 1 80 20% of CFF Test Diet 2 60 40% of CFF Test Diet 3 40 60% of CFF Test Diet 4 20 80% of CFF Test Diet 5 6

0 80

100% of CFF Test Diet 20% of ECFF Test Diet

7 60 40% of ECFF Test Diet 8 40 60% of ECFF Test Diet 9 20 80% of ECFF Test Diet

10 11

0 100

100% of ECFF Test Diet 0% of Test Diet

CFF-Canola full-fat; ECFF-Expanded Canola full-fat Table 3.3 Composition and calculated nutrient content of starter diets (g/kg on a 10% moisture basis) Ingredients Control diet Test diet Maize 503.0 473.0 Maize gluten 60 42.0 38.1 Wheat bran 20.0 0.5 Test Ingredient* - 169.0 Soyabean Oilcake 46 152.6 138.4 Sunflower Oilcake 37 87.5 62.8 Fish meal 65 110.0 88.4 Oil - sunflower 56.3 0.5 L-lysine HCL 0.5 - DL-methionine 5.0 4.6 Limestone 9.4 9.2 Monocalcium-P 9.1 10.9 Salt 0.4 1.1 Sodium bicarbonate 2.7 2.3 Vit+min premix1 2.5 2.5 Coccidiostat (Salinomycin, 12%)2 0.5 0.5 Calculated nutrient content3 Control CFF* ECFF*

AMEn (MJ/kg) 12.68 12.17 12.79 Crude protein 244.8 241.2 241.5 Crude fibre 38.3 53.8 53.1 Ether extract 94.9 100.7 102.2 Lysine 10.7 10.9 10.8 Methionine 10.0 9.6 9.5 Threonine 11.7 11.4 11.4 Arginine 13.1 13.2 13.1 Calcium 9.9 10.1 10.0

*Test ingredient includes either of the following canola products: CFF – canola full-fat; ECFF – expanded canola full-fat. 1 Vitamin and mineral premix: Commercial broiler premix supplied by Roche Ltd. (Pty). 2 Salinomycin (12%) supplied by Profile Feeds, Cape Town. 3 Nutrient content calculated with Winfeed 2 Feed Formulation program

67

Body weight gain and feed consumption were recorded weekly, with mortalities being recorded daily to

correct the calculated feed conversion ratio (FCR) values. The results obtained from the experiment were

subjected to analysis of variance using the General Linear Models (GLM) procedure of SAS ® software (SAS

Institute, 2000). Differences between treatment means were identified using the appropriate SED (LSD) and a

Student’s T test.

Table 3.4 Composition and calculated nutrient content of finisher diets (g/kg on a 10% moisture basis) Ingredients Control diet Test diet Maize 574.6 539.3 Maize gluten 60 10.0 21.7 Wheat bran 10.6 - Test Ingredient* - 169.0 Soyabean Oilcake 46 151.0 165.0 Sunflower Oilcake 37 71.0 6.5 Fish meal 65 103.3 61.2 Oil - sunflower 53.8 1.7 DL-methionine 5.0 4.6 Limestone 8.2 9.3 Monocalcium-P 7.6 11.5 Salt 0.6 1.7 Sodium bicarbonate 2.7 2.5 Vit+min premix1 3.0 3.0 Calculated nutrient content2 Control CFF* ECFF*

AMEn (MJ/kg) 12.84 12.27 12.90 Crude protein 218.8 213.6 213.9 Crude fiber 35.6 46.4 45.7 Ether extract 93.4 101.3 102.7 Lysine 9.7 9.5 9.4 Methionine 9.4 8.6 8.6 Threonine 10.6 9.9 9.9 Arginine 12.1 11.4 11.3 Calcium 8.9 9.1 9.1

*Test ingredient includes either of the following canola products: CFF – canola full-fat; ECFF – expanded canola full-fat; 1 Vitamin and mineral premix: Commercial broiler premix supplied by Roche Ltd. (Pty). 2 Nutrient content calculated with Winfeed 2 Feed Formulation program

3.3 Results and Discussion

3.3.1 AME Bioassay

The chemical and amino acid composition of full-fat and expanded canola seed are presented in Table

3.5. The heat treatment increased the AMEn value of full-fat canola from 15.51 MJ/kg to 19.20 MJ/kg. From

the results it is apparent that the increase in available energy content stems mainly from the increase in the fat

content (39.07 % to 39.94%). Even though no other studies were found reporting similar effects of heat

treatment on the chemical composition of full-fat canola, Plavnik & Sklan (1995) reported that the expansion of

maize based diets resulted in a significant increase in the AMEn value and contributed it to the significant

increase in the fat digestibility with the expansion of the diets. The shear force action that takes place when the

feed is projected forward inside the expander barrel as well as the expansion of the product once it makes

contact with the atmosphere, ruptures the oil cells and releases the additional fat (Woodroofe, 1999). A similar

68

effect of extrusion on cell walls have also been found by Bos et al. (1992) and could explain the decrease in CF,

ADF and NDF contents observed in Table 3.5.

Table 3.5 Chemical and amino acid composition of full-fat and expanded canola seed (10% moisture basis) Composition1 Full-fat Canola

(CFF) Expanded Canola Full-fat

(ECFF) Crude Protein 20.30 20.50 AMEn MJ/kg 15.51 19.20 Ether extract 39.07 39.94 Crude Fibre 13.88 13.47 ADF 2 25.50 21.96 NDF 3 25.76 22.85 Ash 2.48 2.44 Ca 0.52 0.51 P 0.71 0.70 Amino acids Arginine 1.35 1.30 Isoleucine 0.86 0.79 Leucine 1.47 1.45 Lysine 1.33 1.26 Methionine 0.43 0.41 Threonine 0.91 0.91 Valine 1.12 1.03 1 % DM unless stated otherwise; 2 Acid detergent fiber; 3 Neutral detergent fiber

The CP content of CFF showed a slight numerical increase with the expansion treatment, but most of the

individual amino acid contents measured, decreased with the heat treatment. Expander processing up to a

temperature of 1200C is not known to have a significant influence on feed protein content nor on the total lysine

content, but Peisker (1992) reported a slight numerical decrease in the content and availability of amino acids at

1300C. The modification of the protein structure that occurs with heat treatment is generally considered as

desirable since it renders the protein more readily available for poultry. Excessive heat treatment, however, may

cause some damage in that the amino acids, especially lysine, could become irreversibly altered and may not be

recovered by acid hydrolysis (Pickard et al., 1989). The results in Table 3.5 might indicate that even though our

heat treatment was measured at an outer barrel temperature of 120°C, our expansion treatment did in fact result

in a slight reduction of total lysine (and other amino acid) contents as measured by acid hydrolysis.

3.3.2 Broiler Performance Trial

The broiler performance results have been divided between the effects observed with the starter diets at

the end of 3 weeks of age (Table 3.6) and those with the finisher diets at the end of 6 weeks of age (Table 3.7).

3.3.2.1 0 to 3 Weeks

Increasing levels of both CFF and ECFF reduced broiler body weights, but this was only found to be

significant (P<0.001) from the 60% inclusion level of either of the test diets ( i.e. 10% of the test ingredients)

when compared with a maize-soyabean control. The goitrogenic products produced by the action of myrosinase

during the milling of canola seeds, have a negative influence on feed intake (Pickard et al., 1989) and might

69

therefore be responsible for the reduction in broiler body weights at levels higher than 10% CFF. These results

are similar to those reported by Bayley & Summers (1975) for the inclusion of more than 10% extruded

rapeseed and that of Leeson et al. (1987) for the inclusion of more than 10% CFF. The expansion treatment of

CFF seeds did not result in any significant improvement (P<0.05) in broiler body weight at any inclusion level

during this period. Leeson et al. (1978) found that the body weight gain of broilers (4 weeks of age) was

unaffected (P<0.05) when they were fed heat-treated whole rapeseed at 10 and 20% of the dietary level. These

results are in agreement with those reported by Olomu et al. (1974). These authors found that neither oven-

heating nor autoclaving (120°C for 10 minutes) resulted in a significant (P<0.05) improvement in broiler body

weight gains when fed at 10 and 20% of the diet. Other reports from the literature, however, show the opposite

effect. Bayley & Summers (1975) fed increasing levels of raw and extruded rapeseed (10, 20, 30, 40 and 50%)

to broilers and found that extrusion did in fact increase the final weight of the bird in relation to the raw

rapeseed. However, the inclusion of more than 10% extruded rapeseed reduced the growth performance in

comparison to the chicks that were receiving the maize-soyabean meal control diets.

Table 3.6 Effect of increasing levels of canola full-fat and expanded canola full-fat on broiler performance to 3 weeks of age Test Ingredient

Level of inclusion of test diet

(%)

Body weight (g) Food Intake (g)

Food conversion ratio (g food /g gain)

Canola Full-fat (CFF) 0 725.59 1000.94 1.39 20 712.59 980.24 1.37 40 709.43 962.26 1.36 60 705.57 954.93 1.36 80 702.19 942.34 1.36 100 695.77 939.93 1.35 Extruded Canola FF 0 725.59 1000.94 1.39 (ECFF) 20 713.15 986.99 1.37 40 701.17 962.00 1.37 60 697.67 959.00 1.37 80 690.19 952.81 1.38 LSD

100 684.17 10.78

951.17 19.43

1.39 0.03

The feed intake of broilers showed a marked response (P≤0.001) with increasing levels of CFF, and for

all inclusion levels from the 40% level a decrease (P<0.05) in feed intake was noticed in comparison with the

maize-soyabean control diet. Studies with laying hens reported reductions in feed intake with full-fat rapeseed

(Leslie & Summers, 1972), and Summers et al. (1982) reported significantly lower feed intakes for broilers

when canola seed diets were fed from 7-24 days of age. Similarly, Bayley & Summers (1975) observed

reductions in feed intake in comparison with a maize-soyabean control when broilers were fed increasing levels

of CFF seeds. The expansion of CFF did not influence the feed intake of broilers at any level of inclusion and

could explain the similar trend that was observed for the body weights during the same starter period. This form

70

of heat treatment as described in this study seemed to be unsuccessful in improving the nutritive value of CFF

and did not influence the negative effect that the ANFs present in canola seed had on feed intake.

Despite the negative effect on body weight, the FCR was improved with the diets containing CFF in

comparison with the control diet when the level of inclusion was above 40% for both weeks 3 and 6. It seems

as if feed intake per se are affected by canola seeds, but that the utilization of the diets are not. Similar results

have been reported by Summers et al. (1982). From the data it also appears as if the reduced feed intakes with

increasing levels of CFF had a more pronounced effect on broiler body weight during the starter phase than

during the finisher phase. These results suggest that as the bird ages it is more capable of utilizing the nutrients

provided by CFF, or that they become less susceptible at the potential ANFs present in the seeds.

3.3.2.2 3 to 6 Weeks

The influence of increasing levels of CFF on broiler body weight was found not to be significant and

even though the body weights were lower than that of the control, none of the inclusion levels resulted in

significant reductions in body weight. For ECFF, the influence of increasing levels on body weight was found

to be significant (P<0.05). When compared with the control diet, the 100% inclusion level resulted in a

significant (P<0.05) reduction in broiler body weight. Similar to the starter period, the expansion treatment of

CFF did not result in significant improvement (P<0.05) in broiler body weights. The 60 and 100% inclusion

levels of ECFF test diet showed a reduction (P<0.05) in broiler body weights with expansion.

Table 3.7 Effect of increasing levels of canola full-fat and extruded canola full-fat on broiler performance to 6 weeks of age. Test Ingredient

Level of inclusion of

test diet (%)

Body weight (g)

Food Intake (g)

Food conversion ratio (g food /g gain)

Control 0 2263.35 3927.77 1.74 Canola Full-fat (CFF) 20 2245.91 3901.10 1.73 40 2233.60 3864.04 1.73 60 2224.77 3831.64 1.72 80 2229.95 3833.18 1.72 100 2230.67 3819.51 1.71 Control 0 2263.35 3927.77 1.74 Extruded Canola FF 20 2225.97 3844.16 1.73 (ECFF) 40 2211.08 3811.50 1.72 60 2203.75 3798.27 1.72 80 2190.09 3780.23 1.72 LSD

100 2167.67 36.75

3739.56 53.20

1.73 0.01

The trend observed for feed intake during the starter period was maintained to week 6 and the increasing

levels of CFF had a significant influence (P<0.01) on the feed intake of broilers during the finishing period.

The 60, 80 and 100% inclusion of the CFF test diet resulted in significant (P<0.05) reductions in feed intake in

comparison with the control diet. Similar results were reported by Leeson et al. (1986) and it is suggested that

71

the reduced feed intakes observed with increasing levels of CFF could be associated with the general

undesirability of these diets. The influence of expansion treatment on the feed intake of broilers was found not

to be significant (P<0.05) and increasing levels of ECFF resulted in reduced feed intakes.

The main difference between the treatments (ECFF and CFF) was found for FCR, where the influence of

increasing levels of ECFF did not result in significant (P<0.05) differences between birds fed the control diets

and those fed ECFF for week 3 and week 6. For CFF the influence of increasing levels was found to be

significant for both the starter and finisher diets (P<0.001). The effect of expansion may not only have

influenced the amino acid content as such (Table 3.5), but also have lead to the decreased availability of some

of the amino acids and thereby negatively influencing the utilization of diets containing ECFF. This effect was,

however, not found to be significant (P<0.05) in relation to the utilization of CFF diets. The increased AMEn

content that was observed for the ECFF test diets in comparison with the CFF test diets (Table 3.3 and Table

3.4) did not lead to any significant differences in broiler performance.

3.4 Conclusion

It can be concluded from the results that the expansion treatment of full-fat canola did not significantly

improve the body weight, feed intake or feed conversion ratio of broilers. Dietary levels above 10% of full-fat

canola resulted in lower body weights and from a 6.8% level the feed intakes were reduced in comparison to

birds on the control diet. The feed intake per se of canola full-fat has been identified as the biggest concern,

since the utilization of the canola diets were found to be better than the control. Thus, the use of ground, low

glucosinolate, low erucic acid Canola seeds can be included in broiler diets up to 10% if body weight is the

main criteria, but dietary levels of 16.9% will perform well in terms of feed conversion ratios.

72

CHAPTER 4

General Conclusion

With this study it was intended to determine the nutritional value of Lupins and Canola for broilers and

to investigate whether any additional processing of the full-fat seeds will lead to improvements in the

nutritional value, and thus a further savings effect on the expensive imports of protein sources. The effects of

extrusion and dehulling of lupins and the expansion of canola were investigated. The influence of these

processing methods on the AME value as well as on broiler response in terms of body weight, feed intake and

feed conversion ratio (g feed / g weight) was measured.

From the results obtained it is clear that the process of dehulling resulted in the most pronounced effect

on the AMEn value of lupins. Due to the reduction in CF content with dehulling, it increased the AMEn value

of L.angustifolius from 8.61 MJ/kg to 8.81 MJ/kg. The CP (27.9 vs. 37.4%), fat (5.9 vs. 6.6%) and lysine

contents (1.2 vs. 1.6%) were also increased in relation to LM. This resulted in a more nutrient dense product

that, with inclusion in broiler diets at the same concentration as LM, produced superior broiler body weights,

feed intakes and a better FCR.

It was expected that the shear force and cooking action of the extrusion process would have resulted in

higher AMEn values, especially due to the greater availability of fat from the rupturing of oil cells, but this was

not found to be the case. The opposite happened and the AMEn value of L.angustifolius was reduced from 8.61

MJ/kg to 7.52 MJ/kg. The CP (27.9 vs.31.1%) and amino acid (Lysine: 1.22 vs. 1.32%) contents did increase,

but it is suspected that the formation of Maillard reaction products during heat treatment might have indeed

reduced the availability of certain amino acids, especially that of lysine. Since lupins are typically low in lysine

contents and the diets were not further supplemented by L-lysine HCL, it might have caused a lysine

deficiency. Broilers would try to compensate by increasing their feed intake up until a certain point, but at the

end of week 6 this only resulted in an increased FCR with increasing levels of ELM. The fact that they did not

increase their feed intake throughout the increasing levels of ELM could be because of the viscosity effect of

the NSPs. Lupins are well known to contain a large amount of NSPs and their anti-nutritional effect stems

from an increased digesta viscosity that reduces the rate of diffusion of substrates and digestive enzymes. This

will influence the efficiency with which nutrients are absorbed and utilized by the bird. Even though the NSP

content was not measured during this trial, the incidence of wet-sticky droppings, which are normally

associated with high levels of soluble polysaccharides, were most pronounced in the pens fed a 100% blend of

lupins. The effect of extrusion on lupins generally resulted in inferior broiler response in comparison with LM

and DLM. It is suggested that this method of processing, as indicated for this study, is not an economically

viable option of improving the nutritive value of L.angustifolius.

Future studies with lupins should concentrate on the influence of soluble polysaccharides and possibly

focus on the application of various carbohydrases in an attempt to improve the nutritive value of lupins.

Various successes have been achieved in this field, but the variability of birds in their ability to adapt to diets

containing lupins or lupin products may be responsible for large variation in the results. This could be related

73

to the extent of proliferation of fermentative microflora in the small intestine of each bird. These microflora

compete directly with the host for potentially absorbable substrates, especially if the absorption rates are

reduced by the presence of viscous polysaccharides. It is thus suggested that the number of repetitions for

nutritional studies with lupins be greatly increased. The inclusion of lupins or dehulled lupins in broiler diets

are usually limited by safety margins in feed formulation and should be guided by the incidence of wet-sticky

droppings at inclusion levels of above 10% (starter) and 13% (finisher) inclusion. Diets should also be

supplemented with lysine and methionine.

The expansion treatment of full-fat canola seed did not significantly improve the body weight, feed

intake or feed conversion ratio of broilers. From the chemical and amino acid evaluation of the test ingredients

it is evident that the heat treatment increased the AMEn value of canola seed. This was expected since the shear

force and expansion process during the heat treatment is known to rupture oil cells, thereby releasing the oil and

increasing the fat content of the product. Since the fat content can be seen as the major contributor towards the

available energy content, this effect of expansion treatment on the AMEn value was not surprising. A similar

mechanism during the expansion treatment is responsible for the decrease in cell wall content as indicated by

the decreased CF, ADF and NDF contents. The CP content of expanded CFF was also increased, but the

individual amino acid contents did not follow the same pattern. Possible overprocessing could be responsible

for the decreased amino acid contents that was observed. Care should be taken when canola seed is subjected to

thermo-mechanical treatments such as expansion or extrusion. Apart from the difference in available energy

content, the canola and expanded canola test diets did not differ much in their calculated nutrient content. The

resulting similarities in broiler performances indicated that the expansion process did not eliminate any anti-

nutritional or other factor in canola seed that might have reduced broiler performance. The inclusion of

increasing levels of CFF resulted in significantly lower body weights than those of the control birds from the

10% level. The feed intake of broilers was also decreased from the 6.8% level of inclusion of full-fat canola.

Since it was found that the utilization of canola diets was better than those of the control from the 6.8%

inclusion of full-fat canola, it appeared as if the feed intake per se can be regarded as the major problem with

canola seed diets for broilers. These results indicate that well grounded canola seeds can be incorporated into

broiler feeds and that heat treatment will not necessarily improve the nutritive value of this oilseed for broilers.

Levels of up to 10% full-fat canola seeds are recommended if body weight is the main criteria, but for the

efficiency of diet utilization, levels of up to 16.9% in broiler starter and finisher diets are acceptable.

74

References

Aguilera, J.F., Molina, E. & Prieto, C., 1985. Digestibility and energy value of sweet lupin seed (Lupinus albus

var. Multolupa) in pigs. Anim. Feed Sci. Technol. 12, 171-178.

Aherne, F.X. & Kennelly, J.J., 1982. Oilseed meals for livestock feeding. In: Recent advances in animal

nutrition. Ed. Haresign, W., Butterworths, London. pp. 39-89.

Ajuyah, A.O., Lee, K.H., Hardin, R.T. & Sim, J.S., 1991. Changes in the yield and in the fatty acid composition

of whole carcasss and selected meat portions of broiler chickens fed full-fat oil seeds. Poult. Sci. 70,

2304-2314.

Allen, J.G., 1998. Toxins and Lupinosis. In: Lupins as Crop Plants. Biology, Production and Utilization. Eds.

Gladstones, J.S., Atkins, C. & Hamblin, J., CAB International. University Press. Cambridge, UK. pp

411-435.

Åman, P. & Graham, H., 1990. Chemical evaluation of polysaccharides in animal feeds. In: Feedstuff

Evaluation. Eds. Wiseman, J. and Cole, D.J.A., Butterworths, London. pp.161-177.

Annison, G., Hughes, R.J. & Choct, M., 1996. Effects of enzyme supplementation on the nutritive value of

dehulled lupins. Br. Poult. Sci. 37,157-172.

AOAC, 2000. Official Methods of Analysis (17th ed.). Association of Official Analytical Chemists, Washington

DC, USA.

Arkcoll, D., Landman, L. & Knight, F., 1998. Suitable areas for growing canola and its market in the Western

Cape. Els. J. 2, 1-6.

Atkins, C.A., Smith, P.M.C., Gupta, S., Jones, M.G.K. & Caligari, P.D.S., 1998. Genetics, Cytology and

Biotechnology. In: Lupins as Crop Plants. Biology, Production and Utilization. Eds. Gladstones, J.S.,

Atkins, C. & Hamblin, J., CAB International. University Press. Cambridge, UK. pp 67-92.

Bach Knudsen, K.E., 1997. Carbohydrate and lignin contents of plant materials used in animal feeding. Anim.

Feed Sci. Technol. 67, 319-338.

Barbour, G.W. & Sim, J.S., 1991. True metabolizable energy and true amino acid availability in canola and flax

products for poultry. Poult. Sci. 70, 2154-2160.

75

Barnett, C.W. & Batterham, E.S., 1981. Lupinus angustifolius cv. Unicrop as a protein- and energy source for

weaner pigs. Anim. Feed Sci. Technol. 6, 27-34.

Batterham, E.S., 1979. Lupinus albus cv. Ultra and Lupinus angustifolius cv. Unicrop as protein concentrates

for growing pigs. Aust. J. Agric. Res. 30, 369-375.

Batterham, E.S., Andersen, L.M., Burnham, B.V. & Taylor, G.A., 1986a. Effect of heat on the nutritional value

of lupin (Lupinus angustifolius) - seed meal for growing pigs. Br.J. Nutr. 55, 169-177.

Batterham, E.S., Andersen, L.M., Lowe, R.F. & Darnell, R.E., 1986b. Nutritional value of lupin (Lupinus

albus) -seed meal for growing pigs: availability of lysine, effect of autoclaving and net energy content.

Br.J. Nutr. 56, 645-659.

Bayley, H.S. & Summers, J.D., 1975. Nutritional evaluation of extruded full-fat soybeans and Rapeseed using

pigs and chickens. Can. J. Anim. Sci. 55, 441-450.

Bayley, H.S., Slinger, S.J., Summers, J.D. & Ashton, G.C., 1974. Factors influencing the metabolizable energy

value of rapeseed meal: level in diet, effects of steam-pelleting, age of chick, length of time on diet,

variety of rapeseed and oil extraction procedure. Can. J. Anim. Sci. 54, 465-480.

Bedford, M.R., Classen, H.L. & Campbell, G.L., 1991. The effect of pelleting, salt, and pentosanase on the

viscosity of intestinal contents and the performance of broilers fed rye. Poult. Sci. 70, 1571-1577.

Bell, J.M., 1982. From Rapeseed to Canola: A brief history of research for superior meal and edible oil. Poult.

Sci. 61, 613-622.

Bell, J.M., 1984. Nutrients and toxicants in rapeseed meal. A review. J. Anim. Sci. 58, 996-1010.

Bell, J.M., 1993. Factors affecting the nutritional value of canola meal: A review. Can. J. Anim. Sci. 73, 679-

697.

Bell, J.M., 1995. Meal and by-product utilization in animal nutrition. In: Brassica oilseeds Production and

Utilization. Eds. Kimber, D. & McGregor, D.I., CAB International. Oxon. UK. pp. 301-337.

Bell, J.M., Keith, M.O., 1991. A survey of variation in the chemical composition of commercial canola meal

produced in western Canadian crushing plants. Can. J. Anim. Sci. 71, 469-480.

Bell, J.M. & Shires, A., 1982. Composition and digestibility by pigs of hull fractions from rapeseed cultivars

with yellow or brown seed coats. Can. J. Anim. Sci. 62, 557-565.

76

Beumer, H., & van der Poel, A.F.B., 1997. Effects on the hygienic quality of feeds. In: Expander processing of

Animal feeds. Ed. Van der Poel, A.F.B., Ponsen & Looijen, Wageningen, The Netherlands.

Bjarnason, J. & Carpenter, K.J., 1969. Mechanisms of heat damage in proteins. 1. Models with acytelated

lysine units. Br. J. Nutr. 23, 859-868.

Blair, R. & Reichert, R.D., 1984. Carbohydrate and phenolic constituents in a comprehensive range of rapeseed

and canola fractions: Nutritional significance for animals. J. Sci. Food Agric. 35, 29-35.

Boldaji, F., Goeger, M.P., Nakaue, H.S., Savage, T.F. & Arscott, G.H., 1986. Effect of autoclaving and cooking

on true metabolizable energy (TME) and N-corrected TMEn content of white lupin, yellow peas and faba

beans. Nutr. Rep. Int. 34, 159-164.

Bourdillon, A., Carré, B., Conan, L., Dupperay, J., Huyghebaert, G., Leclercq, B., Lessire, M., McNab, J. &

Wiseman, J., 1990. European reference method for the in vivo determination of metabolizable energy

with adult cockerels: reproducibility, effect of food intake and comparison with individual laboratory

methods. Br. Poult. Sci. 31, 557-565.

Bos, K.D., Stroucken, W.J.J. & Boer, H., 1997. Effects on the chemical quality of feed. In: Expander

processing of Animal feeds. Ed. Van der Poel, A.F.B., Ponsen & Looijen, Wageningen, The Netherlands.

Brand, T.S., 1996. Die chemiese samestelling en voedingswaarde van ontdopte lupinesaad. Els. J. 1, 23.

Brand, T.S. & Brandt, D.A., 2000. Alkaloid content of South African lupins (L luteus, L albus and L

angustifolius species) and determination thereof by Near Infra-red Reflectance Spectroscopy. S. Afr. J.

Anim. Sci. 30, 11-12.

Brand, T.S. & Brundyn, L., 2001. Die fisiese en chemiese samestelling, energie-inhoud (WMEn) vir hoenders,

sowel as aminosuurbeskikbaarheid van lupiene, fababone en narbonbone. Afma matrix, Sept. pp. 10-15.

Brand, T.S., Brandt, D.A. & Cruywagen, C.W., 2004. Chemical composition, true metabolizable energy

content and amino acid availability of grain legumes for poultry. S. Afr. J. Anim. Sci. 34, 116-122.

Brand, T.S., Olckers, R.C. & van der Merwe, J.P., 1995. Evaluation of faba beans (Vicia faba cv. Fiord) and

sweet lupins (Lupinus albus cv. Kiev) as protein sources for growing pigs. S. Afr. J. Anim. Sci. 25, 31-

35.

Brandt, D.A., 1998. Nutritional evaluation of alternative protein and energy sources in the Western Cape. M.Sc

(Agric) thesis, University of Stellenbosch, South Africa.

77

Brenes, A., Marquardt, R.R., Guenter, W. & Rotter, B.A., 1993. Effect of enzyme supplementation on the

nutritional value of raw, autoclaved, and dehulled lupins (Lupinus albus) in chicken diets. Poult.Sci. 72,

2281-2293.

Brenes, A., Slominski, B.A., Marquardt, R.R., Guenter, W. & Viverose, A., 2003. Effect of enzyme addition on

the digestibilities of cell wall polysaccharides and oligosaccharides from whole, dehulled, and ethanol-

extracted white lupins in chickens. Poult. Sci. 82, 1716-1725.

Briedenhann, E., 2003. Animal Feed Manufacturers’ Association. Chairman’s Report 2002 / 2003. Afma

Matrix December. pp. 3-9.

Brillouet, J. & Riochet, D., 1983. Cell wall polysaccharides and lignin in cotyledons and hulls of seeds from

various lupin (Lupinus L.) species. J. Sci. Food Agric. 34, 861-868.

Campbell, G.L., Rossnagel, B.G. & Classen, H.L. & Thacker, P.A., 1989. Genotypic and environmental

differences in extract viscosity of barley and their relationship to its nutritive value for broiler chickens.

Anim. Feed Sci. Technol. 26,221-230.

Campbell, L.D. & Slominski, B.A., 1989. Further studies on the sources of thiocyanate ion in the excreta of

poultry fed low-glucosinolate rapeseed (Brassica napus) meal. J. Sci. Fd Agric. 47, 61-73.

Campbell, L.D. & Slominski, B.A., 1990. Extent of thermal decomposition of indole glucosinolates during the

processing of canola seed. J.A.O.C.S 67, 73-75.

Carr, R.A., 1995. Processing the seed and oil. In: Brassica oilseeds Production and Utilization. Eds. Kimber, D.

& McGregor, D.I., CAB International. Oxon. UK. pp. 267-290.

Carré, B. & Leclercq, B., 1985. Digestion of polysaccharides, protein and lipids by adult cockerels fed on diets

containing a pectic cell-wall material from white lupin (Lupinus albus L.) cotyledon. Br.J. Nutr. 54, 669-

680.

Carré, B. Brillouet, J-M. & Thibault, J-F., 1985. Characterization of polysaccharides from White Lupin

(Lupinus albus L.) cotyledons. J. Agric. Food Chem. 33, 285-292.

Carré, B., Beaufils, E. & Melcion, J.P., 1991. Evaluation of protein and starch digestibilities and energy value

of pelleted or unpelleted pea seeds from winter or spring cultivars in adult and young chickens. J.Agric.

Food Chem. 39, 468-742.

78

Carré, B., Gomez, J. & Chagneau, A.M., 1995. Contribution of oligosaccharide and polysaccharide digestion,

and excreta losses of lactic acid and short chain fatty acids, to dietary metabolisable energy values in

broiler chickens and adult cockerels. Br. Poultry Sci. 36, 611-629.

Cerning-Beroard, J. & Filiatre, A., 1976. A comparison of the carbohydrate composition of legume seeds:

horsebeans, peas, and lupines. Cereal Chem. 53, 968-978.

Chesson, A., 1990. Nutritional significance and nutritive value of plant polysaccharides. In: Feedstuff

Evaluation. Eds. Wiseman, J. & Cole, D.J.A., Butterworths, London. pp. 179-195.

Choct, M., 2002. Non-starch polysaccharides: effect on nutritive value. In: Poultry Feedstuffs Supply,

Composition and Nutritive value. Eds. McNab, J.M. & Boorman, K.N., CABI Publishing. Cromwell

Press, Trowbridge, UK. pp. 221-235.

Choct, M. & Annison, G., 1992. The inhibition of nutrient digestion by wheat pentosans. Br. J. Nutr. 67, 123-

132.

Choct, M., Hughes, R.J., Wang, J., Bedford, M.R., Morgan, A.J. & Annison, G., 1996. Increased small

intestinal fermentation is partly responsible for the anti-nutritive activity of non-starch polysaccharides in

chickens. Br. Poultry Sci. 37, 609-621.

Clandinin, D.R., Robblee, A.R., Bell, J.M. & Slinger, S.J., 1989. Composition of canola meal. In: Canola meal

for Livestock and Poultry. Publication of Canola Council of Canada. pp. 5-7.

Clement, H. & Renner, R., 1977. Studies on the utilization of high and low erucic acid rapeseed oils by the

chick. Jnl. Nutr. 107, 251-260.

Cox, B., 1998. Marketing and Trade. In: Lupins as Crop Plants. Biology, Production and Utilization. Eds.

Gladstones, J.S., Atkins, C. & Hamblin, J., CAB International. University Press, Cambridge, UK. pp.

437-454.

Creswell, D. & Swick, R.A., 2001a. Formulating with digestible amino acids…part one. Asian Poultry

Magazine January/February. pp. 1-3.

Creswell, D. & Swick, R.A., 2001b. Formulating with digestible amino acids…part two. Asian Poultry

Magazine March/April. pp. 4-6.

Creswell, D. & Swick, R.A., 2001c. Formulating with digestible amino acids…part three. Asian Poultry

Magazine May/June. pp. 7-9.

79

Dale, N., 1996. Variation in feed ingredient quality: oilseed meals. Anim. Feed Sci. Technol. 59, 129-135.

Davidson, J., 1973. The nutritive value of field beans for laying hens. Br. Poult. Sci. 14, 557-567.

Dean, R.W., 2002. Agronomic and political factors influencing feedstuff use. In: Poultry Feedstuffs Supply,

Composition and Nutritive Value. Eds. McNab, J.M. & Boorman, K.N., CABI Publishing, Cromwell

Press, Trowbridge, UK. pp. 3-14.

De Wet, L., 2000. Relevance of gelatinization in monogastric nutrition. AFMA Symposium, October. Pretoria.

pp. 1-12.

D’Mello, J.P.F., 1995. Anti-nutritional substances in Legume seeds. In: Tropical Legumes in Animal Nutrition.

Eds. D’Mello, J.P.F & Devendra, C., CAB International, Wallingford, UK. pp. 135-172

Donovan, B.C., McNiven, M.A., van Lunen, T.A., Anderson, D.M. & MacLeod, J.A., 1993. Replacement of

soyabean meal with dehydrated lupin seeds in pig diets. Anim. Feed Sci. Technol. 43, 77-85.

Edwards, A.C. & Van Barneveld, R.J., 1998. Lupins for livestock and fish. In: Lupins as Crop Plants. Biology,

Production and Utilization. Eds. Gladstones, J.S., Atkins, C. & Hamblin, J., CAB International.

University Press, Cambridge, UK. pp. 385-410.

Edwards, T. & Tucek, M., 2000. Lupins perform well. Asian pork magazine, August/September, 1-5.

El-Difrawi, E.A. & Hudson, B.J.F., 1979. Identification and estimation of carotenoids in the seeds of four

lupinus species. J.Sci.Food Agric. 30, 1168-1170.

Elkin, R.G., 2002. Nutritional components of feedstuffs: a qualitative chemical appraisal of protein.. In: Poultry

Feedstuffs Supply, Composition and Nutritive Value. Eds. McNab, J.M. & Boorman, K.N., CABI

Publishing, Cromwell Press, Trowbridge, UK. pp.57-86.

Engster, H.M., Cave, N.A., Likuski, H., McNab, J.M., Parsons, C.A. & Pfaff, F.E., 1985. A collaborative study

to evaluate a precision-fed rooster assay for true amino acid availability in feed ingredients. Poult. Sci.

64, 487-498.

Evans, A.J., Cheung, P. C-K. & Cheetham, W.H., 1993. The carbohydrate composition of cotyledons and hulls

of cultivars of Lupinus angustifolius from Western Australia. J. Sci. Food Agric. 61, 189-194.

Farrell, D.J., Perez-Maldonado, R.A. & Mannion, P.F., 1999. Optimum incusion of field peas, faba beans, chick

peas and sweet lupins in poultry diets. II Broiler experiments. Br. Poultry Sci. 4, 674-680.

80

Fenwick, G.R. & Curtis, R.F., 1980. Rapeseed meal and its use in poultry diets: A review. Anim. Feed Sci.

Technol. 5, 255-298.

Fenwick, G.R., Spinks, A., Wilkinson, A.P., Heaney, R.K. & Legoy, M.A., 1986. Effect of processing on the

antinutrient content of Rapeseed. J. Sci. Fd. Agric. 37, 735-741.

Ferguson, N.S., Gous, R.M. & Iji, P.A., 2003. Determining the source of anti-nutritional factor(s) found in two

species of lupin (L.albus and L.angustifolius) fed to growing pigs. Livestock Prod. Sci., 84, 83-91.

Fernández, J.A. & Batterham, E.S., 1995. The nutritive value of lupin-seed and dehulled lupin-seed meals as

protein sources for growing pigs as evaluated by different techniques. Anim. Feed Sci. Technol. 53, 279-

296.

Finlayson, A.J., 1974. The amino acid composition of rapeseed hulls. Can. J. Anim. Sci. 54, 495-496.

Francis, G., Makkar, H.P.S. & Becker, K., 2001. Antinutritional factors present in plant-derived alternate fish

feed ingredients and their effects in fish. Aquaculture 199, 197-227.

Gatel, F., 1994. Protein quality of legume seeds for non-ruminant animals: a literature review. Anim. Feed Sci.

Technol. 45, 317-348.

Gill, C., 2003. World Feed Panorama: Back to basics of growth. Feed International, January, 6-9.

Gillin, T., 2003. Poultrymeat output to reach 143 mt by 2030. Poultry International Production, Processing and

Marketing Worldwide, January 42, 20-26.

Goering, H.K. & Van Soest, P.J., 1970. Forage fiber analysis (Apparatus, reagents, procedures and some

applications). Agricultural Handbook No 379., A.R.S., United States. Department of Agriculture.

Goh, Y.K., Clandinin, D.R., Robblee, A.R. & Darlington, K., 1979. The effect of level of sinapine in a laying

ration on the incidence of fishy odour in eggs from brown-shelled egg layers. Can. J. Anim. Sci. 59, 313-

316.

Goh, Y.K., Clandinin, D.R., Robblee, A.R., 1980. Protein quality evaluations of commercial rapeseed meals by

chemical and biological assays. Can. J. Anim. Sci. 60, 473-480.

Gray, J.A., Hill, D.C. & Branion, H.D., 1957. Effect of heat on the lysine content of rapeseed. Poult. Sci. 36,

1193-1198.

Grobbelaar, J., 1999. Canola markstruktuur en winsgewendheid. Kanolafokus, Sept. No.4, 3-6.

81

Guillaume, J., Chenieux, J.C. & Rideau, M., 1979. Feeding value of Lupinus albus L. in chicken diets (with

emphasis on the role of alkaloids). Nutr. Rep. Int. 20, 57-65.

Halvorson, J.C., Shehata, M.A. & Waibel, P.E., 1983. White lupins and triticale as feedstuffs in diets for

turkeys. Poult. Sci. 62, 1038-1044.

Hansen, R.P. & Czochanska, Z., 1974. Composition of the lipids of lupin seed. J. Sci. Food Agric. 25, 409-415.

Herkelman, K.L., Cromwell, G.L., Cantor, A.H., Stahly, T.S. & Pfeiffer,T.W., 1993. Effects of heat treatment

on the nutritional value of conventional and low trypsin inhibitor soybeans for chicks. Poult. Sci. 72,

1359-1369.

Hill, F.W. and Anderson, D.L. 1958. Comparison of metabolizable energy and productive energy

determinations with growing chicks. J. of Nutr. 64: 587-603.

Hove, E.L., 1974. Composition and protein quality of sweet Lupin seed. J. Sci. Food Agric. 25, 851-859.

Hove, E.L. & King, S., 1979. Trypsin inhibitor contents of lupin seeds and other grain legumes. N.Z.J.Agric.

Res. 22, 41-42.

Huisman, J. & Tolman, G.H., 1992. Antinutritional factors in the plant proteins of diets for non-ruminants. In:

Recent advances in animal nutrition. Eds. Garnsworthy, P.C., Haresign, W. & Cole, D.J.A., Butterworth-

Heinemann Ltd., Oxford, U.K. pp. 3-31.

Hurrell, R.F., Carpenter, K.J., Sinclair, W.J., Otterburn, M.S. & Asquith, R.S., 1976. Mechanisms of heat

damage in proteins. 7. The significance of lysine-containing isopeptides and lanthionine in heated

proteins. Br. J. Nutr. 35, 383-395.

Jimenez, M.D., Cubero, J.I. & de Haro, A., 1991. Genetic and environmental variability in protein, oil and fatty

acid composition in high-alkaloid white lupin (Lupinus albus). J. Sci. Food Agric. 55, 27-35.

Johnson, R.J., 1992. Principles, problems and application of amino acid digestibility in poultry. World’s Poult.

Sci. J. 48, 232-246.

Johnson, R.J. & Eason, P.J., 1990. Effects of dietary inclusion of field peas, lupins, narbon beans and chickpeas

on the growth performance of broiler chickens. In: Proceedings of the Australian Poultry Science

Symposium. Eds. Australian Poultry Science Symposium Editorial Committee., University of Sydney.

pp. 96-99.

82

Johnson, R.J. & Eason, P.J., 1991. The effect of dietary combinations of grain legumes on the growth

performance of broiler chickens. In: Proceedings of the Australian Poultry Science Symposium. Eds.

Australian Poultry Science Symposium Editorial Committee., University of Sydney. pp. 64-68.

Jurgens, F.X., 2001. Kom ons praat sojabone. SA Grain, March. pp. 16-17.

Karunajeewa, H. & Bartlett, B.E., 1985. The effects of replacing soyabean meal in broiler starter diets with

white lupin seed meal of high manganese content. Nutr. Rep. Int. 31, 53-58.

Keith, M.O. & Bell, J.M., 1983. Effects of ammonia and steam treatments on the composition and nutritional

value of canola (low glucosinolate rapeseed) screenings in diets for growing pigs. Can.J.Anim.Sci. 63,

429-441.

Kemm, E.H., Minnaar, J.P., Ras, M.N. & Davie, S.J., 1987. Lupin seed meal (Lupinus albus cv. Buttercup) as a

source of protein for early weaned piglets. S. Afr. J. Anim. Sci. 17, 37-42.

Kimber, D. & McGregor, D.I., 1995. The species and their origin, cultivation and world production. In:

Brassica oilseeds Production and Utilization. Eds. Kimber, D. & McGregor, D.I., CAB International.

Oxon. UK. pp. 1-9.

King, J., Aguirre, C. & De Pablo, S., 1985. Functional properties of Lupin Protein Isolates (Lupinus albus cv.

Multolupa). J. Food Sci. 50, 82-87.

Kocher, A., Choct, M., Hughes, R.J. & Broz, J., 2000. Effect of food enzymes on utilization of lupin

carbohydrates by broilers. Br. Poultry Sci. 41, 75-82.

Kohlmeier, R.H., 1997. Quality aspects of soybean meal and fullfat soya research findings: recommendations

for quality control. AFMA Matrix, June, 7-11.

Kwakkel, R.P. & Van der Poel, A.F.B., 1997. Nutritional effects of expander processing for poultry. In:

Expander processing of Animal feeds. Ed. van der Poel, A.F.B., Ponsen & Looijen, Wageningen, The

Netherlands.

Larbier, M. & Leclercq, B., 1994. Raw materials employed in poultry production. In: Nutrition and feeding of

Poultry, translated by Wiseman J., Nottingham University Press. pp. 223-265.

Lee, K-H., Olomu, J.M. & Sim, J.S., 1991. Live performance, carcass yield, protein and energy retention of

broiler chickens fed canola and flax full-fat seeds and the restored mixtures of meals and oil. Can. J.

Anim. Sci. 71, 897-903.

83

Lee, K-H., Qi, G-H. & Sim, J.S., 1995. Metabolizable energy and amino acid availability of full-fat seeds,

meals and oils of flax and canola. Poult. Sci. 74, 115-128.

Leeson, S., Atteh, J.O. & Summers, J.D., 1987. Effects of increasing dietary levels of full-fat canola on

performance, nutrients retention, and bone mineralization. Poultry Sci. 66, 875-880.

Leeson, S., Slinger, S.J. & Summers, J.D., 1978. Untilization of whole Tower Rapeseed by laying hens and

broiler chickens. Can. J. Anim. Sci. 58, 55-61.

Leeson, S. & Summers, J.D., 1997. Ingredient evaluation and diet formulation. In: Commercial Poultry

Nutrition (2nd ed.). Eds. Leeson, S. & Summers, J.D., University Books, Guelph, Canada. pp. 40.

Leeson, S. & Summers, J.D., 2001. Feed Ingredients and Feed Formulation. In: Nutrition of the chicken (4th

ed.). Eds. Leeson, S. & Summers, J.D., University Books, Guelph, Canada. pp. 473-510.

Leslie, A.J. & Summers, J.D., 1972. Feeding value of rapeseed for laying hens. Can. J. Anim. Sci. 52, 563-566.

Leslie, A.J., Summers, J.D. & Jones, J.D., 1973. Nutritive value of air-classified rapeseed fractions.

Can.J.Anim.Sci. 53, 153-156.

Liener, I.E., 1990. Naturally occurring toxic factors in animal feedstuffs. In: Feedstuff Evaluation. Eds.

Wiseman, J. and Cole, D.J.A., Butterworths, London. pp. 377-394.

Lodhi, G.N., Renner, R. & Clandinin, D.R., 1969. Studies on the Metabolizable Energy of Rapeseed meal for

growing chickens and laying hens. Poultry Sci.48, 964-970.

Longstaff, M. & McNab, J.M., 1991. The inhibitory effects of hull polysaccharides and tannins of field beans (

Vicia faba L.) on the digestion of amino acids, starch and lipid and on digestive enzyme activities in

young chicks. Br. J. Nutr. 65, 199-216.

March, B.E., Smith, T. & El-Lakany, S., 1973. Variation in estimates of the metabolizable energy value of

Rapeseed meal determined with chickens of different ages. Poultry Sci. 52, 614-618.

March, B.E., Smith, T. & Sadiq, M., 1975. Factors affecting estimates of metabolizable energy values of

rapeseed meal for poultry. Poultry Sci. 54, 538-546.

Mariscal-Landin, G., Lebreton, Y. & Sève, B., 2002. Apparent and standardised true ileal digestibility of

protein and amino acids from faba bean, lupin and pea, provided as whole seeds, dehulled or extruded in

pig diets. Anim. Feed Sci. Technol. 97, 183-198.

84

McDonald, P., Edwards, R.A., Greenhalgh, J.F.D. & Morgan, C.A., 1995. Animal Nutrition. 5th Edition.

Addison Wesley Longman Limited, Essex, United Kingdom. 607 pp.

Mohanna, C., Carré, B. & Nys, Y., 1999. Incidence of dietary viscosity on growth performance and zinc and

manganese bioavailability in broilers. Anim. Feed Sci. Technol. 77, 255-266.

Mossé, J., Huet, J.C. & Baudet, J., 1987. Relationships between nitrogen, amino acids and storage proteins in

Lupinus albus seeds. Phytochemistry 26, 2453-2458.

Mustafa, A.F., Christensen, D.A., McKinnon, J.J. & Newkirk, R., 2000. Effects of stage of processing of canola

seed on chemical composition and in vitro protein degradability of canola meal and intermediate

products. Can. J. Anim. Sci. 80, 211-214.

Muztar, A.J., Likuski, H.J. & Slinger, S.J., 1978. Metabolizable energy content of Tower and Candle Rapeseeds

and rapeseed meals determined in two laboratories. Can. J. Anim. Sci. 58, 485-492.

Muztar, A.J., Slinger, S.J., Likuski, H.J.A. & Dorrell, H.G., 1980. True amino acid availability values for

soybean meal and Tower and Candle Rapeseed and rapeseed meals determined in two laboratories. Poult.

Sci. 59, 605-610.

Múzquiz, M., Burbano, C., Rey, C. & Cassinello, M., 1989a. A Chemical study of Lupinus hispanicus seed -

nutritional components. J. Sci. Food Agric. 47, 197-204.

Múzquiz, M., Burbano, C., Gorospe, M.J. & Ródenas, I., 1989b. A Chemical study of Lupinus hispanicus seed

- Antinutritional components. J. Sci. Food Agric. 47, 205-214.

Naveed, A., Acamovic, T. & Bedford, M.R., 1998. Effect of enzyme supplementation of UK-grown lupinus

albus on growth performance in broiler chickens. Br. Poultry Sci. 39, S36-S37.

Newkirk, R.W. & Classen, H.L., 1998. In vitro hydrolysis of phytate in canola meal with purified and crude

sources of phytase. Anim. Feed Sci. Technol. 72, 289-298.

NRC, 1994. Nutrient Requirements of Poultry (9th ed.). National Academy Press, Washington D.C.

Nwokolo, E.N. & Bragg, D.B., 1977. Influence of phytic acid and crude fiber on the availability of minerals

from four protein supplements in growing chicks. Can.J.Amin.Sci. 57, 475-477.

Nwokolo, E. & Bragg, D.G., 1978. Factors affecting the metabolizable energy content of rapeseed meals.

Poultry Sci. 57, 954-958.

Nwokolo, E. & Sim, J., 1989. Barley and full-fat Canola seed in broiler diets. Poultry Sci. 68, 1374-1380.

85

Olkowski, A.A., Olkowski, B.I., Amarowicz, R. & Classen, H.L., 2001. Adverse effects of dietary lupine in

broiler chickens. Poult. Sci. 80, 621-625.

Olomu, J.M., Robblee, A.R. & Clandinin, D.R., 1974. Effects of processing and amino acid supplementation on

the nutritive value of rapeseed for broilers. Poult. Sci. 53, 175-184.

Olomu, J.M., Robblee, A.R. & Clandinin, D.R., 1975a. Effects of Span rapeseed on the performance, organ

weights and composition of the carcass, heart and liver of broiler chicks. Can. J. Anim. Sci. 54, 722-726.

Olomu, J.M., Robblee, A.R., Clandinin, D.R. & Hardin, R.T., 1975b. Utilization of full-fat rapeseed and

rapeseed meals in rations for broiler chicks. Can. J. Anim. Sci. 55, 461-469.

Olsen, O. & Sørensen, H., 1980. Sinalbin and other glucosinolates in seeds of double low rape species and

Brassica napus cv. Bronowski. J. Agric. Food Chem. 28, 43-48.

Olver, M.D., 1987. Sweet Lupins as a feedstuff for broilers. SA. J.Anim. Sci. 17, 168-170.

Olver, M.D., 1994. Lupins in Poultry Nutrition. Poultry Bulletin, January. pp. 501,507.

Olver, M.D. & Jonker, A., 1997. Effect of sweet, bitter and soaked micronised bitter lupins on broiler

performance. Br. Poult. Sci. 38, 203-208.

Papadopoulos, M.C., 1985. Estimations of amino acid digestibility and availability in feedstuffs for poultry.

World’s Poultry Scienc Journal 40, 63-71.

Parsons, C.M., Hashimoto, K., Wedekind, K.J., Han, Y. & Baker, D.H., 1992. Effect of overprocessing on

availability of amino acids and energy in soybean meal. Poult. Sci. 71, 133-140.

Partridge, G. & Hruby, M., 2002. Making the most of vegetable proteins in swine feeds. Feed International,

April, 14-18.

Pearson, G. & Carr, J.R., 1976. Lupin-seed meal (Lupinus angustifolius cv. Uniwhite) as a protein supplement

to barley-based diets for growing pigs. Anim. Feed Sci. Technol. 12, 631-642.

Pearson, G. & Carr, J.R., 1977. A comparison between meals prepared from the seeds of different varieties of

lupin as protein supplements to barley-based diets for growing pigs. Anim. Feed Sci. Technol. 2, 49-58.

Peisker, M., 1992. Physical and chemical changes during expansion. Feed International, February 1992.

Perez-Escamilla, R., Vohra, P. & Klasing, K., 1988. Lupins (Lupinus albus var. Ultra) as a replacement for

soybean meal in diets for growing chickens and turkey poults. Nutr. Rep. Int. 38, 583-593.

86

Perez-Maldonado, R.A., Mannion, P.F & Farrell, D.J., 1999. Optimum incusion of field peas, faba beans, chick

peas and sweet lupins in poultry diets. I Chemical composition and layer experiments. Br. Poultry Sci.

40, 667-673.

Perilla, N.S., Cruz, M.P., De Belalcazar, F. & Diaz, G,J., 1997. Effect of temperature of wet extrusion on the

nutritional value of full-fat soybeans for broiler diets. Br. Poult. Sci. 38, 412-416.

Petterson, D.S., 1998. Composition and food uses of lupins. In: Lupins as Crop Plants. Biology, Production and

Utilization. Eds. Gladstones, J.S., Atkins, C. & Hamblin, J., CAB International. University Press,

Cambridge, UK. pp. 353-384.

Pickard, M.D., Youngs, C.G., Wetter, L.R. & Boulter, G.S., 1989. Processing of canola seed for quality meal.

In: Canola meal for Livestock and Poultry. Ed. Clandinin, D.R., Publication of Canola Council of

Canada. pp. 3-4.

Plavnik, I. & Sklan, D., 1995. Nutritional effects of expansion and short time extrusion on feeds for broilers.

Anim. Feed Sci. Technol. 55, 247-251.

Prinsloo, J.J., Smith, G.A. & Rode, W., 1992. Sweet white lupins (cv. Buttercup) as a feedstuff for layers. Br.

Poult. Sci. 33, 525-530.

Prinsloo, J.J., 1993. Die benutting van Lupinus albus en Lupinus angustifolius in braaikuiken en lêhendiëte.

M.Sc (Agric) thesis, University of Pretoria, South Africa

Ravindran, V. & Blair, R., 1992. Feed resources for poultry production in Asia and the pacific. II. Plant protein

sources. World’s Poult. Sci. J. 48, 205-231.

Reddy, C., Jensen, L.S., Merrill, L.H. & McGinnis, J., 1962. Influence of mechanical alteration of dietary

density on energy available for chick growth. J.Nutr. 77, 428-432.

Reddy, N.R., Pierson, M.D., Sathe, S.K. & Salunkhe, D.K., 1984. Chemical, nutritional and physiological

aspects of dry bean carbohydrates: a review. Food Chem. 13, 25-68.

Robblee, A.R., Clandinin, D.R., Summers, J.D. & Slinger, S.J., 1989. Canola meal for poultry. In: Canola meal

for Livestock and Poultry. Ed. Clandinin, D.R. Publication of Canola Council of Canada. pp. 8-14.

Robertson, J.B. & Van Soest, P.J., 1981. The detergent system of analysis and its application to human foods.

In: Basic and clinical nutrition. Vol. 3. The analysis of dietary fiber in food. Eds. James, W.P.T. &

Theander, O., Marcel Dekker, New York. pp. 158-276.

87

Ruiz, L.P. (Jr.), 1976. A rapid screening test for lupin alkaloids. N.Z.J.Agric. Res. 20, 51.

Ruiz, L.P., White, S.F. & Hove, E.L., 1977. The alkaloid content of sweet lupin seed used in feeding trials on

pigs and rats. Anim. Feed Sci. Technol. 2, 59-66.

Ruiz, R.G., Price, K.R., Rose, M.E., Arthur, E.A, Petterson, D.S. & Fenwick, G.R., 1995. The effect of cultivar

and environment on saponin content of Australian sweet lupin seed. J.Sci. Food Agric. 69, 347-351.

Salmon, R.E., 1984. True metabolizable energy and total and available amino acids of Candle, Altex and

Regent Canola meals. Poult. Sci. 63, 135-138.

Salunkhe, D.H., Chavan, J.K., Adsule, R.N. & Kadam, S.S., 1992. World Oilseeds: Chemistry, Technology and

Utilization. Van Nostrand Reinhold Publishing, New York. pp. 554.

Sathe, S.K., Deshpande, S.S. & Salunkhe, D.K., 1982. Functional properties of Lupin seed (Lupinus mutabilis)

proteins and protein concentrates. J. Food Sci.47, 491-497.

Seabra, M., Carvalho, S., Freire, J., Ferreira, R., Mourato, M., Cunha, L., Cabral, F., Teixeira, A. & Aumaitre,

A., 2001. Lupinus luteus, Vicia sativa and Lathyrus cicera as protein sources for piglets: ileal and total

tract apparent digestibility of amino acids and antigenic effects. Anim. Feed Sci. Technol. 89, 1-16.

Semino, G.A., Restans, P. & Cerletti, P., 1989. Effect of bound carbohydrate on the action of trypsin on lupin

seed glycoproteins. J.Agric.Food Chem. 33, 196-199.

Shen, H., Summers, J.D. & Leeson, S., 1983. The influence of steam pelleting and grinding on the nutritive

value of Canola Rapeseed for poultry. Anim. Feed Sci. Technol. 8, 303-311.

Sibbald, I.R., 1977a. The true metabolizable energy values for poultry of rapeseed and of the meal and oil

derived therefrom. Poult. Sci. 56, 1652-1656.

Sibbald, I.R., 1977b. The effect of steam pelleting on the true metabolizable energy values of poultry diets.

Poult. Sci. 56, 1686-1688.

Sibbald, I.R., 1979. A Bioassay for available amino acids and true metabolizable energy in feedingstuffs. Poult.

Sci. 58, 668-673.

Sibbald, I.R., Elliot, J.I. & Cote, M., 1983. Comparison of bioavailable energy values of diets measured with

poultry and swine. Anim. Feed Sci. Technol. 8, 191-196.

88

Sibbald, I.R., Hall, D.D., Wolynetz, M.S., Fernández, J.A. & Jørgensen, H., 1990. Relationships between

bioavailable energy estimates made with pigs and cockerels. Anim. Feed Sci. Technol. 30, 131-142.

Sibbald, I.R. & Price, K., 1977. The true metabolizable energy values of the seeds of Brassica campestris, B.

hirta and B. napus. Poult. Sci. 56, 1329-1331.

Siddiqui, I.R. & Wood, P.J., 1977. Carbohydrates of Rapeseed: a review. J. Sci. Fd Agric. 28, 530-538.

Simbaya, J., Slominski, B.A., Rakow, G., Campbell, L.D., Downey, R.K. & Bell, J.M., 1995. Quality

characteristics of yellow-seeded Brassica seed meals: Protein, Carbohydrates and Dietary Fiber

Components. J. Agric. Food Chem. 43, 2062-2066.

Slominski, B.A. & Campbell, L.D., 1989. Indoleacetonitriles - Thermal degradation products of indole

glucosinolates in commercial rapeseed ( Brassica napus) meal. J. Sci. Fd Agric. 47, 75-84.

Slominski, B. A., Campbell, L.D. & Guenter, W., 1994. Carbohydrates and dietary fiber components of yellow-

and brown-seeded canola. J. Agric. Food Chem. 42, 111-119.

Slominski, B.A., Campbell, L.D. & Stanger, N.E., 1988. Extent of hydrolysis in the intestinal tract and potential

absorption of intact glucosinolates in laying hens. J. Sci. Fd Agric. 42, 305-314.

Smits, C.H.M. & Annison, G., 1996. Non-starch polysaccharides in broiler nutrition – towards a

physiologically valid approach to their determination. World’s Poult. Sci. J. 52, 203-221.

Sonntag, N.O.V., 1995. Industrial utilization of long-chain fatty acids and their derivatives. In: Brassica

oilseeds Production and Utilization. Eds. Kimber, D. & McGregor, D.I., CAB International. Oxon. UK.

pp. 339-352.

Statistical Analysis Systems (SAS) Institute Inc., 2000. SAS/STAT Guide for Personal Computers. SAS

Institute Inc., Cary, North Carolina, USA.

Steenfeldt, S., González, E. & Bach Knudsen, K.E., 2003. Effects of inclusion with blue lupins (Lupinus

angustifolius) in broiler diets and enzyme supplemetation on production performance, digestibility and

dietary AME content. Anim. Feed Sci. Technol. 110, 185-200.

Summers, J.D., Shen, H. & Leeson, S., 1982. The value of canola seed in poultry diets. Can. J. Anim. Sci. 62,

861-868.

Swick, R.A. 2001. Considerations in using protein meals for monogastric animals. American Soybean

Association Technical Bulletin, Singapore, July.[Online]. Available: [30.10.2003]

89

Taverner, M.R., 1975. Sweet Lupin seed meal as a protein source for growing pigs. Anim. Prod. 20, 413-419.

Ten Doeschate, R.A.H.M., Scheele, C.W., Schreurs, V.V.A.M. & Van der Klis, J.D., 1993. Digestibility studies

in broiler chickens: influence of genotype, age, sex and method of determination. Br. Poult. Sci. 34, 131-

146.

Tkachuk, R., 1969. Nitrogen-to-protein conversion factors for cereals and oilseed meals. Cereal Chem. 46, 419-

423.

Thomas, M. & van der Poel, A.F.B., 1997. Effects on the physical quality of feed. In: Expander processing of

Animal feeds. Ed. Van der Poel, A.F.B., Ponsen & Looijen, Wageningen, The Netherlands.

Todorov, N.A., Pavlov, D.C. & Kostov, K.D., 1996. Lupin (Lupinus spp.). In: Food and Feed from Legume and

Oilseeds. Eds. Nwokola, E. & Smartt, J. Chapman and Hall. London. pp. 113-123.

Uppström, B., 1995. Seed Chemistry. In: Brassica oilseeds Production and Utilization. Eds. Kimber, D. &

McGregor, D.I., CAB International. Oxon. UK. pp. 217-242.

Van Barneveld, R.J., Batterham, E.S. & Norton, B.W., 1993. Nutritional implications of heating proteins: the

effect of heating protein concentrates on the digestibility and metabolism of lysine in growing pigs. In:

Recent Advances in Animal Nutrition in Australia. Ed. Farrell, D.J., University of New England,

Armidale. pp. 201-212.

Van der Poel, A.F.B., 1990. Effect of Processing on Anti-nutritional Factors and Protein Nutritional Value of

Dry Beans (Phaseolus vulgaris L.). A Review. Anim. Feed Sci. and Tech. 29, 179-208.

Van Kempen, G.J.M. & Jansman, A.J.M., 1994. Use of EC produced oil seeds in animal feeds. In: Recent

Advances in Animal Nutrition. Eds. Garnsworthy, P.C. & Cole, D.J.A., Nottingham University Press,

UK. pp 31-56.

Van Zuilichem, D.J., Stolp, W. & Veenendaal, J., 1997. The use of expanders in animal feed manufacturing. In:

Expander processing of Animal feeds. Ed. Van der Poel, A.F.B., Ponsen & Looijen, Wageningen, The

Netherlands.

Varnish, S.A. & Carpenter, K.J., 1975. Mechanisms of heat damage in proteins. 5. The nutritional values of

heat-damaged and propionylated proteins as sources of lysine, methionine and tryptophan. Br. J. Nutr.

34, 325-337.

Waldroup, P.W., 1982. Whole soybeans for poultry feeds. World’s Poult. Sci. J. 38, 28-35.

Watkins, B.A. & Mirosh, L.W., 1987. White Lupin as a protein source for layers. Poult. Sci. 66, 1798-1806.

90

Watkins, B.A., Manning, B. & Al-Athari, A.K., 1988. The effects of Lupinus albus cultivar Ultra on broiler

performance. Nutr. Rep. Int. 38, 173-181.

Weiss, E.A., 2000. Oilseed Crops 2nd Edition. Blackwell Science Ltd., Osney Mead, Oxford, UK. pp. 364.

Welch, R.W. & Griffiths, D.W., 1984. Variation in the oil content and fatty acid composition of field beans

(Vicia faba) and peas (Pisum spp.). J. Sci. Food Agric. 35, 1282-1289.

Willemse, J. 2004. Oliesadeoorsig: Suid-Amerika produseer minder soja hierdie seisoen. SA Grain, May. pp. 4-

6.

Wiryawan, K.G. & Dingle, J.G., 1995. Screening tests of the protein quality of grain legumes for poultry

production. Br. J. Nutr. 74, 671-679.

Wiryawan, K.G. & Dingle, J.G., 1999. Recent research on improving the quality of grain legumes for chicken

growth. Anim. Feed Sci. Technol. 76, 185-193.

Wiryawan, K.G., Dingle, J.G., Kumar, A., Gaughan, J.B. & Young, B.A., 1995. True metabolizable energy

content of grain legumes: effects of enzyme supplementation. In: Recent Advances in Animal Nutrition

in Australia. Ed. Rowe, J.B. & Nolan, J.B., University of New England, Armidale. pp. 196.

Wiryawan, K.G., Dingle, J.G. & Creswell, D., 1997. Enzyme supplementation improves protein quality of grain

legumes for poultry production. In: Recent Advances in Animal Nutrition in Australia. Ed. Rowe, J.B. &

Nolan, J.B., University of New England, Armidale. pp. 231.

Wiseman, J. & Cole, D.J.A., 1988. European Legumes in diets for non-ruminants. In: Recent advances in

animal nutrition. Eds. Haresign, W. & Cole, D.J.A., Butterworths, London. pp. 13-37.

Woodly, A., Summers, J.D. & Bilanski, W.K., 1972. Effects of heat treatment on the nutritive value of whole

rapeseed for poultry. Can. J. Anim. Sci. 52, 189-194.

Woodroofe, J.M., 1995. Technical Bulletin: Dry extrusion applications in the feed industry. [Online].

Available: http://www.asasea.com/technical/ft33-1995.html [10.01.2000]

Yule, W.J. & McBride, R.L., 1976. Lupin and rapeseed meals in poultry diets: effect on broiler performance

and sensory evaluation of carcasses. Br. Poult. Sci. 17, 231-239.

Zaviezo, D. & McGinnis, J., 1980. Nutritional value of lupin seeds for chicks. Poult. Sci. 59, 1675 [Abstract of

paper].

91

Zelenka, J., 1968. Influence of age of the chicken on the metabolizable energy values of poultry diets. Br. Poult.

Sci. 9, 135-142.

Zhang, Y.E. & Parsons, C.M., 1994. Effects of overprocessing on the nutritional quality of sunflower meal.

Poult. Sci. 73, 436-442.

Zuprizal, Larbier, M., Chagneau, A.M. & Lessire, M., 1991. Effect of protein intake on true digestibility of

amino acids in rapeseed meal for adult roosters force fed with moistened feed. Anim. Feed Sci. Technol.

34, 255-260.

Żyła, K. & Koreleski, J., 1993. In-vitro and in-vivo dephosphorylation of rapeseed meal by means of phytate-

degrading enzymes derived from Aspergillus niger. J. Sci. Fd Agric. 61, 1-6.

92


Recommended