The influence of R&D investments and Property Rights on Compensation Arrangements David Erkens January 19, 2008 W. P. Carey School of Business, School of Accountancy Arizona State University PO Box 873606 Tempe, AZ 85287-3606 [email protected]I thank seminar participants at Arizona State University, particularly Jennifer Brown, Xiaobo Dong, Tatiana Fedyk, Steve Kaplan, Jim Ohlson, and especially my dissertation committee members John H. Evans and Michael Mikhail. I am particularly grateful to Yuhchang Hwang, who chaired my dissertation committee and provided me with generous support during my doctoral studies. All data is publicly available.
Transcript
The influence of R&D investments and Property Rights on
Compensation Arrangements
David Erkens
January 19, 2008
W. P. Carey School of Business, School of Accountancy Arizona State University
I thank seminar participants at Arizona State University, particularly Jennifer Brown, Xiaobo Dong, Tatiana Fedyk, Steve Kaplan, Jim Ohlson, and especially my dissertation committee members John H. Evans and Michael Mikhail. I am particularly grateful to Yuhchang Hwang, who chaired my dissertation committee and provided me with generous support during my doctoral studies. All data is publicly available.
Abstract
Protecting intellectual property is a major challenge for many firms. This paper examines how
compensation arrangements are influenced by the mechanisms firms use to protect their
intellectual property. Consistent with firms being concerned about employees leaving to exploit
R&D related information on their own or with competing firms, I find that executives’ unvested
equity holdings and total compensation are higher when firms invest more of their resources in
R&D and that this relation is most pronounced for R&D related executives. In addition,
consistent with innovating firms also being concerned about nonexecutive employee mobility, I
find that stock option grants to nonexecutive employees are positively associated with R&D
intensity. Most importantly, I find that these relations are weaker in industries in which firms
rely more on property rights and less on restricting information leakage to protect their
intellectual property. My findings are consistent with firms being less concerned about employee
mobility when they can effectively protect their intellectual property with property rights.
1
I. Introduction
Protecting intellectual property is a core concern for many firms, and can be a major
challenge when employees leave to exploit inventions on their own or with competing firms.
Firms can protect their intellectual property by using mechanisms that rely either on property
rights or on restricting information leakage. Property rights help firms profit from their
inventions by allowing firms to either exclude competitors from using their inventions (i.e.,
intellectual property rights) or exclude competitors from using resources that are required for the
successful commercialization of inventions (i.e., complementary resources). Alternatively,
restricting information leakage helps firms profit from their inventions by depriving competitors
of information that can be used to imitate products or erode first-mover advantage. Because
property rights can provide effective protection against product imitation even when competitors
have detailed information on a firm’s innovation activities, employee mobility is a greater
concern to innovating firms that depend more on restricting information leakage to protect their
intellectual property. Firms can discourage employees from leaving by using compensation
arrangements that provide them with sufficient incentives to remain with the firm.
In this paper, I examine how compensation arrangements are influenced by the
mechanisms firms use to protect their investments in R&D.1 I accomplish this task by examining
executive compensation arrangements and stock option grants to nonexecutive employees. More
specifically, as firms’ ability to rely on property rights to protect intellectual property is
significantly influenced by industry-level conditions (e.g., Mansfield 1986; Levin et al. 1987;
1 R&D investments are a primary productive input and a particularly important source of intellectual property. According to data from the National Science Foundation, manufacturing firms performed 71% of industrial R&D in 2004 ($147 billion). To gauge the importance of R&D to these firms, these firms’ R&D spending was greater than their capital expenditures in the same period ($115 billion, Source: Annual Census of Manufacturers 2004).
2
Cohen et al. 2000), I focus on how industry-level conditions (industry appropriability conditions,
hereafter) influence the relation between compensation arrangements and R&D intensity.2
I hypothesize that executives’ unvested equity holdings and total compensation are
positively associated with R&D intensity. In addition, because executives differ in their
knowledge about firms’ R&D activities, I expect that R&D related executives (e.g., chief
scientific officer) capture a larger fraction of a firm’s aggregate top management team’s unvested
equity holdings and total compensation when firms invest more of their resources in R&D.
Similarly, because it is also important for innovating firms to retain nonexecutive employees, I
expect that stock options grants to nonexecutive employees are positively associated with R&D
intensity. Moreover - and this is the focus of my paper- because property rights can make
product imitation more difficult (e.g., Mansfield et al. 1986) I expect that these relations are
weaker (stronger) in industries in which firms rely more (less) on property rights and less (more)
on restricting information leakage.
I test my hypotheses using a sample of 1,077 manufacturing firms with compensation
data available from S&P’s ExecuComp database (1993-2005). After controlling for various
indicators of employee mobility (e.g., enforceability of non-compete covenants), wealth
alignment incentives, risk-taking incentives and accounting and tax related motives for using
equity-based compensation, I find that the predicted influence of R&D intensity on executive and
nonexecutive employees’ compensation arrangements is weaker in industries in which firms rely
more on property rights (i.e., intellectual property rights and complementary resources) and
stronger in industries in which firms rely more on restricting information leakage. My results are
2 See section III for a detailed discussion of how I construct my R&D intensity and industry-level appropriability conditions measures.
3
robust to alternative specifications of my independent measures and adjusting for simultaneity
bias and selection bias.
My findings contribute to the compensation literature in two ways. First, prior empirical
studies find that the importance of innovation as a determinant of equity-based compensation
varies across industries (Anderson et al. 2000; Balkin et al. 2000; Ittner et al. 2003). However,
they provide little insight into what explains this finding. I extend these studies by demonstrating
that across industry variation in firms’ ability to rely on property rights to protect intellectual
property influences the use of equity-based compensation.
Second, my study contributes to the literature that examines the influence of managerial
responsibility on executive compensation design. Prior literature has focused on incentive design
implications of oversight responsibilities (Agarwal and Samwick 2003) and how corporate
governance interacts with managerial responsibilities (e.g., Gore, Matsunaga and Yeung 2007).
My study extends this literature by examining the variation in the types of knowledge that
executives acquire through their managerial responsibilities (i.e., R&D related information) and
its relation with their compensation arrangements. My findings suggest that the differential
strategic importance of this information influences the distribution of unvested equity holdings
and total compensation within a firm’s top management team.
In Section II, I review prior literature and develop my hypotheses. In section III, I
summarize methodological considerations and the sample. I present the empirical results in
Section IV. Section V discusses several robustness tests, followed by my conclusions in Section
VI.
4
II. Background and Hypothesis Development
In today’s economy, growth is predominantly driven by intellectual property (Corrado et
al. 2006). Widespread access to capital markets, deregulation and technological change are
increasingly making tangible assets commodities that yield, at best, an average return on
investment (Rajan and Zingales 2000; Rajan and Zingales 2001; Lev 2001). For many firms,
investments in intellectual property now exceed investments in tangible assets. However, unlike
investments in tangible assets that have easy to define boundaries and ownership rights (Teece
1986; Lev 2001), investments in intellectual property produce intangible assets that are
potentially transferable through information exchange. As a consequence, investments in
intellectual property are more susceptible to misappropriation than investments in tangible assets.
Protecting intellectual property is further complicated by the mobility of employees. With
capital readily available, tangible assets such as plant and equipment have become more easily
replicable. Consequently, employees can now more easily break away from their firms, raise
capital and replicate the required tangible assets to exploit an invention on their own (Rajan and
Zingales 2000, 2001). For instance, Bhide (2000) finds that 71 percent of the firms included in
the Inc 500 (a group of young, fast growing firms) were established by managers who exploited
a growth opportunity created by their previous employer. Moreover, it is widely recognized that
firms hire outside managers to “learn” from their competitors.3 Boeker (1997) examines how the
movement of top managers across firms over an 18-year period in the semiconductor industry
influences firms’ entry in new product-markets. He finds that outside managers’ prior exposure
to different products and strategies helps firms enter new product-markets. Employee mobility is
therefore a significant concern for innovating firms. In the remainder of this section, I develop
3 For example, Google Inc. has hired executives from Amazon (Udi Manber), BEA Systems (Adam Bosworth), e-Bay (Louis Monier), MCI (Vint Cerf) and Microsoft (Kai-Fu Lee and Mark Lucovsky) to further bolster its operations and expand into new markets (Elinor Mills, CNET February 27th 2006).
5
formal hypotheses that predict how R&D intensity and property rights influence how firms use
compensation arrangements to retain employees.
Executive Mobility and Retention Incentives
Although trade secret laws and non-compete covenants potentially limit employees’
ability to establish competing startups or seek employment with competitors, prior literature
suggests that the influence of these legal mechanisms is generally modest (e.g., Zabojnik 2002;
Kim and Marschke 2005). 4 For example, judges in California, a state representing a significant
proportion of the country’s innovating firms, are hesitant to enforce any agreement that restricts
the mobility of employees (Gilson 1999). Moreover, most companies do not take legal action
over trade secret disputes for fear of shareholder backlash, negative publicity, or further exposure
of trade secrets during prosecution (Desmet 1999). Consequently, if a firm wants to prevent its
employees from joining the competition, it has to make it attractive for them to remain with the
firm.
Prior research suggests that R&D intensive firms use equity-based compensation to
reduce turnover. For example, Ittner et al. (2003) report that in their sample of new economy
firms, employee retention objectives are ranked as the most important goal of equity grant
programs. Oyer (2004) provides a theoretical argument for the use of equity-based compensation
as a retention mechanism. His model suggests that when employees’ labor market opportunities
are correlated with stock price, firms can avoid costly recontracting (e.g., turnover) by using
time-vested equity-based compensation. Time-vested equity-based compensation does not only
ensure that employees’ compensation is automatically adjusted to reflect labor market
4 A notable exception is Garmaise (2007), who finds that stronger enforcement of non-compete covenants leads to lower executive mobility.
6
opportunities, but also makes it unattractive for employees to leave before their equity holdings
vest. However, equity-based compensation is costly as firms have to pay a risk-premium to
compensate employees for idiosyncratic risk.5 Oyer (2004) suggests that firms can reduce the
risk-premium paid to employees by partially substituting cash compensation for equity-based
compensation. Therefore, Oyer (2004) predicts that when employees’ labor market opportunities
are closely related to stock price, equity-based compensation plays a dominant role in retaining
employees, while cash compensation only serves to reduce the risk-premium. Consistent with
this prediction, Balsam and Miharjo (2007) find that while the value of executives’ unvested
equity holdings and excess cash compensation are both negatively associated with voluntary
executive turnover, the effect of cash compensation is much less pronounced. 6
Therefore, consistent with prior research, I expect that innovating firms use equity-based
compensation to retain executives.7 Moreover, as voluntary executive turnover is more costly to
firms that invest a larger fraction of their resources in R&D, I expect that executives’ unvested
equity holdings and total compensation are positively associated with R&D intensity. I
formulate this prediction as follows:
Hypothesis 1a: Executives’ unvested equity holdings and total compensation are positively
associated with R&D intensity.
5 In Oyer (2004), idiosyncratic risk is defined as the variance of firm performance conditional on the realization of employees’ market wage. Therefore when idiosyncratic risk is high, stock returns are a noisy measure of employees’ labor market opportunities. 6 Balsam and Miharjo (2007) define voluntary executive turnover as any turnover that is not forced or caused by any other reason not obviously related to involuntary events (e.g., death). They find that the time-value and intrinsic value of executives’ unvested stock option and restricted share holdings are negatively associated with voluntary executive turnover. They also find that excess cash compensation is negatively associated with voluntary executive turnover, although this effect becomes insignificant when they control for board characteristics. 7 Prior literature suggests that firm value generally reflects the benefits of investments in R&D (Chan et al. 2001). To the extent that the market is slow in capturing (e.g., Eberhart et al. 2004) or unable to capture the value of executives’ inside information related to R&D investments (e.g., Aboody and Lev 2000) it becomes more difficult to find support for my hypothesized relations.
7
Property Rights
Two broad classes of property rights based mechanisms can help firms protect their
intellectual property: (1) intellectual property rights, and (2) control of complementary resources.
Intellectual property rights give firms various forms of exclusive rights over intellectual
property. Patents provide the strongest form of exclusive rights as they give firms the legal
ability to exclude competitors from using their inventions.8 Generally, the successful
commercialization of inventions requires the use of complementary resources. Complementary
resources include such things as access to distribution channels, services, customer relationships,
supplier relationships and complementary products. When complementary resources are
specialized and therefore not accessible through markets (Williamson 1985) firms can make it
difficult for competitors to imitate their products by limiting their ability to use these resources
(Teece 1986).9
Previous research suggests that firms’ ability to rely on property rights to protect
intellectual property is significantly influenced by industry characteristics (e.g., Mansfield 1986;
Levin et al. 1987; Cohen et al. 2000). For example, patents are highly effective in the
pharmaceutical industry because the structure of each product is unique and it is hard to
accomplish the same result in a manner that does not bear a strong resemblance to the protected
matter (Levin et al. 1987; Winter 2000). In contrast, patenting is relatively ineffective in the
semiconductor industry because competitors can easily reengineer around a particular circuit
design. Similarly, while in some industries it is important to gain access to specialized
8 Other forms of intellectual property rights, such as copyrights, do not prevent competitors from independently duplicating an invention (Teece 2000). 9 For example, although GE did not invent the CAT scan, its superior sales force, service network and reputation for quality enabled it to soon surpass the inventor EMI, whose inability to develop the needed complementary resources led it to exit the market (Teece 1986)
8
complementary resources to successfully commercialize inventions (e.g., printing and
publishing), in others it is not (e.g., electrical equipment).
When firms do not protect their intellectual property with property rights, they typically
rely on secrecy and lead-time.10 Although secrecy can take many forms, it ultimately involves
preventing information leakage to competitors. For example, semiconductor firms have protected
their devices from reverse-engineering by enclosing chips in epoxy resin so that dissolving the
coating to find the circuitry inside also dissolves key components of the circuitry, preventing
imitators from learning the device’s configuration (Shapley 1978). Lead-time enables firms to
secure specialized complementary assets, obtain orders for their new products and establish a
strong reputation (Teece 1986; Winter 2000). A firm’s lead-time can significantly be reduced by
information leakage. Therefore, as is the case with secrecy, when firms rely on lead-time it is
more important to retain employees.
Given that industry conditions influence the degree to which firms rely on property rights
versus restricting information leakage to protect intellectual property, I expect that the relation of
executives’ unvested equity holdings and total compensation with R&D intensity is weaker in
industries in which firms rely more on property rights and stronger in industries in which firms
rely more on restricting information leakage. I formulate this prediction as follows:
Hypothesis 1b: The relation of executives’ unvested equity holdings and total compensation
with R&D intensity is weaker in industries in which firms rely more on property rights to protect
10 Firms can rely on multiple mechanisms at the same time. For instance, firms can patent one or several elements of an invention while keeping other elements secret (Arora 1997). In this study, I am interested in examining how firms’ reliance on mechanisms based on property rights versus mechanisms not based on property rights influence executive compensation arrangements. Therefore, I treat these mechanisms as distinct classes and examine the influence of one class, while keeping the other constant. To the extent that the two classes of appropriation mechanisms are not separable it becomes more difficult to find support for my hypotheses.
9
their intellectual property and stronger in industries in which firms rely more on restricting
information leakage.
Nature of Managerial Knowledge
Previous empirical studies suggest that the type of knowledge newly hired executives
bring with them largely depends on their functional expertise. For example, Bertrand and Schoar
(2003) find that a significant amount of the heterogeneity in investment, financial, and
organizational practices of firms can be attributed to managerial characteristics, in particular an
executive’s functional expertise (e.g., CFO’s matter more for financial decisions). Moreover,
Boeker (1997) finds that the effect of newly hired executives on product-market entry decisions
is most pronounced for executives previously employed in functional areas related to R&D and
engineering. Therefore, I expect that R&D intensity and industry appropriability conditions have
the most pronounced influence on R&D related executives’ compensation arrangements.
Previous research has used the percentage of aggregate top-management team
compensation captured by executives as a measure of their relative importance (Bebchuk et al.
2007). Consistent with this research, I expect that R&D related executives will capture a larger
share of aggregate non-CEO executive unvested equity holdings (equity slice, hereafter) and
total compensation (pay slice, hereafter) when firms invest more of their resources in R&D.11
Moreover, I expect that this relation is weaker in industries in which firms rely more on property
11 Bebchuk et al. (2007) examine how the fraction of top-five compensation captured by CEOs is associated with various firm and CEO characteristics. As CEOs often have significant influence over the board, it is difficult in their setting to disentangle the influence of superior ability (e.g., better job market opportunities) from the influence of corporate governance. To mitigate the influence of corporate governance, I use a measure that does not include CEOs’ compensation. Non-CEO executives generally have less influence over the board of directors (e.g., less likely to be a board member). Therefore, using a measure of aggregate top-management team compensation that excludes CEOs’ compensation allows for a more direct test of my hypothesis than using a measure that also includes CEOs’ compensation. In an unreported analysis, I examined whether my results are robust to including measures of corporate governance. I find that my results are robust to controlling for executives’ percentage share ownership, board membership and the entrenchment index by Bebchuk and Cohen (2005).
10
rights to protect their intellectual property and stronger in industries in which firms rely more on
restricting information leakage. This leads to the following two hypotheses:
Hypothesis 2a: R&D related executives’ equity and pay slice are positively associated with
R&D intensity.
Hypothesis 2b: The relation of R&D related executives’ equity and pay slice with R&D
intensity is weaker in industries in which firms rely more on property rights to protect their
intellectual property and stronger in industries in which firms rely more on restricting
information leakage.
Equity Grants to Non-Executive Employees
Prior literature suggests that the mobility of nonexecutive employees across firms is also
an important source of knowledge diffusion. For example, survey evidence from Levin et al.
(1987) suggests that firms count the hiring of R&D employees from innovating firms as a means
of learning about new technologies. In addition, using patent data several studies have
documented that the movement of engineers across firms is an important source of interfirm
knowledge transfers (e.g., Almeida and Kogut 1999; Song et al. 2003). It is therefore important
for innovating firms to not only retain executives but also nonexecutive employees.
Previous research also suggests that retention objectives are an important driver of the
adoption of broad-based option plans (e.g., Ittner et al. 2003; Oyer and Schaefer 2005).
Consistent with this research, Carter and Lynch (2004) find that firms that reprice stock options
exhibit lower nonexecutive employee turnover. Therefore, in line with my predictions related to
executive compensation arrangements, I expect that nonexecutive employees will receive more
stock options when firms invest more of their resources in R&D. In addition, similar to above, I
11
expect that this relation is weaker in industries in which firms rely more on property rights to
protect their intellectual property and stronger in industries in which firms rely more on
restricting information leakage. This leads to my final two hypotheses:
Hypothesis 3a: Nonexecutive Employees’ option grants are positively associated with R&D
intensity.
Hypothesis 3b: The relation of nonexecutive employees’ option grants with R&D intensity is
weaker in industries in which firms rely more on property rights to protect their intellectual
property and stronger in industries in which firms rely more on restricting information leakage.
III. Sample Selection and Variable Measurement
The sample consists of 1,077 firms and 8,402 firm-year observations included in S&P’s
ExecuComp database from 1993 through 2005.12 I retrieve compensation details for each firm’s
top executives, including salary, bonus, equity grants and equity holdings as reported in their
proxy statements. In addition, I also retrieve information on each executive’s title and CEOs’ age
and tenure.13 During my sample period, SEC disclosure requirements mandate that firms disclose
compensation details of the CEO and the four highest paid non-CEO officers, therefore each
firm-year observation contains information on approximately 5 executives.14
To be included in my sample, a firm has to satisfy the following criteria: (i) A firm’s
primary operating activities are in the manufacturing sector (2-digit SIC codes 20-39). I limit my
12 Data collection for the ExecuComp database began in 1994, with fiscal year 1993 proxies. Therefore, 1992 fiscal year data reported in ExecuComp is backfilled from the fiscal year 1993 proxies. As a result executives’ annual titles are generally missing for fiscal year 1992 data. As I use executives’ annual titles for several of my analyses, I do not use fiscal year 1992 data. 13 Unfortunately, ExecuComp’s AGE variable is missing for most non-CEO executives, and ExecuComp does not have a comparable item with which I can determine a non-CEO executive’s tenure. 14 This ranking is based on the sum of annual salary and bonus. A 1993 amendment requires firms to disclose departed CEOs and up to two other departed executives who would have been in the top four. To be consistent across firms (firms with departed executives and those without), I do not include departed executives in my sample.
12
sample to firms in the manufacturing sector because the data I use to construct measures of
industry appropriability conditions is limited to this sector (Cohen et al. 2000). Given that the
majority of industrial R&D is performed by firms in the manufacturing sector, my sample covers
a broad cross-section of firms for which R&D is most likely to be an important determinant of
employee retention objectives. (ii) A firm has Compustat data, including total assets, total
liabilities, property plant and equipment.15 (iii) A firm has data on shares outstanding, stock
returns and stock price available from CRSP.
The number of observations used for a particular analysis varies depending on specific
data requirements. All dollar denominated variables are CPI-adjusted to 1992 dollars to adjust
for the effects of inflation. In the following sub-sections, I describe the procedures I used to
construct my measures.
Unvested Equity Holdings and Total Compensation
Prior research suggests that both unvested option and restricted share holdings reduce
voluntary turnover (Balsam and Miharjo 2007). Consistent with this research, I include both
executives’ unvested option and restricted share holdings in my measure of unvested equity
holdings. I follow the method developed by Core and Guay (1999, 2002) to determine the Black-
Scholes value of executives’ unvested stock option holdings16 and determine the value of
executives’ restricted share holdings by multiplying the number of restricted shares with fiscal
year-end price.17 Finally, I use ExecuComp item TDC1 as my measure of executives’ total
compensation.18
15 Consistent with prior research, I set missing values of R&D to zero (e.g., Hanlon et al. 2003). 16 See Core and Guay (1999) for a more detailed discussion of this procedure. 17 Balsam and Miharjo (2007) scale their measures of executives’ unvested equity holdings by total compensation, which includes the value of new option and restricted stock grants. To avoid ambiguity by including items in the denominator that are also in the denominator I use an unscaled measure. In an unreported analysis I examine
13
Measure of R&D Intensity
Although SFAS 2 requires R&D to be expensed in the period incurred, there is general
consensus that R&D creates benefits over multiple periods (e.g., Cockburn and Griliches 1988;
Hall 1993; Chan et al. 2001).19 Prior literature generally uses an R&D amortization rate of 15%
per year (e.g., Hall 1993; Nadiri and Prucha 1996). Consistent with this literature, I assume an
amortization rate of 15% to construct my measure of firms’ R&D capital.20 Since R&D
investments are likely more important to firms that invest a larger proportion of their resources in
R&D, I scale my R&D capital measure by total assets. Consequently, I adopt the following
measure of R&D intensity, RDIit for firm i in year t based on current and past R&D expenditures
(RDit) and the ending value of total assets (TAit):
RDIit = (RDit + 0.85*RDit-1 + 0.70*RDit-2 + 0.55*RDit-3 + 0.40*RDit-4 + 0.25*RDit-5 + 0.10*RDit-6)/TAit (1) Effectively, I assume that common industrial factors (e.g., general technological progress)
decrease the future benefits of each R&D dollar spend by 15% a year.21
Measures of Industry Appropriability Conditions
Hypothesis 1b makes predictions on how industry appropriability conditions influence
the relation of executives’ unvested equity holdings and total compensation with R&D intensity. whether my measure of executives’ unvested equity holdings is negatively associated with executive turnover and find that this measure is negatively associated with executive turnover at the 1% statistical significance level. 18 This measure includes the following: salary, bonus, other annual, total value of restricted stock granted, total value of stock options granted (using Black-Scholes), long-term incentive payouts, and all other total. 19 Prior to 1975 (the year FAS No. 2 came into effect) firms were allowed to capitalize R&D. 20 To examine the sensitivity of my results to alternative amortization rates, I also used a 10% and 20% amortization rate and found that my results are qualitatively unaffected. In addition, I also used the 3-year average of (R&D/Total Assets) and again found that my results remain qualitatively unaffected. 21 Consistent with firms’ ability to profit from innovations being influenced by industrial characteristics, Lev and Sougiannis (1996) find that estimates of economic R&D amortization rates vary by industry. They attribute this finding to the variation in patent effectiveness across industries. In order to be able to examine how industry appropriability conditions modify the relation of executives’ unvested equity holdings and total compensation with investments in R&D I use the same amortization rate across industries and interact the resulting R&D intensity ratios with measures of industry appropriability conditions.
14
I use industry-level survey results reported by Cohen et al. (2000) to construct measures of
industry appropriability conditions. Cohen et al. (2000) obtain their data from the 1994 Carnegie
Mellon Survey on Industrial R&D (CMS). The CMS survey was limited to manufacturing
firms and targeted R&D managers (1,478 respondents, response rate 54%).22 Among other
things, the CMS survey asks respondents to report the percentage of their product and process
innovations for which the following mechanisms have been effective in protecting the firm’s
competitive advantage during the prior three years (1991-1993): (1) Patents, (2) Other Legal, (3)
Complementary Manufacturing, (4) Complementary Sales/Services, (5) Secrecy and (6) Lead-
Time.
Cohen et al. (2000) report the mean effectiveness scores of these mechanisms aggregated
at the level of 34 ISIC groups.23 Since, I cannot discern how much of a firm’s R&D is allocated
to process innovations versus product innovations, I average the effectiveness scores for product
and process innovations for each of these mechanisms. I then use the sum of the average
effectiveness scores for mechanisms (1) and (2), mentioned above, to construct a measure of how
much a firm relies on intellectual property rights to protect its intellectual property (IP).
Similarly, I use average effectiveness scores for mechanisms (3) and (4) to construct a measure
of a firm’s reliance on complementary resources (COMPL) and average effectiveness scores for
mechanisms (5) and (6) to construct a measure of a firm’s reliance on restricting information
leakage (RESTRICT). For ease of interpretability, I subsequently standardize these measures
such that their values range from zero to one.24
22 For a more detailed discussion on the sample construction procedure see Cohen et al. (2000). 23 I thank John Walsh for his help with classifying my sample-firms into the appropriate industry groups (ISIC-SIC). 24 Since the data that I use to construct measures of industry appropriability conditions are only available for one year, I effectively assume that these metrics are stable over time. This assumption is consistent with prior literature that suggests appropriability conditions are stable, enduring drivers of technological advancement (Cohen and Levin 1989). If industry appropriability conditions have changed over time it will be more difficult to find empirical support for my hypotheses.
15
Control Variables
Because prior research suggests that my measures of unvested equity holdings and total
compensation may also be influenced by other factors, I include various controls in my analyses
to address these issues. Firms are more likely to offer compensation arrangements with strong
retention incentives to executives that are more prone to switch employers. I control for each
executive’s age (AGE) and tenure (TENURE) because previous research suggests that older and
longer-tenured executives are less likely to switch employers (Fee and Hadlock 2003). In
addition, I include Garmaise’s (2007) measure of the strength of non-compete covenant
enforcement (NONCOMPETE), as non-compete covenants can make it more difficult for
executives to switch employer. Finally, as previous research suggests that executives employed
by firms with superior stock price performance have better job market opportunities (Fee and
Hadlock 2003), I control for firms’ three-year industry adjusted stock returns
(PERFORMANCE).25
Executives’ unvested equity holdings increase not only retention incentives, but also
wealth alignment and risk-taking incentives. As previous research suggests that wealth alignment
and risk-taking incentives are associated with firms’ investment in innovation (e.g., Smith and
Watts 1992; Guay 1999), I include measures of executives’ wealth alignment (Wealth Incentives)
and risk-taking incentives (Risk Incentives). Following Core and Guay (1999, 2002), I measure
wealth-alignment incentives as the natural logarithm of the change in the dollar value of
executives’ equity holdings due to a 1% change in stock price. Further, I measure risk-taking
incentives as the natural logarithm of the change in the dollar value of executives’ stock option
25 My industry benchmark is calculated by constructing a value-weighted portfolio of stock returns from all firms that operate in the same 2-digit SIC code and that have data available on both Compustat and CRSP.
16
holdings due to a 1% increase in the standard deviation of firms’ stock returns.26 In addition,
firms that rely on equity-based compensation must pay a risk-premium to compensate employees
for idiosyncratic risk. Oyer (2004) suggests that firms can reduce the risk-premium paid to
employees by partially substituting cash compensation for equity-based compensation. To
control for this relation, I include the sum of executives’ annual salary and bonus (CASHCOMP)
in my unvested equity holdings regressions.
Previous research also suggests that firms may prefer to use equity-based compensation
when they face cash constraints, earnings constraints or low marginal tax rates (Yermack 1995;
Dechow et al. 1996; Core et al. 1999; Ittner et al. 2003). I control for these alternative motives
for using equity-based compensation in my regressions. Following Core and Guay (1999), I
measure the degree of cash flow shortfall (CashShortFall) as the three-year average of
[(common and preferred dividends + cash flow used in investing activities – cash flow from
operations) / total assets]. Consistent, with Core and Guay (1999), I categorize a firm as earnings
constrained when (retained earnings + cash dividends and stock repurchases)/ (the prior year’s
cash dividends and stock repurchases), is less than two in any of the three previous years. In
addition, if the denominator is zero in all three previous years, I also classify firms as earnings
constrained (EarningsConstaint=1, zero otherwise). Further, following Ittner et al. (2003), I
classify firms with negative pretax income and net operating-loss carry-forwards as having a low
marginal tax rate (LowTax=1, zero otherwise) and firms with positive pretax income and no net
operating-loss carry-forwards as having a high marginal tax rate (HighTax=1, zero otherwise).
As firms that use equity-based compensation have to pay their employees’ a risk premium, I
26 Although an executive’s shareholdings also provide risk-taking incentives, findings by Guay (1999) suggest that this is minimal. Therefore I only include risk-taking incentives arising from stock options in my model.
17
expect that these measures are not only associated with the value of executives’ unvested equity
holdings, but also with total compensation.
In addition, because firms without manufacturing assets are naturally not able to rely on
complementary manufacturing resources to protect their intellectual property, I control for a
firm’s capital intensity (property plant and equipment/total assets: CAPINT). Finally, to control
for a firm’s size and growth opportunities, I include the natural logarithm of the market value of
assets (market-value of equity + total liabilities: MVA) and firms’ book-to-market ratios (total
assets/(market value of equity + total liabilities): BM) in all my regressions.
IV. Empirical Results
Testing Hypothesis 1
Hypothesis 1 makes predictions concerning the relation of executives’ unvested equity
holdings and total compensation with R&D intensity. In order to draw more precise inferences
from my analysis, I confine my sample to CEOs’ compensation arrangements. CEOs do not only
have relatively similar job responsibilities, but are also likely to have knowledge about specific
R&D investments and future initiatives and strategies related to R&D activities.
Table 1 presents descriptive statistics of the measures used in my analysis. Panel A
provides the mean, median and the first and third quartile for each measure for the overall
sample. Panel B presents summary statistics for each of the 34 industry groups reported by
Cohen et al. (2000).27 Consistent with hypothesis 1a, I find that CEOs in industries with
relatively higher average R&D intensities, such as the Pharmaceutical, Computer and
Semiconductor industries, have on average higher unvested equity holdings and total
compensation. 27 To reduce the influence of outliers, I have winsorized all continuous variables at the 1st and 99th
percentiles.
18
To examine the influence of R&D intensity on executives’ unvested equity holdings and
total compensation, I estimate the following model (Model 1A):
Unvested Equity Holdings = sum of Black-Scholes value of Unvested Stock options and Restricted Stock Holdings
Total Compensation = annual total compensation RDI = cumulative R&D investments (15% amortization rate), scaled by
total assets IP = standardized measure of firms’ reliance on intellectual property
rights COMPL = standardized measure of firms’ reliance on complementary resources
RESTRICT = standardized measure of firms’ reliance on restricting information leakage
AGE = CEOs’ age in years TENURE = natural logarithm of the number of years since executive became
CEO NONCOMPETE = Garmaise (2007) non-compete enforceability index
PERFORMANCE = three-year industry adjusted stock returns Wealth Incentives = natural logarithm of the change in the dollar value of executives’
equity holdings due to a 1% change in stock price Risk Incentives = natural logarithm of the change in the dollar value of executives’
stock option holdings due to a 1% increase in the standard deviation of firms’ stock returns
CASHCOMP = sum of annual salary and bonus CashShortFall = 3-year average of (common and preferred dividends + cash flow
used in investing activities – cash flow from operations)/total assets EARNINGSCONSTRAINT = a dummy variable equal to 1 if in any of the prior three years
(retained earnings + cash dividends and stock repurchases)/(the prior year’s cash dividends and stock repurchases)<2 or the denominator is zero for all three preceding years
LowTax = a dummy variable equal to 1 when firms have negative pretax income and net operating-loss carry-forwards
HighTax = a dummy variable equal to 1 when firms have positive pretax income and no net operating-loss carry-forwards
CAPINT = property, plant and equipment, scaled by total assets
19
MVA = natural log of the sum of market value of equity and total liabilities BM = total assets scaled by MVA
YEAR = dummies for years 1994 through 2005
Hypothesis 1a predicts a positive association between R&D intensity and executives’
unvested equity holdings and total compensation. Therefore, I expect that β1 is positive. Table 2
reports the results of estimating model 1A. Consistent with hypothesis 1a, model 1A’s regression
results show that the coefficient on R&D intensity is positive and significant at p < 1% (two-
tailed) for both CEOs’ unvested equity holdings (column 1) and total compensation (column 2).28
In addition, I find that the coefficients on my measures of executive mobility are
significant and in the predicted direction. In particular, older CEOs (AGE) have lower unvested
equity holdings and CEOs with longer tenure (TENURE) receive less compensation. Further, I
find that CEOs employed by firms based in states with stronger enforcement of non-compete
covenants (NONCOMPETE) receive less compensation and that CEO’s total compensation and
unvested equity holdings are positively associated with superior stock price performance
(PERFORMANCE). In addition, I find that my measures of accounting and tax related motives
for using equity-based compensation are significantly associated with executives’ unvested
equity holdings and total compensation. Specifically, I find that CEOs employed by firms that
have low marginal tax rates (LOW TAX) and are less cash constrained (CashShortFall) have
larger unvested equity holdings and that earnings constrained (EARNINGSCONSTRAINT) firms
28 In all my analyses I adjust standard errors for residual dependence at the firm-level. Alternatively I could allow for clustering of residual terms at the industry-level. However, previous research points out that the clustered standard error approach is not appropriate when the number of clusters is small relative to the number of observations in each cluster (e.g., Wooldridge 2002; Petersen 2007). As I only have 34 ISIC groups, clustering at the industry-level is clearly not appropriate. Nevertheless, in unreported analyses I also performed my analyses with clustered standard errors at the industry level and find similar results.
20
pay their CEOs more.29 Finally, as predicted I find that CEOs at firms that are more capital
intensive (CAPINT) have lower unvested equity holdings and receive less compensation.
Hypothesis 1b predicts that the relation of CEOs’ unvested equity holdings and total
compensation with R&D intensity is weaker in industries in which firms rely more on property
rights and stronger in industries in which firms rely more on restricting information leakage. To
test these predictions, I interact my measure of R&D intensity (RDI) with my measures of
industry appropriability conditions (i.e., IP, COMPL and RESTRICT). I expect that the
interactions of R&D intensity (RDI) with intellectual property rights (IP) and complementary
resources (COMPL) are negative and the interaction of R&D intensity (RDI) with restricting
information leakage (RESTRICT) is positive (Model 1B).
Consistent with hypothesis 1b, regression results for CEOs’ unvested equity holdings
(column 3) show that the coefficients on the interactions of R&D intensity with intellectual
property rights (IP), complementary resources (COMPL) and restricting information leakage
(RESTRICT) are all significant and in the predicted direction at p<5%. Regression results for
CEOs’ total compensation (column 4) show similar results, with one exception. Although the
interaction of R&D intensity with intellectual property is in the predicted direction it is not
significant.
To quantify the economic importance of industry appropriability conditions, I note that
the coefficients on the interaction of R&D intensity with restricting information leakage indicate
that the increase in CEOs’ unvested equity holdings and total compensation due to a one
percentage point increase in R&D intensity (RDI) is respectively $127,300 (0.01*[(1-
29 The negative relation of CashFlowShortFall with executives unvested equity holdings is in conflict with prior studies that suggest that cash constrained firms rely more on equity-based compensation. In an unreported analysis I examine the cause of this finding. I find that dropping CASHCOMP results in a positive, significant coefficient on CashFlowShortFall. This suggests that my CASHCOMP measure captures part of the, by previous research documented, relation of equity-based compensation with cash constraints.
21
0)*12.73]*$1mln.) and $32,200 (0.01*[(1-0)*3.22]*$1mln) larger in industries in which firms
rely most on restricting information leakage compared to industries in which firms rely least on
restricting information leakage.
In summary, the results of testing hypothesis 1, presented in table 2, are consistent with
innovating firms being less concerned about executive mobility when property rights provide
effective protection against product imitation. Next, I examine whether managerial knowledge
influences the relation of executive compensation arrangements with R&D intensity and industry
appropriability conditions.
Testing Hypothesis 2
Hypothesis 2 makes predictions on R&D related executives’ equity and pay slice. Ideally,
my sample would include the same firm-year observations that I used in my previous analysis.
However, firms generally only disclose compensation arrangements of the top four highest paid
non-CEO officers. Therefore, I limit my sample to firm-year observations that disclose R&D
related executives among the four highest paid non-CEO officers. I use executives’ annual titles
on ExecuComp (TITLEANN) to determine whether executives are from a functional area related
to R&D.30 Using this procedure, I indentified R&D related executives in approximately 19%
(1,558) of my firm-year observations.31
30 To identify such executives, I manually check whether an executive’s annual title suggests that the executive is from a functional area related to R&D. In particular, I examine whether their annual title includes terms such as CTO, Chief Technology Officer, Engineering, R&D, Scientific and Manufacturing. If my methodology yields multiple R&D related executives in a firm-year observation, I select the R&D related executive with the highest total compensation. 31 Some firm-year observations disclose more than four non-CEO executives, while others disclose less. To be consistent across firm-year observations I select the top four highest-paid non-CEO executives (in terms of total compensation) when firms disclose more than four non-CEO executives (19.45%) and drop firm-year observations that disclose less than four non-CEO executives (7.50%).
22
Table 3 presents descriptive statistics of R&D related executives’ equity and pay slice
and the other main measures used in my analysis across the 34 industry groups reported by
Cohen et al. (2000). Consistent with hypothesis 2a, I find that R&D related executives’ equity
and pay slice are relatively higher in R&D intensive industries such as pharmaceuticals and
semiconductors.
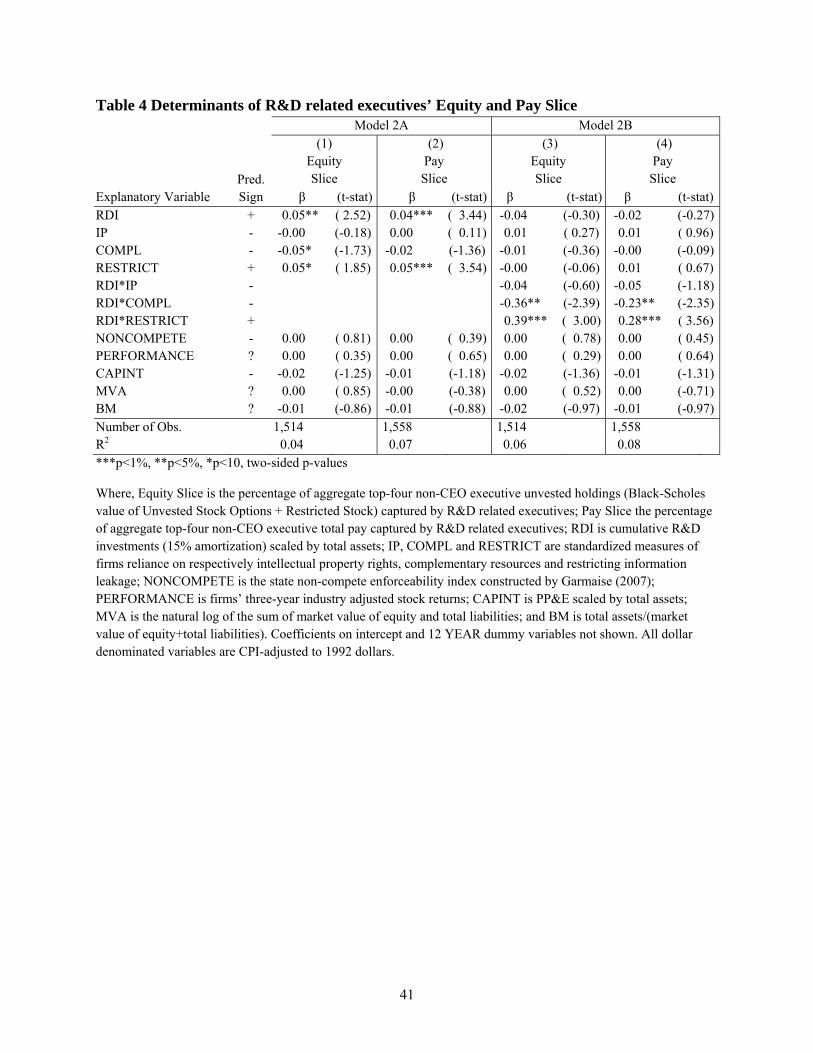
To examine the influence of R&D intensity on R&D related executives’ equity and pay
Equity Slice = percentage of aggregate top-four non-CEO executive unvested holdings (Black-Scholes value of Unvested Stock Options + Restricted Stock) captured by R&D related executives
Pay Slice = percentage of aggregate top-four non-CEO executive total pay captured by R&D related executives. All remaining measures are as defined above.
Hypothesis 2a predicts a positive relation between R&D related executives’ equity and
pay slice with R&D intensity. Therefore, I expect that β1 is positive. Table 4 reports the results of
estimating model 2A (column 1 and 2). Consistent with my prediction, model 2A’s regression
results show that the coefficient on R&D intensity in my equity and pay slice regressions is in
the predicted direction and significant at respectively p < 5% and p < 1%.
Similar to above, I examine whether the relation of R&D related executives’ equity and
pay slice with R&D intensity is weaker in industries in which firms rely more on property rights
and stronger in industries in which firms rely more on restricting information leakage by
interacting my measure of R&D intensity (RDI) with my measures of industry appropriability
23
conditions (i.e., IP, COMPL and RESTRICT). Consistent with hypothesis 2b, regression results
for model 2B show that the coefficients on the interactions of R&D intensity with
complementary resources and restricting information leakage are in the predicted direction and
significant at respectively p < 5% and p < 1% in both my equity and pay slice regressions.
However, although the coefficient on the interaction of R&D intensity with intellectual property
rights is in the predicted direction it is not significant in both regressions.
To quantify the economic importance of industry appropriability conditions, I note that
the coefficients on the interaction of R&D intensity with restricting information leakage indicate
that the increase in R&D related executives’ equity and pay slice due to a one percentage point
increase in R&D intensity (RDI) is respectively 0.39% (0.01*[(1-0)*0.39]*100%) and 0.28%
(0.01*[(1-0)*0.28]*100%) larger in industries in which firms rely most on restricting
information leakage compared to industries in which firms rely least on restricting information
leakage.
In summary, the results of testing hypothesis 2, presented in table 4, are consistent with
R&D intensity and industry appropriability conditions having a more pronounced influence on
executive compensation arrangements when executives’ knowledge is more closely related to
R&D.
Testing Hypothesis 3
Hypothesis 3 makes predictions concerning option grants to nonexecutive employees.
Following prior research, I derive a measure of the value of options granted to nonexecutive
employees through an ExecuComp item (PCTTOTOPT) that captures the percentage that each
option grant to executives represents of all options granted by a firm (Bergman and Jenter 2007).
24
In particular, using this item I compute for each individual executive grant an estimate of the
total options granted to employees. Subsequently, for each firm-year observation, I subtract the
total number of options granted to top-five executives from the mean of these estimates to
construct a measure of the total number of options granted to nonexecutive employees. I then
apply the Black and Scholes (1973) formula to compute the value of options granted to
nonexecutive employees and subsequently scale by the number of employees to compute a
measure of the average value of nonexecutive employee option grants. 32
Using the above described methodology limits the sample to firm-year observations in
which at least one of the top-five executives received an option grant. Following prior research, I
further limit my sample to firm-year observations for which the sample standard deviation of
options granted to employees during a fiscal year is less than 10% of the mean estimate
(Bergman and Jenter 2007). 33 The resulting sample consists of 6,477 firm-year observations
(1,025 firms). Table 5 presents descriptive statistics of nonexecutive employee option grants and
the other main measures used in my analysis across the 34 industry groups reported by Cohen et
al. (2000).
Consistent with my prediction that nonexecutive employee option grants are relatively
larger when firms invest more of their resources in R&D, I find that firms in the more R&D
intensive industries (e.g., pharmaceutical, computers and computer industries) grant more stock
options to nonexecutive employees.
32 As I am unable to determine what the exercise price and strike price of option grants were at the time of the grant, I assume that these are equal to the midpoint of the year high and year low stock prices. I set the option maturity uniformly to 10 years and obtain estimates of dividend yield and stock price volatility from ExecuComp and the risk-free rate from the Federal Reserve. 33 Estimates of the total number of options granted to employees may vary significantly within a firm-year observation, because options may have been granted under different plans. For instance, some executives may have received option grants under a plan for the subsidiary, while others received their option grants under a plan for the parent. Therefore, following Bergman and Jenter (2007) I eliminate firm-year observations for which the sample standard deviation of these estimates exceeds 10% of the mean.
25
To examine the influence of R&D intensity on nonexecutive employee option grants, I
the Black-Scholes value of option grants to nonexecutive employees scaled by the total number of employees. All remaining measures are as defined above.
Hypothesis 3a predicts a positive relation between nonexecutive employee option grants
and R&D intensity. Therefore, I expect that β1 is positive. Table 6 reports the results of
estimating model 3A (column 1). Consistent with my prediction, model 3A’s regression results
show that the coefficient on R&D intensity is significant and in the predicted direction at p < 1%.
To test hypothesis 3b, I include interactions between RDI and my three measures of
industry-level appropriability conditions (model 3B). Column 2 of table 6 reports the results of
estimating model 3B. Consistent with my predictions, the regression results show that the
coefficient on the interaction of R&D intensity with complementary resources (COMPL) and
restricting information leakage (RESTRICT) are in the predicted direction and significant at p <
1%. However, although I find that the coefficient on the interaction of R&D intensity with
intellectual property rights (IP) is in the predicted direction, it is not significant.
Again, the influence of industry appropriability conditions is economically significant.
The increase in nonexecutive employee option grants due to a one percentage point increase in
R&D intensity (RDI) is $650.70 (0.01*[(1-0)*65.07]*1,000) larger in industries in which firms
26
rely most on restricting information leakage compared to industries in which firms rely least on
restricting information leakage.34
In summary, the results of testing hypothesis 3 (table 6) are consistent with my
expectation that not only executive mobility, but also nonexecutive employee mobility is a
significant concern to innovating firms. Moreover, consistent with my earlier findings, the results
in table 6 suggest that nonexecutive employee mobility is less of a concern when property rights
provide effective protection against product imitation.
V. Robustness Tests
Simultaneity of R&D intensity and Executive Compensation (Hypothesis 1)
In the previous analyses, I assume that R&D intensity is exogenous to executives’
unvested equity holdings and total compensation. However, unvested equity holdings and higher
pay may not only encourage executives to remain longer with their firms, but also to make more
long-term investments such as investments in R&D. To mitigate potential simultaneity bias, I use
a two-stage least squares analysis. To implement this analysis I construct two instruments. First,
I compute for every firm-year observation the average R&D intensity of all firms that operate in
the same industry group (ISICGRP) and are in the same size decile by total assets (IRDI).
Second, I obtain for every firm-year observation the annual change in sales (SALECHG).
To re-estimate model 1A I first regress RDI on IRDI, SALECHG and the remaining
independent variables from equation 1A to obtain fitted values of RDI. Because IRDI and
SALECHG are likely highly correlated with firms’ R&D intensity (RDI), but are unlikely to be
34 Note that I effectively assume that all of a firm-year observation’s nonexecutive employees receive the same option grant. As options are likely a more important component of total compensation for higher level employees and employees more directly involved in R&D, I expect that the economic significance of my hypothesized relations is more significant for these groups of nonexecutive employees.
27
driven by executives’ long-term incentives, I expect that the fitted values of RDI will exhibit a
lower correlation with the structural equation error term and are therefore less susceptible to
simultaneity bias. In the second stage, I re-estimate model 1A substituting the fitted values of
RDI from the first-stage regression for RDI.
I use a similar procedure for re-estimating model 1B. However, because the endogenous
regressor RDI is interacted with my three measures of industry-level appropriability conditions, I
use four first-stage regressions. 35 In these first-stage regressions, I obtain fitted values for RDI
and RDI interacted with IP, COMPL and RESTRICT by regressing these measures on IRDI,
SALECHG, the interactions of IRDI with my three measures of industry-level appropriability
conditions and the remaining independent variables from equation 1B. In the second-stage, I re-
estimate model 1B substituting the fitted values of RDI and the interactions of RDI with IP,
COMPL and RESTRICT from the first-stage regression with the original values for these
measures.
Table 7 shows the results of re-estimating models 1A and 1B for my sample of CEOs.
The results show that my findings are robust to adjusting for simultaneity, with one exception.
Although the coefficient of R&D intensity with intellectual property rights in my unvested equity
holdings regression is negative, it does not remain significant.
Selection Bias (Hypothesis 2)
As mentioned above, I cannot identify R&D related executives within the top
management team for approximately 81% of my firm-year observations. Observing R&D related
executives among the top-four non-CEO executives is likely not random. For instance, while
35 See Wooldridge (2002, pp. 235-237) for a more detailed discussion on why a separate first-stage regression is required for every interaction term.
28
some firms will find it beneficial to centralize R&D related tasks, others will find it beneficial to
decentralize decision-making and allocate R&D related tasks to divisional managers. If
unobservable characteristics that determine whether R&D related executives are among the top-
four highest paid non-CEO executives are correlated with unobservable characteristics that
determine R&D related executives’ equity and pay slice, then my results may suffer from sample
selection bias (Heckman 1979). To address a potential selection bias, I estimate the following
a dummy variable equal to 1when I am able to identify a R&D related executive among the top 4 non-CEO officers, and zero otherwise.
NSEGMENTS = number of business segments. All remaining measures are as defined above.
Inverse Mills Ration = Inverse Mills Ratio obtained from model P1
The first equation (P1) specifies a Probit regression and models the probability that a
R&D related executive is among the top-four highest paid non-CEO executives. Consistent, with
hypothesis 1, I expect that R&D related executives are paid more and are consequently more
likely to be among the top-four highest paid non-CEO executives when firms invest more of
their resources in R&D. Moreover, consistent with hypothesis 1b, I expect that this association is
29
stronger in industries in which firms rely less on property rights and more on restricting
information leakage to protect their intellectual property. In addition, because large, diversified
firms are more likely to have divisional managers among the top-four non-CEO executives
(Aggarwal and Samwick 2003), I expect that my measures of firm size (MVA) and number of
business segments (NSEGMENTS) are negatively associated.36
I use model P1 estimation results to calculate the inverse mills ratio and add this ratio to
model P2. Including this term in model P2 accounts for selection-bias and yields consistent
parameter estimates.37 Using this two-stage approach, I find that both the probability that R&D
related executives are disclosed among the top-four non-CEO executives (p < 1%) and R&D
related executives’ equity and pay slice (p < 5%) are positively associated with R&D intensity
(results not reported). Table 7 reports the results of estimating model 2B after correcting for
selection bias for R&D related executives’ equity and pay slice. Columns 1 and 3 report
maximum likelihood estimations of a Probit model for the determinants of an R&D related
executive being disclosed among the top 4 highest paid non-CEO executives. Columns 2 and 4
report OLS regression results with respectively R&D related executives’ equity and pay slice as
the dependent variable.
The Probit estimation results for model 2B (column 1 and 3) show that the coefficient on
the interaction of R&D intensity (RDI) with intellectual property rights (IP) is positive and
significant at p < 10%. This finding is inconsistent with my expectation that R&D related
executives will be paid less when innovating firms rely on intellectual property rights to protect
their intellectual property. However, it is consistent with a recent report by Deloitte that suggests
36 I did not include NSEGMENTS in the second-stage regression as I have no reason to believe that this measure is associated with R&D related executives’ equity and pay slice. In an unreported analysis, I included NSEGMENTS in both the first stage and second-stage regression and find that this does not alter my findings. Moreover, I find that the coefficient on NSEGMENTS in the second-stage regression is statistically insignificant. 37 The standard errors of the estimates also must be adjusted for the selection process, see Greene 2002, p. 782-785.
30
that decision making in the pharmaceutical industry, an industry that relies extensively on
intellectual property rights, is highly centralized. 38
In addition, consistent with my expectations, I find that the coefficient on the interaction
of R&D intensity (RDI) with restricting information leakage (RESTRICT) is positive and
significant at p < 5%.39 Moreover, I note that consistent with my expectation, firm size (MVA)
and the number of business segments (NSEGMENTS) are negatively associated with the
probability that R&D related executives are among the top-four highest paid non-CEO
executives.
The OLS estimation results for model 2B, reported in column 2 and 4, show that my
results are robust to adjusting for selection bias. In particular, the same interactions that were
significant before are now also significant.
Bias due to missing nonexecutive employee option grant data (Hypothesis 3)
The ExecuComp item that I use for testing hypothesis 3 (PCTTOTOPT) is coded as
missing when none of the executives received an option grant during a fiscal year. Not all firms
use stock options therefore my methodology incorrectly codes nonexecutive employee grants as
missing when firms do not use stock options. To address this concern I code nonexecutive
employee option grants as zero when none of the disclosed executives holds vested or unvested
stock options (184 firm-year observations). I find that my results remain unaffected by this
alteration.
38 Source: Deloitte Touche Tohmatsu. 2007. Innovation in emerging markets, 2007 Annual Study 39 Ai and Norton (2003) show that for non-linear regressions (e.g., Probit regressions), significance of the interactive terms does not imply the existence of statistically significant interactive effects. Hence the coefficients on my interaction terms may not adequately capture the true interaction effect. To address this concern, I estimate the Probit interactive effects as suggested by Ai and Norton (2003). I find that consistent with the results reported in table 7 the interactive effects of R&D intensity with intellectual property rights and restricting information leakage are generally positive and significant.
31
Insufficient short-term performance may induce boards not to grant their executives
options during a fiscal year. To examine whether my results are robust to controlling for short-
term performance I include measures of return on assets and 1-year stock returns and find that
again my results remain unaffected. For completeness, I repeat my analysis using the selection
model approach discussed in the previous subsection. In the first-stage I include return on assets
and 1-year stock returns in addition to the independent measures from model 3A. I find that
again my results remain unaffected.
VI. Conclusion
I examine how the mechanisms firms rely on to protect their intellectual property
influence compensation arrangements. Consistent with innovating firms being concerned about
employees leaving to use their R&D related information to exploit inventions on their own or
with competitors, I find that executives’ unvested equity holdings and total compensation are
positively associated with R&D intensity. In addition, I find that R&D related executives (e.g.,
chief scientific officer) capture a larger fraction of a firm’s aggregate top management team’s
unvested equity holdings and total compensation when firms invest more of their resources in
R&D. Consistent with firms also being concerned about nonexecutive employees leaving, I find
that nonexecutive employees’ stock option grants are positively associated with R&D intensity.
Moreover –and this is the main contribution of this paper- I find that these relations are weaker
in industries in which firms rely more on property rights and less on restricting information
leakage. These findings suggest that innovating firms are less concerned about employee
mobility when they can effectively protect their intellectual property with property rights.
32
This study contributes to the literature by providing the first evidence that executive
compensation arrangements and nonexecutive employee option grants are influenced by the
mechanisms that firms use to protect their intellectual property. Because of data restrictions, I
confined my analysis to the manufacturing sector. It remains an open question as to whether the
same relations also apply to non-manufacturing firms, and in particular, to firms for which
tangible assets are not an important productive input (e.g., software firms).
One limitation of my study is that, although I controlled for firms’ superior stock price
performance, I may not fully have controlled for the influence of employees’ ability on
compensation arrangements. An alternative explanation for my findings is that R&D intensive
firms require employees with superior abilities. However, as there is no reason to believe that
such a relation should vary based on the mechanisms that firms use to protect their intellectual
property, I do not believe that this alternative explanation adequately describes my findings.
Nevertheless, it would be interesting to disentangle the influence of employee ability from the
influence of intellectual property and property rights. I leave this to future research.
33
References Aboody, D. and B. Lev. 2000. “Information Asymmetry, R&D, and Insider Gains.” The Journal of Finance. Vol.55, No. 6: pp. 2727-2766. Aggarwal, R.K. and A. A. Samwick. 2003. “Performance Incentives within Firms: The effect of Managerial Responsibility.” Vol. 58. No. 4: pp. 1613-1650. Ai, C., and E.C. Norton. 2003.”Interaction terms in logit and probit models.” Econ Letters, Vol. 80: pp. 123–129. Almeida, P. and B. Kogut. 1999. “Localization of Knowledge and the Mobility of Engineers in Regional Networks.” Management Science, Vol. 45, No. 7: pp. 905-917. Anderson, M.C., Banker, R.D. and S. Ravindran. 2000. “Executive Compensation in the Information Technology Industry.” Management Science, Vol. 46, No. 4: pp. 530-547. Arora, A. 1997. "Patents, licensing, and market structure in chemicals." Research Policy, Vol. 26: pp. 391-403. Balkin. D.B., Markman, G.D. and L.R. Gomez-Mejia. 2000. “Is CEO Pay in High-Technology Firms Related to Innovation?” Vol. 43, No. 6: pp. 1118-1129. Balsam, S. and S. Miharjo. 2007.“The effect of equity compensation on voluntary executive turnover.” Vol. 43: pp. 95-119. Bebchuk, L.A. and A. Cohen. 2005. “The costs of entrenched boads.” Journal of Financial Economics, Vol. 78: pp. 409-433. Bebchuk, L.A., Cremers, M. and U. Peyer. 2007. “CEO Centrality.” Working Paper Harvard University Bergman, N.K. and D. Jenter. 2007. “Employee sentiment and stock option compensation.” Journal of Financial Economics, Vol. 84: pp. 667-712. Bertrand, M. and A. Schoar. 2003. “Managing With Style: The Effect of Managers on Firm Policies.” Vol. 118, No. 4: pp. 1169-1208. Bhide, Amar. The origin and evolution of new businesses. New York: Oxford University Press, 2000. Black, F. and M. Scholes. 1973. “The pricing of options and corporate liabilities.” Journal of Political Economy, Vol. 81: pp. 637–659. Boeker, W. 1997. “Executive Migration and Strategic Change: The effect of Top Manager Movement on Product-Market Entry.” Vol. 42, No. 2: pp. 213-236.
34
Carter, M.E., and L.J., Lynch. 2004. “The effect of stock option repricing on employee turnover.” The Accounting Review, Vol. 37, No. 1: pp. 91-112. Chan, L.K.C., Lakonishok, J. and T. Sougiannis. 2001. “The Stock Market Valuation of Research and Development Expenditures.” The Journal of Finance. Vol. 56. No.6: pp. 2431-2456. Cockburn, I. and Z. Griliches. 1988. “Industry Effects and Appropriability Measures in the Stock Market’s Valuation of R&D and Patents.” The American Economic Review, Vol. 78, No. 2: pp. 419-423. Cohen, W.M., Nelson, R.R. and J.P. Walsh. 2000. “Protecting their Intellectual Assets: Appropriability Conditions and Why U.S. Manufacturing Firms Patent (Or Not).” NBER Working Paper Series Core, J. and W. Guay. 1999. “The use of equity grants to manage optimal equity incentive levels.” Journal of Accounting and Economics, Vol. 28: pp. 151-184. Core, J. and W. Guay. 2002. “Estimating the Value of Employee Stock Option Portfolios and Their Sensitivities to Price and Volatility.” Journal of Accounting Research, Vol. 40, No. 3: pp. 613-630. Corrado, C. A, Hulten, C.R. and D. E. Sichel. 2006. “Intangible Capital and Economic Growth,” NBER Working Paper #11948. Dechow, P., Hutton, A. and R. Sloan. 1996. “Economic consequences of accounting for stock-based compensation.” Journal of Accounting Research, Vol. 34: pp. 1-20. Desmet, T.O. 1999. “The Economic Espionage Act of 1996: Are We Finally Taking Corporate Spies Seriously?” Houston Journal of International Law, Vol 22: pp. 93-128. Eberhart, A.C., Maxwell, W.F. and A.R., Siddique. (2004). “An Examination of Long-Term Abnormal Stock Returns and Operating Performance Following R&D Increases.” The Journal of Finance. Vol. 59, No. 2: pp. 623-650. Fee, C. E. and C.J. Hadlock. 2003. “Raids, Rewards, and Reputations in the Market for Managerial Talent.” The Review of Financial Studies, Vol. 16, No. 4: pp. 1315-1357. Garmaise, M.J. 2007.”Ties that Truly Bind: Non-competition Agreements, Executive Compensation and Firm Investment.” Working Paper, UCLA Gilson, R.J. 1999. “The Legal Infrastructure of High Technology Industrial Districts: Silicon Valley, Route 128, and Covenants not to Compete.” New York University Law Review, Vol. 74, No. 3: pp. 575-629.
35
Gore. A., Matsunaga, S. and E. Yeung. 2007. “Financial Expertise and the Usefulness of Earnings: Evidence from the Cash Compensation of Chief Financial Officers.” Working Paper University of Oregon Green, W. 2002. Econometric Analysis 5th edition, New Jersey: Prentice Hall. Guay, W. 1999. “The sensitivity of CEO wealth to equity risk: an analysis of the magnitude and determinants.”Journal of Financial Economics, Vol. 53: pp. 43-71. Hall, B.H. 1993. “The Stock Market’s Valuation of R&D Investment During the 1980’s.” American Economic Review, Vol. 83: pp. 259-264. Hanlon, M., Rajgopal, S. and T. Shevlin. 2003. “Are executive stock options associated with future earnings?” Journal of Accounting and Economics, Vol. 36: pp. 3-43. Heckman, J., 1979. “Sample selection bias as a specification error.” Econometrica, Vol. 47: pp. 153-161. Ittner, C.D., Lambert, R.A. and D.F., Larcker. 2003. “The structure and performance consequences of equity grants to employees of new economy firms.” Journal of Accounting and Economics, Vol. 34: pp. 89-127. Kim, J. and G. Marschke. 2005. “Labor mobility of scientists, technological diffusion, and the firm’s patenting decision.” Rand Journal of Economics, Vol. 36, No. 2: pp. 298-317. Lev, B. and T. Sougiannis. 1996. “The capitalization, amortization, and value-relevance of R&D.” Journal of Accounting and Economics, Vol. 21: pp. 107-138. Lev, B. 2001. Intangibles: Management, measurement, and reporting. Washington, D.C.: Brookings Institution Press. Levin, R.C., Kleverock, A.K., R.R., Nelson, S.G., Winter, R., Gilbert and Zvi Griliches. 1987. “Appropriating the Returns from Industrial Research and Development.” Brookings Papers on Economic Activity, Vol. 1987, No.3: pp. 783-831. Mansfield, E. 1986. “Patents and Innovation: An Empirical Study.” Management Science, Vol. 32, No.2: pp. 173-181. Nadiri, M. I. and I.R. Prucha. 1996. “Estimation of the depreciation rate of physical and R&D capital in the U.S. Total Manufacturing Sector.”, Economic Inquiry, Vol. 34, No. 1: pp. 43-56. Oyer, P. 2004.”Why Do Firms Use Incentives That Have No Incentive Effects?” The Journal of Finance, Vol. 59, No. 4: pp. 1619-1650.
36
Oyer, P. and S. Schaefer. 2005. “Why do some firms give stock options to tall employees?: An empirical examination of alternative theories.” Journal of Financial Economics, Vol. 76: pp. 99-133. Petersen, M.A. 2007. “Estimating Standard Errors in Finance Panel Data Sets.” Forthcoming Review of Financial Studies. Rajan, R.G. and L. Zingales, 2000. “The Governance of the New Enterprise.” NBER Working Paper Series. Rajan, R.G. and L. Zingales. 2001. “The Influence of the Financial Revolution on the Nature of Firms.” The American Economic Review, Vol. 91, No. 2: pp. 206-211. Shapley, D. 1978. “Electronics Industry Takes to “Potting” Its Products for Market.” Science, Vol. 202, No. 4370: pp. 848-849. Smith, C.W. and R.L., Watts. 1992.“The Investment Opportunity Set and Corporate Financing, Dividend, and Compensation Policies.” Journal of Financial Economics, Vol. 32: pp. 262-292. Song, J., Almeida, P. and G. Wu. 2003. “Learning-by-Hiring: When is Mobility More Likely to Facilitate Interfirm Knowledge Transfer?” Management Science, Vol. 49, No. 4: pp. 351-365. Teece, D.J. 1986. “Profiting from technological innovation: Implications for integration, collaboration, licencing and public policy.” Research Policy. Vol. 15: pp. 285-305. Teece, D.J. 2000 Managing Intellectual Capital: Organizational, Strategic, and Policy Dimensions, New York: Oxford University Press. Williamson, O. 1985. The Economic Institutions of Capitalism. The Free Press, New York. Winter, S.G. Appropriating the gains from innovation, Chapter 11 in Wharton on Managing Emerging Technologies, G. S. Day, P. J. H. Schoemaker, and R. E. Gunther (eds.), Wiley, New York, 2000, pp. 242-266. Wooldridge, J.M. 2002. Econometric Analysis of Cross Section and Panel Data, Cambridge, MA: MIT Press. Wooldridge, J.M. 2003. “Cluster-Sample Methods in Applied Econometrics.” The American Economic Review, Vol. 93, No. 2: pp.133-138. Yermack, D. 1995. “Do corporations award CEO stock options effectively?” Journal of Financial Economics Vol. 39: pp. 237-269. Zabojnik, J. 2002. “A Theory of Trade Secrets in Firms.” International Economic Review, Vol. 43, No. 3: 831-856.
37
Table 1 Descriptive analysis of main measures used in empirical analysis Panel A: Descriptive statistics of measures used for total sample (N=7,709) VARIABLE Mean Median Q1 Q3 Unvested Equity Holdings (mln) 6.00 2.16 0.61 6.30
Total Compensation (mln) 3.11 1.79 0.90 3.73
RDI 0.15 0.07 0.01 0.21
IP 0.47 0.49 0.30 0.63
COMPL 0.47 0.43 0.39 0.50
RESTRICT 0.56 0.57 0.45 0.68
AGE (years) 56.27 57.00 52.00 61.00
TENURE (years) 7.81 5.42 2.66 10.51
NONCOMPETE 3.82 5.00 3.00 5.00
PERFORMANCE -0.14 -0.26 -0.53 0.04
Wealth Incentive 5.07 5.06 4.13 6.05
Risk Incentives 3.45 3.61 2.54 4.59
CASHCOMP (mln) 1.02 0.78 0.47 1.31
CashShortFall -0.16 -0.16 -0.23 -0.10
EARNINGSCONSTRAINT 0.32 0.00 0.00 1.00
HIGHTAX 0.59 1.00 0.00 1.00
LOWTAX 0.08 0.00 0.00 0.00
CAPINT 0.54 0.48 0.30 0.72
MVA (billion) 7.22 1.58 0.57 5.18
BM 0.62 0.61 0.42 0.80 Where, Unvested Equity Holdings is the sum of the Black-Scholes value of Unvested Stock Option holdings and the value of Restricted Stock holdings (million); Total Compensation is total annual compensation (million); RDI is cumulative R&D investments (15% amortization) scaled by total assets; IP, COMPL and RESTRICT are standardized measures of firms reliance on respectively intellectual property rights, complementary resources and restricting information leakage. AGE is a CEO’s age in years; TENURE is years since executive became CEO; NONCOMPETE is the state non-compete enforceability index constructed by Garmaise (2007); PERFORMANCE is firms’ three-year industry adjusted stock returns; Wealth Incentives is natural logarithm of the change in the dollar value of executives’ equity holdings due to a 1% change in stock price; Risk Incentives is natural logarithm of the change in the dollar value of executives’ stock option holdings due to a 1% increase in the standard deviation of firms’ stock returns; Total CASHCOMP is the sum of annual salary and bonus (million); CashShortFall is the 3-year average of [(common and preferred dividends+cash flow used in investing activities–cash flow from operations) /total assets]; EARNINGSCONSTRAINT is equal to 1 if in any of the prior three years (retained earnings+cash dividends and stock repurchases)/(the prior year’s cash dividends and stock repurchases)<2 or the denominator is zero for all three preceding years, zero otherwise; LowTax=1 when firms have negative pretax income and net operating-loss carry-forwards, zero otherwise; HighTax=1 when firms have positive pretax income and no net operating-loss carry-forwards, zero otherwise; CAPINT is PP&E scaled by total assets; MVA is sum of market value of equity and total liabilities; BM is total assets/(market value of equity + total liabilities). All dollar denominated variables are CPI-adjusted to 1992 dollars.
38
Panel B: Descriptive statistics of main measures by industry group
Table 2 Determinants of CEO Compensation Model 1A Model 1B
Pred. Sign
(1) Unvested
Equity Holdings
(2) Total
Compensation
(3) Unvested
Equity Holdings
(4) Total
Compensation Explanatory Variable β (t-stat) β (t-stat) β (t-stat) β (t-stat)RDI + 3.19*** ( 3.54) 1.16*** ( 4.61) 4.63* ( 1.82) 2.24*** ( 3.13) IP - -1.31 (-1.36) -0.51** (-2.03) -0.18 (-0.15) -0.25 (-0.80) COMPL - -1.78** (-1.96) -0.75*** (-2.87) -0.96 (-0.92) -0.43 (-1.43) RESTRICT + 1.91 ( 1.64) 0.75*** ( 2.66) 0.89 ( 0.68) 0.55* ( 1.71) RDI*IP - -6.00** (-2.05) -1.28 (-1.43) RDI*COMPL - -13.95** (-2.54) -5.57*** (-3.35) RDI*RESTRICT + 12.73*** ( 2.68) 3.22** ( 2.19) AGE - -0.09*** (-3.02) 0.00 ( 0.31) -0.09*** (-2.98) 0.00 ( 0.41) TENURE - -0.11 (-0.56) -0.14** (-2.44) -0.12 (-0.63) -0.14** (-2.51) NONCOMPETE - -0.12 (-1.30) -0.06** (-2.38) -0.11 (-1.17) -0.05** (-2.29) PERFORMANCE + 1.37*** ( 4.66) 0.36*** ( 4.60) 1.38*** ( 4.65) 0.36*** ( 4.57) Wealth Incentives + 1.19*** ( 6.89) 0.24*** ( 5.35) 1.20*** ( 7.00) 0.24*** ( 5.41) Risk Incentives + 1.32*** ( 6.57) 0.63*** (14.63) 1.32*** ( 6.55) 0.63*** (14.54) CASHCOMP + 2.77*** ( 4.92) 2.79*** ( 4.97) Cash Flow Short Fall + -5.70 (-3.69) -0.61 (-1.41) -5.49 (-3.52) -0.63 (-1.46) Earnings Constraint + 0.11 ( 0.32) 0.18* ( 1.83) 0.12 ( 0.34) 0.19* ( 1.87) High Tax - -0.79* (-1.79) 0.00 ( 0.03) -0.79* (-1.76) 0.00 ( 0.02) Low Tax + 1.46*** ( 3.80) -0.06 (-0.46) 1.41*** ( 3.67) -0.08 (-0.63) CAPINT - -3.42*** (-5.58) -1.22*** (-6.39) -3.32*** (-5.43) -1.20*** (-6.29) MVA + 1.08*** ( 4.85) 0.97*** (17.58) 1.07*** ( 4.79) 0.97*** (17.54) BM - -3.98*** (-3.92) 0.61* ( 2.37) -4.03*** (-3.98) 0.61** ( 2.35) Number of Obs. 7,709 7,709 7,709 7,709 R2 0.47 0.49 0.47 0.49 *** p<1%, **p<5%, *p<10, two-sided p-values Where, Unvested Equity Holdings is the sum of the Black-Scholes value of Unvested Stock Option holdings and the value of Restricted Stock holdings (million); Total compensation is total annual compensation (million); RDI is cumulative R&D investments (15% amortization) scaled by total assets; IP, COMPL and RESTRICT are standardized measures of firms reliance on respectively intellectual property rights, complementary resources and restricting information leakage. AGE is a CEO’s age in years; TENURE is the natural logarithm of the number of years since executive became CEO; NONCOMPETE is the state non-compete enforceability index constructed by Garmaise (2007); PERFORMANCE is firms’ three-year industry adjusted stock returns; Wealth Incentives is natural logarithm of the change in the dollar value of executives’ equity holdings due to a 1% change in stock price; Risk Incentives is natural logarithm of the change in the dollar value of executives’ stock option holdings due to a 1% increase in the standard deviation of firms’ stock returns; Total CASHCOMP is the sum of annual salary and bonus (million); CashShortFall is the 3-year average of [(common and preferred dividends+cash flow used in investing activities–cash flow from operations) /total assets]; EARNINGSCONSTRAINT is equal to 1 if in any of the prior three years (retained earnings+cash dividends and stock repurchases)/(the prior year’s cash dividends and stock repurchases)<2 or the denominator is zero for all three preceding years, zero otherwise; LowTax=1 when firms have negative pretax income and net operating-loss carry-forwards, zero otherwise; HighTax=1 when firms have positive pretax income and no net operating-loss carry-forwards, zero otherwise; CAPINT is PP&E scaled by total assets; MVA is the natural logarithm of the sum of market value of equity and total liabilities; BM is total assets/(market value of equity + total liabilities). Coefficients on intercept and 12 YEAR dummy variables not shown. All dollar denominated variables are CPI-adjusted to 1992 dollars.
40
Table 3: Descriptive statistics of R&D Related Executives’ Equity and Pay Slice by industry group
Where, Equity Slice is the percentage of aggregate top-four non-CEO executive unvested equity holdings captured by R&D related executives; Pay Slice is the percentage of aggregate top-four non-CEO total compensation captured by R&D related executives; RDI is cumulative R&D investments (15% amortization) scaled by total assets; IP, COMPL and RESTRICT are standardized measures of firms reliance on respectively intellectual property rights, complementary resources and restricting information leakage.
41
Table 4 Determinants of R&D related executives’ Equity and Pay Slice Model 2A Model 2B
Where, Equity Slice is the percentage of aggregate top-four non-CEO executive unvested holdings (Black-Scholes value of Unvested Stock Options + Restricted Stock) captured by R&D related executives; Pay Slice the percentage of aggregate top-four non-CEO executive total pay captured by R&D related executives; RDI is cumulative R&D investments (15% amortization) scaled by total assets; IP, COMPL and RESTRICT are standardized measures of firms reliance on respectively intellectual property rights, complementary resources and restricting information leakage; NONCOMPETE is the state non-compete enforceability index constructed by Garmaise (2007); PERFORMANCE is firms’ three-year industry adjusted stock returns; CAPINT is PP&E scaled by total assets; MVA is the natural log of the sum of market value of equity and total liabilities; and BM is total assets/(market value of equity+total liabilities). Coefficients on intercept and 12 YEAR dummy variables not shown. All dollar denominated variables are CPI-adjusted to 1992 dollars.
42
Table 5: Descriptive statistics of Nonexecutive Employee Option Grants by industry group
Where, Nonexecutive Employee Option Grant is the Black-Scholes value of option grants to nonexecutive employees scaled by total number of employees (thousands); RDI is cumulative R&D investments (15% amortization) scaled by total assets; IP, COMPL and RESTRICT are standardized measures of firms reliance on respectively intellectual property rights, complementary resources and restricting information leakage.
43
Table 6 Determinants of Nonexecutive Employee Option Grants Model 3A Model 3B
Pred. Sign
(1) Nonexecutive
Employee Option Grants
(2) Nonexecutive
Employee Option Grants
Explanatory Variable Β (t-stat) β (t-stat)RDI + 17.46*** ( 8.37) -1.83 (-0.37)IP - -5.92*** (-3.37) -3.98** (-2.15)COMPL - -5.63*** (-4.68) -4.98*** (-4.27)RESTRICT + 9.93*** ( 5.77) 4.69*** ( 2.88)RDI*IP - -9.46 (-1.22)RDI*COMPL - -36.71*** (-3.35)RDI*RESTRICT + 65.07*** ( 5.41)NONCOMPETE - -0.93*** (-4.57) -0.88*** (-4.41)PERFORMANCE + 4.14*** ( 5.73) 4.06*** ( 5.67)Cash Flow Short Fall + -12.56 (-3.62) -12.94 (-3.82)Earnings Constraint + 3.96*** ( 5.30) 3.93*** ( 5.29)High Tax - -1.05* (-1.86) -1.06* (-1.90)Low Tax + 3.44*** ( 2.78) 3.17*** ( 2.58)CAPINT - -10.15*** (-8.92) -10.01*** (-8.93)MVA - 0.16 ( 0.80) 0.08 ( 0.39)BM - -9.97*** (-6.70) -10.11*** (-6.96)Number of Obs. 6,477 6,477 R2 0.36 0.37 *** p<1%, **p<5%, *p<10, one-sided p-values Where, Nonexecutive Employee Option Grants is the Black-Scholes value of option grants to nonexecutive employees scaled by the total number of employees (thousand); RDI is cumulative R&D investments (15% amortization) scaled by total assets; IP, COMPL and RESTRICT are standardized measures of firms reliance on respectively intellectual property rights, complementary resources and restricting information leakage; NONCOMPETE is the state non-compete enforceability index constructed by Garmaise (2007); PERFORMANCE is firms’ three-year industry adjusted stock returns; CashShortFall is the 3-year average of [(common and preferred dividends+cash flow used in investing activities–cash flow from operations) /total assets]; EARNINGSCONSTRAINT is equal to 1 if in any of the prior three years (retained earnings+cash dividends and stock repurchases)/(the prior year’s cash dividends and stock repurchases)<2 or the denominator is zero for all three preceding years, zero otherwise; LowTax=1 when firms have negative pretax income and net operating-loss carry-forwards, zero otherwise; HighTax=1 when firms have positive pretax income and no net operating-loss carry-forwards, zero otherwise; CAPINT is PP&E scaled by total assets; MVA is the natural logarithm of the sum of market value of equity and total liabilities; BM is total assets/(market value of equity + total liabilities). Coefficients on intercept and 12 YEAR dummy variables not shown. All dollar denominated variables are CPI-adjusted to 1992 dollars.
44
Table 7 Determinants of CEO compensation (with adjustment for simultaneity bias) Model 1A Model 1B
Hausman test (F/p-value) 6.10 0.01 0.74 0.39 10.12 0.04 13.52 0.01 *** p<1%, **p<5%, *p<10, two-sided p-values Where, Unvested Equity Holdings is the sum of the Black-Scholes value of Unvested Stock Option holdings and the value of Restricted Stock holdings (million); Total Compensation is total annual compensation (million); RDI is cumulative R&D investments (15% amortization) scaled by total assets; IP, COMPL and RESTRICT are standardized measures of firms reliance on respectively intellectual property rights, complementary resources and restricting information leakage. AGE is a CEO’s age in years; TENURE is the natural logarithm of the number of years since executive became CEO; NONCOMPETE is the state non-compete enforceability index constructed by Garmaise (2007); PERFORMANCE is firms’ three-year industry adjusted stock returns; Wealth Incentives is natural logarithm of the change in the dollar value of executives’ equity holdings due to a 1% change in stock price; Risk Incentives is natural logarithm of the change in the dollar value of executives’ stock option holdings due to a 1% increase in the standard deviation of firms’ stock returns; Total CASHCOMP is the sum of annual salary and bonus (million); CashShortFall is the 3-year average of [(common and preferred dividends+cash flow used in investing activities–cash flow from operations) /total assets]; EARNINGSCONSTRAINT is equal to 1 if in any of the prior three years (retained earnings+cash dividends and stock repurchases)/(the prior year’s cash dividends and stock repurchases)<2 or the denominator is zero for all three preceding years, zero otherwise; LowTax=1 when firms have negative pretax income and net operating-loss carry-forwards, zero otherwise; HighTax=1 when firms have positive pretax income and no net operating-loss carry-forwards, zero otherwise; CAPINT is PP&E scaled by total assets; MVA is the natural log of the sum of market value of equity and total liabilities; BM is total assets/(market value of equity + total liabilities). Coefficients on intercept and 12 YEAR dummy variables not shown. All dollar denominated variables are CPI-adjusted to 1992 dollars.
45
Table 8 R&D related executives’ Equity and Pay Slice (with adjustment for selection bias) Model 2B
Inverse Mills-Ratio -0.03 -0.02*** (-1.40) (-3.03) Wald Test χ2/p-value 2.03 0.15 10.24 0.00 Pseudo R2 0.15 0.15 Number of Obs. 7,718 7,762 ***p<1%, **p<5%, *p<10, two-sided p-values Where, Equity Slice is the percentage of aggregate top-four non-CEO executive unvested holdings (Black-Scholes value of Unvested Stock Options + Restricted Stock) captured by R&D related executives; Pay Slice the percentage of aggregate top-four non-CEO executive total pay captured by R&D related executives; RDI is cumulative R&D investments (15% amortization) scaled by total assets; IP, COMPL and RESTRICT are standardized measures of firms reliance on respectively intellectual property rights, complementary resources and restricting information leakage; NONCOMPETE is the state non-compete enforceability index constructed by Garmaise (2007); PERFORMANCE is firms’ three-year industry adjusted stock returns; CAPINT is PP&E scaled by total assets; MVA is the natural logarithm of the sum of market value of equity and total liabilities; and BM is total assets/(market value of equity+total liabilities); NSEGMENTS is the number of business segments a firm has. Coefficients on intercept and 12 YEAR dummy variables not shown. All dollar denominated variables are CPI-adjusted to 1992 dollars.