a Department of Immunology, National Institute for Research in Tuberculosis (ICMR), (Formerly Tuberculosis Research Centre), No. 1,Mayor Sathiyamoorthy Road, Chetpet, Chennai 600 031, Indiab Department of Molecular Reproduction, Development and Genetics Biological Sciences Building, Indian Institute of Science, Bangalore 560 012, India
a r t i c l e i n f o
Article history:Received 24 February 2015Received in revised form 16 April 2015Accepted 23 April 2015Available online 19 May 2015
Mycobacterium tuberculosis has the ability to persist within the host in a dormant stage. One importantcondition believed to contribute to dormancy is reduced access to oxygen known as hypoxia. However,the response of M. tuberculosis to such hypoxia condition is not fully characterized. Virtually all dormantmodels against tuberculosis tested in animals used laboratory strain H37Rv or Erdman strain. But majoroutbreaks of tuberculosis (TB) occur with the strains that have widely different genotypes and phenotypescompared to H37Rv. In this study, we used a custom oligonucleotide microarray to determine the overalltranscriptional response of laboratory strain (H37Rv) and most prevalent clinical strains (S7 and S10) ofM. tuberculosis from South India to hypoxia. Analysis of microarray results revealed that a total of 1161genes were differentially regulated (≥1.5 fold change) in H37Rv, among them 659 genes upregulatedand 502 genes down regulated. Microarray data of clinical isolates showed that a total of 790 geneswere differentially regulated in S7 among which 453 genes were upregulated and 337 down regulated.Interestingly, numerous genes were also differentially regulated in S10 (total 2805 genes) of which 1463genes upregulated and 1342 genes down regulated during reduced oxygen condition (Wayne’s model).One hundred and thirty-four genes were found common and upregulated among all three strains (H37Rv,S7, and S10) and can be targeted for drug/vaccine development against TB.
The major obstacle for the control of tuberculosis is the abil-ity of Mycobacterium tuberculosis to persist in human tissuesdespite host immune containment and is considered to be a keymechanism to the pathogenic success of M. tuberculosis (Shermanet al., 2001). The events involved in the establishment of latentinfection with M. tuberculosis are not completely understood. Anumber of studies have identified oxygen deprivation as a poten-tial stimulus for triggering the transition of M. tuberculosis toa non-replicating persistent state analogous to latency in vivo(Klinkenberg and Karakousis, 2013). Wayne and Hayes (1996) have
Abbreviations: RvD, anaerobic culture of H37Rv; S7D, anaerobic culture of S7;S10D, anaerobic culture of S10D.
∗ Corresponding address. National Institute for Research in Tuberculosis (ICMR),(Formerly Tuberculosis Research Centre) No.1, Sathiyamoorthy Road, Chetpet,Chennai - 600 031, India. Tel.: +91 44 2836 9682; fax: +91 44 2836 2528.
conducted pioneering studies on the dormant state of M. tuberculo-sis that culminated in the development of the in vitro Wayne modelof persistence. In this model, M. tuberculosis cultures are subjectedto self-generated oxygen depletion in sealed containers. Growthunder such conditions leads to a physiologically well defined anaer-obic non replicating state of the bacilli. This ability to shift-down tonon replicating state is responsible for the ability of tubercle bacillito lie dormant in the host for long periods of time, with the capacityto revive and activate disease at a later time. This dormant state ofthe bacilli is resistant to the anti-mycobacterial drugs and hampersthe treatment of tuberculosis.
Several lines of evidence have supported the fact that slight dif-ferences found in the genome sequence of M. tuberculosis strains,the physiology and host range spectrum will differ and may causedistinctive adaptive responses to changes in environmental con-ditions (Rehren et al., 2007). The presence of significant sequencediversity in M. tuberculosis would provide a basis for understand-ing pathogenesis, immune mechanisms, and bacterial evolution.To date, numerous hypoxia models of persistence is limited by theuse of H37Rv as the single reference strain (Rustad et al., 2008).
S. Devasundaram et al. / Journal of Biotechnology 210 (2015) 70–80 71
Only limited work has been carried out with most prevalent clinicalstrains under hypoxia.
Restriction fragment length polymorphism studies in BCG trialarea of Tiruvallur district, Tamil Nadu showed that 40% of M. tuber-culosis strains from South India contain a single copy of the IS6110insertion sequence in their genomic DNA (Das et al., 1995). Earlierepidemiological studies showed the predominance of IS6110 singlecopy strains of M. tuberculosis and their involvement in active trans-mission of the disease (Narayanan et al., 2002). Further screeningof these predominant strains with protein profiling and humoralimmune responses revealed that two strains, namely S7 and S10acted distinctly. Strain S7 was able to induce Th-2 response whilestrain S10 induced potent T-cell proliferation and IFN-� secretion(Rajavelu and Das, 2005). Further it was found that these two strainsadopted different modes of survival strategies and infection inmacrophages. Though both strains exhibited low phagocytic index,S7 induced minimal apoptosis whereas S10 induced higher rateof apoptosis in macrophages (Rajavelu et al., 2007). These resultsindicate differential mode of infection and their adaptation to dif-ferent survival strategies that may lead to immune suppression andpathogenesis of the disease. These factors attracted us to selectS7 and S10, from other clinical isolates, to study gene regulationmechanism under depleted oxygen condition by adopting Wayne’smodel (Wayne and Hayes, 1996).
Adaptation of M. tuberculosis to environmental changes in thecourse of infection is likely mediated by differential gene expres-sion. Whole-genome microarray technology is a robust tool used todetermine expression of many genes simultaneously in M. tubercu-losis in response to changing environmental conditions (Wei et al.,2013). In this work, we used microarray hybridization to com-pare the total in vitro transcriptomes of H37Rv, S7, and S10 underoxygen depleted culture conditions with aerated cultures of same.Our aim is to provide an overview of gene expression variabilityamong these strains under oxygen deficient conditions, as a meansto identify dormancy associated genes. Genes, whose expression isaltered when grown under different growth conditions, reveal theirspecific role under the condition tested with which drug targetsand vaccines can be designed with its encoded antigens. We used60-mer oligonucleotide genome set (Agilent Technologies, USA),representing all open reading frames (ORFs) of re-annotated H37Rvgenome sequencing project (Camus et al., 2002). Microarray wasperformed with an objective to identify genes that are found to bedifferentially regulated during hypoxia and this could shed light ongenes that are important for bacterial persistence mechanisms.
2. Methods
2.1. Culture conditions
The M. tuberculosis laboratory strain H37Rv (ATCC 27294),obtained from Colorado State university, USA and clinical strainsS7 and S10 were obtained during the Model Dots study conductedat the BGC trial area of Tiruvallur District (Das et al., 1995) and main-tained as glycerol stocks. Aerated cultures of H37Rv, clinical isolatesS7 and S10 were grown in Middlebrook 7H9 media supplementedwith 2% (v/v) glycerol, 10% albumin–dextrose–catalase (ADC) and0.05% (v/v) Tween 80 at 37 ◦C, 200 rpm for 25–30 days. Mycobacte-rial culture method, oxygen depletion, termination, and pelleting ofthe cultures were followed as described (Wayne and Hayes, 1996).Briefly, laboratory strain H37Rv and clinical isolates S7 and S10were inoculated in screw capped test tubes (20 mm × 125 mm, witha total fluid capacity of 25.5 ml) containing supplemented MB7H9.Stirring was achieved with 8-mm Teflon-coated magnetic stirringbars in the tubes (120 rpm) and incubated at 37 ◦C. This gentlestirring keeps the cultures in uniform dispersion and controls the
rate of O2 depletion. To assess the O2 depletion, sterile solution ofmethylene blue was added in the medium to yield a dye final con-centration of 1.5 �g ml−1. Reduction and decolorization of this dyeserved as a visual indication of oxygen depletion. The cells werepelleted from triplicate cultures, by centrifugation at 2000 × g for5 min and frozen on dry ice.
2.2. RNA isolation from aerobic and anaerobic cultures of H37Rv,S7, and S10
Cell pellets (107 bacterial cells) were suspended in 1 ml Tri-zol reagent (Sigma–Aldrich, USA) and transferred to 2-ml screwcap tubes containing 0.5 ml of 0.1 mm diameter zirconia/silicabeads (BioSpec Products, USA). Three 30-s pulses in a bead beaterdisrupted the cells. Cell debris was separated by centrifugationfor 1 min at 16,000 × g. The supernatant was transferred to 2-mlmicro centrifuge tube containing 300 �l chloroform:isoamyl alco-hol (24:1), inverted rapidly for 15 s, and incubated 2 min at roomtemperature. Samples were centrifuged for 5 min and the aqueousphase was precipitated using 2.5 volume of isopropanol and 1/10thvolume of 3 M sodium acetate. Samples were incubated 10 min atroom temperature and centrifuged for 15 min at 4 ◦C. The RNA pel-lets were washed with 1 ml 75% ethanol, centrifuged 5 min, air driedand resuspended with RNase free water. Final purification of RNAwas by RNeasy columns (Qiagen, USA). RNA quality was assessedby measuring the ratio of absorbance of total RNA at 260/280 and260/230 nm. RNA preparations that showed ratio of ≥2 at A260/280were only included for cDNA preparation. Further, integrity of RNAwas also determined on a MOPS-formaldehyde denaturing agarosegel.
2.3. cDNA synthesis, cRNA labelling, and microarrayhybridization
For cDNA synthesis Low Input Quick Amp Labeling WTkit (Agilent Technologies, USA) was used. This kit uses cDNAmaster mix containing Affinity Script reverse transcriptase, a genetically engineered, highly thermostable version ofMoloney Murine Leukemia Virus Reverse Transcriptase (MMLV-RT), for reverse transcription reaction. Briefly, 2 �g of RNA fromeach sample was incubated with WT primers according to manu-facturer instruction (Low Input Quick Amp Labeling WT kit, AgilentTechnologies, USA) for 10 min at 65 ◦C, cooled on ice, combinedwith 5× standard buffer, 0.1 M DTT, 10 mM dNTP, and RNase blockmix to the final volume of 4.7 �l. This mixture was incubated for2 h at 40 ◦C.
Synthesized cDNAs were converted to cRNA by T7 polymerasetranscription master mix (Low Input Quick Amp Labeling WTkit, Agilent Technologies, USA) containing 5× transcription buffer,0.1 M DTT, NTP, T7 polymerase and labelled with Cy3-CTP (aer-obic cultures of H37Rv, S7, S10) or Cy5-CTP (anaerobic culturesof H37Rv, S7, S10) and incubated for 2 h at 40 ◦C. Purification ofcRNAs was carried by Qiagen’s RNeasy mini kit. Labelling wasdetected and quantified using Nanodrop ND-1000 UV–Vis Spec-trophotomer as given in the Low Input Quick Amp Labeling WTkit, Agilent Technologies, USA. Labelled cRNA was also checkedon 1% Agarose gel and scanned using the Typhoon 9210 scanner(GE Life Sciences). Samples with higher labelling efficiency (Spe-cific activity ≥ 15) were selected for competitive hybridization asper the Agilent protocol.
A 60mer oligonucleotide based custom array chip was usedfrom Agilent Technologies in 8 × 15 K format. 300 ng of Cy5 labelledcRNA from anaerobic cultures of H37Rv, S7, and S10 was hybridizedagainst 300 ng Cy3 labelled cRNA from aerobic cultures of H37Rv,S7, and S10. Hybridization was done for 17 h, 10 rpm at 65 ◦C.
72 S. Devasundaram et al. / Journal of Biotechnology 210 (2015) 70–80
Following image analysis, feature extraction was performed usingFeature extraction tool version 9.5.3.1 (Agilent Technologies, USA).
2.4. Microarray data analysis
Microarray data analysis was performed by R-BioconductorLIMMA package. The background-corrected raw intensity valueswere used for analysis. LOWESS algorithm was used to normal-ize the data and fold change (Fc) was calculated based on theratio of Cy5/Cy3 (anaerobic/aerobic) intensities. For statistical anal-ysis, Student’s t-test against zero was performed using BenjaminiHochberg multiple testing correction. Hierarchical cluster was doneby Mev4.1 using Pearson correlation method. The data was clus-tered by averaged linkage. Adjusted p-value cut-off of 0.05 andfold change of ≥1.5 was used for identifying differentially regu-lated genes. Gene expression data are deposited into GEO database(GEO accession no: GPL18248).
A 2 �g of the total RNA extracted from both aerobic and anaero-bic cultures of H37Rv, S7, and S10 was reverse transcribed usinga High Capacity cDNA synthesis kit (Applied Biosystems, USA)and 20 ng of cDNA was used per 20 �l PCR reactions. Quantitativereal-time RT-PCRs were performed in triplicate using DynamoTM
SYBRgreen 2× mix kit (Finnzymes, Finland). Real time PCR quan-titations were performed in ABI Prism 7000 sequence detectionsystem and analysed with SDS 2.1 software (Applied Biosystems,USA). Relative expression levels were calculated using the 16s rRNAtranscript as normalizing internal control.
3. Results
3.1. Growth and gene expression pattern in H37Rv, S7, and S10under oxygen depletion
Anaerobic cultures of H37Rv is denoted as “RvD” in the text andfor the clinical isolates S7 and S10 it is denoted as “S7D” and “S10D”,respectively. Aerobic cultures are depicted as “Rv” for H37Rv, “S7”and “S10” for clinical isolates in the text. Rapid growth was seen inaerobic cultures where bacilli entered into log phase on day 12 andgrowth was stabilized on day 21. But in anaerobic cultures growthwere stabilized from day 14 in all three strains (data not shown) andthere were no significant differences found in growth pattern aswell methylene blue decolorization among these strains. At inter-vals, tubes from anaerobic cultures were checked for methyleneblue indicator decolorization. Gradual decolorization of methy-lene blue was observed, with all cultures, during the incubation at120 rpm, 37 ◦C and completed decolorization was obtained by day25. No decolorization of methylene blue dye in the blank tube wasobserved, as no inoculum was introduced and it remained in thesame color till 25–30 days (Fig. 1). These findings were in agreementwith the earlier observations (Wayne and Hayes, 1996).
Our main focus was to sort common regulated genes betweenH37Rv, S7, and S10 clinical strain (H37Rv vs S7 vs S10), followed bygenes that are shared by H37Rv with either of the clinical isolates(H37Rv vs S7 or H37Rv vs S10) were predicted.
Variable gene expression to single environmental factor wasobserved between the strains of same organisms. Thus identifyingthe set of genes whose expression levels are less variable betweenthe strains is vital to develop the drugs or vaccines. To identify theupregulated genes, we set up a threshold value of 1.5 fold change,rather than the levels of changes (individual expression values),for each gene. Gene expressions above the threshold value wereconsidered as highly expressed. Total numbers of genes that weredifferentially regulated in H37Rv, S7, and S10 during hypoxia is
given in Fig. 2. Out of 3951 genes tested, in custom array chip, 15.6%of genes in H37Rv were overexpressed under oxygen depletion,whereas in S7 11.5% genes were upregulated; surprisingly in S10the percentage of genes that responded to hypoxia was higher thanother two strains (37%). Approximately 13% (12.7%) genes in H37Rvwere under expressed while in S7 and S10 8.2% and 29.8% of geneswere down regulated under hypoxia, respectively. Among all threestrains compared, S10 was having more responding gene counter-part, under Wayne’s dormancy model, than other two strains.
3.2. Expressed genes and their functional classes under oxygendepletion in H37Rv, S7, and S10
Out of all the differentially expressed genes, based on the meanexpression of triplicate arrays 134 genes (p ≤ 0.05 and ≥1.5 fold)were found to be common and upregulated among all three strainsduring hypoxia as compared to aerobic cultures (Table 1, Fig. 3). Outof 134 genes, that showed significant response to oxygen depletion,most were classified as genes involved in transport and bindingproteins (11.2%), fatty acid and phospholipid metabolism (5.2%),purines, pyrimidines, nucleosides, and nucleotides conversions(3%), cell envelope (10.4%), energy metabolism (11%), unknownfunction (6%), mobile and extrachromosomal element functions(2.3%), unclassified (25.3%), cellular process (5.2%), biosynthe-sis of cofactors, prosthetic groups, and carriers (2.9%), conservedhypothetical proteins (13.4%), intermediary metabolism and tran-scription genes (0.74%), hypothetical proteins and regulatoryproteins (3%), protein fate (3%), DNA metabolism (2.2%) (Fig. 4).
In addition to 134 common genes, 12 genes were found tobe shared only between S7 and H37Rv but not with S10. These12 genes were categorized under amino acid synthesis (Rv2499c)and protein synthesis (Rv0041), conserved hypothetical protein(Rv1775) and regulatory functions (Rv3058c). Four genes (Rv1079,Rv1305, Rv1625c, and Rv3154) were categorized under “unclas-sified genes” and two genes with unknown functions (Rv0637,Rv1301). Interestingly Rv1920 is categorized under both cell enve-lope and fatty acid phospholipid metabolism and Rv3828c plays arole in DNA metabolism and Mobile and extrachromosomal ele-ment functions (Table 2).
S10 shared 367 genes exclusively with H37Rv, in addition to 134genes, that are upregulated under the oxygen depletion. Among367 genes, higher percentage (14.3%) of genes are found to be cellenvelope genes followed by transport and binding genes (13.3%),amino acid biosynthesis (11.7%), central intermediary metabolism(11.3%) (Data not shown).
3.3. Operons that are expressed
Operons are the most basic units of organization in bacterialgenomes, and they provide the basis for understanding transcrip-tional regulation and the entire regulatory network of an organism.
Based on intergenic distance between two genes andexpression levels, 7 putative operons, common amongH37Rv, S7, and S10, were predicted from our study. Theyare Rv0212c–Rv02123c, Rv0347–Rv0349, Rv0501–Rv0502,Rv1304–Rv1308, Rv2266–Rv2268c, Rv2949c–Rv2951c, andRv3821–Rv3825c and found to be upregulated during hypoxia inall three strains used in this study. The proximity and orientationof these ORFs to each other, as well as the high level of expressionwith respect to the rest of the genome, strongly suggest that thesegenes form an operon. Intergenic distance between two genes wascalculated by subtracting the ending nucleotide location on thegenome of the first gene from the beginning nucleotide locationon the genome of the second gene.
The well characterized MosR (regulator of mycobacterial oper-ons of survival) operon includes Rv0347–Rv0348–Rv0349. Genes
S. Devasundaram et al. / Journal of Biotechnology 210 (2015) 70–80 73
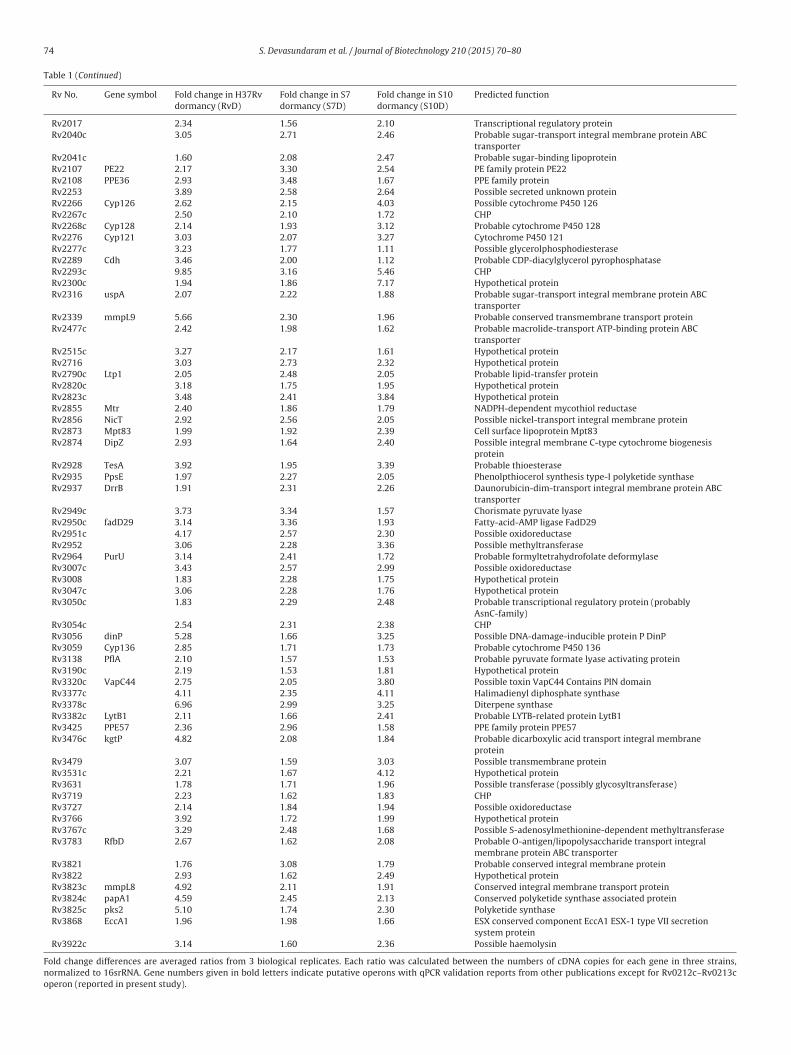
Table 1Genes that are commonly upregulated during hypoxia in H37Rv (lab strain) and clinical strains (S7 and S10).
Rv No. Gene symbol Fold change in H37Rvdormancy (RvD)
Fold change in S7dormancy (S7D)
Fold change in S10dormancy (S10D)
Predicted function
Rv0011c 2.47 2.15 2.51 Probable conserved transmembrane proteinRv0067c 2.18 1.51 1.84 Possible transcriptional regulatory protein (possibly
AsnC-family)Rv3054c 2.54 2.31 2.38 CHPRv3056 dinP 5.28 1.66 3.25 Possible DNA-damage-inducible protein P DinPRv3059 Cyp136 2.85 1.71 1.73 Probable cytochrome P450 136Rv3138 PflA 2.10 1.57 1.53 Probable pyruvate formate lyase activating proteinRv3190c 2.19 1.53 1.81 Hypothetical proteinRv3320c VapC44 2.75 2.05 3.80 Possible toxin VapC44 Contains PIN domainRv3377c 4.11 2.35 4.11 Halimadienyl diphosphate synthaseRv3378c 6.96 2.99 3.25 Diterpene synthaseRv3382c LytB1 2.11 1.66 2.41 Probable LYTB-related protein LytB1Rv3425 PPE57 2.36 2.96 1.58 PPE family protein PPE57Rv3476c kgtP 4.82 2.08 1.84 Probable dicarboxylic acid transport integral membrane
proteinRv3479 3.07 1.59 3.03 Possible transmembrane proteinRv3531c 2.21 1.67 4.12 Hypothetical proteinRv3631 1.78 1.71 1.96 Possible transferase (possibly glycosyltransferase)Rv3719 2.23 1.62 1.83 CHPRv3727 2.14 1.84 1.94 Possible oxidoreductaseRv3766 3.92 1.72 1.99 Hypothetical proteinRv3767c 3.29 2.48 1.68 Possible S-adenosylmethionine-dependent methyltransferaseRv3783 RfbD 2.67 1.62 2.08 Probable O-antigen/lipopolysaccharide transport integral
membrane protein ABC transporterRv3821 1.76 3.08 1.79 Probable conserved integral membrane proteinRv3822 2.93 1.62 2.49 Hypothetical proteinRv3823c mmpL8 4.92 2.11 1.91 Conserved integral membrane transport proteinRv3824c papA1 4.59 2.45 2.13 Conserved polyketide synthase associated proteinRv3825c pks2 5.10 1.74 2.30 Polyketide synthaseRv3868 EccA1 1.96 1.98 1.66 ESX conserved component EccA1 ESX-1 type VII secretion
system proteinRv3922c 3.14 1.60 2.36 Possible haemolysin
Fold change differences are averaged ratios from 3 biological replicates. Each ratio was calculated between the numbers of cDNA copies for each gene in three strains,normalized to 16srRNA. Gene numbers given in bold letters indicate putative operons with qPCR validation reports from other publications except for Rv0212c–Rv0213coperon (reported in present study).
S. Devasundaram et al. / Journal of Biotechnology 210 (2015) 70–80 75
Fig. 1. Decolorization of methylene blue indicator from anaerobic cultures of H37Rv, S7, and S10 strains of M. tuberculosis. (a) Day 1 inoculation of laboratory strain H37Rv(Rv) and clinical strains S7 and S10, B indicates Blank. Methylene blue, redox indicator, was added to all the tubes. (b) Decolorization, in all three strains, indicated oxygendepletion in the media and bacteria were able to adapt oxygen deficient condition. In Blank, no decolorization occurred as there was no inoculum introduced, thus no oxygendepletion occurred.
Fig. 2. Venn diagram representation of differentially regulated genes during hypoxia. (a) No. of genes that are expressed greater than 1.5 fold during hypoxia. (b) No. ofgenes that are suppressed greater than 1.5 fold during hypoxia. Venn diagram representation of the genes found to be differentially regulated during oxygen depletion inMycobacterium tuberculosis lab strain H37Rv and south India prevalent strain S7 and S10. (a) and (b) Venn diagram are plotted for up and down regulated genes, respectively.
of this operon were identified to be upregulated during hypoxiafrom all three strains of our study. MosR has the ability to bindto its promoter (Rv0347) and control few other operons includingRv2948c–Rv2950c (Abomoelak et al., 2009). Genes of this operon(except Rv2948c) are also found to be upregulated from our obser-vation.
F0 ATP synthase operon comprises of atpB, atpE, and atpF genesand the F1ATP synthase operon contains atpH, atpA, atpG, atpD,
and atpC genes. Upregulation of atpB and atpF of F0 ATP synthaseoperon and atpH, atpA of F1ATP synthase operon were observedduring hypoxia from H37Rv, S7, and S10 strains. Their expressionwas equal (∼2 fold change) in all three strains of our study exceptfor atpH in S7 clinical isolates (4.8 fold change).
Based on the arrangement and expression levels duringoxygen depletion, Rv0212c–Rv0213c forms a transcriptionalunit (operon). Special attention was given to transcriptional
Table 2Genes that are over expressed (1.5 fold change) and shared only by H37Rv and S7.
Rv No. Gene symbol Fold change in H37Rvdormancy (RvD)
Fold change differences are averaged ratios from 3 biological replicates of H37Rv and S7 strains. Each ratio was calculated between the numbers of cDNA copies for eachgene in between these two strains, normalized to 16srRNA.
76 S. Devasundaram et al. / Journal of Biotechnology 210 (2015) 70–80
Fig. 3. Hierarchical clustering of commonly regulated genes among different strains of Mycobecterium upon oxygen deprivation. Hierarchical clustering of commonlyregulated genes (134) found to be differentially expressed during the adaptation to oxygen-depleted NRP in M. tuberculosis stains H37Rv, S7, and S10 (p ≤ 0.05 and ≥1.5 fold).Microarray experiments were carried in triplicates for each samples and based on the mean expression of triplicates, gene were categorized as upregulated. Red color in heatmap indicates induced genes, green indicates repressed genes, and black indicates no change in gene expression. (For interpretation of the references to colour in this figurelegend, the reader is referred to the web version of the article.)
regulators as they play a crucial role in the survival of themycobacteria. Quantitative real time PCR (qPCR) was used todetermine Rv0212c–Rv0213c transcript levels from the iso-lated RNA of anaerobic cultures of H37Rv, S7, and S10 strains.There was a good correlation between the expression levels
of microarray and qPCR with Rv0212c–Rv0213c transcript(Fig. 5).
The next operon which was expressed in all three strains wasRv3821–Rv3822 which encodes Chp1 and Sap proteins, that com-pletes the sulfolipid biosynthesis (SL-1) pathway of M. tuberculosis.
S. Devasundaram et al. / Journal of Biotechnology 210 (2015) 70–80 77
Fig. 4. Genes that are overexpressed >1.5 fold change and their role categories. Genes which showed a significant response to hypoxia were classified based on theirbiological role. Higher percentage of the genes in H37Rv is categorized into transport and binding proteins followed by fatty acid and phospholipid metabolism and cellenvelope proteins. Genes of transcription and fatty acid and phospholipid metabolism was found to be expressed higher in S7 clinical strains during hypoxia. In S10 clinicalstrain, transport and binding proteins, cell envelope proteins, and energy metabolism genes forms the major category of upregulated genes under hypoxia.
Fig. 5. Genomic organization and real-time RT-PCR results of Rv0212c (nadR) to Rv0213c. (a) Schematic representation of the arrangement of ORFs Rv0212c to Rv0213c inthe M. tuberculosis H37Rv genome. The arrows indicate the lengths and transcriptional orientations of annotated genes and predicted ORFs. (b) Real-time RT-PCR (qPCR)was performed on RNA isolated from anaerobic cultures of H37Rv, S7, and S10D and aerated cultures of the same strains. Data are presented as the mean fold change ofexpression ± standard deviation for each gene.
This putative operon was reported earlier by Seeliger et al. (2012)but its expression under hypoxia was not reported by any otherearlier studies. Thus, we consider our result is the first report onexpression of this operon under hypoxia and their expressions inthe clinical isolates make them an important target to explore thebiology of dormancy.
3.4. Genes of hypoxia
To identify previously reported hypoxic genes of mycobacteria,we compared our gene expression data with existing reports ofoxygen depletion model. Total of 24 reported hypoxic genes wereidentified upon comparing only H37Rv gene expression data of ourresults. Among these 24 genes, 5 genes (Rv0096, Rv1130, Rv1518,Rv1964, and Rv2386c) were listed in, 77 significantly inducedgenes, microarray of H37Rv under low oxygen state (Bacon et al.,2004). Rv1130, 2-methylcitrate hydratase, is associated with pro-pionate metabolism and previously identified as induced duringmacrophage infection and in SDS treatment (Schnappinger et al.,
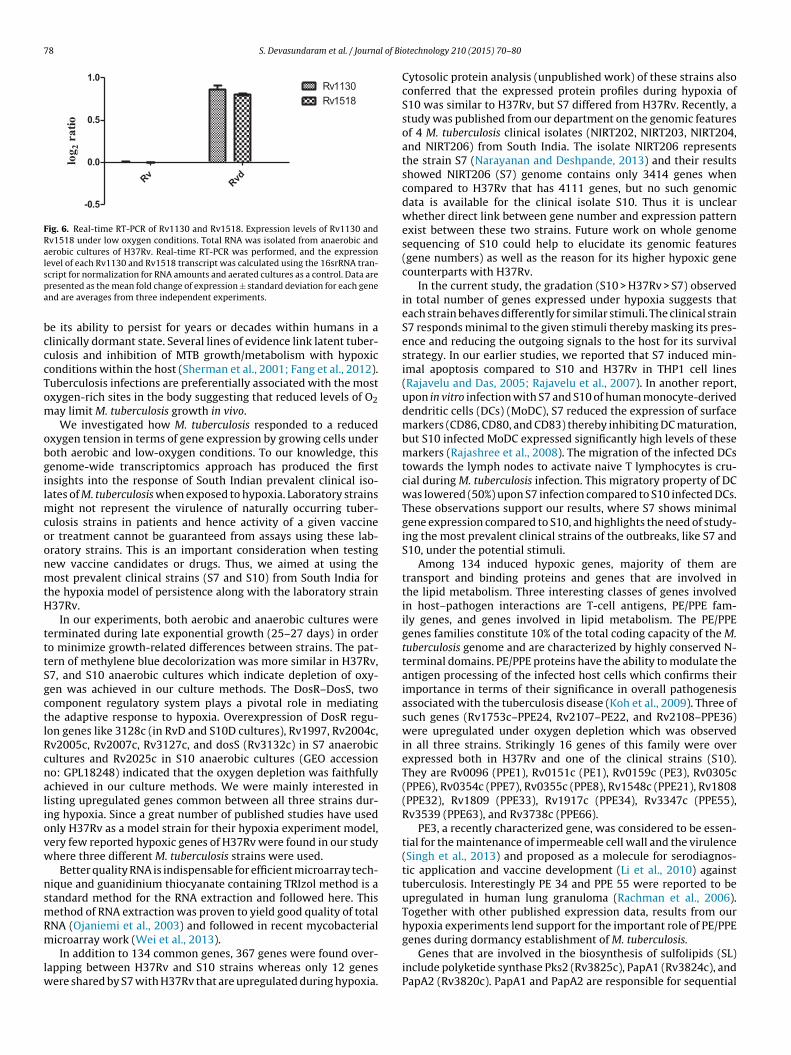
2003). Rv1130 and Rv1518 transcript levels were also checked byRT-PCR and were found to be upregulated 1.81 fold and 1.74 fold,respectively (Fig. 6).
Upon comparing 134 common genes of our results with exist-ing reports, only 5 genes were reported to be hypoxia related genes(Rv0634c, Rv1884c, Rv2477c, Rv2873, and Rv3008) (Bacon et al.,2004; Sherman et al., 2001). In contrast to our work, where 3 dif-ferent isolates of M. tuberculosis are used, these earlier reportsincluded only H37Rv as a study organism. Hence only few overlap-ping genes were found among the 134 common genes. Total of 30differentially regulated genes were selected for RT-PCR validationand they were correlated with microarray data (Data not shown).But RT-PCR results of Rv0212c, Rv0213c, Rv1130, and Rv1518 isgiven (Figs. 5 and 6).
4. Discussion
Unlike many pathogens that are overtly toxic to their hosts,the primary virulence determinant of M. tuberculosis appears to
78 S. Devasundaram et al. / Journal of Biotechnology 210 (2015) 70–80
Rv Rvd
-0.5
0.0
0.5
1.0Rv1130Rv1518
log 2
rat
io
Fig. 6. Real-time RT-PCR of Rv1130 and Rv1518. Expression levels of Rv1130 andRv1518 under low oxygen conditions. Total RNA was isolated from anaerobic andaerobic cultures of H37Rv. Real-time RT-PCR was performed, and the expressionlevel of each Rv1130 and Rv1518 transcript was calculated using the 16srRNA tran-script for normalization for RNA amounts and aerated cultures as a control. Data arepresented as the mean fold change of expression ± standard deviation for each geneand are averages from three independent experiments.
be its ability to persist for years or decades within humans in aclinically dormant state. Several lines of evidence link latent tuber-culosis and inhibition of MTB growth/metabolism with hypoxicconditions within the host (Sherman et al., 2001; Fang et al., 2012).Tuberculosis infections are preferentially associated with the mostoxygen-rich sites in the body suggesting that reduced levels of O2may limit M. tuberculosis growth in vivo.
We investigated how M. tuberculosis responded to a reducedoxygen tension in terms of gene expression by growing cells underboth aerobic and low-oxygen conditions. To our knowledge, thisgenome-wide transcriptomics approach has produced the firstinsights into the response of South Indian prevalent clinical iso-lates of M. tuberculosis when exposed to hypoxia. Laboratory strainsmight not represent the virulence of naturally occurring tuber-culosis strains in patients and hence activity of a given vaccineor treatment cannot be guaranteed from assays using these lab-oratory strains. This is an important consideration when testingnew vaccine candidates or drugs. Thus, we aimed at using themost prevalent clinical strains (S7 and S10) from South India forthe hypoxia model of persistence along with the laboratory strainH37Rv.
In our experiments, both aerobic and anaerobic cultures wereterminated during late exponential growth (25–27 days) in orderto minimize growth-related differences between strains. The pat-tern of methylene blue decolorization was more similar in H37Rv,S7, and S10 anaerobic cultures which indicate depletion of oxy-gen was achieved in our culture methods. The DosR–DosS, twocomponent regulatory system plays a pivotal role in mediatingthe adaptive response to hypoxia. Overexpression of DosR regu-lon genes like 3128c (in RvD and S10D cultures), Rv1997, Rv2004c,Rv2005c, Rv2007c, Rv3127c, and dosS (Rv3132c) in S7 anaerobiccultures and Rv2025c in S10 anaerobic cultures (GEO accessionno: GPL18248) indicated that the oxygen depletion was faithfullyachieved in our culture methods. We were mainly interested inlisting upregulated genes common between all three strains dur-ing hypoxia. Since a great number of published studies have usedonly H37Rv as a model strain for their hypoxia experiment model,very few reported hypoxic genes of H37Rv were found in our studywhere three different M. tuberculosis strains were used.
Better quality RNA is indispensable for efficient microarray tech-nique and guanidinium thiocyanate containing TRIzol method is astandard method for the RNA extraction and followed here. Thismethod of RNA extraction was proven to yield good quality of totalRNA (Ojaniemi et al., 2003) and followed in recent mycobacterialmicroarray work (Wei et al., 2013).
In addition to 134 common genes, 367 genes were found over-lapping between H37Rv and S10 strains whereas only 12 geneswere shared by S7 with H37Rv that are upregulated during hypoxia.
Cytosolic protein analysis (unpublished work) of these strains alsoconferred that the expressed protein profiles during hypoxia ofS10 was similar to H37Rv, but S7 differed from H37Rv. Recently, astudy was published from our department on the genomic featuresof 4 M. tuberculosis clinical isolates (NIRT202, NIRT203, NIRT204,and NIRT206) from South India. The isolate NIRT206 representsthe strain S7 (Narayanan and Deshpande, 2013) and their resultsshowed NIRT206 (S7) genome contains only 3414 genes whencompared to H37Rv that has 4111 genes, but no such genomicdata is available for the clinical isolate S10. Thus it is unclearwhether direct link between gene number and expression patternexist between these two strains. Future work on whole genomesequencing of S10 could help to elucidate its genomic features(gene numbers) as well as the reason for its higher hypoxic genecounterparts with H37Rv.
In the current study, the gradation (S10 > H37Rv > S7) observedin total number of genes expressed under hypoxia suggests thateach strain behaves differently for similar stimuli. The clinical strainS7 responds minimal to the given stimuli thereby masking its pres-ence and reducing the outgoing signals to the host for its survivalstrategy. In our earlier studies, we reported that S7 induced min-imal apoptosis compared to S10 and H37Rv in THP1 cell lines(Rajavelu and Das, 2005; Rajavelu et al., 2007). In another report,upon in vitro infection with S7 and S10 of human monocyte-deriveddendritic cells (DCs) (MoDC), S7 reduced the expression of surfacemarkers (CD86, CD80, and CD83) thereby inhibiting DC maturation,but S10 infected MoDC expressed significantly high levels of thesemarkers (Rajashree et al., 2008). The migration of the infected DCstowards the lymph nodes to activate naive T lymphocytes is cru-cial during M. tuberculosis infection. This migratory property of DCwas lowered (50%) upon S7 infection compared to S10 infected DCs.These observations support our results, where S7 shows minimalgene expression compared to S10, and highlights the need of study-ing the most prevalent clinical strains of the outbreaks, like S7 andS10, under the potential stimuli.
Among 134 induced hypoxic genes, majority of them aretransport and binding proteins and genes that are involved inthe lipid metabolism. Three interesting classes of genes involvedin host–pathogen interactions are T-cell antigens, PE/PPE fam-ily genes, and genes involved in lipid metabolism. The PE/PPEgenes families constitute 10% of the total coding capacity of the M.tuberculosis genome and are characterized by highly conserved N-terminal domains. PE/PPE proteins have the ability to modulate theantigen processing of the infected host cells which confirms theirimportance in terms of their significance in overall pathogenesisassociated with the tuberculosis disease (Koh et al., 2009). Three ofsuch genes (Rv1753c–PPE24, Rv2107–PE22, and Rv2108–PPE36)were upregulated under oxygen depletion which was observedin all three strains. Strikingly 16 genes of this family were overexpressed both in H37Rv and one of the clinical strains (S10).They are Rv0096 (PPE1), Rv0151c (PE1), Rv0159c (PE3), Rv0305c(PPE6), Rv0354c (PPE7), Rv0355c (PPE8), Rv1548c (PPE21), Rv1808(PPE32), Rv1809 (PPE33), Rv1917c (PPE34), Rv3347c (PPE55),Rv3539 (PPE63), and Rv3738c (PPE66).
PE3, a recently characterized gene, was considered to be essen-tial for the maintenance of impermeable cell wall and the virulence(Singh et al., 2013) and proposed as a molecule for serodiagnos-tic application and vaccine development (Li et al., 2010) againsttuberculosis. Interestingly PE 34 and PPE 55 were reported to beupregulated in human lung granuloma (Rachman et al., 2006).Together with other published expression data, results from ourhypoxia experiments lend support for the important role of PE/PPEgenes during dormancy establishment of M. tuberculosis.
Genes that are involved in the biosynthesis of sulfolipids (SL)include polyketide synthase Pks2 (Rv3825c), PapA1 (Rv3824c), andPapA2 (Rv3820c). PapA1 and PapA2 are responsible for sequential
S. Devasundaram et al. / Journal of Biotechnology 210 (2015) 70–80 79
acylation of trehalose sulfate. Increased expression of pks2 inresponse to nutrient starvation (Betts et al., 2002) and in oxygendepletion, from our results, strongly reveals its association withmycobacterial persistence. Pks2, papA1, papA2, and mmpL8 are co-located in M. tuberculosis genome with Rv3821 and Rv3822 operon.This operon function is potentiated by the sulfolipid transporterMmpL8–Rv3823c. Increased expression of this gene in addition toPks2 (Rv3825c), PapA1 (Rv3824c), and PapA2 (Rv3820c) from ourstudy suggest their role in dormancy induced by hypoxia.
In addition, the high pks2, papA1, and papA2 transcriptionin NRP2 suggests over-expression of these genes is required forsulpholipid biosynthesis (Sirakova et al., 2001) and is reported tobe induced upon macrophage infection (Graham and Clark-Curtiss,1999). Thus the transcriptional response of sulfolipids biosynthe-sis genes during hypoxia signifies the metabolic stress generatedby gradual oxygen depletion and its role in adaptation mechanism.
A well characterized MosR operon (Rv0347–Rv0348–Rv0349)and its expression during the late stage of chronic TB has alreadybeen reported from in vivo murine model (Mehra and Kaushal,2009). Rv0348 gene encodes a novel transcriptional factor thatregulates several operons involved in mycobacterial survival, espe-cially during hypoxia. Moderate expression of Rv0348 transcriptunder hypoxia and its potential involvement in the expression of�F which orchestrates entry into the chronic stage of TB was alreadyreported (Muttucumaru et al., 2004; Geiman et al., 2004).
Albeit majority of the studies reported down regulation of ATPsynthase operon (Karakousis et al., 2004), dormant mycobacteriado possess residual ATP synthase enzymatic activity, as observed inthe present work, which is indispensable for its survival and makingit a promising target to tackle dormant infections (Koul et al., 2008).
Variation in gene expression among clinical isolates has implica-tions for pathogenicity and the identification of candidate genes fordrug targets, vaccine antigens, and diagnostic assays. The enrich-ment of lipid metabolism genes, PE/PPE genes and T-cell antigensgenes that are variably expressed under hypoxia suggest that clin-ical isolates may differ in their host interactions and adaptationduring stress.
5. Conclusion
Genes that are responding to external stimuli, on the expressionlevel, would provide versatile regulatory machinery for M. tubercu-losis adaptation and analyzing them will be an important step tounderstand mycobacterial latency, key pathways involved duringlatency and develop direct antibiotic therapy to TB in future. Usingprevalent clinical strains are advantageous as major disease out-breaks are resulted with its infection. Thus genes that are highlycommon and upregulated under given stress condition would be abetter target for drug/vaccine development against TB.
Acknowledgments
We thank Indian Council of Medical Research for the SeniorResearch fellowship awarded to Santhi Devasundaram. We alsoacknowledge Prof. Paturu Kondaiah, MRDG Department, IISc, Ban-galore for providing microarray and qPCR facility for this work andfor helpful discussions.
References
Abomoelak, B., Hoye, E.A., Chi, J., Marcus, S.A., Laval, F., Bannantine, J.P., Ward, S.K.,Daffe, M., Liu, H.D., Talaat, A.M., 2009. mosR, a novel transcriptional regula-tor of hypoxia and virulence in Mycobacterium tuberculosis. J. Bacteriol. 191,5941–5952.
Bacon, J., James, B.W., Wernisch, L., Williams, A., Morley, K.A., Hatch, G.J., Mangan, J.A.,Hinds, J., Stoker, N.G., Butcher, P.D., Marsh, P.D., 2004. The influence of reduced
oxygen availability on pathogenicity and gene expression in Mycobacteriumtuberculosis. Tuberculosis 84, 205–217.
Betts, J.C., Lukey, P.T., Robb, L.C., McAdam, R.A., Duncan, K., 2002. Evaluation of anutrient starvation model of Mycobacterium tuberculosis persistence by geneand protein expression profiling. Mol. Microbiol. 43, 717–731.
Camus, J.C., Pryor, M.J., Medigue, C., Cole, S.T., 2002. Re-annotation of the genomesequence of Mycobacterium tuberculosis H37Rv. Microbiology 148, 2967–2973.
Das, S., Paramasivan, C.N., Lowrie, D.B., Prabhakar, R., Narayanan, P.R., 1995.IS6110restriction fragment length polymorphism typing of clinical isolatesof Mycobacterium tuberculosisfrom patients with pulmonary tuberculosis inMadras, south India. Tuber. Lung Dis. 76, 550–554.
Geiman, D.E., Kaushal, D., Ko, C., Tyagi, S., Manabe, Y.C., Schroeder, B.G., Fleischmann,R.D., Morrison, N.E., Converse, P.J., Chen, P., Bishai, W.R., 2004. Attenuation oflate-stage disease in mice infected by the Mycobacterium tuberculosis mutantlacking the SigF alternate sigma factor and identification of SigF-dependentgenes by microarray analysis. Infect. Immun. 72, 1733–1745.
Graham, J.E., Clark-Curtiss, J.E., 1999. Identification of Mycobacterium tuberculosisRNAs synthesized in response to phagocytosis by human macrophages by selec-tive capture of transcribed sequences (SCOTS). Proc. Natl. Acad. Sci. U. S. A. 96,11554–11559.
Karakousis, P.C., Yoshimatsu, T., Lamichhane, G., Woolwine, S.C., Nuermberger, E.L.,Grosset, J., Bishai, W.R., 2004. Dormancy phenotype displayed by extracellularMycobacterium tuberculosis within artificial granulomas in mice. J. Exp. Med. 200,647–657.
Klinkenberg, L.G., Karakousis, P.C., 2013. Rv1894c is a novel hypoxia-inducednitronate monooxygenase required for Mycobacterium tuberculosis virulence. J.Infect. Dis. 207, 1525–1534.
Koh, K.W., Soh, S.E., Seah, G.T., 2009. Strong antibody responses to Mycobacteriumtuberculosis PE-PGRS62 protein are associated with latent and active tuberculo-sis. Infect. Immun. 77, 3337e43.
Koul, A., Vranckx, L., Dendouga, N., Balemans, W., Van den Wyngaert, I., Vergauwen,K., Gohlmann, H.W., Willebrords, R., Poncelet, A., Guillemont, J., Bald, D., Andries,K., 2008. Diarylquinolines are bactericidal for dormant mycobacteria as a resultof disturbed ATP homeostasis. J. Biol. Chem. 283, 25273–25280.
Li, Y., Zeng, J., Shi, J., Wang, M., Rao, M., Xue, C., Du, Y., He, Z.G., 2010. Aproteome-scale identification of novel antigenic pro-teins in Mycobacteriumtuberculosis toward diagnostic and vaccine development. J. Proteome Res. 9,4812–4822.
Mehra, S., Kaushal, D., 2009. Functional genomics reveals extended roles of theMycobacterium tuberculosis stress response factor sigmaH. J. Bacteriol. 191,3965–3980.
Muttucumaru, D.G., Roberts, G., Hinds, J., Stabler, R.A., Parish, T., 2004. Geneexpression profile of Mycobacterium tuberculosis in a non-replicating state.Tuberculosis 84, 239–246.
Narayanan, S., Das, S., Garg, R., Hari, L., Rao, V.B., Frieden, T.R., et al., 2002. Molec-ular epidemiology of tuberculosis in a rural area of high prevalence in SouthIndia: implications for disease control and prevention. J. Clin. Microbiol. 40,4785–4788.
Narayanan, S., Deshpande, U., 2013. Whole-genome sequences of four clinical iso-lates of Mycobacterium tuberculosis from Tamil Nadu, South India. GenomeAnnounc. 1, e00186-13.
Ojaniemi, H., Evengard, B., Lee, D.R., Unger, E.R., Vernon, S. D, 2003. Impact ofRNA extraction from limited samples on microarray results. BioTechniques 35,968–973.
Rachman, H., Strong, M., Schaible, U., Schuchhardt, J., Hagens, K., Mollenkopf, H.,et al., 2006. Mycobacterium tuberculosis gene expression profiling within thecontext of protein networks. Microbes Infect. 8, 747e57.
Rajashree, P., Supriya, P., Das, S.D., 2008. Differential migration of human monocyte-derived dendritic cells after infection with prevalent clinical strains ofMycobacterium tuberculosis. Immunobiology 213, 567–575.
Rajavelu, P., Das, S.D., 2005. Th2-type immune response observed in healthy indi-viduals to sonicate antigen prepared from the most prevalent Mycobacteriumtuberculosis strain with single copy of IS6110. FEMS Immunol. Med. Microbiol.45, 95–102.
Rajavelu, P., Das, S.D., 2007. A correlation between phagocytosis and apoptosis inTHP-1 cells infected with prevalent strains of Mycobacterium tuberculosis. Micro-biol. Immunol. 51, 201–210.
Rehren, G., Walters, S., Fontan, P., Smith, I., Zarraga, A.M., 2007. Differentialgene expression between Mycobacterium bovis and Mycobacterium tuberculosis.Tuberculosis 87, 347–359.
Rustad, T.R., Harrell, M.I., Liao, R., Sherman, D.R., 2008. The enduring hypoxicresponse of Mycobacterium tuberculosis. PLoS One 3, e1502.
Schnappinger, D., Ehrt, S., Voskuil, M.I., Liu, Y., Mangan, J.A., Monahan, I.M., Dolganov,G., Efron, B., Butcher, P.D., Nathan, C., Schoolnik, G.K., 2003. Transcriptionaladaptation of Mycobacterium tuberculosis within macrophages: insights into thephagosomal environment. J. Exp. Med. 198 (5), 693–704.
Sherman, D.R., Voskuil, M.I., Schnappinger, D., Liao, R., Harrell, M.I., Schoolnik, G.K.,2001. Alpha-crystalline and adaptation to hypoxia in Mycobacterium tuberculo-sis. Proc. Natl. Acad. Sci. U. S. A. 98 (13), 7534–7539.
80 S. Devasundaram et al. / Journal of Biotechnology 210 (2015) 70–80
Singh, S.K., Kumari, R., Singh, D.K., Tiwari, S., Singh, P.K., Sharma, S., Srivastava, K.K.,2013. Putative roles of a proline-glutamic acid-rich protein (PE3) in intracel-lular survival and as a candidate for subunit vaccine against Mycobacteriumtuberculosis. Med. Microbiol. Immunol. 202, 365–377.
Sirakova, T.D., Thirumala, A.K., Dubey, V.S., Sprecher, H., Kolattukudy, P.E., 2001. TheMycobacterium tuberculosis pks2 gene encodes the synthase for the hepta- andoctamethyl-branched fatty acids required for sulfolipid synthesis. J. Biol. Chem.276, 16833–16839.
Wayne, L.G., Hayes, L.G., 1996. An in vitro model for sequential study of shiftdownof Mycobacterium tuberculosis through two stages of nonreplicating persistence.Infect. Immun. 64, 2062–2069.
Wei, J., Guo, N., Liang, J., Yuan, P., Shi, Q., Tang, X., Yu, L., 2013. DNA microarray geneexpression profile of Mycobacterium tuberculosis when exposed to osthole. Pol.J. Microbiol. 62, 23–30.