Page 1
i
THE INFLUENCE OF SERVICE QUALITY ON CUSTOMER
SATISFACTION, CUSTOMER VALUE AND BEHAVIORAL
INTENTIONS IN THE HOTEL SECTOR OF ETHIOPIA
By: Tewodros Mesfin DENEKE
(Student Number: 72700130)
Submitted in accordance with the requirements for the degree of
DOCTOR OF BUSINESS LEADERSHIP (DBL)
at the
UNIVERSITY OF SOUTH AFRICA
Supervisor: Dr. Rakshit Negi
April 2015
Page 2
ii
Declaration
I, Tewodros Mesfin, declare that the thesis ―THE INFLUENCE OF SERVICE QUALITY ON
CUSTOMER SATISFACTION, CUSTOMER VALUE AND BEHAVIORAL INTENTIONS IN THE
HOTEL SECTOR OF ETHIOPIA” is my own work and the sources that I have used or quoted
have been indicated and acknowledged by means of complete reference.
_______________________________ April 25, 2015
Tewodros Mesfin DENEKE
Page 3
iii
Dedication
This thesis is dedicated to my kids Elamen Tewodors and Sineal Tewodros,
the sweetest part of my life.
Page 4
iv
Acknowledgement
First of all, glory to the Almighty God with my heartfelt feelings for giving me this opportunity
to accomplish my study. I would like to express my appreciation to my supervisor Dr. Rakshit
Negi for his unreserved intellectual guidance and continuous support over the long journey of
this Doctoral project.
I am also greatly indebted to the scholarly, constructive and sincere feedbacks received from
UNISA Professors. My sincere gratitude also goes to the external evaluators for their diligent
review and highly valuable comments on this thesis. At this moment, I wish to express my keen
appreciation to the hotels‘ managers and customers/guests, being respondents, who kindly
participated in this study. I thank them all.
Finally, I am so grateful for the support and encouragement that I received, throughout my
Doctoral study, from my wife Saba, my mother Abeba, other family members, friends and my
students.
Page 5
v
Table of Contents
Acknowledgement………………………………………………………………………....iv
List of Tables ....... ……………………………………………………………………………...ix
List of Figures ............................................................................................... x
Acronyms and Abbreviations ........................................................................... xi
Abstract .................................................................................................... xii
CHAPTER 1 ................................................................................................ 1
INTRODUCTION AND BACKGROUND ............................................................ 1
1.1Introduction ............................................................................................. 1
1.2Context and Background of the Study .............................................................. 5
1.3 Statement of the Problem ............................................................................ 8
1.4 Research Questions ................................................................................... 11
1.4.1 Main Research Question…………………………………………………….…......11
1.4.2 Specific Research Questions…………………………………………………….....11
1.5 Aim and Objectives of the Study…………………………………………………………..12
1.5.1 The Aim of the Study……………………………………………………………....12
1.5.2 Specific Objectives of the Study………………………………………………...…12
1.6 Justification of the Study ................................................................. ………..13
1.7 Significance of the Study ........................................................................... .14
1.8 Delimitations/Scope of the Study ................................................................... 16
1.9 Organization of the Thesis .......................................................................... 17
1.10 Summary of the Chapter ........................................................................... 18
CHAPTER 2 ............................................................................................... 19
LITERATURE REVIEW AND THEORETICAL BACKGROUND ........................... 19
2.1 Theoretical Framework .............................................................................. 19
2.1.1 Characteristics of Service……………………………………………………...…...19
2.1.2 Conceptualizing the Service Quality………………………………………...……..22
2.1.3 SERVQUAL versus SERVPERF…………………………………………….….....36
2.1.4 Customer Satisfaction………………………………………………………...…….45
2.1.5 Customer Value……………………………………………………………..……...48
Page 6
vi
2.1.6 Behavioral Intentions……………………………………………..……………..….51
2.2 Empirical Literature Review ....................................................................... 55
2.2.1 Service Quality, Customer Value, Satisfaction and Behavioral Intentions………..55
2.3 Conceptual Framework and Hypotheses ......................................................... 63
2.3.1 Conceptual Framework……………………………………………….………..…...63
2.3.2 Research Hypotheses………………………………………………….……...….....67
2.4 Summary of the Chapter ............................................................................ 69
CHAPTER 3 ............................................................................................... 71
METHODOLOGY ....................................................................................... 71
3.1 Research Paradigm, Approach and Method……………………………………………...71
3.1.1 Research Paradigm……………………………………………………...…….…….71
3.1.2 Research Approach……………………………………………………….………...73
3.1.3 Research Method………………………………………………………………...…76
3.2 Research Design………………………………………………………………….…….…...81
3.3 Study Population and Sampling Techniques……………………………………….…..…84
3.3.1 Target Population, Unit of Analysis and Sample Frame……………………………84
3.3.2 Sample Size…………………………………………………………………………87
3.3.3 Sampling Technique………………………………………………………….……..87
3.4 Data Collection Procedure……………………………………………………….………….89
3.4.1 Exploratory Study…………………………………………………………..………..89
3.4.2 Data Collection Instrument and Scales……………………………………..………..95
3.4.3 Main Survey……………………………………………………………..…………...98
3.5 Scale Reliability and Validity……………………………………………………………....100
3.5.1 Pilot Testing of the Questionnaire………………………………………..…………104
3.6 Data Analysis Techniques…………………………………………………………………..105
3.7 Ethical Considerations………………………………………………………………………106
3.8 Summary of the Chapter…………………………………………………………………….108
CHAPTER 4……………………………………………………………………………………..110
DATA ANALYSIS……………………………………………………………………………….110
4.1 Data Screening and Test for Normality……………………………………………………110
4.1.1 Data Screening……………………………………………………………...……….110
Page 7
vii
4.1.2 Test of Normality………………………………………………………......……….111
4.2 Respondents’ Profile………………………………………………………………………..111
4.3 Exploratory Factor Analysis and Scale Reliability……………………………………….117
4.3.1 Principal Component Analysis- Service Quality Attributes………………...…...…119
4.3.2 Principal Component Analysis- Customer Value, Satisfaction and Behavioral
Intentions…………………………………………………………………………….…….123
4.4 Descriptive Analysis…………………………………………………………………………..126
4.4.1 Mean Ratings of Service Quality Items and Dimensions…………………………...127
4.4.2 Word-of-Mouth (WOM) Recommendations Target Audiences…………….………132
4.5 Analysis of Associations……………………………………………………………….……..134
4.5.1 Correlation Analysis……………………………………………………………………..…135
4.5.2 Regression Analysis………………………………………………….……………...141
4.5.2.1 Predicting Quality through Perceived Performance of Service Quality Dimensions...143
4.5.2.2 Effect of Perceived Service Quality on Customer Satisfaction…………………………….…..145
4.5.2.3 Influence of Perceived Service Quality on Customer Value………………………………...….146
4.5.2.4 Influence of Perceived Service Quality on Behavioral Intentions through
Mediating Effect of Customer Satisfaction…………………………………………………………………...…….148
4.5.2.5 Influence of Perceived Service Quality on Behavioral Intentions through
Mediating Effect of Customer Value…………………………………………………………………………………..150
4.5.2.6 Effect of Service Quality on Behavioral Intentions…………………………………………….…….152
4.6 Analysis of Differences……………………………………………………….………156
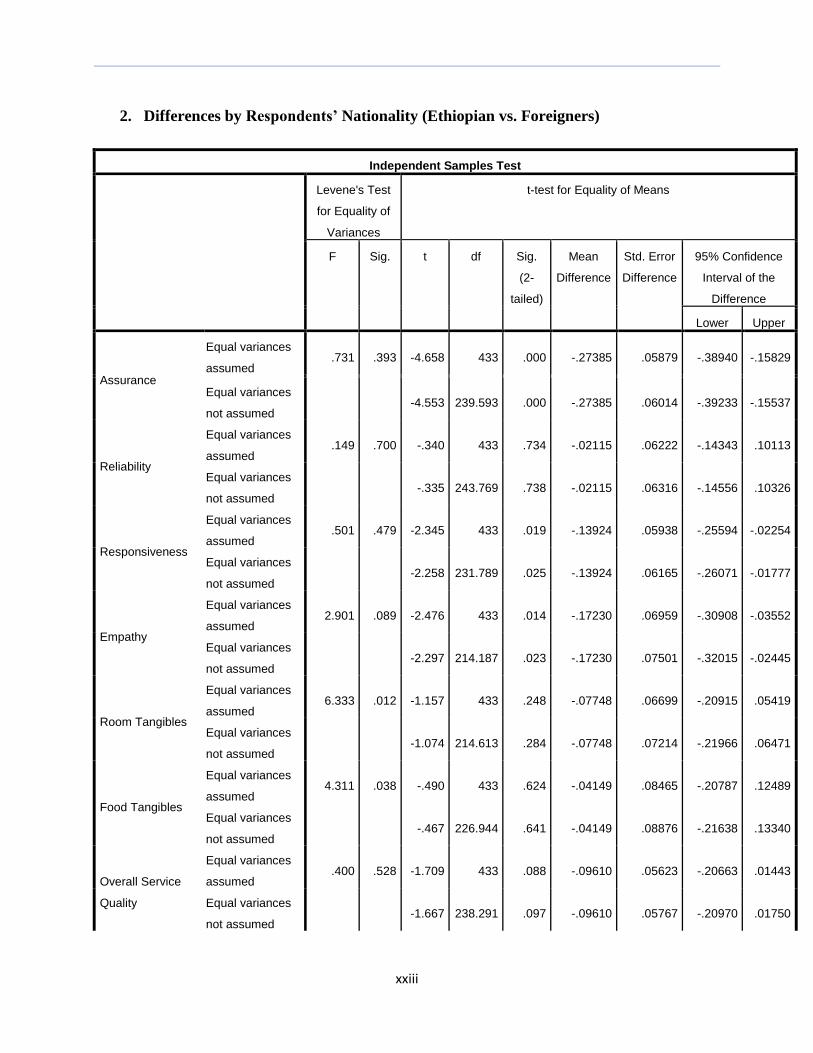
4.6.1 t-test…………………………………………………………………….……………157
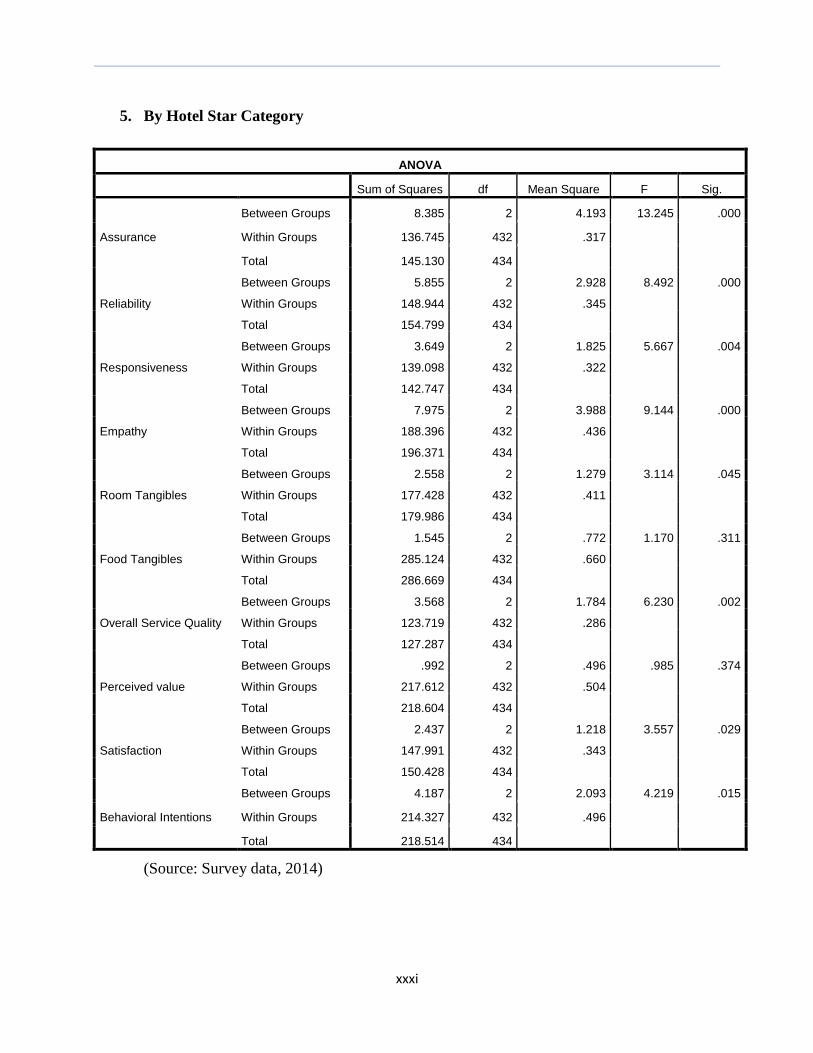
4.6.2 Analysis of Variance (ANOVA)………………………………………………….…161
4.7 Summarizing the Results…………………………………………………………………….186
4.8 Summary of the Chapter…………………………………………………………………….190
CHAPTER 5……………………………………………………………………………………...192
DISCUSSION OF FINDINGS AND CONCLUSION……………………………………….…192
5.1 Service Quality Measurement (Modified SERVPERF)…………………………………...192
5.2 Relationship between Service Quality, Perceived Value, Customer Satisfaction
and Behavioral Intentions……………………………………………………………………....193
5.3 Role of Socio-Demographic Profile and Hotel Characteristics………………………..….195
5.4 Conclusion…………………………………………………………………………………....201
Page 8
viii
5.5 Summary of the Chapter .......................................................................... 206
CHAPTER 6 ............................................................................................. 208
THEORETICAL, POLICY AND MANAGERIAL IMPLICATIONS ....................... 208
6.1 Theoretical Implications ........................................................................... 208
6.2 Policy Implications ................................................................................ 210
6.3 Managerial Implications…………………………………………………..……….211
6.4 Limitations and Directions for Future Research………………………..……….214
6.5 Chapter Summary………………………………………………………...………..216
References ................................................................................................ 217
Annex-A: Questionnaire ................................................................................... i
Annex-B: Summary of Reviewed Literature .......................................................... v
Annex-C: Identified Literature Gaps in the Study Context ....................................... xi
Annex-D: Focus Group Discussion Guideline ...................................................... xvi
Annex-E: Kurtosis and Skewness values of the scale items ...................................... xix
Annex-F: t-test Tables ................................................................................... xxi
Annex-G: ANOVA Tables ........................................................................... xxvii
Page 9
ix
List of Tables
Table Page
Table 2.1: Determinants of Service Quality 26 Table 2.2 Service quality dimensions 38 Table 2.3 Relationship between service quality, customer value, satisfaction and
behavioral intentions in different contexts 60
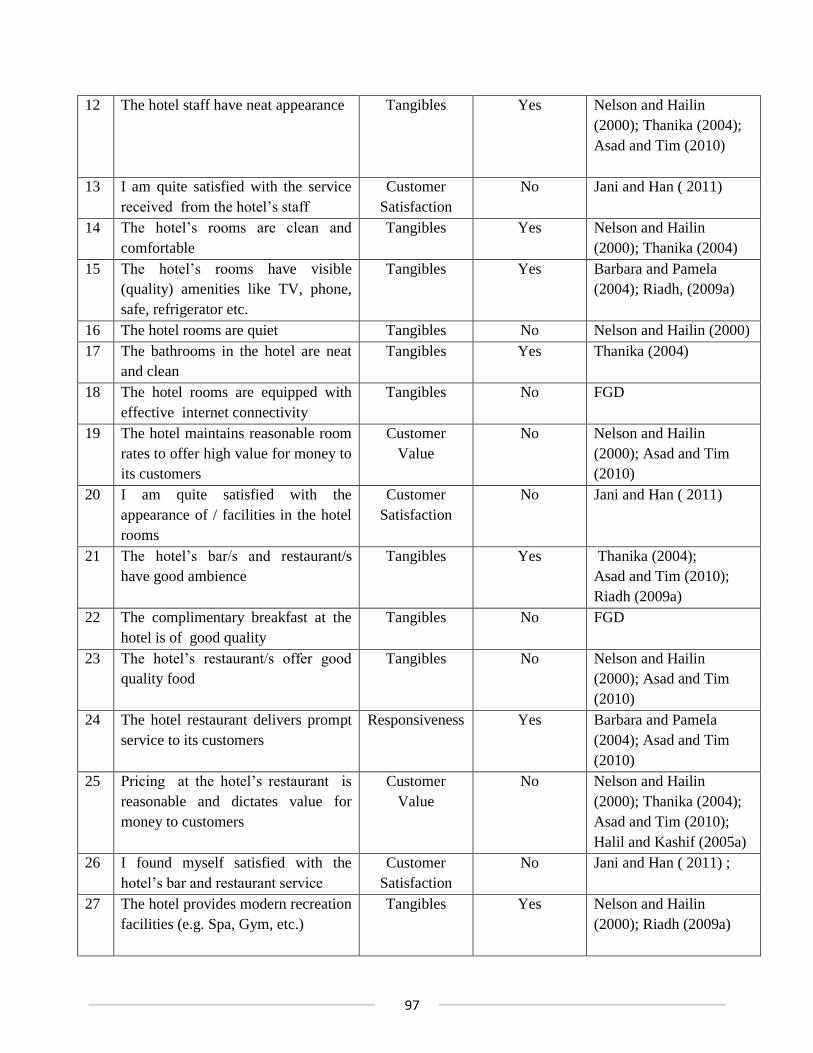
Table 3.1: Star category hotels in Ethiopia 84 Table 3.2: Target population 85 Table 3.3: Participating hotels by star category and location 88 Table 3.4: List of items and references for the questionnaire development 96 Table 3.5: Survey respondents 100 Table 4.1: KMO and Bartlett‘s test of Spherecity 118 Table 4.2: Factor loadings and scale reliabilities for service quality 120 Table 4.3: Factor loadings and scale reliabilities for customer value, satisfaction
and behavioral intentions 124
Table 4.4: Descriptive statistics for service quality items 128 Table 4.5: Descriptive statistics for service quality dimensions 130 Table 4.6: Correlation between perceived service quality and its dimensions 136 Table 4.7: Correlation between service quality, customer value, satisfaction and
behavioral intentions 138
Table 4.8: Regression of overall service quality 144 Table 4.9: Regression of service quality on customer satisfaction 145 Table 4.10: Regression of service quality on customer value 147 Table 4.11: Regression of service quality on behavioral intentions 152 Table 4.12: Regression of service quality dimensions on behavioral intentions 153 Table 4.13: Regression of service quality on customer revisits 154 Table 4.14: Regression of service quality on WOM recommendations 155 Table 4.15: Group statistics and t-test result by the respondents‘ gender 158 Table 4.16: Group statistics and t-test result by the respondents‘ nationality 159 Table 4.17: Group statistics and t-test result by the hotel location 160 Table 4.18: ANOVA- by the respondents‘ purpose of visit 162 Table 4.19: ANOVA- by the respondents‘ length of stay 167 Table 4.20: ANOVA- by the respondents‘ number of visits 172 Table 4.21: ANOVA- by respondents‘ age 176 Table 4.22: ANOVA- by the hotels star category 182 Table 4.23: Summary of the results of hypothesis testing
189
Page 10
x
List of Figures
Figure Page
Figure 2.1: Grönroos‘ Perceived Service Quality Model 25
Figure 2.2: SERVQUAL Model 28
Figure 2.3: SERVPERF Model 28
Figure 2.4: Three-Component Model 29
Figure 2.5: Multilevel Model of Retail Service Quality 30
Figure 2.6: Hierarchical Model of Service 31
Figure 2.7: Theory of Reasoned Action 53
Figure 2.8: Theory of Planned Behavior 54
Figure 2.9 Conceptual Framework 65
Figure 4.1: Respondents‘ gender 112
Figure 4.2: Respondents‘ age 113
Figure 4.4: Respondents by purpose of visit 114
Figure 4.5: Respondents‘ length of stay in the hotels 115
Figure 4.6: Respondents‘ visit(s) frequency 116
Figure 4.7: Target audiences of respondents‘ WOM recommendations 133
Figure 4.8: Customer satisfaction mediation model 149
Figure 4.9: Customer value mediation model 151
Figure 4.10: Overall service quality by the respondents‘ purpose of visit 163
Figure 4.11: Perceived value by the respondents‘ purpose of visit 164
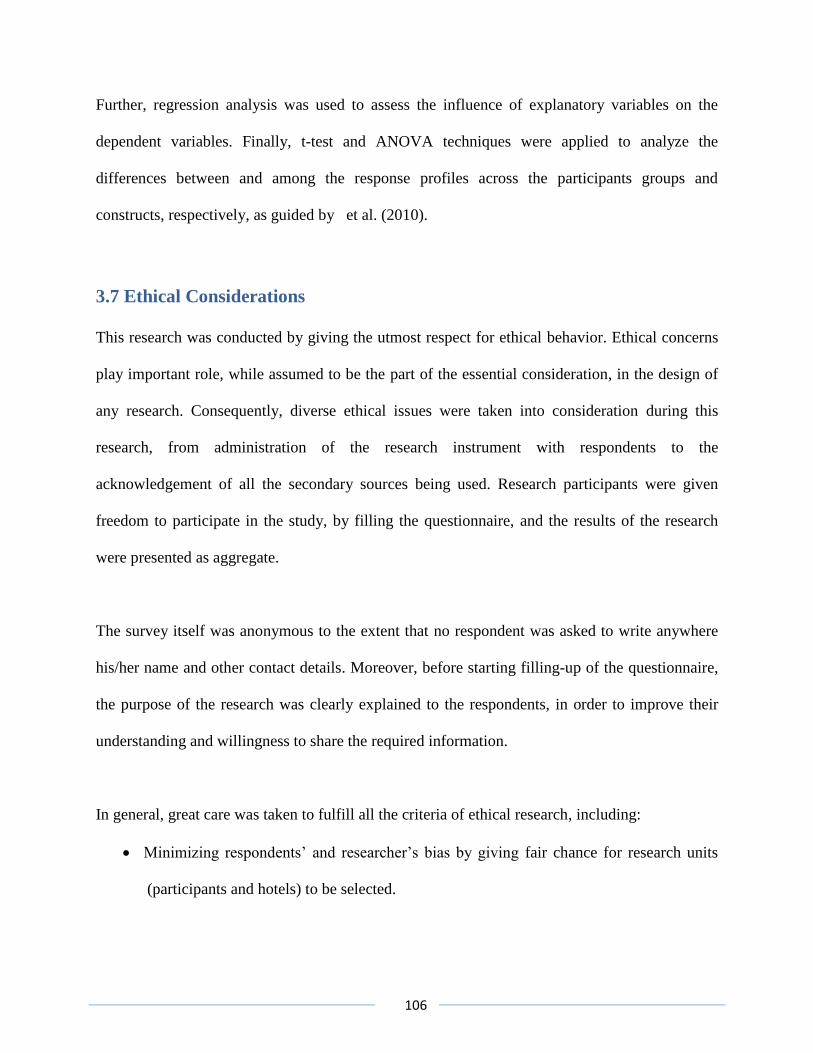
Figure 4.12: Overall satisfaction level by the respondents‘ purpose of visit 165
Figure 4.13: Behavioral intentions by the respondents‘ purpose of visit 166
Figure 4.14: Overall service quality by the respondents‘ length of stay 168
Figure 4.15: Perceived value by respondents‘ length of stay 169
Figure 4.16: Overall satisfaction by respondents‘ length of stay 169
Figure 4.17: Behavioral intentions by the respondents‘ length of stay 170
Figure 4.18: Overall service quality by the respondents‘ number of visits 173
Figure 4.19: Perceived value by the respondents‘ number of visits 174
Figure 4.20: Overall satisfaction by number of visits 174
Figure 4.21: Behavioral intentions by number of visits 175
Figure 4.22: Overall service quality by the respondents‘ age category 177
Figure 4.23: Perceived value by the respondents‘ age category 178
Figure 4.24: Overall satisfaction by the respondents‘ age category 179
Figure 4.25: Behavioral intentions by the respondents‘ age category 180
Figure 4.26: Overall service quality by hotel stars category 183
Figure 4.27: Perceived value by hotel stars category 184
Figure 4.28: Overall satisfaction by hotel stars category 185
Figure 4.29: Behavioral intentions by the hotels star category 185
Page 11
xi
Acronyms and Abbreviations
A-WOM Acquaintances Word-of-Mouth
BC-WOM Booking Contacts Word-of-Mouth
D-WOM Direct Word-of-Mouth (to hotel management and staff)
Df Degree of freedom
EFA Exploratory Factor Analysis
E-WOM Electronic Word-of-Mouth
MoCT Ministry of Culture and Tourism ( of Ethiopia)
PCA Principal Component Analysis
SERVQUAL Gap-based model to measure Service Quality
SERVPERF Perception only measure of Service Quality
SPSS Statistical Package for Social Scientists
TRA Theory of Reasoned Action
UNDP United Nations Development Program
WOM Word-of-Mouth (recommendations)
Page 12
xii
Abstract
The basic purpose of this study was to examine the influence of service quality on customer
satisfaction, perceived customer value and behavioral intentions, in three, four and five star
hotels in Ethiopia. Additionally, an attempt was made to assess the differences pertaining to
these constructs across customer profile (e.g., gender, nationality etc.) and hotel characteristics
(e.g., star ratings etc.). A quantitative survey approach was used to obtain primary data from the
respondents (hotels’ guests/customers) by administering the structured questionnaire. The
original SERVPERF dimensions and related items were modified to best fit with hotel sector, by
using desk review and preliminary interviews with manager, consultants and corporate clients of
the hotels. A pilot study was carried out with 35 hotel customers to test the initial reliability and
validity of the instrument. The final questionnaire was distributed to 440 respondents from 44
hotels (under three, four and five star categories), by using stratified (proportionate) random
sampling. Of the distributed questionnaires, 435 were collected back (over 98% return rate), as
completely filled, and used for the purpose of analysis. Descriptive statistics (mean score and
standard deviation) were used to examine the customers’ perceptions of service quality,
customer value, satisfaction and behavioral intentions. To identify the key service quality
dimensions in the Ethiopian hotel sector, Principal Component Analysis (PCA) was employed.
The results revealed six underlying factors, namely: Assurance, Reliability, Responsiveness,
Empathy, Room Tangibles and Food & Beverage Tangibles. Regression analysis was carried out
to examine the relationship between the study constructs, whereby perceived service quality was
found to be maintaining significantly (p<0.05) positive influence on customer value, satisfaction
and behavioral intentions (measured as customer revisits and word-of-mouth recommendations)
in the Ethiopian hotel sector. Moreover, both customer value and satisfaction were observed to
be partially mediating the influence of service quality on behavioral intentions, with higher
contribution from satisfaction than perceived value. Finally, the respondents’ nationality,
gender, visit purpose, length of stay, hotel location and star category were found to be
determining their perceptions of overall service quality. However, further research is needed
before generalizing these relationships to other sectors/contexts.
Page 13
xiii
Key words: Service quality, Customer satisfaction, Customer value, Behavioral intentions,
SERVPERF, Word-of-mouth, Revisit, Hotel sector, Ethiopia, Regression analysis, ANOVA, t-test.
Page 14
1
CHAPTER 1
INTRODUCTION AND BACKGROUND
This chapter presents the background of the study, which highlights the problem statement, aim
and objectives, justification and significance of the research. Additionally, scope and limitations
of the study are presented.
1.1 Introduction
The nature of service being essentially intangible, perishable, inseparable and highly variable
makes service marketing a challenging task (Grönroos, 1990; Sanjay & Gupta, 2004). Both
marketing researchers and service marketers should take into consideration the peculiar nature of
service while attempting to address service quality issues (William, Taylor & Jayawordena,
2003; Barbara & Pamela, 2004; Kotler & Armstrong, 2006).
Service quality as defined by Parasuraman, Zeithaml and Berry (1988:16) is ―a global judgment
or attribute relating to the superiority of service‖. Since customers are always looking for
consistently superior service the marketer should fulfill their expectations irrespective of the
variability nature of service. The delivery of consistent service quality creates brand
differentiation (Konstantinos, Nikos & Dimitri, 2002), enhances brand image (Jay & Dwi, 2000;
Jing & Andrew, 2009), adds to the competitive advantage of the firm (Riadh, 2009a), improves
customer satisfaction (Fiju, Frenie & Sid, 2004), positively contributes to customers‘ value
(Shahin & Reza, 2010), and increases the likelihood of favorable behavioral intentions of
Page 15
2
customers towards the brand in terms of revisit and positive WOM recommendations (Riadh,
2009a).
Customer satisfaction, on the other hand, has long been recognized, in marketing thought and
practice, as a central goal, realization of which is important for all business activities
(Chaniotakis & Lymperopoulos, 2009). It is described as customers‘ evaluation of the service
encounter based on their expectation and actual performance (Tse & Wilton, 1988), and has been
considered as the extent to which a product/service experience meets customers‘ expectation
from the same. When the actual service experience meets customer‘s prior expectations, he/she
will be satisfied and if it fails to meet the expectations, he/she would be dissatisfied (Gilbert et
al., 2004).
According to Ueltschy et al. (2007), different customers express different levels of satisfaction
for the same or similar service encounters due to the fact that customer satisfaction is evaluated
based on individual‘s perceptions (on service delivery/quality and past experience). Therefore,
measuring customer satisfaction/dissatisfaction is crucial because of its effect on the expectations
of one‘s next purchase decision (Sanchez-Gutierrez, Gonzalez-Uribe & Coton, 2011).
Moreover, attaining customer satisfaction is linked with the delivery of quality service (Brown
& Swartz, 1989; Francosis, Jeremilo & Mulki, 2007; Raidh, 2009b), and leads to high business
performance (Morgan, Anderson & Mittal, 2005). As a result, customer-perceived service
quality has been given increased attention owing to its specific contribution to develop satisfied
customers and business competitiveness (Enquist, Edvardsson & Sebhatu, 2007).
Page 16
3
The other construct, customer value is the outcome of the customer‘s comparison of the benefits
acquired from a service encounter with the costs incurred (to acquire the same). Perceived-value,
on the other hand, is the value that customers perceive to receive or experience by using a service
as a trade-off between benefits and sacrifices (Sandstrom et al., 2008). Negi (2010) focused on
perceived value drivers by including positive emotional aspects, which traditionally have not
been included in other studies (like Bettman, Luce & Payne, 1998; Koutouvalas, Siomkos &
Mylonakis, 2005; and Sandstrom et al., 2008).
Additionally, behavioral intention of a customer explains the likelihood of her/his engagement in
certain behaviors like WOM and repurchase (Jani & Han, 2011), and signals to whether a
customer will remain with the company (Zeithaml & Bitner, 2001). Extant research views
behavioral intentions as the intention to revisit/repurchase (Spreng, Harrell & Mackoy, 1995; Ok,
Back & Shanklin, 2007) and their willingness to provide positive/negative WOM.
Studies like Ok, Back and Shanklin (2007), Yuan and Jang (2008), Han and Ryu (2009) and Ryu
and Han (2010) have found that customer satisfaction is critical to revisit/repurchase intention.
Also, customer satisfaction/dissatisfaction affects WOM communication (Mangold, Miller &
Brockway, 1999; Swanson & Kelly, 2001; Ryu & Han, 2010; Negi, 2010).
However, to investigate the interrelationships among service quality, customer satisfaction,
perceived-value and behavioral intentions, most commonly used approaches include the Theory
of Reasoned Action (TRA) and Theory of Planned Behavior (TPB) (Armitage & Conner, 2001;
Sutanto, 2009; Jani & Han, 2011; Malik, 2012). Both theories explain how human behaviors are
Page 17
4
guided by their rational intentions (Ajzen 1970; 1985), the way individual intentions drive
behaviors influence, and the extent of commitment devoted on a particular behavior (Armitage &
Conner, 2001). Accordingly, behavioral intentions of customers to revisit a service provider and
recommend the brand to others are strongly linked with the perceived service quality (Riadh,
2009a), and consequential value and satisfaction (Chen et al., 2011; Som et al., 2012; Wen et al.,
2012).
Though, the extent of influences of service quality on cutomer satisfaction, value and behavioral
intentions are varied across the sectors/industries (Konstantinos et al., 2002; Riadh, 2009b;
Sutanto, 2009; Edward & Sandev, 2011; Lertwannawit & Gulid, 2011; Malik, 2012). For
example, while service quality is found contributing directly to behavioral intentions (Kuruuzum
& Koksal, 2010) in hospitality industry, studies like Khan, Latifah and Kadir (2011) and
Wardhana, Rustandi and Syahputra (2014) used perceived-value and satisfaction to determine
behavioral intentions in other service contexts.
Hotel services, by their very nature, demand contextualization for perceived service quality
construct (Hokey et al., 1997; Micheal, 2003; Halil et al., 2005a; Jani & Han, 2011; Malik, 2012;
Osarenkhoe, 2014; Naderian & Baharun, 2015), and within hospitality industry, hotels are
experiencing an ever increasing demand for service improvements from their customers
(Thanika, 2004; Barbara et al. 2004; Clemes, Gan & Ren, 2011). Moreover, hotel customers are
continuously looking for better value for their money in order to revisit and to recommend it to
others (Olive et al., 1996; Liana et al., 2005).
Page 18
5
1.2 Context and Background of the Study
The history of hotel sector in Ethiopia goes back to 1905, when Empress Taitu established the
first Ethiopian hotel, which was later named after her, ‗Taitu hotel‘ (Bahiru, 1991). Though, the
development of hotel sector in Ethiopia is appeared to be gradual. Particularly, during the
socialist ‗Derg‘ regime (1975-1991), private ownership of properties was discouraged, which
caused only hand count tourist standard hotels (to be found) at that time. The encouragement to
the free market economy in 1991 has created promising opportunities for private businesses
(Bahiru, 2002), which resulted in the construction of more number of private hotels with
relatively better standards and star ratings, to further support the developing tourism industry of
the nation.
The year 2007, being the ‗Ethiopian Millennium‘, has witnessed a large number of star hotels
came into existence to accommodate guests coming to celebrate the event (Ebisa & Andualem,
2013). Consequently, the receipt from tourism increased by 28%, whereas the number of hotels
grew by 17% during 2010-2012 (MoCT, 2013a); making the tourism industry to contribute
2.29% of the Ethiopian GDP, while employing around 700,000 people (MoCT, 2013b).
However, Addis Ababa, being the center of African Union (AU), United Nations Economic
Commission for Africa (UNECA), and the diplomatic hub of Africa, is attracted more investors
to the hotel industry, in general. Also, due to its cosmopolitan nature, Addis Ababa attracts
largets visitors/guests with diverse demographic and cultural backgrounds; there remain concerns
to the quality of services being provided by most of the star hotels to satisfy their international
customers (Ebisa & Andualem, 2013).
Page 19
6
Even though, attempts are made by the MoCT (2013a) to evaluate the satisfaction level of
tourists with service deliveries by the star hotels, not much attention is given by researchers to
study the apparent link between service quality and associated variables (like customer
satisfaction, value and behavioral intentions) in the Ethiopian hotel sector. Also, the service
quality measurement tools used by different studies are found lacking consistency and scientific
regior (MoCT, 2006; 2010). Though, the apparent link between tourism industry, hotel sector
and the economy as a whole suggests that much attention is required to further develop the hotel
businesses in Ethiopia.
Accordingly, the MoCT has been trying to develop a comprehensive criteria and more
demanding standards to assign star ratings for hotels, and since 2011 it has temporarily
suspended the provision of star ratings to the hotels in the country (MoCT, 2011). This leads to
the hotels in Ethiopia to be more vigilant (than ever before) about their service quality to
adequately address any market opportunity or challenge.
Some of the opportunities for the Ethiopian hotel sector, as identified by MoCT (2010, 2013a,
2013b), are presented hereunder:
Government support to the tourism industry in general and hotel sector in particular (through
the provision of tariff exemption for hotel equipments and machineries, and priority access
to land in cities);
Increasing flow of tourists; and
Growing demand of hotels due to increasing conferences and tourism activities in Addis
Ababa being the diplomatic hub of Africa.
Page 20
7
Also, the major challenges witnessed by the MoCT (2010; 2011) for the Ethiopian hotel sector
include:
Availability of more and better substitutes hotels that put customer‘s loyalty at stake;
In the presence of growing demand, the status quo (of market share) is disturbed, as some old
hotels are losing their market shares for the new entrants;
The market is becoming dynamic, as lots of options are available whereby customers tend to
look for the one that provides maximum value for their money, which is leading to the price
competition among the hotels; and
The proposed requirements set by the MoCT for hotels‘ star ratings are appeared to be
challenging, as it demands substantial investment in facilities and improved skills.
Today, as it is the case with global hospitality industry, customers are having more options to
switch to and better assessment of service to compare across (Barbara & Pamela, 2004), which
makes them demanding higher quality services than ever before (Gavin & Philip, 1997). As a
result, delivering higher level of service quality has become a matter of survival and not just
leisure any more (Micheal, 2003; Jing & Andrew, 2009; Asad & Tim, 2010; Papadimitriou,
2013). Moreover, as the tangible attributes of service can be easily imitated by competitors and
are set as prerequisite by the regulators, possession of modern facility and equipments alone
would not produce competitive advantage (Konstantinos, Nikos & Dimitri, 2002), at least in the
hotel sector (Halil & Kashif, 2005a).
In addition, the applicability of service quality measurement tools is found to be subjective to
different research (culture, industry etc.) contexts (Riadh, 2009a; Daniel & Berinyuy, 2010; Raza
Page 21
8
et al., 2012). As a result, researchers like Gavin et al. (1997), Barbara et al. (2004), Asad et al.
(2008), and Lee, Lee and Joo (2015) emphasized the importance of understanding the
interrelationships of service quality dimensions in sector specific context, and the way service
quality determines customer satisfaction, perceived-value and behavioral intentions in specific
contexts (like hotel sector).
Such attempts of examining context specific relationships, by capturing both theoretical and
contextual variables, play pivot role in the development of the sector. Therefore, this study
attempts to investigate the relationship of service quality, customer satisfaction, value and
behavioral intentions in addition to test the applicability of SERVPERF approach in the context
of hotel sector in Ethiopia.
1.3 Statement of the Problem
Studies in service management have been acquiring attention by researchers in hospitality
industry (Halil & Kashif, 2005a; Riadh, 2009a; Shahin & Reza, 2010; Raza et al., 2012).
Researchers have explored the context of service quality and relationships between service
quality and variables like customer satisfaction and behavioral intentions (Cronin, Bradly &
Hult, 2000; Marco, 2001; Konstantinos, Nikos & Dimitri, 2002; Maria, Lorenzo & Antonio,
2007; Francosis, Jeremilo & Mulki, 2007; Raidh , 2009b; Kasim & Abdullah, 2010; Jani & Han,
2011; Basher, 2012; Simon, 2012). However, limited is known about the mediating role that
variables like perceived-value and customer satisfaction play in relating service quality and
behavioral intentions.
Page 22
9
For example, it has been argued that consumer behavior (intention) is better understood when
analyzed through perceived-value and customer satisfaction (see behavioral theories like TRA
and TPB). Thus, evaluating only service quality and satisfaction in determining behavioral
intentions may be incomplete (Gallarza & Saura, 2006). Despite of this understanding, models of
the relationship between service constructs and behavioral intentions are often proposed without
the inclusion of perceived-value and customer satisfaction (Dabholkar, Thorpe & Rents, 1996;
McDougall & Levesque, 2000). Therefore, inclusion of perceived-value and customer
satisfaction as a mediator between service quality and behavioral intentions will bring about a
more comprehensive understanding.
Furthermore, while significant work has been done in other sectors, empirical evidence of the
relationship among these constructs in the hotel sector is limited. Moreover, there appeared to be
disagreement on research findings related to the conceptualization and relationship between
aforementioned constructs across the sectors (Chatura & Neely, 2003; Bedi, 2010; Kitapci et al.,
2013; Cho, Byun & Shin 2014).
In line to this, Pollack (2008) challenged the assumption of the classical linear relationship
between service quality attributes and other constructs like customer satisfaction being
applicable to service sectors (like banking, hairdressing and telephone), and suggested the
existence of a threshold level after which the strength of the relationship between the two
constructs changes for some service attributes.
Page 23
10
On the part of conceptualization of service management constructs and suitability of the
tools/approaches to measure service quality, scholars like Francis (1995), Marco (2001),
Francosis, Jeremilo and Mulki (2007) and Riadh (2009b), propose different tools for the
measurement of service quality. However, popular approaches remain the SERVQUAL
(Parasuraman, Zethaml & Berry, 1988) and the SERVPERF (Cronin & Taylor, 1992). Thus,
universal applicability of the service quality measurement tools, across different industries, is
questionable (Hokey & Hyesung, 1997; Konstantinos, Nikos & Dimitri, 2002; Thanika, 2004;
Gilbert & Celeopatra, 2006; Wen, 2012; Tsitskari, Antoniadis & Costa 2014). In addition, a
service quality gap (as shown in SERVQUAL approach) may exist even when a customer has
not yet experienced the service but learned through WOM, advertising or other media. Thus,
there is a need to incorporate the potential customer‘s perceptions of service quality offered as
well as actual (experienced) quality of service.
Moreover, paying attention on customers‘ socio-demographics (e.g., culture, nationality, age,
gender etc.) is necessary from the perspective of developing marketing strategy (Ramanathan &
Ramanathan, 2011; Wen et al., 2012; Abubakar, Mokhtar & Abdullateef, 2013; Amin et al.,
2013; Jani & Han, 2013). By considering that hotel sector in Ethiopia is experiencing fast
expansion and accommodating international guests (with varying cultures and preferences),
hardly any attempt has been made to explore the way their socio-demographics and hotel‘s
characteristics relate with service constructs (like satisfaction) and behavioral intentions.
In the light of above, one can see that there remained a strong basis to carry out a research that
empirically develop and test a conceptual model to explain the influence of service quality on
Page 24
11
customer satisfaction, perceived-value and behavioral intentions, and examines the way guest‘s
profile variables (e.g., gender, nationality etc.) and hotel characteristics (e.g., location, star rating
etc.) relate to these constructs. Specifically, this study attempts to seek answer to the questions
like how service quality influences customer satisfaction, perceived-value and behavioral
intentions to revisit and provoke positive WOM communication by hotel‘s guests? And what
role do customer‘s profile and hotel‘s characteristics play in determining guests‘ perceptions of
these constructs in the hotel sector?
1.4 Research Questions
1.4.1 Main Research Question
How does service quality influence customer satisfaction, value and behavioral intentions, and to
what extent these constructs are associated with the guest‘s socio-demographic profile and
characteristics of the hotels in Ethiopia?
1.4.2 Specific Research Questions
i. What are the dominant factors that determine the service quality perceptions of hotels‘
customers/guests in Ethiopia?
ii. What is the overall level of customer-perceived service quality, value and satisfaction
with the star category hotels in Ethiopia?
iii. How does service quality influence perceived-value, satisfaction and behavioral
intentions of the star hotels‘ guests in Ethiopia?
iv. What role do perceived-value and satisfaction play in service quality-behavioral
intentions relationship in the Ethiopian hotel sector?
Page 25
12
v. How do the levels of perceived service quality, customer value, satisfaction and
behavioral intentions vary across the guest‘s and hotel‘s profiles?
1.5 Aim and Objectives of the Study
1.5.1 The Aim of the Study
The main aim of this study was to examine the influence of service quality on customer
satisfaction, customer value and behavioral intentions in the Ethiopian hotel sector, along with
determining the extent to which these constructs are related to guests‘ profile and the hotels‘
characteristics.
1.5.2 Specific Objectives of the Study
i. To examine the factors that determines guests‘ perceptions of service quality in the
Ethiopian hotel sector.
ii. To determine the overall level of perceived service quality, value and satisfaction with
star category hotels in Ethiopia.
iii. To scrutinize the relationship between perceived service quality, value, customer
satisfaction and behavioral intentions in the Ethiopian hotel sector.
iv. To assess the mediating role of perceived-value and satisfaction in the relationship
between service quality and behavioral intentions in the Ethiopian hotel sector.
v. To examine the effect of guests‘ socio-demographic profile on quality perceptions, value,
satisfaction and behavioral intentions in the Ethiopian hotel sector.
vi. To compare the differences in the levels of perceived service quality, value, satisfaction
and behavioral intentions across the hotels‘ characteristics (e.g., star ratings etc.).
Page 26
13
1.6 Justification of the Study
Competition in service delivery and rising customer expectations have made firms attempting to
satisfy their customers and enhance repurchases by them. By considering that almost all firms
depend on repeat business, a strong interest in researching service marketing constructs (e.g.,
service quality and customer satisfaction) and their relationship with behavioral intentions has
much evolved over the past decade (Konstantinos, Nikos & Dimitri, 2002; Francosis, Jeremilo &
Mulki, 2007; Kasim & Abdullah, 2010; Jani & Han, 2011; Simon, 2012) both in academic and
professional domains.
Researchers like Lee, Yoon and Lee (2007), Nowacki (2009) and Zabkar et al. (2010) have
explored the relationships between service quality and variables like price, productivity,
customer satisfaction, profitability and behavioral intentions, though empirical evidence of such
relationships in the hotel sector is limited. In line to this, McDougall and Levesque (2000)
reported that perceived-value has a significant influence on customer satisfaction. Hence, its
inclusion brings about a more comprehensive model relating service quality with customer
satisfaction and behavioral intentions.
While some researches (e.g., Konstantinos, Nikos & Dimitri, 2002; Festus, Maxwell & Godwin,
2006; Maria, Lorenzo & Antonio, 2007; Micheal et al., 2009; Raza et al., 2012) indicate that
service quality contributes to customer satisfaction, perceived-value and behavioral intentions (of
revisit and positive WOM recommendations), there remain arguments that such relationships are
not direct and remain speculative across various service sectors (Riadh, 2009a; Negi, 2010;
Daniel & Berinyuy, 2010; Lee, Lee & Joo, 2015). Therefore, it is very imperative to understand
Page 27
14
the nature of service marketing constructs, their interrelationships, and the way these influence
behavioral intentions to repeat purchase and provoking positive WOM across different sectors
(like hotel).
Also, consideration of customers and hotels characteristics is deemed essential to understand the
differences in customers‘ perceptions of the service constructs (e.g., customer satisfaction and
value) and behavioral intentions, which could be used in developing better marketing strategies.
This study, on one hand, aids in identifying a way to examine service quality, customer
satisfaction, value (as perceived by the guests/customers of the hotels) and behavioral intentions
to revisit and positive WOM, on the other hand, it contributes towards understanding the
relationships among the stated constructs in the hotel sector of Ethiopia.
1.7 Significance of the Study
This research, primarily, contributed to better understand the relationship of service quality with
customer satisfaction, customer value and behavioral intentions in the context of three, four and
five star hotels in Ethiopia. The study made significant contribution to the existing body of
knowledge by empirically testing the influence of service quality on the other stated constructs,
while identifying the service quality gaps that the star category hotels should fill to overcome
customer dissatisfaction and negative WOM communication (by their customers). In general, the
study contributed to the hotel management and service marketing literature through the
conceptualization of formative service quality construct, while proposing a valid and reliable
scale for assessing service quality in the hotel sector. This helped in overcoming the weaknesses
Page 28
15
identified by Brady and Cronin (2001) and Zabkar et al. (2010) in the conceptualization of
quality as a reflective construct.
Additionally, the findings of this study contributed to the services marketing theory, by
providing additional insights into the dimensions of service quality, satisfaction, value and
behavioral intentions, as applicable to the developing markets, to assist hotel management to
develop and implement market-oriented strategies. Besides, the research included star (three,
four and five) category hotels to make comparisons of guests‘ perceptions on service quality,
satisfaction, value and behavioral intentions across socio-demographics (gender, nationality etc.)
and hotel characteristics (location, star rating etc.). This would further pave the path to strategize
service deliveries (across individual dimensions) by the hotels, according to their profiles and
that of their customers, to ensure higher customer satisfaction, perceived-value and behavioral
intentions exhibited through customer revisits and positive WOM.
The combined effect of these contributions would mean more demand for the hotel services in
the nation, which in turn, would provide prospects for potential hotel investors, increasing
revenue to the economy and employment opportunities for the citizens. Also, the study identified
certain standards that are to be maintained by the hotels, as perceived important by their
customers, from the service delivery perspective, and practical tools to measure the quality and
value associated with their services, including the relative contribution of service quality
dimensions to customer satisfaction and behavioral intentions. Finally, the research identified
managerial implications of the findings and making recommendations pertaining to resource
Page 29
16
management and marketing strategies to help develop a viable basis for increasing
guests/customers inflow to the Ethiopian star category hotels.
1.8 Delimitations/Scope of the Study
The study empirically tested a model of perceived (service) quality as a formative construct and
the relationship between service quality, customer value, satisfaction and behavioral intentions,
while concentrating on three, four and five star hotels in Ethiopia. Therefore, the scope of the
study was limited to quantitatively measure the effect of service quality on customer value,
satisfaction and behavioral intentions (in the form of customer revisits and WOM), while
covering both the domestic and international guests/customers to the three, four and five star
hotels in Ethiopia.
Furthermore, the study presented with a sketch of hotels‘ guests/customers profile by examining
their age, gender, nationality, purpose of visit etc., along with describing the characteristics of
the corresponding hotels in terms of location, star ratings etc. to determine their influence on the
study constructs (service quality, customer value, satisfaction and behavioral intentions). In
terms of geographic scope, the study was carried out in the specified star category hotels located
in Addis Ababa, Dire Dawa, Nazereth, Debrezieth, Bahir Dar and Hawassa cities of Ethiopia.
Finally, a survey using structured (self-administered) questionnaire was administered for three
months, between November 2013 and January 2014, in the specified category hotels, for the
purpose of primary data collection.
Page 30
17
1.9 Organization of the Thesis
This thesis is organized into six (6) chapters. Chapter 1 provides the background and overview of
the study by outlining the research problem, questions and associated objectives. Additionally,
justification, significance, and scope of the study are presented.
Chapter 2 reviews the literature in detail on the conceptualization and interrelationships of the
study constructs (service quality, perceived-value, customer satisfaction and behavioral
intentions) in the light of relevant theories and empirical evidences. Finally, a conceptual
framework is presented along with the associated hypotheses drawn based on the proposed
model.
Chapter 3 outlines the detailed research methodology pertaining to the research approach,
sampling method, sample size determination, data collection instruments and approach.
Additionally, data analysis techniques and ethical considerations are presented in this chapter.
Chapter 4 presents the research findings in the light of data analysis. More specifically, test for
normality, descriptive and regression analyses, and other inferential analysis are presented in
order to test the proposed hypotheses and to achieve the stated research objectives.
Chapter 5 illustrates detail discussion on the findings presented in the previous Chapter (4) and
draws conclusion in light of the research findings. Finally, Chapter 6 presents implications to
various stakeholders, along with the study limitations and directions for future research.
Page 31
18
1.10 Summary of the Chapter
This chapter discussed the introduction and background of the study. Further, the research
problem has been introduced along with the research questions. Additionally, the aim and
objectives of the study, justification for the research, significance and delimitations/scope of the
study have been discussed.
In the next chapter, theoretical framework and conceptualization of the study constructs: service
quality, customer satisfaction, customer value and behavioral intentions are presented in detail.
Additionally, knowledge gaps are revealed, pertaining to the research area, in the light of
literature reviewing empirical relationships among the study constructs, to help developing a
conceptual framework and formulation of the hypotheses.
Page 32
19
CHAPTER 2
LITERATURE REVIEW AND THEORETICAL BACKGROUND
This chapter presents the theoretical framework of the study by reviewing the literature in the
domain of service quality, customer value, satisfaction and behavioral intentions. Additionally,
description of the research constructs and their interrelationships are explored to develop the
conceptual framework and associated hypotheses. Specifically, the first part of the Chapter
presents various theories guiding the research and introduces study constructs. Second part
reviews relevant literature to explore the relationship among service quality, perceived-value,
customer satisfaction and behavioral intentions, across different sectors/settings, to support
theoretical research framework for the study. Accordingly, the final part presents a conceptual
framework and related hypotheses to test.
2.1 Theoretical Framework
2.1.1 Characteristics of Service
Service includes all economic activities the outputs of which are not physical products or
construction, but generally consumed at the time it is produced, and provides added value in
forms (e.g., convenience, amusement, timeliness, comfort or health) that are essentially
intangible concerns of its first purchaser (Zeithaml & Bitner, 2001). Firms attempt to distinguish
their offerings (products) from those of their competitors by providing good service and/or
making services more tangible by offering products as part of the overall package.
Page 33
20
Berry (1980) distinguished between services and goods and argued that, services are acts, deeds,
performances or efforts, whereas, goods are articles, devices, materials, objects, or things.
However, by considering that most businesses (including hotels) and their activities/offerings
consist of both goods and services, any distinction between products and services is no longer
explicit (Osarenkhoe & Bennani, 2007).
For the purpose of analysis, a service may be considered in three different ways: i) as a process;
ii) as a solution to customers‘ problems; and iii) as a beneficial outcome for customers. Grönroos
(1990:27), defined service as ―an activity or series of activities of more or less intangible in
nature that normally, but not necessarily, take place in interactions between the customer and
service employees and /or systems of the service provider, which are provided as solutions to
customer problems.‖
The second perspective (service as a solution to customers‘ problems) views services as provider
of solutions to customers‘ problems. From this perspective, service is conceptualized as an
activity of an intangible nature that usually takes place during the interaction between the
customer and service employees to provide solutions to customers‘ problems (Grönroos, 2001).
The final perspective (service as a beneficial outcome) suggests that service is the main function
of business enterprises: it is an application of specialized competences (knowledge and skills)
through deeds, processes, and actions for the benefit of another entity or the entity itself (Vargo
& Lusch, 2004).
Page 34
21
Furthermore, Sanjay and Gupta (2004) described the nature of service as essentially intangible,
perishable, inseparable and highly variable.
i. Services are Intangibles: It cannot be seen, tasted, felt, heard or smelt before purchase. It
is an abstraction that cannot be examined prior its purchase (Adrian, 1998). Since
services are intangible and cannot be sensed before purchase and consumption, it
gives little or no chance for pre purchase trail to customers. Hence, service marketers
have to use the tangible elements of service (like facility, equipment, furniture etc.)
for promotion so that customers can infer quality service.
ii. Services are Inseparable: it involves simultaneous production and consumption. It is not
possible to separate service from service provider. Inseparability of service leads
customer to being co-producers of the service with other consumers and having to
travel to the point of service production (Sanjay & Gupta, 2004). Inseparability
usually makes the service provider and the customers to have physical contact, which
gives lower chance for the service provider to correct service failures before they are
perceived by customers (Barbara & Pamela, 2004).
iii. Variability of Services: Variability of service means that the quality of services depends
on who provides them, as well as when, where, and how they are provided (Kotler &
Armstrong, 2006). Since services vary across context, this poses challenge to service
marketers to deliver standard quality all the times and in every situation. Service
quality thus, has to be pre-planned continuously monitored and periodically reviewed
(William, Taylor & Jayawordena, 2003).
iv. Services are Perishables: This implies that services cannot be produced and stored for
later use. The customers should be presented while the service is being produced to
Page 35
22
get served otherwise it will perish or cannot be produced at all. Service production
takes resources and if what is produced is not sold and cannot be stored, it results in a
loss. On the other hand, if the resources are not devoted and the service is not ready
when customers show up, it will cause dissatisfaction due to longer waiting time and
poor service quality.
2.1.2 Conceptualizing the Service Quality
Over the past two decades, service quality became major area of attention to both academicians
and practitioners (Cronin & Taylor, 1992; Newman, 2001), as customers‘ willingness to
maintain a relationship with a firm is contingent upon their perception of the benefits and values
of the firm‘s high-quality service (Nikos & Dimitri, 2002; Wen, 2012; Cho, Byun & Shen,
2014). Indeed, many empirical researchers have confirmed the positive impact of service quality
on a variety of behavioral outcomes, such as customer satisfaction, perceived-value and
behavioral intentions (e.g., Cronin, Bradly & Hult, 2000; Konstantinos, Chatura & Neely, 2003;
Gilbert & Celeopatra, 2006; Bedi, 2010; Wen et al., 2012; Kitapci et al., 2013; Tsitskari,
Antoniadis & Costa 2014).
Service quality is described as the comparison that customers make between their expectations
about a service and their perceptions of the actual service performance. According to Lewis and
Boom (1983), service quality is a measure of how well the service level delivered matches
customer expectations. To measure the quality of intangible services, researchers generally use
the term ‗perceived-service quality‘, which is a result of the comparison of perceptions about
service delivery process and actual outcome of service. Thus, customer expectations (before
Page 36
23
purchasing any service) and quality performance (as perceived by customers) are important
factors in order to determine perceived service quality. As a result, an assessment process will be
experienced if the perceived service quality meets or does not meet consumer expectations.
Moreover, a number of researchers have examined the service quality construct in different
contexts and developed different types of measures/models to help in defining, measuring and
improving understanding of the construct. While some studies focused on general models (e.g.,
Cronin & Taylor, 1992; Grönroos, 1988; Parasuraman, Zeithaml, & Berry, 1988), others
developed and revised models for particular industries (Caro & Garcia, 2007).
Perception of quality in the service context can be studied from customer or service provider
perspectives. Exploring these two perspectives, researchers have noted that gaps do exist in the
perception of quality between providers and consumers, which ultimately, underlines the
necessity of studying quality from the viewpoint of the consumers (as they decide which product
to consume). This has been called the ‗perceived quality‘ approach (Garvin, 1984).
The commonly cited definition for service quality is the one put forward by Parasuraman,
Zeithaml and Berry (1988:16) denoting service quality as ―a global judgment or attribute relating
to the superiority of service.‖ Later, they stated it as a gap between the customer‘s expectation
and the service received, whereby expectation becomes a major influence on the way the
characteristics of service will be perceived and consequently influences the resultant level of
satisfaction derived from the service delivery.
Page 37
24
Based on this, service quality is considered as the extent to which a customer‘s expectation and
delivered service are similar or different. However, theoretical underpinnings of most definitions
of perceived quality have not been clearly formulated (Stenkamp, 1990). Gummesson (2003)
stated that customers as information processors commonly employ confirmation/disconfirmation
paradigm to operationalize service quality. While Rayka, Anneke and Ross (2005) stated that
service quality is determined by its fitness for use by internal and external customers.
These definitions imply the existence of already established standard towards which the
performance fits or above which the performance exceeds. The other inference which might be
taken from these definitions is that in order to determine whether or not service performance fits
the standards, it has to be measured. Accordingly, Kenneth and David (2003) suggested three
important principles to be considered while discussing service quality:
The evaluation of service quality is more difficult for customers than the evaluation of
quality of goods
Service quality is based on consumers‘ perception of the outcome of the service and their
evaluation of the process by which the service was performed
The perception of service quality results from a comparison of what the consumer
expected before the service and the perceived level of service received
Earlier service quality models emerged in the 1980s. The Grönroos (1988) model suggested two
service quality dimensions- functional quality and technical quality, as antecedents to corporate
image- the third dimension of the model. Technical quality is what the consumers receive as a
Page 38
25
result of interaction with a service organization, while functional quality is concerned with how
consumers receive services. The model identified six sub-dimensions of service quality as:
i) professionalism and skills; ii) attitudes and behavior; iii) accessibility and flexibility;
iv) reliability and trustworthiness; v) recovery; and vi) reputation and credibility (Figure 2.1).
While professionalism and skills are regarded as contributing to the technical quality, the
dimension of reputation and credibility forms an image. The other four sub-dimensions are
related to process, and correspond to the functional quality dimension. In addition to this
perspective describing service quality with two or three dimensions, the model conceptually
introduces the approach based on the ‗disconfirmation theory‘: actual service quality is compared
to the level of expectations (Lehtinen & Lehtinen, 1991).
Figure 2.1: Grönroos’ Perceived Service Quality Model (Source: Grönroos, 1988)
In Grönroos‘ Perceived Service Quality model, expectations are the function of market
communications, image, Word-Of-Mouth (WOM), and consumer needs and learning, whereas
experience is a product of technical and functional quality that is filtered through the image. The
Page 39
26
model demonstrates that the supplier can affect both sides of the gap by managing customer
expectations. Also, it illustrates that the customer experience is a product of the image of
supplier quality, not just the actuality.
According to the SERVQUAL model (Figure 2.2), service quality is the difference between
expected level of service and customer perceptions of the level received (Parasuraman et al.,
1985, 1988). In order to develop the SERVQUAL measurement scale, Parasuraman et al. (1988)
formulated questions for rating a service on specific attributes reflecting the ten basic
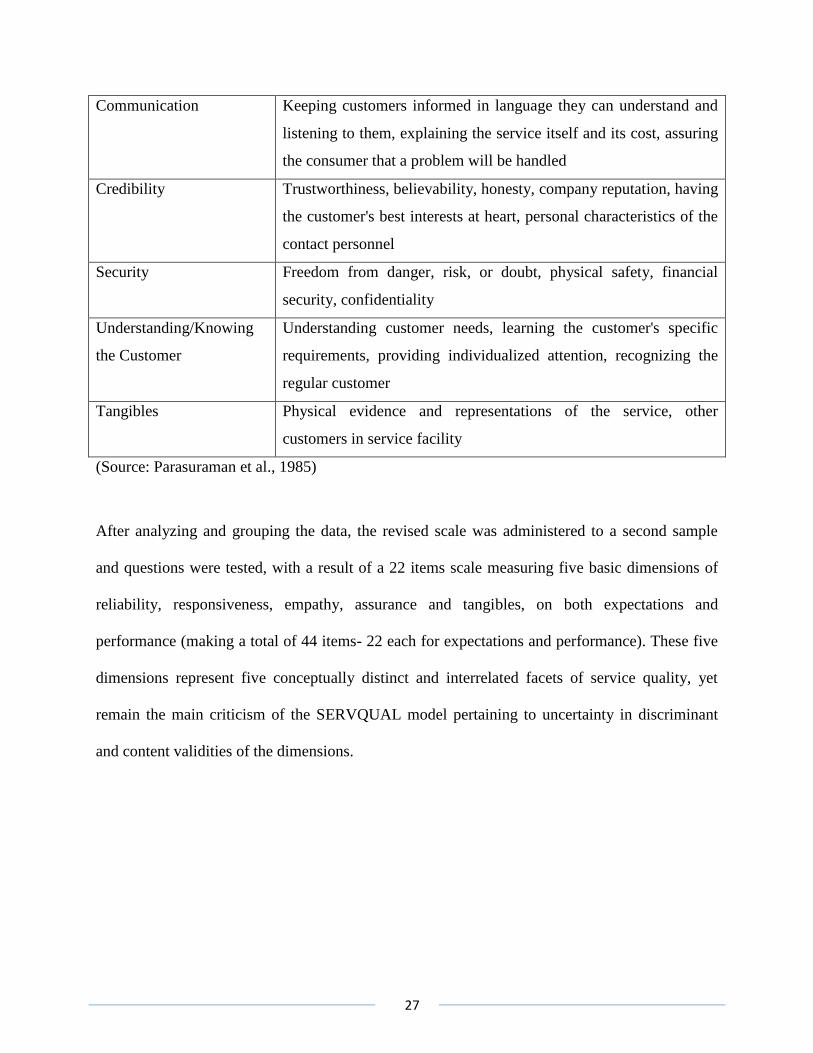
components/determinants (see Table 2.1). Consumers were asked to rate the service in terms of
both expectations and performance.
Table 2.1: Determinants of Service Quality
Component Definition
Reliability Consistency of performance and dependability, accuracy in billing,
keeping records correctly, performing the service right at the
designated time
Responsiveness Willingness or readiness of employees to provide service,
timeliness of service such as mailing a transaction slip immediately,
calling the customer back quickly, giving prompt service
Competence Possession of the required skills and knowledge to perform the
service, knowledge and skill of the contact and support personnel,
research capability of the organization
Access Approachability and ease of contact, the service is easily accessible
by telephone, waiting time to receive service is not extensive,
convenient hours of operation, convenient location of service
facility
Courtesy Politeness, respect, consideration, friendliness of contact personnel,
consideration for the consumer's property, clean and neat
appearance of public contact personnel
Page 40
27
Communication Keeping customers informed in language they can understand and
listening to them, explaining the service itself and its cost, assuring
the consumer that a problem will be handled
Credibility Trustworthiness, believability, honesty, company reputation, having
the customer's best interests at heart, personal characteristics of the
contact personnel
Security Freedom from danger, risk, or doubt, physical safety, financial
security, confidentiality
Understanding/Knowing
the Customer
Understanding customer needs, learning the customer's specific
requirements, providing individualized attention, recognizing the
regular customer
Tangibles Physical evidence and representations of the service, other
customers in service facility
(Source: Parasuraman et al., 1985)
After analyzing and grouping the data, the revised scale was administered to a second sample
and questions were tested, with a result of a 22 items scale measuring five basic dimensions of
reliability, responsiveness, empathy, assurance and tangibles, on both expectations and
performance (making a total of 44 items- 22 each for expectations and performance). These five
dimensions represent five conceptually distinct and interrelated facets of service quality, yet
remain the main criticism of the SERVQUAL model pertaining to uncertainty in discriminant
and content validities of the dimensions.
Page 41
28
Figure 2.2: SERVQUAL Model (Source: Parasuraman et al., 1988)
Critique to the SERVQUAL model led to the emergence of the SERVPERF model (Figure 2.3)
proposed by Cronin and Taylor (1992). Unlike SERVQUAL, SERVPERF is a performance-only
measure of service quality (using only 22 performance related items). Cronin and Taylor (1992)
suggested that long-term service quality attitudes are better reflected by performance-based
measures only. The performance-based model of service quality was initially tested in four
industries and was found explaining more of the variance in the overall measure of service
quality than SERVQUAL.
Figure 2.3: SERVPERF Model (Source: Cronin & Taylor, 1992)
Additionally, Mehta, Lalwani and Han (2000) concluded that while modified SERVQUAL
worked better in a retailing context where there was a greater focus on the product, SERVPERF
worked better in a retailing context where the service element is more important (i.e., an
Page 42
29
electronic goods‘ retailer). Carrillat et al. (2007) employed meta-analysis in their study findings,
which suggested that both scales (SERVPERF and SERVQUAL) are adequate and equally valid
predictors of overall service quality. However, the authors believe that the SERVQUAL scale
could be of greater interest for practitioners due to its richer diagnostic value (i.e., comparing
customer expectations of service versus perceived service across dimensions), but there is less
need to adapt the measure to the context of the study in the case of SERVPERF than
SERVQUAL.
Rust and Oliver (1993) developed a three-component model of service quality that focuses on the
relationships between service quality, service value and customer satisfaction (Figure 2.4).
Figure 2.4: Three-Component Model (Source: Rust and Oliver, 1994)
The model included service product, service delivery, and service environment as three
determinants of service quality. The service product element consists of what consumers get as a
result of service (i.e., outcome) and also of the consumer‘s perception of the service. The service
delivery element stands for the consumption process with any relevant events that occur during
the service act. The service environment element represents the internal and external atmosphere
in which a service takes place. However, Rust and Oliver did not test their conceptualization,
which becomes its considerable limitation.
Page 43
30
Furthermore, while Dabholkar et al. (1996) expanded the concept of service quality vertically by
proposing a model of retail service quality (RSQ), horizontal expansion to the concept was
carried out by Brady and Cronin (2001). In the RSQ model (Figure 2.5), retail service quality is
viewed as a higher-order factor defined by two additional levels of attributes (the dimension and
sub-dimension levels). The RSQ model was empirically validated by Dabholkar et al. (1996)
using triangulation of research techniques- interviews with several retail customers, in-depth
interviews with six customers and a qualitative study that monitored the thought process of three
customers during an actual shopping experience. It included a 28-item scale, of which 17 items
were from SERVQUAL and 11 items were developed by using qualitative research.
Figure 2.5: Multilevel Model of Retail Service Quality (Source: Dabholkar et al., 1996)
Similar to Cronin and Taylor‘s (1992) SERVPERF, Dabholkar et al. (1996) used only
performance-based measures and found that their scale possessed strong validity and reliability
and adequately captured customers‘ perceptions of retail service quality. Dabholkar et al. (1996)
also considered that service quality is defined by and not formed by several dimensions, and this
made their conceptualization very different from previous models. The RSQ model has been
widely applied in various retail formats within various cultural contexts and has been widely
Page 44
31
replicated in various studies (Kaul, 2007; Nadiri & Tumer, 2009). However, studies like
Ravichandran et al. (2010) did not support the five-dimensional structure due to inconsistency of
the number of dimensions with the original RSQ, as well as inadequacy with reference to the
country‘s context (Kaul, 2007; Kim & Jin, 2002).
Brady and Cronin (2001) developed a model for measuring service quality. According to the
model; interaction quality that was formed by attitude, behavior, and expertise; physical service
environment quality that was constituted by ambient conditions, design, and social factors; and
outcome quality that was formed by waiting time, tangibles, and valence affect service quality.
Continual horizontal expansion by Brady and Cronin (2001) conceptualized the five dimensions
of the Dabholkar et al. (1996) model into three dimensions and proposed nine sub-dimensions
(Figure 2.6).
Figure 2.6: Hierarchical Model of Service Quality (Source: Brady and Cronin, 2001)
Page 45
32
Brady and Cronin (2001) combined the three-component model by Rust and Oliver (1993) and
the multilevel conceptualization of service quality by Dabholkar et al. (1996). The service
quality is formed by three primary dimensions: interaction quality, physical environment quality
and outcome quality. Each of these dimensions is formed by three corresponding sub-dimensions
such as attitude, behavior and experience (interaction quality); ambient conditions, design and
social factors (physical environment quality); waiting time, tangibles and valence (outcome
quality).
Brady and Cronin (2001) propose that sub-dimensions influence quality dimensions, i.e., sub-
dimensions directly contribute to quality dimensions‘ perception. However, in the
operationalization of their model, dimensions are variables that influence sub-dimensions
(Martinez & Martinez, 2010), and points out concerns about interpreting the conceptualization of
this model.
In their review of service quality models, Seth and Deshmukh (2005) stated that the following
categories of research issues related to service quality: i) relationships between various attributes
of service; ii) the role of technology (e.g., information technology); and iii) measurement issues.
Thus, the critique of Brady and Cronin‘s model by Martinez and Martinez (2010) could fall into
the first, and possibly the third, category due to the unclear direction of influence between levels
of quality. The study by Jones (2005) integrated an additional dimension of communications into
Brady and Cronin‘s structure of service quality, and the results revealed the significance of this
new dimension for overall service quality in three out of four industry samples.
Page 46
33
In an attempt to improve Brady and Cronin‘s (2001) conceptualization further, Martinez and
Martinez (2007, 2008) focused on two areas, namely, the philosophy of the service quality
measurement and the nature of causal relationships between dimensions and sub-dimensions of
service quality. They claimed that inconsistencies made the methodological legitimacy of further
replications/modifications of the model questionable while arguing that the model and its
modifications contained an implicit assumption of the dimensions as antecedents of service
quality. Having items that represent the dimensions and the overall service quality allows for the
possibility of adding new dimensions when developing the models/modification on the basis of
Brady and Cronin‘s (2001) study. Further, they proposed to use a third-order reflective
hierarchical model accounting for the hierarchy of perceptions developed by customers in
different levels of abstraction (i.e., overall service quality, dimensions and sub-dimensions), and
if changes in attitude towards overall service quality occur, there is a need to ensure that this is
captured in changes in the dimensions, sub-dimensions and observable indicators.
On the other hand, Hokey and Hyesung (1997) stated that given the intangibility of service and
the illusive nature of service quality, its measurement is a challenging task. This is perceptible in
hospitality industry, whereby the hotel service, by its very nature, demands higher level of
service quality (Michael, 2003). Within the hotel context, researchers have identified different
factors affecting customers‘ perception of service quality.
For example, Thanika (2004) studied the perceptions of tourists on hotel service quality in
Mauritius (by using modified SERVQUAL with 39 items) and identified that ‗reliability‘ is the
most important factor that affects service quality. Similarly, Asad and Tim (2010) conducted an
Page 47
34
exploratory research in India to study service quality in Luxury hotels by applying the modified
SERVQUAL with 23 items and identified that service quality is affected by hotel ambience and
staff courtesy, food and beverage (F&B) products and services, staff presentation and
knowledge, reservation services, and overall value for money, in order of their importance.
Therefore, the critical importance of service quality quests a visionary management that takes
initiatives to plan, deliver, monitor and sustain a well established system of service quality
(William, Taylor & Jayawordena, 2003; Amin et al., 2013; Tsitskari, Antoniadis & Costa, 2014).
The review of service quality models showed that there has not been enough consideration of the
country/culture specific context in which the models have been developed. However, there is
evidence that this can have implications for adaptations and/or modifications of the models for
use in different contexts (Kaul, 2007; Kim & Jin, 2002). Dabholkar et al. (1996) argued that a
measure of service quality across industries is not feasible and suggested that future research
should develop sector/industry specific measures of service quality. This argument is supported
by Ladhari (2008), who views industry-specific measures of service quality as more appropriate
than ones of a single generic scale. Also, Martinez and Martinez (2010) noted that, by definition,
attributes of service quality are not universal but industry-specific.
Thus, the focus of attributes on a particular service industry will produce a clear set of areas for
consideration and increase the relevance of practical implications for management in any
particular industry or sector therein. This will allow capturing of a meaningful picture of service
quality perceptions, providing a clear pathway for further research/model improvements and
simplifying challenge of filling the gaps in the area of perceived service quality. This goes along
Page 48
35
with the suggestion of Morales and Ladhari (2011) to utilize a holistic approach and consider
situational, contextual and structural variables related to service quality perceptions.
Moreover, service quality has multifaceted importance to a firm. The major ones include the
followings:
Differentiation: At present there is stiff competition in the hotel sector. To coup up and
win competition, the marketing manager should effectively position its brand through a
differentiated offer. As the tangible elements of service are easily imitated by competitors
the most effective differentiation strategy is offering superior quality service
(Konstantinos, Nikos & Dimitri, 2002).
Competitive advantage: A well differentiated/quality service can be the competitive
advantage of a firm. Thus, service firms like hotels shall leverage their competitive
position through quality services (Riadh, 2009a).
Customer satisfaction: Researches show there is direct and positive relationship between
service quality and customer satisfaction. This is apparent in hotels where customers are
continuously demanding for service quality improvements. Since customer satisfaction is
the nucleus for a business success, attaining the same through quality service is inevitable
(Fiju, Frenie & Sid, 2004).
Customer loyalty: Most businesses seek lasting loyalty from their customers. One of the
mechanisms to make customers regularly purchase the service is delivering quality
service. A customer well satisfied by the service quality is more likely to be loyal to the
brand, repeats purchase from the same brand and spreads positive WOM (Riadh, 2009a).
Page 49
36
Productivity: Quality service attracts more demand and contributes for increased revenue.
Especially when the quality service is delivered right the first time, operating costs for
potential improvements are significantly reduced and long term profit will be optimized.
(Parasuraman, 2002; William, Taylor & Jayawordena, 2003).
Employee morale: Service quality increases employee morale and enhances commitment.
Employees providing quality service get positive feedback and rewards (i.e., tips,
commission) from customers and the employers, which boosts their morale and
commitment to contribute even more (William, Taylor & Jayawordena, 2003).
Brand image: A well delivered service contributes to customers‘ quality of experience
and shapes the overall image that customers have towards a given brand. A positive
brand image, in turn, produces brand loyalty (Jay & Dwi, 2000; Jing & Andrew, 2009).
2.1.3 SERVQUAL versus SERVPERF
By recognizing the complex and challenging feature of service quality and its relationship with
customer satisfaction, value and behavioral intentions, the assessment requires an understanding
of the associated dimensions to these and valid instrument to measure them. Despite the fact that
service quality attracted the attention of large number of researchers, there is no universally
accepted single tool to measure it.
Different scholars proposed different instruments to measure service quality among which the
most popular are SERVQUAL and SERVPERF (Parasuraman, Zethaml & Berry, 1988; Cronin
& Tayor, 1992; Francis, 1995; Marco, 2001; Sanjay & Gupta, 2004; Francosis, Jeremilo &
Mulki, 2007; Riadh, 2009b). The two major paradigms of service quality measures: the
Page 50
37
disconfirmation paradigm- SERVQUAL, and the perception paradigm- SERVPERF are
discussed in detail as follows (Marco, 2001).
i. SERVQUAL
In the disconfirmation model, as presented by Parasuraman, Zeithaml and Berry (1988), service
quality is considered as an attitude resulting from the comparison of customers‘ expectation and
perception of service encounter (Francosis, Jeremilo & Mulki, 2007). They introduced an
instrument to measure service quality (called SERVQUAL) based on the disconfirmation (gap
based) model, while measures the difference between the perception and expectations (P-E) of
customers on service. The SERVQUAL model presents 44 questionnaire items having two parts:
22 for expectation and other 22 for perception (Francosis, Jeremilo & Mulki, 2007; Sanjay &
Gupta, 2004).
A number of scholars applied SERVQUAL in their researches on service quality in various
service sectors (Riadh , 2009b). Besides its popularity, the model invited a great deal of debates
from other service quality researchers (Cronin & Taylor, 1992; Fiju, Frenie & Sid, 2004;
Francosis, Jeremilo & Mulki, 2007). However, Sanjay and Gupta (2004) appreciated the
diagnostic power of the SERVQUAL and prescribed it for service quality studies emphasizing
managerial interventions in particular.
Table 2.2 presents the service quality dimensions, associated definitions to them and the number
of items in corresponding dimensions, as proposed by the SERVQAL, which got reduced from
ten in 1985 (earlier version) to five in 1988 (Parasuraman, Zeithaml & Berry, 1988).
Page 51
38
Table 2.2 Service quality dimensions
Dimension Definition Items in the scale
Reliability The ability to perform the promised service
dependable and accurately
4
Assurance The knowledge and courtesy of employees and their
ability to convey trust and confidence
5
Tangibles The appearance of physical facilities, equipments,
personnel and communication materials
4
Empathy The provision of caring and individualized attention
to the customers
5
Responsiveness The willingness to help customers and to provide
prompt assistance
4
(Source: Parasuraman, Zeithaml & Berry, 1988)
After conducting a meta analysis on SERVQUAL based research done for 20 years, Raidh
(2009b) commented that the SERVQUAL is useful instrument for service quality researches
despite criticisms related to its reliability, validity (convergent, discriminate and predictive),
emphasis on process, scale generalizability in different settings, and hierarchical construct.
However, scholars like Cronin and Taylor (1992) and Francis (1995) critically emphasized on
the drawbacks and suggested its replacement: the SERVPERF. Francis (1995), for example,
reviewed the critiques on the SERVQUAL model and presented them in two groups: Theoretical
and Operational criticisms.
A) Theoretical Criticisms on SERVQUAL
• Paradigmatic objections: The base of SERVQUAL is disconfirmation instead of
attitudinal paradigm, whereas perceived quality is best conceptualized as an attitudinal
Page 52
39
model. Also SERVQUAL fails to portray on established psychological, economic and
statistical theories.
• Gaps model: Even though the model presents P-E, the dominant contributor of the
model is performance. This is true because the customers‘ expectation continuously
changes and cannot be taken as a base to determine the service quality. And there is little
evidence that customers evaluate service quality in terms of P-E gaps.
• Process orientation: The focus of SERVQUAL, being on the process of service
delivery, neglects the importance of service outcome on the perception customers‘ have
on service quality.
• Dimensionality: The universal applicability of SERVQUAL‘s five dimensions
(tangibles, reliability, responsiveness, empathy and assurance) is questionable. Further,
the number of dimensions comprising service quality is contextual; items do not always
load on to the factors which one would as priori expect; and there is a high degree of
inter-correlation between the five dimensions (Konstantinos, Nikos & Dimitri, 2002).
B) Operational Criticism on SERVQUAL
• Expectations: The term expectation is multifaceted and might imply different things for
customers. Consumers use standards other than expectations to evaluate service quality,
and SERVQUAL fails to measure absolute service quality expectations. According to
Teas (1993), customers‘ expectation might imply any or a combination of the following:
o Service attributes importance. Customers may respond by rating the expectations
statements according to the ‗importance‘ of each.
Page 53
40
o Forecasted performance. Customers may respond by using the scale to predict
the performance they would ‗expect‘.
o Ideal performance. The optimal performance, what performance ‗can be‘.
o Deserved performance. The performance level customers, in the light of their
investments, feel performance ‗should be‘.
o Equitable performance. The level of performance customers feel they ought to
receive given a perceived set of costs.
o Minimum tolerable performance .What performance ‗must be‘.
• Item composition: Four or five items cannot capture the variability within each service
quality dimension. These compositions of items might not capture all the service quality
dimensions. Although, Parasuraman, Berry and Zeithaml (1991) acknowledged the need
for including contextual specific items in the instrument to supplement the SERVQUAL,
but suggested that the new items should be similar with those in the SERVQUAL. A
number of researchers included more items than 22 in the original SERVQUAL e.g.,
Thanika (2004) used 39 items, and Nelson and Hailin (2000) used 35 items in their
researches on hotel industry while using SERVQUAL.
• Moments of truth (MOT): The evaluation of service quality is strongly affected by the
way customers evaluate the MOT which varies in time and circumstances.
• Polarity: Of the 22 SERVQUAL items, 13 were worded positively and 9 worded
negatively and this reversed polarity of items in the scale causes respondent error.
• Scale points: The seven-point Likert-scale is flawed. The absence of verbal labeling for
2 to 6 points makes the respondents to select the extreme points and there is also
ambiguity on the midpoint (Lewis, 1993).
Page 54
41
• Two administrations: The instrument requires double administration i.e., first for
customers‘ expectations and second for their perceptions of service quality. These causes
respondents boredom and confusion.
• Variance extracted: The over SERVQUAL score accounts for a disappointing
proportion of item variances. Generally, the modified scales tend to produce higher levels
of variance extracted. The higher the variance extracted, the more valid is the measure
(Francis, 1995).
Francis (1995) further questions the validity of the SERVQUAL on the following issues:
Face validity: The extent to which the instrument measures what it is supposed to
measure.
Construct validity: Particularly on nomological and convergent validity.
o Nomological validity: The extent to which a measure correlates in theoretically
predictable ways with measures of different but related constructs.
o Convergent validity: The extent to which a scale correlates with other measures
of the same construct.
The above discussion on SERVQUAL shows that there are proponents and opponents of the
model. The proponents claim:
The model is a popular instrument to measure service quality;
Its reliability and validity is acceptable;
Its diagnostic ability is well appreciated; and
It is advised for service quality research, particularly, meant for managerial intervention.
Page 55
42
Opponents criticize SERVQUAL based on:
The model has a number of theoretical and operational drawbacks; and
Its face and construct validities are questionable.
ii. SERVPERF
This model is based on the ‗perception only paradigm‘. It is first introduced by Cronin and
Taylor (1992) and suggests that expectations are irrelevant and misleading to evaluate service
quality and hence the measure of service quality should be based on performance only.
Researchers who critically compared SERVQUAL and SERVPERF suggested that service
quality can be and/ or shall be evaluated using performance instrument. For example, Sanjay and
Gupta (2004) argued that the psychometric soundness and instrument parsimoniousness makes
SERVPERF preferable for researches focusing on the assessment of service quality of a firm or
an industry.
Similarly, Halil and Kashif (2005a) commented that the use of SERVPERF instrument provides
useful information to managers for developing quality improvement strategies and suggested that
SERVPERF is sufficient to measure service quality. Marco (2001) discussed that SERPERF
explains more customer satisfaction than service quality construct. Juan and Zornoza (2000)
stated that SERVPERF has greater reliability, convergent and discriminate validity, and explains
variance better than SERVQUAL. However, Francosis, Jeremilo and Mulki (2007), have done a
meta analysis to determine the validity of SERVQUAL and SERVPERF taking 42 research
done for 17 years and concluded that both instruments are equally valid predictors of overall
service quality.
Page 56
43
As discussed earlier, the use of P-E approach in SERVQUAL has peculiarities in measuring
service quality; customers‘ expectations are unreliable as they change through time and the term
expectation might mean different things for customers. Other researchers are testifying the
validity of SERVPERF to measure service quality and recommending it for assessment of
service quality in an industry or a firm. The problem related to double administration of the
SERVQUAL and the number of issues discussed above makes SERVPERF a preferable model.
As to Cronin and Taylor (1994, p.127), ―the superiority of the SERVPERF approach pertains in
some psychometric properties of the measure, the fact remains- it is a better measure of service
quality.‖ Therefore, after assessing the pros and cons of the SERVQUAL and SERVPERF
models, the present research inclined to adopt the SERVPERF approach (perception only
measure of service performance) in the process of assessing service quality in the Ethiopian hotel
sector.
A) Criticism of SERVPERF Approach
There is significant theoretical and empirical research to support their P-E gap theory
(guiding SERVQUAL), contrary to SERVPERF (Bolton & Drew, 1991; Parasuraman,
Zeithaml & Berry, 1994; Zeithaml, Berry & Parasuraman, 1996).
Cronin and Taylor (1992) cites studies that focus on the formation of attitudes and not the
attitude level, which is what SERVQUAL attempts to measure (Parasuraman, Zeithaml
& Berry, 1994).
Cronin and Taylor's (1992) analysis does not take into account, the ―possible inter-
correlations among the five latent constructs‖ (Parasuraman, Zeithaml & Berry, 1994).
Page 57
44
The argument used by Cronin and Taylor (1992) to deem SERVQUAL a uni-dimensional
scale is subject to question (Parasuraman, Zeithaml & Berry, 1994).
SERVQUAL‘s convergent and discriminant validity is as good as or better than
SERVPERF‘s validity (Parasuraman, Zeithaml & Berry, 1994).
While their P-E measure may show less predictive power than a perceptions only
measurement, P-E measures do have better diagnostic value (Parasuraman, Zeithaml &
Berry, 1994).
In their review, Boulding et al. (1993: 24) stated ―our results are incompatible with both the one-
dimensional view of expectations and the gap formation for service quality. Instead, we find that
service quality is directly influenced only by perceptions.‖ On the other hand, Cronin and Taylor
(1994) assert that since SERVQUAL seems to have little empirical and conceptual research
support, the real question that should be asked is whether, or not, SERVPERF can produce a
valid and reliable measure of service quality. The authors insist, based on their research, that the
scale can provide a reliable, valid, and useful tool for measuring overall service quality levels or
attitudes.
Several studies that have used SERVQUAL or SERVPERF scales in different service settings
have shown that the standardized scales are not generic (i.e., not applicable in different service
contexts) and failing to capture industry/sector-specific dimensions underlying the quality
perceptions (Dabholkar et al., 2000; Negi, 2010). Therefore, it is suggested that the antecedents
and measure of service quality may be different in varying service contexts (like hotel etc.),
depending on the unique characteristics of the services provided.
Page 58
45
Although it is possible to advance a relatively strong case for using the SERVQUAL scale, this
study has chosen to use the SERVPERF scale, primarily, because of many criticisms of
SERVQUAL (Cronin & Taylor 1992; Teas 1993), and the failure of empirical studies to
replicate SERVQUAL‘s initial success (Carman 1990; Babakus & Boller 1992). Also, the
researcher is mindful that while Cronin and Taylor (1992) have argued strongly in defense of
SERVPERF, the scale has yet to be empirically tested in as wide a number of industries as has
SERVQUAL.
2.1.4 Customer Satisfaction
Ensuring and achieving customer/guest satisfaction is quite often the main goal of most
organizations, as this is assumed to be a vehicle to increase profit through customer revisits and
reduced cost to serving him/her. Heskett, Sasser and Schlesinger (1997) report that increased
customer satisfaction results in retention and positive WOM, which subsequently lower the
marketing costs and increase profit. Therefore, the study of satisfaction becomes crucial to many
managers and researchers alike, particularly in service sector. It describes customer (rational and
information processing being) experiences, which are the end state of a psychological process
(Lee, Yoon & Lee, 2007).
Satisfaction can be interpreted in two ways: as an outcome and as a process (Parker & Mathews
2001, 38-39). Gustafsson, Johnson and Roos (2005: 210) define customer satisfaction as
―customer‘s overall evaluation of the performance of an offering to date.‖ Additionally, customer
satisfaction has been defined based on the extent to which a product/service experience meets
customers‘ expectation from the same. Oliver (1997:13) defined satisfaction as ―…the
Page 59
46
consumer‘s fulfillment response. It is a judgment that a product or service feature, or the product
or service itself, provided (or is providing) a pleasurable level of consumption-related
fulfillment, including levels of under or over fulfillment.‖ Therefore, when the actual service
experience meets customers‘ prior expectations, they will be satisfied and if it fails to meet, they
would be dissatisfied (Gilbert et al., 2004).
This definition is based on the disconfirmation model since it compares customer expectation
with perception to determine customer satisfaction (Yuksel & Rimmington, 1998). However,
some scholars argue that customers are not only rational beings, since their satisfaction could be
affected by their emotional experience with the service which happens post consumption hence,
follows performance only model (Gilbert, 2006). Thus, the evaluation of customer satisfaction
should integrate both the cognitive and affective processes (Burns & Neisner, 2006). Some of the
techniques to measure customer satisfaction include: surveys, focus group, phone interviews and
computer software (Fecikova, 2004).
Generally, when customers are satisfied, they intended to stay with the service provider, provoke
positive WOM communication freely for the organizations, and leads to profitability of the
business through strong tie-ups with the organizations (Oliver, 1997; Best, 2004). As a result,
retaining customers remain very important for the organizations (Johnson & Fornell, 1991) to
gain long-term profits, as loyal customers buy more often and recommend others to buy.
In other words, customers should be retained otherwise there is more expense in gaining new
customers. Thus, customer-focused businesses offer their products/services as close to the
Page 60
47
customer needs as possible to make them satisfy/happy (Best, 2004) and ensure retention through
it. Customers are satisfied when the product is about their expectation and are dissatisfied when
the product is below their expectation (Swan & Combs, 1976). Also, customers are ready to
switch to other competitors if they provide the same or greater customer value.
In some cases, satisfaction and quality are conceptualized in a similar manner and/or used
interchangeably in discussions, it is important to note that the two constructs are distinct. While
service quality judgment is mainly a cognitive process (Vida & Readon, 2008), satisfaction is the
psychological outcome derived from a service experience (Lee, Yoon & Lee, 2007). Moreover,
satisfaction judgment can result from any dimension, quality related or otherwise, as it
encompasses a wide range of factors which may be within or outside the control of a service
provider.
Even though a distinction is made between satisfaction and perceived-quality, studies like Baker
and Crompton (2000) and Cole and Illum (2006) have found a significant relationship between
the two constructs, whereby service quality is considered as an antecedent of satisfaction. Thus,
service quality is likely to be a major factor in providing satisfaction even though satisfaction is
not exclusively achieved through service quality (Lee et al., 2007). Also, due to its strong impact
on behavioral intentions (Anderson & Fornell, 1994; Bolton & Drew, 1994; Cronin & Taylor,
1992), customer satisfaction has received much consideration in the marketing literature.
Oliver (1989) developed five models of satisfaction and its antecedents; three based on
disconfirmation of expectations and two are the result of non-rational processes. In line to this,
Page 61
48
studies like Oliver (1997) and Olsen (2002) conclude that satisfaction is an effective variable as
opposed to cognitive. Cronin et al. (2000) conceptualized satisfaction as a multi-attribute
construct that consists of factors like interest, enjoyment, surprise and anger in creating
satisfaction. In order to successfully plan a satisfactory experience, business (like hotel)
managers need to understand what customers want and how to measure the quality of their
(hotel) services.
This study evaluates customer satisfaction through performance-only model, in line with the
SERVPERF approach, which has been utilized to measure service quality. The performance-only
approach to service quality and consumer (visitor) satisfaction hypothesizes that evaluation of a
product (experience) is determined by perception of the performance alone. This method is a
more effective way of conceptualizing quality and/or satisfaction (Cronin & Taylor, 1992;
Thompson & Schofield, 2007). Performance-only measures are more typical of the cognitive
process (Meyer & Westerbarkey, 1996) and pivotal in the formation of quality/customer
satisfaction because performance is the main feature of the consumption experience (Yuksel &
Rimmington, 1998). Moreover, satisfaction results if a product performs well; irrespective of any
disconfirmation effect (Mannell, 1989).
2.1.5 Customer Value
Value is pervasive to marketing theory and consequently to understand consumer behavior.
Value is crucial in explaining different areas of consumer behavior such as product/service
choice, purchase intention and repeat visitation, and considered as a multifaceted and complex
construct that varies from one customer to another (Gallarza & Saura, 2006). It is context
Page 62
49
specific, as value has been defined and conceptualized through both uni-dimensional measure
(Zeithaml, 1988) and multidimensional scale (Petrick & Backman, 2002; Sanchez et al., 2006).
Zeithaml (1988) presents customer value as the outcome of the customer‘s comparison of the
benefits acquired from a service encounter with the costs incurred to acquire the same. Kotler
and Keller (2009) discussed customer value as the difference between the customer‘s evaluation
of all the benefits and all the associated costs of an offering and the perceived alternatives. The
overall benefits of a product/service include: bundle of economic, functional and psychological
benefits and the overall costs including monetary, time, energy and psychic costs. Therefore,
customer value entails the comparison of all the costs against the overall benefits acquired from
the product/service experience.
To this end, the conceptualization of value as a ‗benefits-sacrifice‘ construct appears to be a key
factor in determining behavioral intent. In other words, customer value is assumed to guide the
retention decisions of customers, as a function of their perceptions of service quality, and being
influenced by the type of service quality (Chang, 2008).
Customer perceived-value has been found to have a significant relationship with satisfaction, yet
the direction of the relationship has induced noticeable controversy (Eggert & Ulaga, 2002). It
has been contended by scholars like Bolton and Drew (1991) that satisfaction causes value to
manifest. Additionally, researchers (e.g., Bolton & Drew, 1994 and Petrick et al., 2001) argue
that value perception is a higher order construct and a more reliable judgment than satisfaction,
and referred as a better predictor of behavioral outcomes in business markets (Gross, 1997).
Page 63
50
Others like Cronin et al. (2000) and Brady et al. (2005) argue that satisfaction is more strongly
related to behavioral intentions. Though, Eggert and Ulaga, (2002) submit that the two constructs
rather complement each other.
Furthermore, a number of multi-dimensional models of value have been developed incorporating
functional and social-psychological elements. For example, Sweeney and Soutar (2001)
proposed ‗PERVAL‘ model consisting quality/performance, social, price/value for money and
emotional dimensions, based on Sheth, Newman and Gross‘s (1991) model. Gallarza and Saura
(2006) developed an eight-dimension model comprising efficiency, excellence, status, esteem,
play, aesthetics, ethics and spirituality. Sanchez et al. (2006) also proposed a tourism context
specific multi-dimensional value model called ‗GLOVAL‘. However, empirical studies have
indicated that perceived quality and monetary price are the two major antecedents of perceived
value (Oh, 2000; Duman & Mattila, 2005), and in turn, perceived-value is a significant
antecedent to visitors‘ satisfaction and behavioral intention (Cronin et al., 2000).
According to Oliver (1997), value evaluation takes both cognitive and affective dimensions.
Duman and Mattila (2005) noted that the cognitive perspective of value perception is often more
emphasized in the literature than the affective aspect, which may be the result of earlier uni-
dimensional conceptualization of the concept. This study measured perceived value by asking
the customers to compare the benefit they acquired from the service encounter against the cost
they have incurred to acquire the same (Cronin, Brady & Hult, 2000).
Page 64
51
2.1.6 Behavioral Intentions
Marketing research has shown that it is more cost effective to retain customers than attract new
ones, as this has implications for marketing costs, customers‘ willingness to pay more and
subsequently for profits. As a result, organizations in general, and service providers in particular,
are keen to retain their customers with them.
Behavioral intention is an indicator that shows whether a customer will remain loyal to a service
provider or shift to another. It represents the repurchase intentions, WOM, loyalty, complaining
behavior and price sensitivity of customers (Zeithaml, Berry & Parasuraman, 1996). While
Zeithaml, Berry and Parasuraman (1996) have compiled a list of favorable behavioral intentions
including loyalty, willingness to pay more, external and internal responses, and switching
intentions, many studies (e.g., Theodorakis & Alexandris, 2008; Ozdemir & Hewett, 2010) used
WOM, repurchase intentions and willingness to recommend and to measure behavioral
intentions.
Bourton et al. (2003) reported that customer experience is relating to behavioral intentions; more
positive the customer experience, more likely his/her willingness to reuse the service. Oliver
(1997) referred to behavioral intentions as the stated likelihood to engage in a particular behavior
including intentions to revisit and WOM recommendations. These intentions can predict the
future consumption behavior of the consumer and that of his/her WOM recipients.
Bagozzi (1992) discussed that customers‘ behavioral response is the outcome of their cognitive
evaluation of a product/service and the affection they have experienced by doing so. However, it
Page 65
52
is to be noted that in the case of behavioral intentions we are rather capturing customer‘s
intentions not the actual behavior. Nonetheless, scholars agree that behavioral intentions are
good indicators of future planned behaviors and thus measured intentions to revisit, recommend,
and be loyal (Cronin, Brady & Hult, 2000; Chen et al., 2011; Som et al., 2012; Wen et al., 2012).
Zeithaml, Parasuraman and Berry (1996) hold the notion that behavioral intention could be
favorable where a customer/guest will engage in saying positive things and recommending a
service to others (families and friends), along with expressing loyalty to a service provider.
When the behavioral components are favorable, which meet service providers‘ desires,
customers positively affirm their likelihood to revisit the provider and then spread positive
WOM to others (Jani & Han, 2011). Conversely, behavioral intentions could be unfavorable
where the customer/guest is dissatisfied, which may lead to switching and complaint behavior.
In general, the intention construct is premised on the Theory of Reasoned Action (TRA) and the
Theory of Planned Behavior (TPB), whereby intentions are presumed to be the driving factors
that influence behavior and subsequently indicate how truly an individual is willing to try or
exert specific amount of effort in performing the behavior (Armitage & Conner, 2001).
Accordingly, the expectancy-value model, known as TRA, provides an expanded picture of how,
when, and why attitudes predict consumer behavior (Bagozzi, 1992). In this model, behavior is
assumed to be approximately equal to behavioral intention, which in turn is determined by the
person‘s attitude toward the act and the subjective norms that operate in the situation (Figure
2.7).
Page 66
53
Figure 2.7: Theory of Reasoned Action (Armitage & Conner, 2001)
Through the concept of ‗subjective norm‘ the theory acknowledges the power of other people in
influencing behavior. Explicitly, it accounts for the thoughts of others toward the certain
behavior, and is moderated by the extent to which the consumer is motivated to comply with
these views. However, the relative contributions of attitudes and subjective norms will not
necessarily be equal in predicting behavior. As, perhaps, conspicuously consumed products tend
to be more influenced by the subjective norms as compared to less conspicuous products.
Being an extension of TRA, the TPB, seeks to predict behaviors over which consumers have
incomplete control by examining their perceived behavioral control. The factor ‗perceived
behavioral control‘ was added as an additional predictor of intentions and behavior which, just as
attitudes and subjective norms, works with beliefs that are accessible to the consumer (see Figure
2.8).
Page 67
54
Figure 2.8: Theory of Planned Behavior (Armitage & Conner, 2001)
The construct ‗perceived behavioral control‘ is formed by combining the perceived presence of
factors that may facilitate or impede the performance of behavior and the perceived power of
each of these factors. Actual behavioral control refers to the extent to which a person has the
skills, resources, and other prerequisites needed to perform a given behavior.
Particular to hospitality industry, behavioral intentions have been measured variously. The main
measures include: recommending the product to others (Parasuraman, Zeithaml & Berry, 1991);
remaining loyal to a provider (Rust & Zahorik, 1993); saying positive things about a service and
provider (Boulding et al., 1993); paying a premium price and spending more on the provider‘s
services (Alexandris, Dimitriadis & Markata, 2002). In a nutshell, the elements of behavioral
intentions can be grouped into four broad categories- purchase intention, WOM communication,
price sensitivity and complaint behavior. Chen and Chen (2010) referred customers intentions as
attitudinal (specific desire to remain in a relationship with a given service provider), and
Page 68
55
behavioral (actual repeat purchase of a given service offering). In this study, customers‘
behavioral intention has been measured in terms of intentions to revisit and to
recommend/WOM. Word-of-Mouth recommendations are further classified, by adapting
Kozikowski (2012), as Acquaintances Word-of-Mouth (A-WOM), Booking Contacts Word-of-
Mouth (BC-WOM), Direct Word-of-Mouth (D-WOM) and Electronic Word-of-Mouth (E-
WOM), based on the audience.
Additionally, evidence abounds that behavioral intentions are related to constructs such as
service quality, perceived-value, service benefit, customer satisfaction and service equity. A
number of studies have investigated the behavioral consequences of such service constructs
(Zeithaml & Bitner, 2001; Jani & Han, 2011) as presented in the following section.
2.2 Empirical Literature Review
2.2.1 Service Quality, Customer Value, Satisfaction and Behavioral Intentions
Establishing a link between service marketing constructs like quality, customer satisfaction and
perceived-value, and behavioral intentions is both important and challenging. It is important
being an evidence for the value of service quality research, and challenging as the relationships
between specific service quality dimensions and other constructs are not yet clear, due to the use
of different service quality models and varying contexts (Theodorakis & Alexandris, 2008).
Following Rust and Oliver (1994), the need for research to empirically examine the relationships
between these constructs is emerged. Accordingly, a number of studies have attempted to
conceptualize the links between these variables across different sectors (Fornell et al., 1996;
Page 69
56
Zeithaml, Berry & Parasuraman, 1996). This rationalization for the connections between quality,
value and satisfaction is based on the Bagozzi‘s (1992) work that proposes the way customers
initial service evaluation leads to an effective reaction to generate behavioral outcomes or
intentions. Majority of the studies establishing the relationship between service quality,
perceived-value, customer satisfaction and behavioral intentions indicate that quality influences
behavioral intentions indirectly via value and satisfaction (Anderson & Sullivan, 1993; Patterson
& Spreng, 1997; Petrick, 2004).
Many researchers, like Marco (2001), have limited their focus on service quality dimensions and
its relationship with customer satisfaction without extending to investigate the behavioral
intentions outcome (Francosis, Jeremilo & Mulki, 2007; Raidh, 2009b). Whereas, researchers
like Konstantinos, Nikos and Dimitri (2002) assessed the direct relationship between service
quality and behavioral intentions but disregarded the variables like satisfaction and value, which
were observed to play mediating role in other researches (e.g., Cronin, Bradly & Hult, 2000;
Tsaur, Lin & Wu, 2008; Salazar, Costa & Rita, 2010; Jani & Han, 2011 and Simon, 2012).
Researches like Gounaris, Dimitriadis and Stathakopoulos (2010), Kasim and Abdullah (2010),
and Lertwannawit and Gulid (2011) proposed/introduced other variables (in addition and/or in
substitution to satisfaction and/or value) like trust, image, perception and commitment, being
moderators to the relationship between the constructs pertinent to their studies contexts. Others
(e.g., Chen, 2008; Michael et al., 2009; Lertwannawit & Gulid, 2011 and Cho, Byun & Shin,
2014) who investigated the relationship between these constructs hardly discussed the link
between specific service quality dimensions and behavioral intentions.
Page 70
57
Specific to hotel sector, Oh (1999) identified that perceived service quality has a positive and
direct effect on both customer-perceived value and satisfaction, and value has a positive direct
influence on customer satisfaction and repeat purchase behavior, with customer satisfaction
having a direct and positive impact on behavioral intentions of repeat buying and positive WOM
communication. Similarly, Brady et al. (2001) reported that service quality has a direct positive
influence on customer satisfaction and behavioral intentions in the context of American
restaurants, while customer satisfaction has a direct and positive effect on behavioral intentions
in both American and Latin American contexts.
Following a study on the impact of customer perceptions of service quality on behavioral
intentions in Greece hotels, Konstantinos, Nikos and Dimitri (2002) learned that ‗empathy‘ and
‗assurance‘ dimensions are most important to affect customer‘s purchase intentions and WOM.
Hokey and Hyesung (1997) studied service quality from managerial perspective in North Korea
and identified that hotel ambience and employee courtesy affect service quality in a more
significant manner.
Halil and Kashif (2005a) assessed the perception of customers on service quality in North
Cyprus hotels by applying SERVPERF and identified only two dimensions (tangibles and
intangibles) contributing to determine service quality. Perran (1995), who studied hotel service
quality in Istanbul (Turkey) by adapting the SERVQUAL, found courtesy and staff competence,
communication and transaction, tangibles, customer understanding, accuracy and speedy service,
and solution to problems and their accuracy as the major factors affecting service quality.
Page 71
58
In this study, while the relevant variables were identified from different literatures, a single
instrument was hardly found representing all the items. Thus, in an attempt to develop the
modified instrument, which comprehensively measures service quality and its relationship with
customer value, satisfaction and behavioral intentions, questionnaire items were adapted from
different researchers, as presented in the next (methodology) chapter. Even though, the
relationship of service quality, customer value, satisfaction and behavioral intentions has
attracted large number of researchers, the findings indicate that the nature of relationship among
the constructs varies with the pertinent research context (see Table 2.2).
Moreover, Cronin, Bradly and Hult (2000) attempted to explain the relationship that exists
between service quality, customer satisfaction and behavioral intentions, while stating service
quality as an antecedent to the other two. Festus, Maxwell and Godwin (2006) assessed the
relationship between the three constructs and stated that although service quality directly affects
behavioral intentions of customers, the indirect/moderating role of customer satisfaction is
stronger in linking service quality and customers‘ behavioral intentions. Scholars explained that
behavioral intentions of customers are affected by perceived value and satisfaction
(Konstantinos, Nikos & Dimitri, 2002; Chen, 2008; Maria, Lorenzo & Antonio, 2007; Kuruuzmu
& Koksal, 2010).
Evidence abounds that behavioral intentions are related to constructs such as perceived quality,
value, service benefit, customer satisfaction and service equity. A number of studies in the
services marketing domain in general, and hospitality discipline in particular, have investigated
the behavioral consequences of such service constructs. For example, Baker and Crompton
Page 72
59
(2000), employing a structural modeling design and found that service quality dimensions
directly and positively relate to purchase intentions, loyalty and willingness to pay more money.
Zeithamal, Berry and Parasuraman (1996) argued behavioral intentions as a consequence of
service quality, which is a signal of retention or defection. They proposed a multi-dimensional
behavioral intentions model having dimensions of WOM, purchase intentions, price sensitivity
and complaining behavior. They also suggested that perceived service quality was related with
favorable behavioral intentions including positive WOM recommendations, loyalty and less
price sensitivity.
Service quality has significant impact on behavioral intentions of repurchase and provoking
positive WOM than perceived-value, and perceived-value influences more of behavioral
intentions than satisfaction (Petrick, 2004). Olorunniwo et al. (2006), in their study on hotel
sector, found that while service quality fundamentally impact behavioral intentions to revisit, its
indirect effect (through customer satisfaction) is significantly greater than the direct effect in
producing favorable behavioral outcomes. Similarly, Theodorakis and Alexandris (2008) found
that tangibles, responsiveness and reliability dimensions were moderately estimating the WOM
communication.
Thus, the nature of impact that service quality has (directly or indirectly through satisfaction
and/or value) on behavioral intentions remained controversial or contextual. As a result, while
some researchers proposed that service quality directly influence behavioral intentions (Tsaur,
Lin & Wu, 2008; Kuruuzmu & Koksal, 2010; Basheer, 2012), others proposed indirect influence
(Chen, 2008; Zabkar et al., 2010; Lertwannawit & Gulid, 2011; Jani & Han, 2011; Simon, 2012).
Page 73
60
Table 2.3 Relationship between service quality, customer value, satisfaction and behavioral
intentions in different contexts
Authors Constructs Contexts Findings
Bedi (2010) Service quality, customer
satisfaction & behavioral
intentions
India,
Banking
Service quality influences customer
satisfaction. Service quality dimensions have
varying contribution across public and
private banks. Customer satisfaction has
more influence on WOM
Chen et al.
(2011)
Service quality, customer
satisfaction & behavioral
intentions
Taiwan,
National
Park
Service quality influences customer
satisfaction. High level of service quality
creates long term behavioral intentions of
tourist (like revisit) through high level
customer satisfaction.
Cho and
Rutherford
(2011)
Value, repurchase
intentions & WOM
Service
firms
(gender)
Value and WOM influence customers‘
repurchase intentions. Females tend to
engage in more WOM than males which
affect their repurchase intentions.
Huang
(2012)
Service quality, value,
satisfaction, image &
behavioral intentions
Golf event
tourists
Service quality influences value and
satisfaction of tourists which results in
favorable image and this ultimately leads to
positive behavioral intentions.
Wen et al.
(2012)
Perceived service quality,
satisfaction, value &
behavioral intentions
China and
USA
(culture,
age,
gender)
Culture, gender and age moderate the
relationship between the research constructs.
Value has strong influence on satisfaction in
china whereas in America service quality and
food quality have strong influence on
satisfaction.
Chen, Chen
and Lee
(2013)
Physical environment
quality, personal
interaction quality,
loyalty, satisfaction &
behavioral intentions
Taiwan,
Hospitality
(B&B)
Both physical environment quality and
personal interaction quality produce
customer satisfaction. However, only
personal interaction quality and customer
satisfaction can influence loyalty.
Page 74
61
Cho, Byun
and Shin
(2014)
Service quality,
satisfaction, revisit &
information (WOM)
preferences
Korean,
Tourism
Service quality, physical infrastructure and
tour program affect customer satisfaction.
Service quality influences tourists‘ intentions
to revisit and recommend.
Lai (2015) Service quality, value,
satisfaction, commitment
& loyalty
Hong
Kong,
restaurant
Service quality influences perceived value,
satisfaction, and loyalty. Perceived value
mediates the relationship between service
quality and customer satisfaction.
Satisfaction influences affective commitment
and customer loyalty. Perceived value does
not have a significant effect on customer
loyalty.
(Source: Compiled from various sources)
Chen and Chen (2010), in like manner, found evidence that perceived value and satisfaction have
a significant, direct positive impact on behavioral intention, and that experience quality has an
indirect effect on the same construct mediated by both perceived value and customer satisfaction.
Alexandris, Dimitriadis and Markata (2002), in their study on hotel sector found that the majority
of service quality dimensions positively influence WOM and repurchase intentions.
On the other hand, Lee, Yoon and Lee (2007) stated that service quality is likely to be a major
factor in providing satisfaction even though satisfaction is not exclusively achieved through
service quality. Perceived value is another construct that has been found to have a significant
relationship with satisfaction, yet the direction of the relationship has induced noticeable
controversy (Eggert & Ulaga, 2002). Accordingly, it is argued that value perception is a higher
order construct and a more reliable judgment than satisfaction. Conversely, Cronin, Bradly and
Hult (2000) and Brady et al. (2005) favor the value-satisfaction path and argued that satisfaction
Page 75
62
is more strongly related to behavioral intentions. Lastly, the literature converges on the view that
satisfaction is a good predictor of behavior like loyalty and WOM recommendation, though other
constructs can lead direct to either positive or negative behavior in varying transactional
situations.
Moreover, the use of customer/guest profile (socio-demographic characteristics) is a prevalent
and generally accepted basis of segmenting the market (Kotler & Armstrong, 1991). It is
imperative that marketers and managers of products, including that in services like hotels,
understand the socio-demographic profile of their customers, along with their hotels
characteristics (star category, location etc.) to judge the market size and spread for their products
and/or services.
Kozak (2001), for example, in a cross-cultural study of British and German tourists visiting
Mallorca and Turkey examined differences in satisfaction based on respondents‘ nationality. He
found that British tourists were more likely to be satisfied with almost all individual attributes of
a destination than German tourists. Similarly, Choi and Chu (2000) investigated Asian and
Western travelers‘ perceptions about the service quality of Hong Kong hotels, and revealed that
while overall satisfaction was primarily derived from perceived value for Asian travelers, room
quality determined the same for their Western counterparts.
Also, Spinks, Lawley and Richins (2005) investigated the influence of individual visitor
characteristics on satisfaction with tourist attractions and revealed that significant differences
exist between satisfaction levels being experienced by tourists of differing origins, genders and
Page 76
63
age groups. Kumar and Lim (2008), in a mobile service perception study, found significant
differences between ‗Generation Y‘ and the ‗baby boomers‘ in terms of the effect of perceived
economic and emotional value on satisfaction. The study further revealed that the effect of
emotional value on satisfaction was stronger for ‗Generation Y‘ than ‗baby boomers‘.
In a nutshell, limited researches have been done that simultaneously capture the relevant
variables related to service quality, satisfaction, value and behavioral intentions along with the
association of these constructs with the research participants/customers profiles (Tsaur, Lin &
Wu, 2008; Wen et al., 2012). Also, research works done in hotels context across different
cultural settings like USA, Greece, Taiwan, Portugal, Turkey and Korea, produced varying
outcomes (Konstantinos, Nikos & Dimitri, 2002; Michael et al., 2009; Salazar, Costa & Rita,
2009; Kuruuzmu & Koksal, 2010; Cho, Byun & Shin, 2014), which signifies that this research
has unique contextual contribution to the existing knowledge.
The above discussion focused on the major findings of literatures in the domain of service
quality, customer value, satisfaction and behavioral intentions, however, a chronological
summary of research works done in relation to these constructs is annexed (Annex-B) for
reference.
2.3 Conceptual Framework and Hypotheses
2.3.1 Conceptual Framework
Theory of Reasoned Action (TRA) proposed by Ajzen (1971) provides the conceptual frame as
to how the human behavior might be guided by marketers through effective delivery of service
Page 77
64
quality, which can create customer satisfaction and lead to favorable behavioral intentions.
Accordingly, consumer behavior is directed by rational thinking, whereby the more reasons they
have to behave in a certain manner, the more likely they would be behaving in the same way.
Therefore, marketers can influence their customers to exhibit positive behavioral responses to
their brand like positive word of mouth, loyalty and repurchase by delivering quality service
which satisfies their customers and creates customer value. Another dominant model useful in
explaining the link between service quality, customer satisfaction and behavioral intentions is the
‗Cognitive-Affection- Behavioral‘ response model, which was originally suggested by Bagozzi
(1992) and explains the relationship of customers‘ perception (cognitive), emotional satisfaction
(affection) and behavioral intentions (action or response).
In line with these theories, a number of scholars attempted to investigate the relationship
between service quality, satisfaction, value and behavioral intentions of customers in different
industries and countries. Although, the empirical findings suggest differences in the nature and
extent of the relationships and the roles played by the variables (as predictor, criterion or
moderator), there is agreement that service quality is antecedent to customer value, satisfaction
and behavioral intentions (Konstantinos, Nikos & Dimitri, 2002; Chen, 2008; Maria, Lorenzo &
Antonio, 2007; Tsaur , Lin & Wu, 2008; Salazar, Costa & Rita, 2010; Kuruuzmu & Koksal
2010; Naik, Gantasala & Prabhakar, 2010; Basheer, 2012; Ravichandran, Bhargavi & Kumar,
2010; Lertwannawit & Gulid, 2011).
On the other hand, Cronin et al. (2000) argue that partial examination of the bi-variate links
between service quality and behavioral intentions is more likely to provide ambiguous
representation of their relationship, thus using multivariate links by including other relevant
Page 78
65
variables, are preferable. Despite this, models representing the relationship between service
quality and behavioral intentions are mostly proposed without including relevant variables like
perceived value and customer satisfaction (McDougall & Levesque, 2000), inclusion of which
can bring about a more comprehensive understanding of the link between service quality and
behavioral intentions.
The conceptual framework guiding the formulation of hypotheses, as illustrated in Figure 2.9,
was drawn from pertinent findings in the services marketing literature.
Figure 2.9 Conceptual Framework
(Adapted from Ajzen, 1971; Bagozzi, 1992; Cronin, Bradly & Hult, 2000; Chen, 2008; Festus,
Maxwell & Godwin 2006; Michael et al., 2009)
The framework indicates that service quality, perceived value and satisfaction influence
customer/guest behavior to revisit and inspire WOM, directly or indirectly (Baker & Crompton,
H2 Behavioral Intentions
(Revisit and WOM)
Service Quality
(Attributes/Dimensions)
(H1)
H5
Customer
Satisfaction
H4
H3
H6
Customer
Value
H7
Page 79
66
2000; Cronin, Bradly & Hult; 2000). Moreover, researchers like Michael et al. (2009) and
Festus, Maxwell & Godwin (2006) explained that behavioral intentions of customers are affected
by service value and customer satisfaction.
Part of the model deals with the mediation effects of customer value and satisfaction towards the
relationship between service quality and behavioral intentions. Mediation represents the indirect
effect of a predictor variable on a criterion variable where the mediating variable intermediates
the influence of the independent variable on a dependent variable (Fairchild & MacKinnon,
2008). Therefore, a mediator variable explains the relationship between an independent variable
and a dependent variable by addressing as to how or why the predictor variable accounts for the
variance in the criterion variable (Fairchild & MacKinnon, 2008).
Furthermore, hotels play an important part in the tourism industry. Hotels‘ star category and
location attracts visitors with varying backgrounds (socio-demographics) and based on their
purpose of visit. Thus, it can be assumed that different customers/guests select different hotels
and locations based on their socio-demographic profile and purpose of visit (Choi & Chu, 2000;
Salazar, Costa & Rita, 2009). Commonly used socio-demographic variables in services
marketing and specific to hotel services include: gender, education level, age, income,
occupation, marital status and nationality/origin (representing guest‘s culture). Such variables are
often evaluated in services marketing and hospitality industry to assess consumer perceptions of
offerings and associated use/consumption (Spinks, Lawley & Richins, 2005).
Page 80
67
In addition, socio-demographic characteristics have also been found to influence guests‘
perceptions of service quality (Choi & Chu, 2000; Kelley & Turley, 2001; Ganesan-Lim, 2008),
value (Kumar and Lim, 2008) and satisfaction (Kozak, 2001; Spinks, Lawley & Richins, 2005),
and subsequently behavioral intentions (Tsaur, Lin & Wu, 2008; Wen et al., 2012). However,
Reisinger and Turner (2002) found less evidence to recommend that there is a need to segment
the tourism market demographically in relation to shopping.
Accordingly, following hypotheses were developed to be empirically tested in the context of
Ethiopian hotel sector.
2.3.2 Research Hypotheses
The first hypothesis relates to the performance of quality attributes/dimensions in the hotel sector
of Ethiopia. Generally, the service marketing literatures often operationalize quality as the
discrepancy gap between consumer expectations and perceptions of performance, particularly
after Parasuraman, Zeithaml and Berry (1988). However, strong criticism to such
conceptualization inspired the proposition that a more valid measure can be achieved by directly
assessing perception of the performance of quality attributes. Accordingly, the discussion leads
to the first hypothesis:
H1: Quality is determined by the perceived performance of the service quality
attributes/dimensions in the hotel sector of Ethiopia
By considering that service quality, being the global judgments or attributes related to the
superiority of service (Parasuraman, Zethaml & Berry, 1988), has positive influence on customer
Page 81
68
satisfaction (Marco,2001; Francosis, Jeremilo & Mulki, 2007; Raidh, 2009b; Simon, 2012), the
second hypothesis appeared as:
H2: Perceived service quality positively and significantly influences the customer
satisfaction in the Ethiopian hotel sector
Customer value is the outcome of the customers‘ evaluation of the benefit(s) acquired from a
product or service with the cost incurred (Zeithaml, 1988). Empirical studies suggest that service
quality positively affects customer value (Cronin, Bradly & Hult, 2000; Chen, 2008; Michael et
al., 2009; Lertwannawit & Gulid, 2011). In view of this, the third hypothesis presented as:
H3: Perceived service quality positively and significantly influences customer value in
the Ethiopian hotel sector
Customer satisfaction and customer value have been considered as crucial variables in service
quality research. Studies suggest that value and satisfaction have strong correlation and
contribute to positive behavioral intentions (Cronin, Bradly & Hult, 2000; Chen, 2008; Michael
et al., 2009; Lertwannawit & Gulid, 2011). Accordingly, the study proposed the following three
hypotheses:
H4: Customer satisfaction associates positively and significantly with customer value
in the context of Ethiopian hotels
H5: Customer satisfaction mediates the influence of perceived service quality on
behavioral intentions of the hotel customers in Ethiopia
Page 82
69
H6: Customer value mediates the influence of perceived service quality on behavioral
intentions of the Ethiopian hotel customers
Although there is no universal agreement being found, a good number of researchers have
identified the contribution of perceived service quality in directly and favorably determining
behavioral intentions of repurchase/revisit and WOM (Konstantinos, Nikos & Dimitri, 2002;
Maria, Lorenzo & Antonio, 2007; Tsaur, Lin & Wu, 2008; Salazar, Costa & Rita, 2010;
Kuruuzum & Koskal, 2010; Ravichandran, Bhargavi & Kumar, 2010; Basheer, 2012). Hence,
the seventh hypothesis appeared as:
H7: Service quality has a direct and significant influence on the behavioral intentions
of hotels’ customers in Ethiopia
2.4 Summary of the Chapter
The chapter presented with a theoretical framework while reviewed the literature related to
service quality, customer value, satisfaction and behavioral intentions, both in general and
specific to hotel sector. The theoretical foundations of the constructs for service quality,
customer value, satisfaction and behavioral intentions have been discussed both from the
disconfirmation (gap based) and performance (perception oriented) view points. In addition, the
debates on service quality measurements have been presented along with the justifications for
using SERVPERF over SERVQUAL by the study.
Furthermore, review of empirical studies has been presented in the area of service marketing in
general and specific to the study constructs, in order to identify the knowledge gaps to be filled
Page 83
70
by this study and for proposing a conceptual framework presenting the relationships between the
specified constructs. Finally, the research hypotheses have been developed in line with the
proposed conceptual framework and theoretical foundations drawn from the earlier studies.
The following chapter discusses research design and methodology being used in carrying out this
study, by appropriately identifying and developing research paradigms, data collection
instrument, approach to data collection and associated analysis, for the purpose of hypotheses
testing.
Page 84
71
CHAPTER 3
METHODOLOGY
This chapter presents the research approach, methods and design used by the study, while
highlighting the population and issues related to sampling technique, sample size determination,
and data collection instrument. Besides, the chapter outlines the approach to data collection and
analysis for the purpose of hypotheses testing.
3.1 Research Paradigm, Approach and Method
3.1.1 Research Paradigm
According to Sarantakos (1998: 32), ―a paradigm is a set of propositions that explains how the
world is perceived; it contains a world view, a way of breaking down the complexity of the real
world.‖ Given this, an investigator can make use of a paradigm as a means of what make sense in
the world. Additionally, Guba (1990) mentioned that all the paradigms can be conceptualized
based on three major elements, which influence the way a researcher thinks about the research
process- epistemology, ontology and methodology.
While epistemology is concerned with what constitutes acceptable knowledge in a field of study,
ontology raises questions of the assumptions researchers make about the way the world operates
and the commitment held to a particular view, and methodology indicates how the researcher
attempts to discover knowledge through their epistemological and ontological perspectives
(Saunder, Lewis & Thornhill, 2007). Accordingly, there exist two main research paradigms-
Positivism and Interpretivism.
Page 85
72
Veal (2006) stated positivism as a framework of research in which the researcher sees objects as
phenomena to be studied from the outside, with behavior to be explained on the basis of
accumulated facts and observations using theories and models developed by the researchers. It
focuses on the facts and formulates hypotheses and tests them against empirical evidence.
Basically, positivism is associated with scientific research and promotes more objective
interpretation of reality, using data from surveys/experiments by using large samples and
questionnaires.
On the other hand, interpretive paradigm is concerned with methods that examine people and
their social behavior (Altinay & Paraskevas, 2008), whereby reality varies as it is a mental
construction by individuals. It views research as an interactive process where the people being
researched relate with the researcher and the findings, which are the outcomes of the interaction
and highlight the meaning and understanding of the situation or phenomenon being investigated.
Additionally, Saunder, Lewis and Thornhill (2007) identified realism (within a post-positivist
worldview) and pragmatism. While, positivist paradigm assumes that reality can be entirely
understood and explained; post-positivists, in contrast, postulate that reality can only be
approximated when studying behavior and actions of humans (Creswell, 2009). Pragmatism, on
the other hand, assumes a more neutral position.
Critical realism, as an epistemological position, is the critical application of realism in producing
layers of understanding of the world, and believes that the actual is different from empirical
(Saunder, Lewis and Thornhill, 2007). Critical realism emphasizes that the underlying structures,
Page 86
73
powers and tendencies of events, experiences, impressions, discourses and states of affair in the
world may be observable or unobservable through experience and/or discourse (Patomaki and Wight,
2000) hence, it challenges the ability to know reality with certainty. The use of a mixture of
qualitative and quantitative methods is crucial to this philosophy in the investigation of both
observable and non-observable causal conditions. Critical realism postulates that the observable
behavior of people, object and event is not understandable except if seen in the causal context of
non-observable structure, inherent characteristic and interaction in the object/event.
In this study, the researcher‘s main concern was to adopt the most appropriate epistemological
position and methodology. The positivism paradigm adopted by this study allowed the
examination of the relationship between research variables (service quality, customer
satisfaction, value and behavioral intentions) while scrutinizing the applicability of founded
theories and measurement in the research context (Ethiopian hotels). Specifically, as guided by
Creswell (2009), the epistemological position adopted by this study is critical realism, which
enables the identification of causation and exploration of the mechanism of cause and effect that
underlie events.
3.1.2 Research Approach
Saunder, Lewis and Thornhill (2007) posit that the extent of the explicitness of theory at the
onset of the research raises a significant question regarding the research design i.e., whether the
research should employ inductive or deductive approach/reasoning. Therefore, there exist two
research approaches: inductive and deductive (Bryman, 2012).
Page 87
74
According to Altinay and Paraskevas (2008), induction is a process where the researcher draws a
conclusion from one or more particular pieces of evidence, and usually associates the inquiry
into qualitative domain. The power of an inductive argument depends on the weight of support it
offers to the conclusions (Walliman, 2011). An inductive argument only offers support for the
conclusion rather than providing irrefutable grounds for truth, and can neither be correct nor
incorrect (Saunder, Lewis & Thornhill, 2007). This type of research is more effective with small
samples, and particularly, in establishing a cause-effect link between variables while using
empirical evidences to support reasoning process (Altinay and Paraskevas, 2008).
On the other hand, deductive theorists derive their inferences by rationalizing reason(s) to a
given set of assumptions. Often in quantitative research, deductive reasoning employs theory to
drive the research from the beginning towards the formulation of hypotheses to determine the
type of evidence/data the researcher will gather (Creswell, 2009). The strength of deductive
reasoning is based on its logical form, and not particularly on the content of the statements
presented (Walliman, 2011).
In essence, while the inductive approach builds on specific phenomenon to generalize, the
deductive approach scrutinizes phenomena based on generic theory. In other words, deductive
and inductive approaches of reasoning attempt to provide explanation of the truth from different
(opposing) directions; the inductive argument seeks the truth from particular to the general and
the deductive argument, from general to the particular (Walliman, 2011). However, the risk of
the research yielding no useful data patterns and theories is higher with inductive than deductive
research (Altinay and Paraskevas, 2008).
Page 88
75
Whilst both approaches provide ways to different kinds of research in social science, many
studies include elements of both. As data are collected with some explanatory model in mind,
there remains an element of deduction in research (Veal, 2006). Conversely, it is not possible to
develop hypotheses without information on the subject, so there is also an element of induction.
Saunder, Lewis and Thornhill (2007) support that mixing inductive and deductive approach is
advantageous.
In order to gain insights into how hotel customers/guests evaluate service quality and its
relationship with other study constructs, deductive approach is found useful, as it allowed
explaining the causal relationships (Saunder, Lewis & Thornhill, 2007), along with the
operationalization of concepts. However, the research design for this study did not entirely lend
itself to the deductive reasoning to gain an insight into how customers interpret and evaluate
service quality and other associated constructs in the hotel sector. To develop corresponding
hypotheses, the researcher reviewed related literature in addition to the preliminary inquiries
made with the area experts and tourist websites that report customer experiences,
complaints/grievances with hotel services in Ethiopia (see later sections for detail on this). The
hypotheses generated therein were then empirically tested based on the data gathered through
questionnaire/survey administered with four and five star hotels‘ customers/guests in Ethiopia.
While at the beginning, the objective of the study was to identify the variables pertaining to
research constructs and their associations in theory, later on attempts were made to empirically
test the hypothesized relationships in the hotel context. Therefore, this study adopted a mixture
Page 89
76
of inductive and deductive approaches to gain the benefits of both at different stages of the
research process.
3.1.3 Research Method
Choice of research methods is one of the challenges that any researcher may face when required
both qualitative and quantitative data to achieve research objectives. Research method deals with
information sources, approach of data gathering and analysis method. It also takes into account
the best timing for data collection and the type of data required to undertake the analysis in line
with research objectives (Walliman, 2011). Equally important is to consider the tools and
techniques required by keeping in mind that different research strategies needed different
methods of data collection and analysis. Broadly speaking, there are three main domains of
research methods: qualitative, quantitative and mixed research methods (Adams et al., 2010).
While a quantitative method is predominantly employed in testing theory, it can also be utilized
for exploring new research areas and developing hypotheses and theory (Blaxter, Hughes &
Tight, 2006). Quantitative research is empirical research where the data are in the form of ‗hard‘
numbers whilst qualitative research involves primarily the gathering of ‗soft‘ non-numeric data.
Quantitative research is inclined to involve relatively large-scale and representative sets of data
for the purpose of gathering of ‗facts‘. The approach relies on numerical evidence to draw
conclusions or to test hypotheses using experiments and surveys. The use of quantitative
approach is common in service marketing studies in general, and hospitality industry in
particular, in the area of satisfaction, quality and value (Zabkar et al., 2010). Quantitative
Page 90
77
research adheres to standards of a strict research design developed prior to the actual research
and uses statistical analysis; hence applies deductive approach.
Qualitative research, on the other hand, applies non-quantitative data collection and analysis and
aims towards the exploration of social phenomena to describe reality as experienced by the
respondents hence, applies inductive approach. Qualitative methods take the position that the
researcher‘s communication with the subject and the environment being studied is explicitly part
of the knowledge rather than an interfering variable (Saunder, Lewis & Thornhill, 2007) hence,
the subjectivity of the researcher and the subjects being studied are an integral part of the
research process. In addition, qualitative research methods targets limited cases to explain the
condition and sometimes are considered to be inadequate, as generalization from few cases raises
the questions regarding the validity and reliability of the results.
However, for many years the advocates of quantitative and qualitative research approaches have
been involved in debate about the superiority of one method over the other (Johnson and
Onwuegbuzie, 2004). For example Flick (2009) mentions that qualitative research does not
necessarily require the quantitative methods in later stages of research but quantitative research
needs qualitative means for explaining its findings. Also, it has been argued that there remain
some facets of human behavior which are difficult to measure quantitatively, though sole
dependence on quantitative methods can lead to neglect some socio-cultural contexts in which
the variables being measured exist. In a nutshell, both methods have their limitations but biases
in one method could offset the biases in the other. Hence, means for seeking convergence across
qualitative and quantitative methods became established (Creswell, 2009).
Page 91
78
As a result, the mixed method adopts the combination of qualitative and quantitative methods
(Bryman, 2012). Creswell (2009) suggests the use of multi-methods strategy that can be
introduced at any stage of the research process- from the initial exploration of the topic or
concept(s) through data collection to the analysis stage- to improve the researcher‘s ability to
determine the accuracy of findings in a more convincing manner.
The primary objective of ‗mixed methods‘ is to draw from the strength of each method and
minimize the weaknesses of individual approaches (Johnson and Onwuegbuzie, 2004). Creswell
(2009) suggests the use of multi-methods strategy, as this would improve the researcher‘s ability
to determine the accuracy of findings as well as convince the audience of that accuracy. The
position of the post-positivist, particularly a critical realist, is that all measurements are fallible;
hence it becomes important to employ multiple measures and observations and use triangulation
to obtain a better representation of reality. Typically, triangulation will involve combining
quantitative and qualitative methods to ensure the reliability of a particular research tool and
accuracy of the data collected through each method (McNeill and Chapman, 2005). Cresswell
(2009) suggests triangulating different data sources of information by examining evidence from
the sources and using it to build a coherent justification for themes.
On the part of demerits of the mixed-method approach, Devine and Heath (1999) mention that
multiple methods are likely to come up with inconsistent findings, which results in the question
of what to do with the data (whether to merge all or ignore some of the data). Also, multi-
Page 92
79
methods approach can be expensive and produce enormous amounts of data which can be
difficult to analyze (Devine and Heath, 1999).
The position of the post-positivist, particularly a critical realist, is that all measurements are
fallible hence it becomes important to employ multiple measures and observations and use
triangulation to obtain a better representation of reality. However, it has been advised that
researchers should carefully consider the reason for choosing individual methods, the study aim
and hypotheses and the main philosophy underpinning the investigation (Creswell, 2009).
Furthermore, Creswell (2009) identifies four important factors that influence the design
procedure for a mixed methods study: timing, weighting, mixing and theorizing perspectives.
The issue of timing relates to whether the gathering of the two types of data (qualitative and
quantitative) will be in phases or will run concurrently, and depends on the intent of the
researcher or the nature of the study. While in some cases, it may be desirable to collect
qualitative and quantitative data concurrently and simultaneously rather at different times, this
research explored the topic by collecting qualitative data first and later on, data are collected
from a large number of respondents/subjects (see the following sections for details).
The second aspect identified by Creswell (2009) is weighting, which connotes the priority. Based
on the nature of the study, the weight might be equal or one method may feature more
dominantly over the other. The priority given to any of the two methods will be determined by
the research‘s interest, the subjects of the study, and what the investigator intends to emphasize
Page 93
80
in the study (Creswell, 2009). By keeping the aim of the study in mind (to examine the
relationships among the given constructs), this study laid more emphasis on the quantitative data.
Mixing of two methods will normally take place in one of three forms: data are combined at one
end of the continuum, kept separate at the two ends, or mixed in some way between the two
extremes (Creswell, 2009). Thus, mixing involves integrating the qualitative and quantitative
data by combining the two. In this study, the focus of the qualitative research was to exhaustively
explore the dimensions of the research constructs (service quality, customer value, satisfaction
and behavioral intentions), in order to modify the survey instrument by reflecting the basic
variables pertinent to the research context.
The qualitative research was used to explore the data pertaining to the conceptualization of the
constructs by interviewing hotel managers, consultants and corporate clients of the hotels, review
of relevant literatures, and travelers‘ reviews/experiences posted on the website
(www.tripadvisor.com). Whereas the quantitative research method was used to measure the
constructs and the extent of influence apparent among them by using the primary data gathered
through structured questionnaire. Therefore, the results from the initial qualitative research were
used as the basis of developing the research instrument for the next phase to obtain quantitative
data, hence connecting the first phase to the second by blending both qualitative and quantitative
research.
The fourth aspect, theorizing, is concerned with the theoretical perspective that guides the entire
design of the study. Typically, theories used in guiding the research are contained in the sections
Page 94
81
detailing framework that shapes the type of questions asked, who participates in the study, how
data are gathered, and the implications made from the study (Creswell, 2009). The six types of
mixed methods strategies include: Sequential explanatory strategy, Sequential exploratory
strategy, Sequential transformative strategy, Concurrent triangulation strategy, Concurrent
embedded strategy, and Concurrent transformative strategy (Creswell, 2009).
In this research, a sequential exploratory mixed methods approach was adopted that involved the
qualitative data gathering and analysis, in the first phase, followed by quantitative data gathering
and analysis based on the results of the initial qualitative data, in the next phase. This strategy is
particularly useful when research is modifying an instrument and/or confirming a scale
(Creswell, 2009), like the one in this study to determine service quality attributes/dimensions
3.2 Research Design
Research design provides framework for the collection and analysis of data (Bryman, 2012). It
specifies the method and procedures to be used to acquire needed information in conducting a
research to properly address its objectives (Green, Tull & Albaum, 2005). Accordingly, there are
three major research designs adapting different approaches: exploratory, descriptive and causal
research designs (Churchill & Iacobucci, 2002; Cooper & Schinedler, 2008).
Exploratory research most commonly uses qualitative approach to gain insight of broader
ideas/issues hence, suitable at the preliminary stage of a research and/or in areas where well
established theoretical frame work is not present (Burns & Bush, 2000; Churchill & Iacobucci,
2002).
Page 95
82
On the other hand, descriptive research usually applies survey method and quantitative approach.
It attempts to describe the characteristics of research variables to measure and predict the same.
In order to thoroughly explain the relationship between variables the most appropriate approach
is to apply co-relational/explanatory research design, which is helpful in analyzing the nature and
extent of relationship that might exist between the research variables/dimensions/constructs, by
applying various inferential statistical tools (Churchill & Iacobucci, 2002). Finally, causal
research design attempts to investigate cause-and-effect relationships by applying experimental
approach to test hypotheses on causality of research variables (Kothari, 2004). This study applied
a combination of exploratory, descriptive and explanatory research designs at different stages of
the research process to thoroughly address the objectives of the study.
By applying the exploratory design, the research aimed to exhaustively observe the variables
related to the research constructs and pertinent to the specific context i.e., hotel sector in Ethiopia
(which was not empirically studied before). Whereas the descriptive design was adopted to
measure and describe the level of perceived service quality, customer value, satisfaction and
behavioral intentions; explanatory research design was used to explain how and to what extent
the above stated constructs were related (Cronin, Bradly & Hult, 2000; Cooper & Schinedler,
2008).
In a nutshell, the right mix of research paradigms, approaches, methods and designs adopted in
this study were applied after carefully examining their features, applications and inherent
limitations. As discussed above, the limitations of the research methods and designs were
Page 96
83
nullified by adopting a mix of methods and designs in order to capitalize on their respective
strengths. Accordingly, by adopting both qualitative and quantitative methods, it remained
possible to exhaustively gather qualitative data in the first phase and use it to develop the
instrument for second stage of data collection to examine the interrelationships of the study
constructs, quantitatively.
Since qualitative data might be subjective, extensive care was taken not to take their limitations
on the research output of the study. For instance, the data gathered from website reviews were
taken just for identification of service quality issues/concerns and no inference or generalization
was made on its basis. Second, participants for FGDs were carefully selected (being well
informed, responsible and professionals). Third, information gathered from focus group
participants was triangulated from literature review to modify the existing SERVPERF
instrument.
Additionally, while quantitative data allow higher level of statistical analysis and hypothesis
testing based on established theories, they might have limitations on capturing variables pertinent
to unique research contexts (where similar studies have not been taken). Therefore, quantitative
data have to be supported by qualitative ones. This study used both qualitative and quantitative
data by adopting a mix of research designs. By considering that exploratory study alone would
not address alone the research objective of examining the relationship between the study
constructs, .co-relational/explanatory research design was used in addition. Specifically, the
study focused on measuring perceived service quality (the predictor variable), and the extent to
which it can influence customer value and satisfaction (being mediating variables) and
Page 97
84
behavioral intentions (the criterion/dependent variable) of hotel customers, without making any
claim to establish a cause-and-effect relationship (Cronin, Bradly & Hult, 2000; Graziano &
Raulin, 2010; Riadh, 2009a; Mosahab, Mohammed & Ramayah, 2010).
3.3 Study Population and Sampling Techniques
3.3.1 Target Population, Unit of Analysis and Sample Frame
The population of the study covered all the guests/customers to the three, four and five star
hotels in Ethiopia. The unit of analysis for this research is three, four and five star hotels in
Ethiopia. As per MoCT (2010), there were a total of 173 hotels in Ethiopia, rated from one to
five stars. After the year 2011, the MoCT suspended, temporarily, the stars rating to the hotels in
Ethiopia, as being engaged in developing a more comprehensive star rating guideline. As a
result, the hotels started their operations after 2011 were not star rated by the Ministry, rather
used their investment licenses to claim that they belong to a specific star category.
Table 3.1: Star category hotels in Ethiopia
Star rating No. of Hotels % No. of Rooms %
Five 3 2 794 15
Four 16 9 1073 20
Three 30 17.3 1368 25
Two 42 24.3 1527 27
One 82 47.4 695 13
Total 173 100 5457 100
(Source: MoCT, 2010)
Table 3.1 presents the statistics of star (category) rated hotels in Ethiopia, as presented by MoCT
(2010). However, the most recent publication pertaining to the sector (MoCT, 2013a) did not
Page 98
85
report the number of hotels in their respective star categories, rather claimed that the number of
all types of hotels in Ethiopia increased annually by 17% between the year 2010 and 2012.
Therefore, the sample frame was revised (from what was originally proposed) to reflect the
annual increase in the number of hotels. Accordingly, it was estimated that around 78 hotels in
Ethiopia belong to three and above star categories (more than what is presented in Table 3.1) by
the end of 2013, of which, more than 65% were already rated by the ministry before 2011, and
the remaining claim the stars rating in the light of their investment licenses. Hence, the revised
sample frame for this study was determined to be 78 hotels in Ethiopia, in three, four and five
star categories.
Table 3.2: Target population
Issue to consider Amount/Number Output/Result
Tourist arrival forecasted for the year 2013 750,000 -
Average tourist flow in the 4th
quarter (Oct. , Nov.,
Dec.) of 2013 (i.e., the planned survey period)
26% of the annual
tourist flow
750,000*26/100=195,000
Average number of tourists/ guests staying in any of the
star hotels
70% 195,000*70/100=156,000
Three, four and five star hotels market share of rooms 60% 156,000*45/100=93,600
Average occupancy of the three, four and five star hotels 70% 93,600*70/100=65,520
Sample frame for the study (the number of customers/
guests forecasted to be staying in the 3, 4 and 5 star
hotels during the survey period)
65,520 Around 9% of the total
population
(Source: Computed based on MoCT, 2010)
In order to determine the number of tourists/ guests (target population) visiting and staying in the
selected (three, four and five star) hotel categories, MoCT (2010) forecast was used. According
Page 99
86
to it, 750,000 tourists were expected to visit Ethiopia in the year 2013(see Table 3.2). This
number was assumed to be crude to carry out sampling for this study. Hence, by following
Green, Tull and Albaum (2005) and based on the MoCT (2010) forecast, target population was
computed to be 65,500 customers/guests who would be staying in the three, four and five star
hotels in Ethiopia during the planned survey period (i.e., November, 2013 to January, 2014).
However, the research excluded the hotels below three stars from the unit of analysis for the
following major reasons:
By considering the total number of three, four and five star hotels (unlike most researches
focusing on one or two star categories) in the unit of analysis, the study already covered
28% of star hotels that have 60% market share (based on the number of available rooms
for the customers). This was considered to be sufficient to represent the Ethiopian hotel
sector.
The customers‘ profile and service requirements in one and two star hotels differ,
significantly, from that in three and above stars. Therefore, inclusion of the hotels below
three stars would invite a target group that is beyond the focus of the study (MoCT,
2010).
The facilities and service delivery provisions in the selected three and above star hotels
are appeared to be notably better than the lower star categories hotels (one and two) thus,
including the later categories might exaggerate service quality problems being witnessed.
Page 100
87
3.3.2 Sample Size
In order to determine the sample size for the quantitative study, usually three criteria are required
to be specified: precision level (or sampling error), level of confidence (or risk), and the degree
of variability in the attribute being measured (Miaoulis & Michener, 1976). Moreover, there
appears to be four standard techniques/strategies to determine the sample size:
i. using a census for small population;
ii. using a sample size of a similar study (rule of thumb);
iii. using published tables (e.g., Krejcie and Morgan, 1970); and
iv. using formulas to calculate sample size (e.g., Yemane, 1967).
The sample size for the survey was determined based on the sample frame and by using the
Krejcie and Morgan (1970) table to determine the sample size with 95% confidence level and
5% confidence interval. In this way, an initial sample size of 382 was determined for the
calculated target population of 65,520. By giving 15% allowance for possible low response rate
and errors in filling the survey questionnaires, the sample size was increased to 440. The next
section on sampling technique shed light on the approach of sampling being used by the study.
3.3.3 Sampling Technique
Proportionately-stratified random sampling technique was applied in order to select the
respondents of the study for the purpose of primary data collection by using structured
questionnaire. All the hotels in the country were classified into three categories (three, four and
five stars) and were approached by the researcher to take part in the study.
Page 101
88
The researcher approached a total of 59 hotels located in Addis Ababa (out of the 63), which are
grouped into three, four and five star categories. Four hotels were excluded, being under
renovation/construction, hence not found receiving customers. Of 59 approached hotels, 32
accepted the invitation by expressing their willingness to take part in the survey, which
represents well above 50% of the unit of analysis for Addis Ababa region. However, out of
another 30 hotels (three and four stars) being approached in the regions, only 12 hotels found in
the cities of Bahir Dar, Hawassa, Dire Dawa, Nazereth and Debrezieth ( from South, North, East
and Central parts of Ethiopia) accepted the invitation to take part in the study. In this way, the
regional participation of the hotels was insured to generalize the study findings across the
country. Table 3.3 presents the category-wise participation of the three, four and five star hotels
in the study.
Table 3.3: Participating hotels by star category and location
In Addis Ababa Regional cities Total Percent
Three Star 17 8 25 57
Four Star 11 4 15 34
Five Star 4 0 4 9
Total 32 12 44 100
(Source: Survey data, 2014)
As revealed from Table 3.3, out of the total participating hotels, around 57%, 34% and 9%
respectively are three, four and five star hotels. This proportion reflects the approximate
composition of the star hotels in Ethiopia, which is about 60%, 32% and 8% for three, four and
five star hotels, respectively (MoCT, 2010). Considering the regional distribution of the
Page 102
89
participating hotels, large majority (72.7%) of the hotels were from Addis Ababa and the
remaining (27.3%) from the Ethiopian regions/state capitals. Also, this distribution of sample
gives adequate representation to the star hotels in the regional cities, which were reported to be
around 20% (MoCT, 2010).
Therefore, 44 hotels that were found willing to participate in the study were considered to be
forming the strata from which the sample of respondents was selected (Cooper & Schinedler,
2008). Accordingly, the computed sample size (440) was first distributed to these 44
participating hotels, in proportion to their rooms (numbers), and then the respondents were
selected by applying simple random sampling technique (Churchill & Iacobucci, 2002) from
each of the hotels, based on the selected rooms (by using drawings/lottery method following
Green, Tull & Albaum, 2005).
The customers/guests staying in that particular hotel room were assumed to be the respondents of
the study and provided with the questionnaire to fill, as per their convenience, and returned back
to the reception. However, a particular customer/guest was selected based on his/her stay for at
least one night in the corresponding hotel, to avoid any biasness or immaturity in their
assessment of service performance/delivery.
3.4 Data Collection Procedure
3.4.1 Exploratory Study
As stated earlier, review of travelers comments posted on the website (www.tripadvisor.com),
which is considered to be among the popular websites for putting comments, experiences and/or
Page 103
90
recommendations on the global hospitality and tourism industry. The reviews were made to
understand the service quality appreciations and/or gaps (through their posts to the website)
being identified by the visitors/customers to the 44 star category (selected) hotels in Ethiopia.
Detail description of exploratory inquiries is given hereunder:
Web Review
In addition to the review of relevant theoretical and empirical literature pertaining to the
conceptualization of study constructs and their interrelationships, website review was carried out
to obtain service quality perceptions of the hotels‘ customers/guests, being tourists (both
domestic and foreigners). For the purpose, comments posted on the website
(www.tripadvisor.com) were reviewed to identify the issues being raised by the visitors (to the
hotels) related to service quality, value, satisfaction and behavioral intentions. As an average, 10
posted comments per hotel had been reviewed from the website, making it a total of 460
comments (for all the 46 hotels). Accordingly, the comments were classified (in line with the
study constructs), summarized and cross-checked with published literature to gain understanding
on the pertinent issues, and to further inquire as questionnaire items. The latest areas of concerns
related to service quality and associated satisfaction (pertinent to Ethiopian hotel context) were
appeared to be:
o Shuttle /Airport transport service (to and from the hotel)
o Internet network connection (in hotel)
o Breakfast variety and food quality (in hotel restaurants)
o Hotel location
o Entertainment and recreation facilities (in hotel)
Page 104
91
However, among the three popular dimensions of behavioral intentions (WOM
recommendations, repurchase/revisit and willingness to pay premium price), as stated by Raza et
al. (2012), only the first two (WOM recommendations and revisit) were highlighted by the hotel
customers/guests through their comments on the website. Since the purpose of this review was to
identify the issues pertinent to service quality, perceived-value, satisfaction and behavioral
intentions, in the Ethiopian hotel sector, no inference and/or conclusion were made at this stage.
Furthermore, all the issues captured in the review were brought forward to three focus group
discussions (FGDs), as presented below, for further investigation.
Focus Group Discussions (FGDs)
Three Focus Group Discussions (FGDs) were conducted by the researcher, involving the
relevant stakeholders of the study area. Participants of all the three FGDs were selected through
judgmental sampling approach. This approach ensures the selection of all relevant and informed
participants (key stakeholders). The focus groups were:
i. Hotel Managers: Five hotel managers, including one room division director of a five star
hotel, two from four star hotels (a general manager and a marketing manager) and
two from three star hotels (a general manager and a housekeeping manager), were
selected to take part in the first FGD.
Based on the FGD with the hotel managers the market segmentations of the hotels and the key
accounts (most important corporate clients) were known. It was also learned that besides being
producers of significant revenue for the hotels, these corporate clients have better understanding
Page 105
92
of the service quality and satisfaction of their guests (staying in these hotels). Accordingly, the
following participants were selected being having valuable inputs for the FGDs.
ii. Hotel Corporate Clients: Six booking agents (of corporate clients) were selected, one
each from airline, tour operator, international agency, non-governmental organization
(NGO) and business organization domains. These were selected due to their large size
of bookings and frequency of relationship with the hotels and their customers, who
are staying in the hotels. This made them highly valuable informant for the FGDs.
iii. Hotel Consultants: Five hospitality professionals were selected, who are presumed to be
having experience as hotelier and working as consultants (providing trainings and
consultancy services) in the hotel sector. These consultants were identified by looking
into the hotels they have consulted. Moreover, their rich experience and theoretical
understanding of the research variables were considered to bring significant issues,
during the FGDs, pertaining to service quality and associated constructs in the hotel
sector.
In selecting the participants for FGDs, due care was taken to include informants having
operational relationship and practical experience with guests and those possessing theoretical
understanding of the study constructs. The researcher took extensive effort by repeatedly visiting
the hotels, making observations and informal discussions with the hotel employees. The review
of the comments posted on the travelers‘ website (www.tripadvisor.com) indicated who should
be the right person having better information and direct involvement with customer service,
Page 106
93
satisfaction and revisit issues. Accordingly, hotel managers were selected from different hotels
and operation lines. The selected managers include: general manager, room division director (
responsible for front office, housekeeping and guest service), housekeeping manager and
marketing manager, who were presumed to be having understanding of hotel services along with
the responsibility of securing customer satisfaction and revisits. Because the purpose of the
FGDs was to enrich the general understanding on pertinent service quality, customer satisfaction,
value and behavioral intentions issues rather than capturing every detail of incidents in the
hotels, the involvement of other hotel employees was not considered as relevant.
Besides, all the participants were encouraged to discuss the issues (of service quality, customer
satisfaction, value and behavioral intentions) without focusing on particular customer or hotel to
give more confidence for discussion and enhance trustworthiness of information. The selection
of well informed FGDs‘ participants having direct responsibility for service quality issues,
coupled with the freedom of expression of thoughts, enhanced the trustworthiness of gathering
the qualitative data. Furthermore, the FGDs data were triangulated with literature review and
comments obtained through travelers‘ website (www.tripadvisor.com).
Specifically, during each of the FGD, the objectives of the study and purpose of the group
discussion were communicated to gain deep understanding by the participants. They were asked
to present their experience on the most important service quality variables/items that affect
customer satisfaction, perceived-value and possible behavioral (intentional) outcomes of their
guests. Specifically, the focus group participants were provided a list of service quality attributes
to rank as per their importance to the hotel customers/guests, which may influence the guests‘
Page 107
94
satisfaction, perceived-value, and behavioral intentions to revisit and provoking positive WOM
communications to others.
The FGDs follow the guidelines proposed by Krueger and Casey (2009), in selecting the type
and number of participants, conducting the sessions, analyzing and reporting outcomes. The
FGDs guidelines are annexed (Annex-D). The issues raised by FGDs participants were recorded
and summarized. The findings of the FGDs were triangulated with the literature review and
issues being raised by the travelers (through reviews posted on www.tripadvisor.com) to observe
study variables peculiar to the hotel context.
Additionally, pertaining to WOM, following groups were found to be the most common to which
guests intend to recommend, or comment about, their hotel service experiences:
i. Acquaintances (A-WOM) - those who have close affiliation including family, friends, and
colleagues.
ii. Booking Contacts (BC-WOM) - those parties having business relationship and having
stake in the booking including own company bookers, travel agents, booking sites,
airlines, sponsors (those who pay for the stay).
iii. Direct Comments (D-WOM) - includes comments made directly to the hotel staff and
management or on the comment card prepared by the hotel.
iv. Electronic Comments (E- WOM) – these comments and/or recommendations are made on
the internet through different types of social media and websites.
Page 108
95
These dimensions of WOM were included in the data collection instrument to study the specific
targets of hotel guests‘ WOM recommendations, as presented in the following section.
3.4.2 Data Collection Instrument and Scales
As stated earlier, this research applied survey method to gather the primary data from the
respondents by using structured questionnaire. The exploratory study conducted was the major
input, along with the literature reviewed, to develop the data collection instrument. The original
data collection instrument was adapted mainly from SEVPERF instrument (Cronin and Taylor,
1992). Review of travelers‘ comments and focus group discussion were found to be helpful in
gathering additional focus, related to the research constructs and associated attributes from the
Ethiopian perspective. Triangulation of the exploratory study findings, in light of pervious
research studies, was made to modify the instrument in a more consistent and meaningful
manner.
Table 3.4, presents the modified questionnaire scale items, adapted from the researchers stated
corresponding to each item. As presented below, questionnaire items used in recent studies were
consolidated and adapted. The instrument consisted of 35 items on a five-point (1-Strongly
disagree, 2-Disagree, 3-Neutral, 4-Agree and 5-Strongly agree) Likert type scale (Wilkinson &
Birmingham, 2003), primarily adapted from SERVPERF model. The questionnaire items are
structured in accordance to the respondents‘ service experience to ease their understanding and
increase response rate. The questionnaire was constructed into two sections. In the first section,
there remained 35 scale items, out of which 26 were used to measure service quality, 4 for
customer value, 3 for customer satisfaction, and the remaining (3) measure behavioral intentions
Page 109
96
(including an additional item to identify target audiences of WOM) of the responding customers.
The second section of consisted of items pertaining to customers‘ socio-demographic profile.
The final version of the questionnaire is annexed (Annex-A) for reference purpose.
Table 3.4: List of items and references for the questionnaire development
S.N Description of the item Dimension/
Construct
SERVQUAL/
SERVPERF
item
Adapted from
1 The hotel provides reliable (timely)
airport transfer service
Reliability No FGD
2 The hotel staff welcome guests that
creates a comfortable feeling
Assurance Yes Nelson and Hailin
(2000); Asad and Tim
(2010)
3 The hotel staff are always courteous Assurance Yes Parasuraman, Zethaml
and Berry (1988); Cronin
and Taylor (1992)
4 The hotel staff have good command
of English
Assurance Yes Parasuraman, Zethaml
and Berry (1988); Cronin
and Taylor (1992)
5 The check-in and check-out services
are quick and easy at the hotel
Responsiveness Yes Nelson and Hailin
(2000); Asad and Tim
(2010)
6 The hotel provides services as being
promised (during reservation)
Reliability Yes Parasuraman, Zethaml
and Berry (1988);
Cronin and Taylor (1992)
7 The hotel staff perform services
right/correctly at the first time
Reliability Yes Nelson and Hailin
(2000); Thanika (2004)
8 The hotel staff are willing to provide
prompt assistance to guests‘ requests
and problems
Responsiveness Yes Nelson and Hailin
(2000); Thanika (2004);
Asad and Tim (2010);
Riadh (2009a)
9 The hotel staff provide service to
meet guests‘ best interest (as per the
requirements)
Empathy Yes Nelson and Hailin (2000)
10 The hotel staff provide service in a
caring fashion being friendly
Empathy Yes Parasuraman, Zethaml
and Berry (1988);
Cronin and Taylor (1992)
11 The hotel staff provide undivided
attention to the guest
Empathy Yes Nelson and Hailin
(2000); Halil and Kashif
(2005a); Riadh, (2009a)
Page 110
97
12 The hotel staff have neat appearance Tangibles Yes Nelson and Hailin
(2000); Thanika (2004);
Asad and Tim (2010)
13 I am quite satisfied with the service
received from the hotel‘s staff
Customer
Satisfaction
No Jani and Han ( 2011)
14 The hotel‘s rooms are clean and
comfortable
Tangibles Yes Nelson and Hailin
(2000); Thanika (2004)
15 The hotel‘s rooms have visible
(quality) amenities like TV, phone,
safe, refrigerator etc.
Tangibles Yes Barbara and Pamela
(2004); Riadh, (2009a)
16 The hotel rooms are quiet Tangibles No Nelson and Hailin (2000)
17 The bathrooms in the hotel are neat
and clean
Tangibles Yes Thanika (2004)
18 The hotel rooms are equipped with
effective internet connectivity
Tangibles No FGD
19 The hotel maintains reasonable room
rates to offer high value for money to
its customers
Customer
Value
No Nelson and Hailin
(2000); Asad and Tim
(2010)
20 I am quite satisfied with the
appearance of / facilities in the hotel
rooms
Customer
Satisfaction
No Jani and Han ( 2011)
21 The hotel‘s bar/s and restaurant/s
have good ambience
Tangibles Yes Thanika (2004);
Asad and Tim (2010);
Riadh (2009a)
22 The complimentary breakfast at the
hotel is of good quality
Tangibles No FGD
23 The hotel‘s restaurant/s offer good
quality food
Tangibles No Nelson and Hailin
(2000); Asad and Tim
(2010)
24 The hotel restaurant delivers prompt
service to its customers
Responsiveness Yes Barbara and Pamela
(2004); Asad and Tim
(2010)
25 Pricing at the hotel‘s restaurant is
reasonable and dictates value for
money to customers
Customer
Value
No Nelson and Hailin
(2000); Thanika (2004);
Asad and Tim (2010);
Halil and Kashif (2005a)
26 I found myself satisfied with the
hotel‘s bar and restaurant service
Customer
Satisfaction
No Jani and Han ( 2011) ;
27 The hotel provides modern recreation
facilities (e.g. Spa, Gym, etc.)
Tangibles Yes Nelson and Hailin
(2000); Riadh (2009a)
Page 111
98
28 The hotel guarantees/ensures reliable
reservation services
Reliability Yes Nelson and Hailin (2000)
29 The hotel billing and payment
systems are free from error
Reliability Yes Thanika (2004); Barbara
and Pamela (2004); Halil
and Kashif (2005a)
30 The hotel location is convenient/for
my purpose/
Tangibles No FGD
31 The overall service quality of the
hotel is acceptable
Over all
Service Quality
No Negi (2010)
32 Overall, the price I paid is reasonable
compared to the value of services
being received from the hotel
Customer
Value
No Cronin, Bradly and Hult
(2000)
33 I am satisfied with the hotel‘s overall
service provisions
Customer
Satisfaction
No Jani and Han (2011);
Edward and Sahadev
(2011)
34 I will use this hotel services again
whenever I get the chance
Behavioral
Intentions
No Edward and Sahadev
(2011); Jani and Han
(2011)
35 I will recommend this hotel to others
(e.g. friends, colleagues, relatives
etc.)
Behavioral
Intentions
No Edward and Sahadev
(2011); Jani and Han
(2011)
36 Please specify to which of the
following you are most likely to tell
about your hotel experience
Behavioral
Intentions
(adapted from
FGD)
A) Acquaintances
B) Booking contacts
C) Directly to the
hotel
management and
staff
D) Electronic media,
websites
3.4.3 Main Survey
As stated earlier, data collection for the main survey was carried out between November 2013
and January 2014. According to MoCT (2013a), the month of December is considered to be off-
season, while January appeared to be the beginning of peak-season in the Ethiopian hotel sector.
Page 112
99
As a result, the researcher was convinced that capturing customers‘ perception across seasons
would give better representation of observations for the study.
The researcher approached the hotels with a formal cooperation letter requesting them to
participate in the study. In order to take the hotel management into confidence, the purpose of the
study was communicated along with the impression that no hotel operations and the guests‘
convenience will be disturbed during the data collection.
Furthermore, the printed questionnaires were distributed to the customers/guests with randomly
selected rooms. For the purpose, front office/reception desk documents/registers were used to
identify room occupancy, and room numbers were used to draw the rooms to be sampled from.
The questionnaires were then given to the selected room guests at the front desk, by requesting
them to bring the completed questionnaire back upon their departure.
A total of 440 questionnaires were distributed to the selected hotels in proportion to the number of
their guest rooms. However, caution was taken to avoid over or under representation of hotels
with extremely large or small number of rooms (compared to the others in the unit of analysis).
Hence, the hotels were classified not only by star categories but also by the respective number of
rooms for the purpose of determining the required number of questionnaires distribution. In order
to compensate the possibility of having questionnaires not completed in a single attempt, the
process was repeated until all the questionnaires assigned to each hotel were completed and
returned back by their customers. Afterwards, all completed questionnaires were collected back
by the researcher from the front office and used in the final analysis (see Table 3.5).
Page 113
100
Table 3.5: Survey respondents
Hotels In Addis Regional cities Total Percent
Three Star 150 62 212
49
Four Star 120 32 152 35
Five Star 71 0 71 16
Total 341 94 435 100
(Source: Survey data, 2014)
However, due care was taken to avoid inquiring the same guest to fill the questionnaire twice.
Since the questionnaire was a self administered, it was accompanied by a heading letter
requesting the cooperation from the respondents with well stated research objective/purpose, to
avoid any misunderstanding or biasness.
As presented in the Table 3.5, around 78% of the respondents were hotel customers/guests from
the Addis Ababa, and remaining (22%) were from the regional hotels (out of Addis). By
considering the distribution of respondents among the hotels (star) categories, around 49% of the
respondents were stayed in three star hotels, followed by 35% in four star and remaining (16%)
in the five star hotels. This further was found to be in line with the market potential, determined
by the number of rooms available in each star hotel category, by the MoCT (2010).
3.5 Scale Reliability and Validity
The quality of the research outcome is judged against two criteria: reliability and validity. In
other words, reliability and validity are the two pillars of scientific research methods. According
to Cooper and Schindler (2008:236), ―a measure is reliable to the extent that it supplies
Page 114
101
consistent results.‖ The reliability of the measuring instrument shall be ensured even before
considering the validity of the measurement instrument. Similarly, O‘Leary (2014: 67) provided
a concise definition of reliability as, ―the consistency or dependability of a measuring
technique.‖
Generally, it is believed that reliability tests help to evaluate the quality of the data. In this study,
Cronbach alpha coefficient was used to examine the internal consistency of the items. According
to Nunnaily (1978) and Churchill (1979), the measurement scale would be considered as reliable
if the Cronbach alpha (coefficient) value is 0.70 or higher. However, in the context of qualitative
research, being used in the first phase of the study, reliability refers to the degree to which
another researcher‘s work would generate similar results to the given study (Creswell, 2009).
Given the nature of qualitative research, the researcher is a potential source of bias in terms of
how the data are analyzed and interpreted, in addition to the possible influence on the type of
moderation (in focus group setting), questions asked, and the condition under which participants
respond to them.
To minimize the risk of FGDs participants‘ biasness, Saunder, Lewis and Thornhill (2007)
recommend that the moderators need to demonstrate credibility and trustworthiness through
explaining the purpose of the discussion and the exact nature of the data required, and use
probing questions to explore and/or seek explanation, while projecting an attentive though
unbiased image. These guidelines were strictly followed by the researcher during FGDs in this
study to ensure the reliability of the qualitative research. As a result, participants for the FGDs
were selected based on their understanding of the study area/constructs, assigned responsibility
(managerial position) and professional commitment, across a range of portfolios linked with the
Page 115
102
hotel sector. Additionally, anonymity of the participants were maintained to ensure
trustworthiness of the data gathered, as it arrests the potential bias which might have been caused
as a result of specific interests of the participants.
On the other hand, Aaker, Kumar and Day (1998) claim that a measure has validity if it measures
what it is supposed to measure. Cooper and Schindler (2008) share the same view and stated
validity as the extent to which a test measures what we actually wish to measure. Furthermore,
they emphasized that reliability is a necessary contributor to validity but is not a sufficient
condition for it. All the necessary precautions were taken to ensure the validity of the data
collection instrument. A systematic and exhaustive literature review was conducted to identify
the valid measures of the variables involved in the model. The content validity of the data
collection instrument was ensured through evaluation of the quality of the reported findings on
related measures by using systematic literature review. Besides, three marketing professors (in
Addis Ababa University) were requested for their opinion on the relevance, appropriateness, and
adequacy of the questionnaire items and structure, thus ensuring face validity.
Face validity should not be confused with content validity because they are distinct. While face
validity is a post-hoc claim that the items in the scale measure the construct, content validity is a
priori evidence that the items are a good representation of the construct (Nunnaily, 1978).
Though, there is no stringent procedure for establishing face validity and content validity, these
are more appropriately determined by the individuals who respond to the survey or experts who
are familiar with the research domain (Green, Tull & Albaum, 2005). Therefore, two distinct
procedures (expert opinions and pilot testing of questionnaire, given in the next section) were
Page 116
103
undertaken to determine the extent to which the scale items were suitable and conclusive in
measuring their respective constructs. The feedback obtained from both the approaches was
considered as an input to modify the content, layout, and presentation of the questionnaire, to
ensure both content validity and face validity.
In addition, construct validity involves providing evidence about the factors that cause the
manifestation of the construct. According to Nunnaily (1978), in terms of scale development,
there are three conditions that must be satisfied for construct validity to be achieved.
i. The construct has to be clearly defined. In this study, perceived service quality was
defined as a formative construct, composed of attributes/dimensions.
ii. The construct must be well represented by the scale items. Representativeness of scale
items requires a strong relationship between items measuring the same construct in
order to ensure internal consistency.
iii. The construct must display a strong relationship with similar constructs. This facilitates
the investigation of the relationship between theoretically related variables and the
construct under investigation.
Green, Tull and Albaum (2005), state that construct validity is the most complicated type of
validity, which can be assessed by convergent and discriminant validity. Convergent validity
refers to the extent to which individual measures correlate with associated measures i.e., holding
high degree of correlation between related variables. Conversely, the discriminant validity seeks
to offer evidence of the extent to which the scale provides a distinct and superior measure. In
Page 117
104
other words, while convergent validity relates to the uni-dimensionality, discriminant validity
indicates the distinctiveness of the scale from the theoretical unrelated variables. As a result,
construct validity was ensured through Exploratory Factor Analysis (EFA), performed on the
scale items in the final data set.
3.5.1 Pilot Testing of the Questionnaire
In order to ensure the reliability of the data collection instrument, a pilot test was conducted. To
this end five hotels were selected, two each from three and four star categories and one from five
star category, and fifty (50) questionnaires were equally distributed to the customers/guests in the
hotels by using judgmental sampling technique, by picking those guests who have more/longer
experience with the hotel services. Out of the fifty questionnaires, thirty five (35) being duly
filled, were returned on time and used for the pilot testing of the questionnaire, to insure the
associated scale reliability.
The findings of the pilot study revealed that the instrument was reliable to measure the constructs
under investigation with the overall Cronbach alpha of 0.936, which is above the acceptable
value of 0.70 (Churchill, 1979). Similarly, all the dimensions scored well above 0.70 as
Cronbach alpha coefficient thus, assumed to be reliable with their corresponding items. This
guided to retain all the scale items in the final questionnaire. Furthermore, it was found that on
the average it takes 7-10 minutes to fill the questionnaire by the study respondents. It was also
noted that guests feel uncomfortable to be approached while they were in their rooms to request
to fill the questionnaire.
Page 118
105
Therefore, based on the feedback of the pilot testing, the necessary corrections were made in the
approach of data collection by giving the questionnaire at the front desk/reception when the hotel
customers come to pick their keys. Additionally, they were requested to return back the filled
questionnaires at the reception on departure.
3.6 Data Analysis Techniques
The gathered data have been screened before being entered for processing to check if all the
questionnaires were duly filled and the responses provided are legible. Incomplete questionnaires
(5) were discarded from analysis. All eligible questionnaires were numbered, and the respective
items were coded before starting the analysis process as directed by Marczyk, Dematteo and
Festinger (2005).
For the purpose of analysis, SPSS 20 software was used. The data analysis was designed and
conducted to warrant the validity and reliability of the gathered data, by answering the main and
specific research questions and testing of the research hypothesis (Cooper & Schinedler, 2008;
Graziano & Raulin, 2010). Exploratory Factor Analysis (EFA) was used to test the construct
validity (being uni-dimensional) and Cronbach alpha coefficients were computed to test the
reliability of construct items by following Green, Tull and Albaum (2005). The mean scores and
standard deviations were computed per dimensions and items for descriptive analysis. Bivariate
correlations, using Karl-Pierson correlation coefficients, were obtained to analyze the
relationship between the constructs of the study.
Page 119
106
Further, regression analysis was used to assess the influence of explanatory variables on the
dependent variables. Finally, t-test and ANOVA techniques were applied to analyze the
differences between and among the response profiles across the participants groups and
constructs, respectively, as guided by et al. (2010).
3.7 Ethical Considerations
This research was conducted by giving the utmost respect for ethical behavior. Ethical concerns
play important role, while assumed to be the part of the essential consideration, in the design of
any research. Consequently, diverse ethical issues were taken into consideration during this
research, from administration of the research instrument with respondents to the
acknowledgement of all the secondary sources being used. Research participants were given
freedom to participate in the study, by filling the questionnaire, and the results of the research
were presented as aggregate.
The survey itself was anonymous to the extent that no respondent was asked to write anywhere
his/her name and other contact details. Moreover, before starting filling-up of the questionnaire,
the purpose of the research was clearly explained to the respondents, in order to improve their
understanding and willingness to share the required information.
In general, great care was taken to fulfill all the criteria of ethical research, including:
Minimizing respondents‘ and researcher‘s bias by giving fair chance for research units
(participants and hotels) to be selected.
Page 120
107
By using standard instrument for data collection to reduce the researcher‘s bias while
avoiding sensitive and leading questions to be asked, and not to offend the research
participants.
Requesting the voluntary consent of research participants by using covering letter which:
o Described who the researcher is and for what purpose the research is being
conducted;
o Clearly stated that participation is voluntary and the respondent can decline any
time from taking part in the study;
o Assured that all personal information provided by the respondents will be kept
confidential and used only for the purpose of this study;
o Provided contact information of the researcher if the respondents have any inquiry
to make, with how the research findings can be accessed, as recommended by
Marczyk, Dematteo and Festinger (2005) and Salkind (2009).
Confidentiality and anonymity of research participants was given due respect.
Thus, throughout the research process all due care have being taking to comply with ethical
standards of the scientific research. The research methodology was carefully designed to arrest
researcher‘s and participants‘ bias through involving diversifying, more responsible and
professional respondents, securing anonymity, and cross checking data through triangulation.
Further, for the final survey, participants were selected through random sampling, whereby
participating hotels were formally communicated in advance for their willingness to participate.
Only voluntary adult guests were contacted to take part in the survey with clear purpose of the
study, and maximum care was taken not to interrupt guests‘ privacy during data collection
Page 121
108
process. Most importantly, the study assured that all the materials and literatures referred,
consulted and/or quoted are properly acknowledged to avoid any possibility of plagiarism.
3.8 Summary of the Chapter
This chapter presented the research paradigm, approach and methodology used in conducting the
study. Following these, the research design, unit of analysis, sample size, sampling techniques
and data collection procedures have been discussed.
To abridge, the paradigm adopted by the study is positivism, whereas both inductive and
deductive approaches were employed in the study by integrating the qualitative and quantitative
research methods. In line with the research objectives, the study adopted exploratory, descriptive
and explanatory designs. All the research paradigm, approaches, methods and designs were
applied to maximize the quality of the research output while securing methodological harmony.
Moreover, the exploratory study, in the form of website reviews and focus group discussions,
and associated data gathering process was discussed along with the presentation of the
questionnaire items. The sample frame of the study was well established being three, four and
five star hotel customers/guests in Ethiopia. The sample size was computed through a scientific
formula and the sampling technique was determined to be proportionately stratified (based on
hotel star category).
Additionally, the chapter highlighted data analysis techniques including mean, standard
deviations, correlation and regression analysis, t-test and ANNOVA, used for hypotheses testing
Page 122
109
and addressing associated research objectives. Finally, the ethical considerations being applied
by the study was discussed in detail. The next chapter will discuss empirical findings of the
survey data obtained from the hotels‘ customers/guests by using the analytical/statistical
techniques highlighted in this chapter.
Page 123
110
CHAPTER 4
DATA ANALYSIS
This chapter outlines the approach to data screening by highlighting the steps to check normality
of the data before moving to statistical analysis. As highlighted in the previous chapter, the
chosen method of analysis include: descriptive statistics to draw the respondents‘ profile, and
tests for scale reliability (using Cronbach alpha coefficients) and construct validity (Factor
analysis with Kaiser-normalization to identify the underlying dimensions). Regression analyses
were employed to assess the influence of the service quality on the outcome variables customer
value, satisfaction and behavioral intentions.
One-way analysis of variance (ANOVA) and independent samples t-test were employed to
identify any significant differences in the visitor perceptions of attributes relating to the study
constructs (service quality, customer value, satisfaction and behavioral intentions) and across the
hotels‘ characteristics.
4.1 Data Screening and Test for Normality
4.1.1 Data Screening
As presented in the previous chapter, 440 questionnaires were distributed to the respondents, of
which 435 were returned (341 from Addis Ababa and 94 from the regions) as completely filled,
and entered into SPSS (Statistical Program for Social Scientists) software for analysis purpose.
However, before analysis, quality of the data entered in to SPSS was critically examined by
rechecking the dataset for minimum and maximum values associated with the study variables
Page 124
111
and accuracy of the data entry. During the data cleaning process, it was ensured that each
variable had coded values in line with the questionnaire scales. Hence, the final analysis was
carried out with 435 questionnaires.
4.1.2 Test of Normality
According to the central limit theorem, as long as the sample size is 30 or more; the sampling
distribution would tend to be normal irrespective of the population distribution (Field, 2009).
Fundamentally, the large enough sample size (435) used in this study satisfies the requirement of
normality, however, in order to examine the suitability of data for further analysis, two measures
of normality- Kurtosis and Skewness were computed.
According to Mardia (1970), when the maximum acceptable level of Skeweness (2) and Kurtosis
(6) are violated, it suggests a problem that should be addressed before performing any inferential
(statistical) analysis. The result revealed that all the computed values of Skewness and Kurtosis
were found within the acceptable limits thus, appeared to be normal (see Annex-E for the values
of Skewness and Kurtosis).
4.2 Respondents’ Profile
In order to understand the profile of the respondents, in terms of gender, age, nationality,
numbers of and purpose of visit to the hotel, and their length of stay in the hotel, data were
analyzed by using percentages, as follows.
Page 125
112
i. Gender: Great majority (72%) of the respondents were male and the remaining (28%),
female, as presented in the Figure 4.1. This implied that males are more exposed to
staying out as compared to their female counterparts.
Figure 4.1: Respondents’ gender
The gender composition was appeared to be similar to MoCT (2010), whereas it was
believed that gender of an individual customer/guest might have an influence on
his/her perceptual process, as examined later in this study.
ii. Age: The largest number of respondents (45%) were appeared to be in the middle age
group (31-45 years), followed by one-fourth (25%) belonging to young age (18-30
years) and little less than one-fourth (24%) under senior age (46-60 years), as
presented in Figure 4.2. In this way, about 94% of the respondents were found to be
between 18 and 60 years of age. This revealed that a large number of customers
Page 126
113
staying in the selected star category hotels belong to middle age, which may be
attributed to their professions and earnings to pay for the hotel stay.
Figure 4.2: Respondents’ age
Furthermore, Kotler and Armstrong (2006) stated that age can have an influence on the
perception process of individuals, as being assessed in the subsequent sections.
iii. Nationality: Majority (69%) of the respondents were appeared to be foreigners with the
remaining (31%) are domestic (Ethiopians) customers to the hotels (Figure 4.3). This
may be attributed to the fact that three and above star hotels mainly target foreigners
to be their customers/guests.
Moreover, the nationality of an individual would have an influence on his/her
perceptual process, value system and behavioral intentions, being guided by different
cultural beliefs (Oliver, 1997). This relationship has been examined later by the study.
Page 127
114
Figure 4.3 Respondents’ nationality
iv. Purpose of Visit: Over half (53%) of the respondents were found to be staying in hotels
caused by their business, followed by one -fourth (25%) who mentioned other
personal reasons for their hotel stay. Leisure travelers (14%) and transit passengers
(8%) constitute relatively less for being staying in hotels. This may, once again, be
attributed to the profession of the respondents causing them to stay in hotels during
their business/official assignments, meetings etc.
Figure 4.4: Respondents by purpose of visit
Page 128
115
The need or desire of a guest might be influenced by the purpose of his/her visit,
hence, presents a strategic lens to the hotel management to plan their services more in
line with the customers traveling for business purposes. The subsequent sections of
this chapter examine the role of guests‘ purpose of visit in determining their
perceptions of service quality and other study constructs.
v. Length of Stay: Majority (63%) of the respondents were found to be staying in
corresponding hotels for three or more nights, followed by little less than one forth
(23%), who claimed to be staying for two nights, and 14% who stayed night long. In
this way, all the participants were found to be experiencing various services, at least
for a night, before assessing them in the context of this study. However, their average
stay in hotels was appeared to be in line with the MoCT‘s (2010), which reported 2.7
nights (average stay of guests in Ethiopian hotels).
Figure 4.5: Respondents’ length of stay in the hotels
Page 129
116
Additionally, guests staying for more nights are supposed to have better service
experience to assess and comment on the perceived service quality, value, satisfaction
and behavioral intentions. The later part of this chapter attempted to examine the
influence of respondent‘s length of stay on the study constructs.
vi. Number of Visits: Over half (53%) of the respondents were found to be repeated
customers to the respective hotels, while the remaining (47%) claimed to be the first
time visitors/guests. This revealed some sort of loyalty that respondents witnessed for
corresponding hotels. Moreover, as many of the respondents stayed in the hotels
caused by their business assignments, this repetition may also be attributed to the
links that their organizations maintain with these hotels.
Figure 4.6: Respondents’ visit(s) frequency
However, as indicated by Oliver (1997), such revisits of customers can be an
indication of better service quality perceptions and satisfaction leading to favorable
behavioral intentions (for revisits in future too). The later part of this study attempted
Page 130
117
to evaluate whether guest‘s revisits to a particular hotel has any influence on the other
research constructs.
4.3 Exploratory Factor Analysis and Scale Reliability
Validity test determines the extent to which a data collection instrument measures what it intends
to measure without accidentally including other factors. There are basically two types of validity
tests useful for survey instruments: content validity and construct validity (Cronbach & Meehl,
1955; Gregory, 1992; Drost, 2011). Content validity for the study has been ensured through
literature review and experts comments. Construct validity, on the other hand, measures the
existence and extent of theoretical relationship of a variable to other variables. It is the extent to
which a measure behaves the way that the construct it purports to measure should behave (with
regard to the established measures of other constructs).
Exploratory Factor Analysis (EFA) has been applied to measure the construct validity of data
collection instrument, as directed by DeVellis (1991). Accordingly, Principal Component
Analysis (PCA) approach was used to obtain the factors capable of yielding the most
interpretable results, separately for the service quality (independent) and other constructs
(dependent) being used in the study. Moreover, the suitability of data for exploratory factor
analysis was tested by applying Barlett‘s test and Kaiser-Meyer-Olkin (KMO) measure of
sampling adequacy.
As a rule of thumb, it is considered that a KMO value greater than 0.60 shows acceptable
sampling adequacy, greater than 0.70 and 0.80 shows good and very good sampling adequacy
Page 131
118
respectively, whereas above 0.90 shows excellent sampling adequacy. Bartlett‘s test of
spherecity examines the existence of relationship between items and follows Chi-square
distribution. Larger value of Bartlett‘s test indicates greater likelihood the correlation matrix is
not an identity matrix and null hypothesis would be rejected (Sergeesh, Anusree & Mohapatra,
2014). Therefore, Barlett‘s test of sphericity was employed to test the inter-correlations, and
KMO measure of sampling adequacy was used to ensure that the variables were grouped
appropriately.
Table 4.1: KMO and Bartlett’s test of Spherecity
Construct KMO
Degree of
Freedom
Bartlett’s test of Spherecity
(Chi-square)
Service Quality 0.91 231 3525.40
Customer Value 0.78 6 614.29
Customer Satisfaction 0.67 3 239.29
Behavioral Intentions 0.60 1 224.26
(Source: Survey data, 2014)
Table 4.1 presented with the results of the KMO and Barlett‘s test of spherecity pertaining to the
study constructs. Accordingly, the KMO measure for sampling adequacy for service quality
items was calculated as 0.91. Since the KMO score was above 0.9, the variables were
interrelated and share common factors. Moreover, Barlett‘s test of spherecity (chi-square=
3525.40, p<0.001) indicated that correlations between items were large enough to accommodate
PCA. In a nutshell, the two tests results revealed that factor analysis was feasible and the data
were suitable for factor analysis.
Page 132
119
In addition, there appeared to be relatively higher (0.6 and above) KMO values along with
significant Barlett‘s test statistics, which asked to proceed with separate factor analysis for the
remaining constructs of perceived value, customer satisfaction and behavioral intentions (see
Table 4.1).
4.3.1 Principal Component Analysis- Service Quality Attributes
Principal Components Analysis (PCA) with varimax rotation and Kaiser normalization, was
carried out to factor analyzed 25 service quality attributes (see Annex-A), to identify the
underlying dimensions that describe the variance in the attributes. In this way, 22 items (out of
25) were found to be loaded in six dimensions (eigenvalues greater than or equal to 1), with
above 0.5 factor loadings, while represented 67% of the variance explained (see Table 4.2).
Therefore, all the 22 items loaded in to six factors were retained, and the remaining three items
pertaining to shuttle service, recreation facility, and convenient hotel location were excluded.
In addition to high loading values, the factors also proved to be highly internally consistent. The
reliability of the factors was tested by computing Cronbach (alpha) coefficients, whereby a value
of 0.70 was believed to be considering a construct/dimension as reliable (Nunnaily, 1978). The
overall scale reliability was appeared to be having a value 0.936 (see Table 4.2), while ranging
for individual dimensions of service quality from as high as 0.792 (for reliability) to as low as
0.713 (for responsiveness). Furthermore, communality value indicated that all the variables
account the variance ranging from as low as 27% to as high as 77.4% in their corresponding
factors.
Page 133
120
While the items pertaining to the service quality dimensions of assurance, responsiveness,
reliability and empathy were found to be loaded into their respective factors, the items for
tangibles dimension divided into two: food & beverage (F&B) tangibles and room tangibles. As
a result, the six factors identified were named as: Factor 1- Assurance, Factor 2- Responsiveness,
Factor 3- Reliability, Factor 4- Empathy, Factor 5- Food & Beverage tangibles, and Factor 6-
Room tangibles (see Table 4.2).
Table 4.2: Factor loadings and scale reliabilities for service quality
Fact
or
Items
Factor
loading
Communalities Reliability
(Cronbach
alpha)
Fac
tor
1:
Ass
ura
nce
1. Hotel staff welcome guests that creates a
comfortable feeling
0.769 0.592 0.775
2. Hotel staff are always courteous 0.820 0.672
3. Hotel staff have good command of
English
0.745 0.556
Fac
tor
2:
Res
ponsi
ven
ess
1. Hotel‘s restaurant delivers prompt service
to its customers
0.766 0.586 0.713
2. Hotel staff are willing to provide prompt
assistance to guests‘ requests and problems
0.796 0.633
3. Check-in and check-out services are
quick and easy at the hotel
0.689 0.475
Fac
tor
3:
Rel
iabil
ity
1. Hotel provides services as being
promised (during reservation)
0.771 0.594 0.792
2. Hotel staff perform services
right/correctly at the first time
0.739 0.546
3. Hotel guarantees/ensures reliable
reservation services
0.703 0.494
4. Hotel billing and payment systems are
free from error
0.668 0.447
Fac
tor
4:
Em
pat
hy
1. Hotel staff provide service to meet
guests‘ best interest
0.823 0.677 0.754
2. Hotel staff provide service in a caring
fashion being friendly
0.808 0.653
Page 134
121
3. Hotel staff provide undivided attention to
the guest
0.826 0.682 F
acto
r 5:
F &
B T
angib
les 1. Hotel‘s Bar and Restaurant(s) have good
ambience
0.728 0.530 0.735
2. Complimentary breakfast at the hotel is
of good quality
0.815 0.665
3. Hotel‘s restaurant(s) offer good quality
food
0.880 0.774
Fac
tor
6:
Room
Tan
gib
les
1. Hotel staff have neat appearance 0.629 0.279 0.768
2. Hotel‘s rooms are clean and comfortable 0.785 0.616
3. Hotel‘s rooms have visible (quality)
amenities like TV, phone etc.
0.705 0.498
4. Hotel rooms are quiet 0.636 0.404
5. Bathrooms in the hotel are neat and clean 0.816 0.665
6. Hotel rooms are equipped with effective
internet connectivity
0.601 0.361
Overall scale reliability 0.936
(Source: Survey data, 2014)
Factor 1 consisted of three items related to assurance: staff welcoming behavior to feel
comfortable, courtesy and command over English as a language. All the three items in the
assurance dimension were found to be loaded well above 0.7, much higher than the minimum
acceptable value of 0.5 (Malhotra, 2004), hence considered to be having acceptable construct
validity (see Table 4.2). However, the item related to staff courtesy was appeared to be having
the highest factor loading in this dimension of service quality. Also, the dimension was found to
be having Cronbach alpha value of 0.775 (Table 4.2), above the 0.70 standard (Nunnaily, 1978),
hence, considered to be reliable.
Factor 2 was appeared to be having three items pertaining to responsiveness to the service
delivery by the hotel. It included the items like hotel‘s restaurant delivers prompt services, staff
Page 135
122
are willing to provide prompt assistance and quick & easy check-in/check-out services. All the
items representing responsiveness dimension of service quality were found to be having factor
loadings well above 0.6, hence were considered to be the part of given construct. However, the
highest factor loading (0.796) was observed for the item related to staff willingness to provide
prompt assistance to the guests. Moreover, the dimension was reported with a Cronbach alpha
value of 0.713 (Table 4.2), above the 0.70 standard, thus, considered to be reliable.
Factor 3 consisted of four items related to service reliability: hotel provides services as promised,
staff performs services correctly at the first time, hotel ensures reliable reservation services, and
error free billing and payment system. All the four items representing reliability dimension of
service quality were found to be well above 0.6 on factor loadings, whereas the loading of the
item related to promise keeping (0.771) was found to be the highest. Additionally, the dimension
was found to be having Cronbach alpha value of 0.792 (Table 4.2), much above the 0.70 level,
hence, considered to be reliable.
Factor 4 was appeared to be having three items pertaining to empathy, as being witnessed
through the staff behavior. The items in this factor include: staff provide service to meet guests‘
best interest, in caring fashion and undivided attention to be paid to the guests by the staff. All
the items in empathy dimension were found to be loaded with 0.8 values, representing strong
construct validity, with the item related to paying undivided attention by the staff scored the
highest (0.826). Also, the dimension was reported with a Cronbach alpha value of 0.754 (Table
4.2), above the 0.70 standard, therefore, assumed to be reliable.
Page 136
123
Factor 5 maintained three items related to food and beverage tangibles. The dimension consisted
of items like bar and restaurant ambience, quality of complimentary breakfast and food quality in
the hotel restaurants. This appeared to be a new service quality dimension measuring quality
perceptions of customers on bar/restaurant services, in the context of hotel sector of Ethiopia.
All the items representing this dimension were found to be loaded with values ranging between
0.728 (for bar and restaurant ambience) to 0.880 (restaurants‘ food quality). The corresponding
values were appeared to be much higher to be acceptable the dimension as valid. Moreover, the
dimension was found to be having Cronbach alpha value of 0.735 (Table 4.2), above the 0.70
level, hence, considered to be reliable.
Finally, factor 6 consisted of six items determining room tangibles as: staff appears neat, clean
and comfortable rooms, rooms have visible amenities like TV, phone etc., quite rooms, clean
bathrooms and effective internet connectivity in the hotel rooms. Items loaded in this factor
ranged from as low as 0.601 (for internet connectivity) to as high as 0.816 (for bathroom
neatness), thus validated as a separate dimension contributing to determine service quality in the
hotel sector. Additionally, the dimension was reported to have Cronbach alpha value of 0.768
(Table 4.2), above the 0.70 standard (as per Nunnaily, 1978), hence, assumed to be reliable.
4.3.2 Principal Component Analysis- Customer Value, Satisfaction and Behavioral
Intentions
Another exploratory factor analysis was conducted with the mediating (customer value and
satisfaction) and dependent (behavioral intentions) variables, separately, to identify their
underlying factors/constructs (being uni-dimensional). In line to this, by using PCA with varimax
Page 137
124
rotation, nine items were analyzed (Table 4.3). Respondents were requested to indicate their
level of agreement/disagreement with the nine items on a 5 point Likert-type scale (labelled 1-
Strongly Disagree, 2-Disagree, 3-Neutral, 4-Agree, and 5-Strongly Agree).
Table 4.3: Factor loadings and scale reliabilities for customer value, satisfaction and
behavioral intentions
Co
nst
ruct
Fa
cto
r
Items
Factor
loading
Communalities Reliability
(Cronbach alpha)
Cust
om
er V
alue
1. Hotel maintains reasonable room
rates to offer high value for money
0.730 0.532 0.819
2. Pricing at the hotel‘s restaurant is
reasonable & dictates value for money
0.850 0.722
3. Pricing at the hotel‘s bar is
reasonable & dictates value for money
0.826 0.682
4. Overall, the price paid is reasonable
compared to the value of services
being received
0.814 0.663
Cust
om
er
Sat
isfa
ctio
n
1. I am quite satisfied with the
appearance of facilities in the hotel
rooms
0.623 0.623 0.708
2. I am quite satisfied with the service
received from the hotel‘s staff
0.601 0.601
3. I am satisfied with the hotel‘s
overall service provisions
0.671 0.671
Beh
avio
ral
Inte
nti
ons
1. I will use this hotel services again
whenever I get the chance
0.898 0.807 0.760
2. I will comment to others about the
hotel service
0.898 0.807
(Source: Survey data, 2014)
These nine items were taken from different sources (as indicated in Chapter 3) to measure
customer value, satisfaction and behavioral intentions. All the items loaded, separately, into their
respective constructs/factors (three in numbers) by having a loading over 0.6 (Table 4.3).
Furthermore, the reliability of the three constructs (i.e., customer value, satisfaction and
behavioral intentions) were tested and found to be well above the acceptable range of 0.70
Page 138
125
(Nunnaily, 1978), from as high as 0.819 for customer value, to as low as 0.708 for customer
satisfaction.
In this way, the first factor/dimension appeared to be as ‗customer value‘ with four items:
reasonable room rates, reasonable price at restaurant(s), reasonable price at hotel bars, and
reasonable price dictating value for money. All the four items corresponding to customer value
were found to be loaded well above 0.70, much higher than the minimum acceptable value of 0.5
(Malhotra, 2004), hence considered to be having acceptable construct validity. However, the
item related to reasonable price of the restaurant(s) was appeared to be having the highest factor
loading (0.850) pertaining to the perceived-customer value. Also, the construct was found to be
having Cronbach alpha value of 0.819 (Table 4.3), much above the 0.70 standard (as mentioned
by Nunnaily, 1978), hence, considered to be reliable.
The other factor/construct was found with three items pertaining to ‗customer satisfaction‘. It
included the items like satisfaction with hotel facilities; service received, and overall service
provisions. All the items representing customer satisfaction were found to be having factor
loadings well above 0.6. This indicated that the items have desired construct validity to use as a
measure of customer satisfaction. However, the highest factor loading (0.671) was observed for
the item related to satisfaction with overall service provisions. Moreover, the factor was reported
with a Cronbach alpha value of 0.708 (Table 4.3), above the 0.70 standard, thus, considered to be
reliable.
Page 139
126
Finally, the last factor/construct was appeared to be having two items related to ‗behavioral
intentions‘. These include: using the hotel services again when get the chance, and commenting
to others about hotel service. Both of the items representing behavioral intentions (in terms of
revisit and WOM) were found to be with equal factor loadings (0.898), which represented the
existence of strong construct validity. Additionally, the factor was found to be having Cronbach
alpha value of 0.760 (Table 4.3), surpassing the 0.70 level, hence, assumed to be reliable to use
in the study.
4.4 Descriptive Analysis
As highlighted in the previous chapters, the perceived service quality of the hotels was
conceptualized as a formative construct rather than reflective construct, commonly found in the
early literature of service quality. Therefore, the meaning of the latent construct would be
resulting from associated components/dimensions, being each item/indicator uniquely
contributed to the conceptual domain of the latent construct (Zabkar et al., 2010). The factor
analysis revealed the uni-dimensionality of the study constructs related to service quality,
customer value, satisfaction and behavioral intentions. This part presents the descriptive analysis
of these constructs by using the measures of central tendency (mean) and dispersion (standard
deviation). With respect to the agreement/disagreement scale (5-point Likert-type) used for
measuring these constructs/ dimensions, a mean score over 3 interpreted towards ‗agreement‘,
while below 3 was considered to be ‗disagreement‘ with the concerned item as a response.
However, a perfect score of 3 was assumed to be a ‗neutral‘ response on the corresponding item.
Page 140
127
4.4.1 Mean Ratings of Service Quality Items and Dimensions
The analysis of mean values and standard deviations of the service quality scale items, presented
in Table 4.4, revealed that all the items scored above average (3 on a five-point scale), which
determined the general agreement on the quality service being delivered by the hotels. However,
the highest mean score of 4.48 (SD=0.623) was obtained for the item ‗hotel staff welcome guests
that creates a comfortable feeling‘, followed by ‗hotel staff are always courteous‘ with 4.27 mean
value (SD=0.718). Both of these items were from the ‗assurance‘ dimension of service quality
construct, and presenting relatively less variation in their assessments (as seen from small SD
values) by the respondents. Therefore, it can be understood that most of the respondents take the
hotels performing well with regard to the ‗assurance‘ dimension.
Similar to these, the two other most rated items related to the hotel staff: ‗hotel staffs are willing
to provide prompt assistance to guests‘ requests and problems‘ (Mean=4.24, SD=0.798) from the
dimension of ‗responsiveness‘, and ‗hotel staff provide service in a caring fashion being friendly‘
(Mean=4.24, SD=0.788, respectively), from ‗empathy‘. This signified that the hotels ensured
service quality while feeling responsive and empathetic to their customers, as perceived by them
(with little variations in their evaluations).
On the other hand, relatively lower mean score (3.52, SD=1.207), though above average (3.0),
was observed for the item ‗hotel rooms are equipped with effective internet connectivity‘, under
the dimension of ‗room tangibles‘, with greater variance being noted among the respondents.
This revealed the concerns about service quality, as perceived by the respondents, pertaining to
Page 141
128
internet connectivity in hotel rooms. However, variations in the responses can be attributed to
hotels‘ star ratings and locations (service may be poor in some locations).
Table 4.4: Descriptive statistics for service quality items
SN Item
Dimension Mean
Std.
Dev.
1 The hotel staff welcome guests that creates a comfortable feeling Assurance 4.48 0.623
2 The hotel staff are always courteous Assurance 4.27 0.718
3 The hotel staff have good command of English Assurance 3.88 0.883
4
The check-in and check-out services are quick and easy at the
hotel
Responsiveness 4.25 0.727
5
The hotel provides services as being promised (during
reservation)
Reliability 4.16 0.822
6 The hotel staff perform services right/correctly at the first time Reliability 4.14 0.789
7
The hotel staff are willing to provide prompt assistance to guests‘
requests and problems
Responsiveness 4.24 0.796
8
The hotel staff provide service to meet guests‘ best interest (as
per the requirements)
Empathy 4.13 0.806
9 The hotel staff provide service in a caring fashion being friendly Empathy 4.24 0.788
10 The hotel staff provide undivided attention to the guest Empathy 4.04 0.869
11 The hotel staff have neat appearance Room Tangibles 4.19 0.780
12 The hotel‘s rooms are clean and comfortable Room Tangibles 4.17 0.841
13
The hotel‘s rooms have visible (quality) amenities like TV,
phone, safe, refrigerator etc.
Room Tangibles 4.00 0.964
14 The hotel rooms are quiet Room Tangibles 4.05 0.966
15 The bathrooms in the hotel are neat and clean Room Tangibles 4.16 0.918
16 The hotel rooms are equipped with effective internet connectivity Room Tangibles 3.52 1.207
17 The hotel‘s bar(s) and restaurant(s) have good ambience F&B Tangibles 4.06 0.785
18 The complimentary breakfast at the hotel is of good quality F&B Tangibles 3.91 0.952
19 The hotel‘s restaurant(s) offer good quality food F&B Tangibles 4.03 0.857
20 The hotel restaurant delivers prompt service to its customers Responsiveness 4.02 0.765
21 The hotel guarantees/ensures reliable reservation services Reliability 4.03 0.829
22 The hotel billing and payment systems are free from error Reliability 4.07 0.876
(Source: Survey data, 2014)
The second lowest mean score of 3.88 (SD=0.883), still above average and approaching to the
level of agreement (4.0), was observed for the item ‗hotel staff have good command of English‘,
Page 142
129
from the service quality dimension of ‗assurance‘. Therefore, hotels staffs were observed to be
having problems, in general, with communication in English, as perceived by the guest
respondents. However, some degree of variation among the respondents can be witnessed, as
perhaps, domestic customers were assumed to be well versed with local language(s), and may
not be requiring the staff to communicate in English with them.
Similarly, the item ‗complimentary breakfast at the hotel is of good quality‘ with a mean score of
3.91 (SD=0.952) was found to be approaching towards agreement, though with certain degree of
variance. This indicated that the respondents were provided with relatively good quality
complimentary breakfast by their hotels. The appeared variance may be attributed to the hotels‘
star ratings, and associated expectations of the study participants from them. This was examined
in the later part of this chapter, across various service quality dimensions.
Table 4.5 presented with the descriptive statistics for all the service quality dimensions,
computed based on the respective items belonging to them. Additionally, overall service quality
(Mean=4.149, SD=0.541), as perceived by the respondents, was computed from a separate item
examining their perceptions on the overall acceptability of the hotel(s) services.
Accordingly, the ‗assurance‘ dimension of service quality was reported to be with the highest
mean score of 4.208 (SD=0.578), followed by ‗responsiveness‘ (Mean=4.169, SD=0.574),
‗empathy‘ (Mean=4.137, SD=0.673), ‗reliability‘ (Mean=4.101, SD=0.597), and ‗room
tangibles‘ (Mean=4.015, SD=0.644). However, the dimension of ‗F&B tangibles‘ (Mean=4.001,
Page 143
130
SD=0.701) was observed to be having the lowest mean value, though responding to a general
agreement on the quality issues, addressed by the hotels, pertaining to food and beverages.
Table 4.5: Descriptive statistics for service quality dimensions
(Source: Survey data, 2014)
With respect to the specific dimensions, ‗assurance‘ consisted of items pertaining to the
provision of warm welcome and courtesy to guests, and good command of English language
with the staff, respondents were found to be assured on the part of staff competency, as being
provided with courteous and welcoming service(s). Additionally, the dimension of
‗responsiveness‘ by consisting the items related to service promptness and assistance, reflected
that the respondents perceived the hotels with an ability to assist them in a timely manner when
requested to do so.
In a similar manner, ‗empathy‘, as a dimension of service quality, was perceived by the
responding customers in existence with respective hotels while providing attention and remain
friendly to their guests, in order to meet their best interest. In this way, the respondents perceived
that they were served by the hotels towards meeting their best interest, by paying enough
attention and friendliness, in service deliveries. Moreover, the dimension of ‗reliability‘ which
consisted of the items related to providing the right service, error free billing and keeping the
Assurance Reliability Responsiveness Empathy
Room
Tangibles
F&B
Tangibles
Overall Service
Quality
Mean 4.208 4.101 4.169 4.137 4.015 4.001 4.149
S.D 0.578 0.597 0.574 0.673 0.644 0.701 0.541
Page 144
131
service promises, was perceived to be existing in the corresponding hotel context. As a result, the
respondents were found to be claiming that the hotels remained reliable while proving the error
free services, at the first time, and keeping promises with their customers.
While the respondents appreciated the room amenities like TV, phone etc., quietness, comfort
and cleanliness, along with that of bathroom facilities, minor gaps have been witnessed with
respect to effective internet connectivity in the hotel rooms. This was assumed to be varying
from one class of hotel (based on star ratings) to another. Although, the relatively lower mean
scores, though above average and towards agreement (Mean=4.001, SD=0.701) were observed
for the dimension of F&B tangibles, the respondents in general perceived that the bars and
restaurants of corresponding hotels have good ambience, providing good quality foods, including
complimentary breakfast. However, as mentioned before, there remained certain degree of
variance in the response, which may be attributed to the hotel ratings while considering that
higher the hotel class (star rating), better the quality be.
Finally, the overall perceived-service quality was found to be acceptable (above average), being
the respondents agreed on the performance of various service quality provisions in the
corresponding hotels in Ethiopia. As the sector appeared to be highly demanded, such findings
worked as a motivation for the Ethiopian hotels to achieve competitive position in the
international market, by improving their service deliveries. In other words, as the basics
(dimensions) of service quality were found to be existing in the hotel sector, a further push-up
and commitment towards quality improvement (across the dimensions) can determine the
excellence/performance of the Ethiopian star category hotels.
Page 145
132
4.4.2 Word-of-Mouth (WOM) Recommendations Target Audiences
Respondents were asked to identify to whom they most likely recommend the hotel (being the
target groups/audiences). For the purpose, WOM recommendations were categorized into four
categories: Acquaintances-WOM (A-WOM), Booking Contacts-WOM (BC-WOM), Direct-
WOM (D-WOM) and Electronic-WOM (E-WOM), based on the findings of exploratory study
(as presented in the previous chapter). The main purpose of this categorization was to clearly
identify the target audiences of respondents‘ WOM recommendations, to examine the associated
implications for the hotel‘s marketing activities.
Accordingly, as presented in the Figure 4.7, A-WOM was found to be having the largest target
audience (39%), in total, for the hotel recommendations to be forwarded to. Among the
respondents who agreed (and strongly agreed) to recommend, claimed that they will maintain it
with A-WOM (35%) category, which includes friends, family and colleagues.
In general, the findings revealed that large number of the respondents spread WOM about the
hotel services to their acquaintances, followed by Direct-WOM (27%), BC-WOM (21%) and E-
WOM (13%) in total. This further advised that WOM to the acquaintances has more favorable
perspective and implications to the hotel management, as being assumed that their customers
were positively/favorably recommended by the close friends, family and colleagues, who had
personally experienced the hotel services before.
Page 146
133
Figure 4.7: Target audiences of respondents’ WOM recommendations
Therefore, A-WOM was found to be more trustworthy than other forms of WOM, at least in the
context of Ethiopian star category hotels. Additionally, the other proven sources of WOM
recommendations were appeared to be D-WOM (including the hotel staff or management) and
BC-WOM (including travel agents, airliners, booking sites, and own company bookers). Most
managers prefer D-WOM, because it gives them the chance to improve (particularly when there
are service gaps) service provisions, by devising different mechanisms (like comment cards,
suggestion box, comments/complaints open-lines etc.) to encourage customers to bring their
comments directly to them, before they spread at large.
On the other hand, a good number of respondents were found to be recommending the hotels
through BC-WOM (18%), who agreed (or strongly agreed) to do so. Though, this particular
Total
Page 147
134
group was appeared to be small in size, it would have huge impact in affecting the flow of the
guests towards the hotels. As a result, a close attention to BC-WOM, through creating strong
relationship with booking contacts and others, by the managers would be considered to bring
benefits to their businesses.
The least preferred target audience to forward recommendations was appeared to be under ‗E-
WOM‘ category, whereby 11% of the respondents were found to be agreed (or strongly agreed)
on using emails, websites and other social media to make communications about concerned
hotels. Therefore, when the customers/guests were remained satisfied, more positively they write
about the hotel services via electronic medium (e.g., e-mails, social media, website etc.). Even
though the number of respondents following this approach was appeared to be low, the approach
by itself has considerable potential over the remaining three (A-WOM, BC-WOM and D-WOM).
The major advantage of this approach can be witnessed through its widespread, covering almost
all classes of existing customers and potential (future) buyers of the hotel services. More
specifically, this approach has the capability to target public at large using electronic form of
communication.
4.5 Analysis of Associations
This section presented with correlation and regression to understand the relationship between the
identified constructs of service quality, customer value, satisfaction and behavioral intentions.
Page 148
135
4.5.1 Correlation Analysis
Correlation is a bi-variate measure of association (strength) and determines the relationship
between two variables. For the purpose, Karl-Pearson‘s correlation coefficient (r) was adopted,
guided by the nature of data (scale). The value for the same varies between 0 (no relationship)
and 1 (perfect linear relationship) or -1 (perfect negative linear relationship). The significance
level (p-value) is the probability of obtaining results as extreme as the one observed. If the
significance level is small (e.g., p<0.05) then the correlation is assumed to be significant and
linearly related. Opposite will be true, if the significance level is relatively large (e.g., p>0.05).
The general guidelines for interpreting the correlation values advocate that the relationship
would be very weak/negligible when ‗r‘ ranges 0-0.2, weak/low for 0.2-0.4, moderate for 0.4-
0.7, strong/high for 0.7-0.9, and very strong for 0.9-1.0 (Malhotra, 2004). Additionally, before
attempting to regression analysis, computation of correlation coefficients between independent
and dependant variables is well suggested considering the problem of multicollinearity, which
exists when ‗r‘ is greater than 0.9 or several associations (values) are greater than 0.7 in the
correlation matrix (Hair et al., 2010).
Accordingly, an attempt was made to first assess the relationship between service quality
dimensions and perceived service quality by computing Karl-Pearson correlation coefficients.
All the service quality dimensions were found to be significantly associated with each other and
that of perceived-service quality, with varying degrees (see Table 4.6).
Page 149
136
Table 4.6: Correlation between perceived service quality and its dimensions
Construct/
Dimensions
Overall
Service
Quality
Assurance Reliability Responsiveness Empathy Room
Tangibles
Assurance 0.731**
Reliability 0.796** 0.502**
Responsiveness 0.834** 0.575**
0.629**
Empathy 0.826** 0.630**
0.611**
0.683**
Room Tangible 0.726** 0.420**
0.491**
0.469**
0.458**
F&B Tangible 0.733** 0.326**
0.493**
0.554**
0.453**
0.514**
Note: **Significance at 0.001 level. (Source: Survey data, 2014)
The highest degree of association (r=0.834, p<0.001) was observed between overall service
quality and the responsiveness dimension (Table 4.6). This has indicated that the service quality
perceptions were strongly associated with quick check-in/out, prompt assistance and service
delivery to the hotel customers/guests. Additionally, the perceived service quality was found to
be maintaining significantly strong relationship with the dimension of empathy (r=0.826,
p<0.001), followed by reliability (r= 0.796, p<0.001), F&B tangibles (r=0.733, p<0.001),
assurance (r=0.731, p<0.001) and room tangibles (r=0.726, p<0.001).
The correlation analysis further revealed the existence of positive and significant associations
among the six dimensions of perceived service quality (assurance, reliability, responsiveness,
empathy, room tangibles and F&B tangibles). Relatively moderate correlation (r=0.683,
p<0.001) was found between the dimensions of empathy and responsiveness (Table 4.6),
empathy and assurance (r=0.630, p<0.001), and reliability and responsiveness (r=0.629,
Page 150
137
p<0.001). The association between the dimensions of assurance and empathy revealed that
courteous and welcoming behavior of the staff dictated care and undivided attention to the
guests, while delivering service to meet their best interests.
Moreover, the dimension of empathy, in general, was found to be having relatively strong
association with other dimensions of service quality, as perceived by the respondents/ guests.
These relationships were, both theoretically and logically, acceptable as empathy, in terms of
being friendly and providing full attention to meet the guests‘ best interest, can contribute
towards better service perceptions.
Additionally, relatively moderate associations, though remained significant, were found between
the dimension of empathy and room tangibles (r=0.458, p<0.001), and F&B tangibles (r=0.453,
p<00.001). This revealed that the friendly attention given by the service provider to the guests
would not strongly influence their perceptions towards the room amenities, cleanliness and
comfort, staff appearance, and internet connectivity, along with food and beverage quality (or
vice- versa). Similarly, the dimensions of room tangibles and F&B tangibles were found to be
moderately and significantly (r=0.514, p<0.001) correlated with each other (Table 4.6).
However, relatively weak association was observed between the dimensions of F&B tangibles
and assurance (r=0.326, p<0.001). This signified the existence of relatively weak, though
significant, relationship between food and beverage quality and courteous and friendly service.
Therefore, a courteous service can assumed to be too weak to substitute the quality of food to
keep the customer happy, and closely negate a popular proverb, ―bright face is better than
Page 151
138
delicious food,‖ related to Ethiopian hospitality. As a result, the lesson learnt may be to consider
both assurance and F&B tangibles irreplaceable, in order to reveal higher/better service quality
perceptions of the hotel guests. Additionally, no matter how much courteous, friendly and
welcoming service the guests received the whole day, they still needed neat, quiet and
comfortable rooms for experiencing quality in their stay. One could not substitute the other, since
courtesy would not give sleeping quality (perhaps, better determined by room comforts,
cleanliness and silence).
By looking into the Table 4.6, it was revealed that all the dimensions of service quality correlate
strongly and significantly (p<0.001) with the respondents‘ overall service quality perceptions
/performance .Therefore, an additional attempt was made to correlate the perceived service
quality with the remaining constructs of customer value, satisfaction and behavioral intentions.
Table 4.7 revealed the association between these constructs, whereby all the constructs were
found to be having significant (p<0.001) association with each other.
Table 4.7: Correlation between service quality, customer value, satisfaction and behavioral
intentions
Over Service
Quality
Customer
Value
Satisfaction
Customer Value 0.616**
Satisfaction 0.759** 0.729**
Behavioral Intentions 0.636** 0.504** 0.658**
Note: **Significant at 0.001 level. (Source: Survey data, 2014)
Page 152
139
The strongest significant association (r=0.759, p<0.001) was observed to be between overall
service quality and satisfaction (Table 4.7). Moreover, in line with the fourth hypothesis, strong
positive correlation was observed between customer value and satisfaction (r=0729, p<0.001).
Therefore, positive perceptions to value guide higher customer satisfaction and vice-versa.
Guided by this, the fourth Hypothesis (H4) was found to be accepted. as:
H4: Customer satisfaction associates, positively and significantly, with customer value
in the context of star category hotels of Ethiopia
This finding was supported by the works of other scholars like Salazar, Costa and Rita (2010)
and Tsaur, Lin and Wu (2008). By considering that both the constructs appeared to be mediating
the relationship between perceived service quality and behavioral intentions, their usage together
in regression analysis may lead to the problem of multicollinearity (as discussed earlier).
Additionally, strong correlation between perceived service quality and satisfaction revealed that
while both contributes to each other, in the same direction, using any one will be suffice in the
regression to avoid the problem of multicollinearity, when determining the influence of service
quality on behavioral intentions.
Furthermore, relatively moderate, though significant, correlations were obtained between the
constructs of satisfaction and behavioral intentions (r=0.658, p<0.001), perceived service quality
and behavioral intentions (r=0.636, p<0.001), perceived quality of services and customer value
(r=0.616, p<0.001), and customer value and behavioral intentions (r=0.504, p<0.001).
Page 153
140
This, in general, revealed that perceived service quality associate with customer value,
satisfaction and behavioral intentions with varying degrees (strongest with satisfaction to
moderate with others). However, the uni-dimensional construct of behavioral intentions was
found to be highly associated with satisfaction (r=0.658, p<0.001) than that of service quality
and customer value, as perceived by the respondents (see Table 4.7). This, perhaps, revealed that
respondents‘ intentions to revisit and recommending the hotel(s) to others were more strongly
related to their own satisfaction and service quality than perceived value.
Researchers like Cronin, Bradly and Hult (2000) and Raza et al. (2012), also indicated that
customer value has positive and significant correlation with the behavioral intentions of
customers to revisit and recommend. However, the strengths of their association differ in
different research contexts. In order to further reveal this relationship, regression analysis was
carried out as presented in the following section.
Guided by the individual service quality dimensions and their relationship with perceived
performance of hotel service (quality), it can safely be assumed that bringing more aspects of
reliability, empathy and responsiveness to the service delivery would improve the intentions to
revisit and inspire positive WOM, than others (like assurance, room tangibles and F&B
tangibles). The major reason for this could be that customers perceive, in advance, and assure on
the room and F&B tangibles quality guided by the hotel (star) category, and would like to enjoy
the same at the time of service delivery. These factors may further determine, more strongly and
significantly, the associated satisfaction of the customers.
Page 154
141
However, food and beverage quality, being experience by the customers, may be having strong
contribution in determining their value perceptions, along with the dimensions of reliability and
responsiveness. In other words, better than empathy or assurance (being abstract), benefits
received or cost incurred against monetary payments can be well witnessed while evaluating
tangibles (in F&B and room), as also indicated by Jani and Han (2011).
4.5.2 Regression Analysis
In order to examine the influence of perceived service quality on perceived value, customer
satisfaction and behavioral intentions, regression analysis was performed. Additionally, multiple
regression models, both standard and hierarchical, were computed to analyze the direct and
indirect relationships between the study constructs. While standard multiple regression analysis
was carried out to examine the direct effect of independent (predictor) variables on a dependent
variable, hierarchical regression was employed to assess the relationship between independent
variables and a dependent variable, caused by a mediating variable. Additionally, Sobel statistics
was computed to assess the direct and indirect (mediating) effect of the independent variable on
the dependent.
However, before performing the regression analysis, as suggested by Sergeesh, Anusree and
Mohapatra (2014), assumptions and conditions of normal distribution, linear relationship
between the independent and dependent variables, error-free measurement, independence of
error, and multicollinearity were examined. As the earlier part of this chapter has already
discussed about the testing of normality of data, it was avoided to be repeated here.
Page 155
142
Linearity denotes that the mean values of the dependent variable for each increment of
independent variable(s) lie along a straight line (Field, 2009), and assumed to be a condition for
standard regression to correctly estimate the relationship between a dependent variable and
predictor(s). For the purpose, use of theory method (Osborne & Waters, 2002) was adopted, in
the light of sufficient empirical evidences (in the literature) that link between service quality,
customer value, satisfaction and behavioral intentions (Bolton & Drew, 1991; Cronin, Bradly &
Hult, 2000).
For the assumption of error-free measurement of regression, it was considered to be of no
concern in the context of this study, as the reliability coefficients (Cronbach alphas) were above
the threshold limit of 0.7 (Nunnaily, 1978). The assumption of independence of error of
prediction was tested by computing Durbin-Watson statistics, whereby the test score can range
between 0 and 4. According to Field (2009), the Durbin-Watson test value between 1 and 3
indicates independence of error. All the test statistics were found to be between 1 and 3, as
presented in the corresponding regression tables.
Additionally, multicollinearity is known as a condition of high intercorrelation among the
independent variables with no complete linear dependency. The correlation matrix was assumed
to be useful in detecting the existence of high correlation coefficient (0.7 or above) between
independent variables, which can cause the problem of multicollinearity, along with the statistics
of tolerance and variance inflation factor (VIF). In general, the tolerance value below 0.1 and
VIF statistics above 10 indicate multicollinearity amongst the independent variables (Hair et al.,
2009). As the computed values were above 0.1 for tolerance statistics, and VIF ranging within 1-
Page 156
143
10 (as indicated along the regression summary in the following section), multiple regressions
were assumed to be free from the problem of multicollinearity.
4.5.2.1 Predicting Quality through Perceived Performance of Service Quality Dimensions
As stated earlier, overall service quality was measured on a five-point Likert scale (ranging from
1 being strongly disagree to 5 being strongly agree), with a single item asking the respondents to
rate their level of perceptions of overall quality of the services provided by the concern hotel, by
revealing their level of agreement with the statement. About all (92%) of the respondents were
found to be agreed (69%) and strongly agreed (23%) that the hotels provided acceptable overall
service quality. Additionally, in order to investigate the influence of respective service quality
dimensions on overall service quality, multiple regression analysis was performed by using six
extracted service quality dimensions as independent and overall service quality as dependent
variables.
Table 4.8 presented the summary of the regression analysis, which indicated that all the service
quality dimensions were having a positive and significant (p<0.001) impact on overall service
quality. Following Hair et al. (2010), statistics of R² was used as a standard for judging
prediction models along with regression coefficients (β), as indicators of the relative importance
of variables.
Two measures, adjusted R² and standardized regression coefficients, were used to determine
regression model fitness and relative importance of the service quality dimensions in predicting
Page 157
144
overall service quality. An adjusted R² of 0.698 indicated that almost 70% of the overall quality
was explained by the six service quality dimensions/factors.
Table 4.8: Regression of overall service quality
R R2 Adjusted R
2 Df F Sig. Durbin-Watson
0.838 0.702 0.698 6 167.994 0.000 1.938
Regression Coefficients
Model Unstandardized
Coefficients
Standardized
Coefficients
t Sig. Collinearity statistics
B SE Β Tolerance VIF
Constant 0.372 0.126 - 2.956 0.003 - -
Assurance 0.127 0.034 0.135 3.778 0.000 0.542 1.846
Reliability 0.148 0.034 0.163 4.387 0.000 0.504 1.986
Responsiveness 0.165 0.039 0.175 4.239 0.000 0.407 2.455
Empathy 0.156 0.033 0.194 4.734 0.000 0.416 2.405
Room
Tangibles
0.185 0.028 0.220 6.596 0.000 0.627 1.594
F&B Tangibles 0.141 0.022 0.211 6.505 0.000 0.660 1.515
Dependent Variable: Overall Service Quality
(Source: Survey data, 2014)
The regression equation appeared to be:
Overall Service Quality = 0.372 + 0.135 (Assurance) + 0.163 (Reliability) + 0.175
(Responsiveness) + 0.194 (Empathy) + 0.220 (Room Tangibles) + 0.211 (F&B Tangibles)
These findings were found to be consistent with the literature that associated service quality
dimensions with overall customers‘ perceptions of service quality (Cronin, Bradly & Hult, 2000;
Zabkar et al., 2010), and supported the first Hypothesis (H1) as:
Page 158
145
H1: Quality is determined by the perceived performance of the service quality
attributes/dimensions in the hotel sector of Ethiopia
Further examination of the β coefficients revealed that the dimension of room tangibles (β =
0.220, p<0.001) and food tangibles (β = 0.211, p<0.001) exert more influence on perceived
overall service quality than the dimensions of empathy (β = 0.194, p<0.001), responsiveness (β =
0.175, p<0.001), reliability (β = 0.163, p<0.001), and assurance (β = 0.135, p<0.001).
4.5.2.2 Effect of Perceived Service Quality on Customer Satisfaction
In order to investigate the influence of the perceived service quality on customer/guest
satisfaction, overall satisfaction was regressed against overall service quality (see Table 4.9). The
result of the analysis supported the view that perceived quality influence positively and
significantly (β = 0.640, p<0.001) the customer satisfaction with the hotel service provisions.
Adjusted R2 value of 0.408 indicated that around 41% of the variation in customer satisfaction
can be explained by service quality.
Table 4.9: Regression of service quality on customer satisfaction
R R2 Adjusted R
2 Df F Sig. Durbin-Watson
0.640 0.409 0.408 1 299.824 0.000 1.863
Regression Coefficients
Model Unstandardized
Coefficients
Standardized
Coefficients
T Sig.
B SE β Tolerance VIF
Constant 1.220 0.168 - 7.258 0.000 - -
Overall Service
Quality
0.695 0.040 0.640 17.315 0.000 1.000 1.000
Dependent Variable: Customer Satisfaction
(Source: Survey data, 2014)
Page 159
146
Accordingly, the relationship between service quality (explanatory variable) and customer
satisfaction (dependent variable) can be represented as:
Customer Satisfaction= 1.220 + 0.640 (Overall Service Quality)
This implied that every unit increase in the overall service quality will increase the associated
customer satisfaction by 0.64 times and accepted the second Hypothesis (H2) as:
H2: Perceived service quality positively and significantly influences the customer
satisfaction in the Ethiopian hotel sector
Therefore, the influence of service quality on customer satisfaction was considered to be strong
(Malhotra, 2004), at least in the context of Ethiopian hotel sector, and in line with the findings of
other previous studies (e.g., Marco, 2001; Francosis, Jeremilo & Mulki, 2007; Raidh, 2009b;
Zabkar et al., 2010; Simon, 2012) suggested that service quality positively influence customer
satisfaction. Moreover, the findings support the quality-satisfaction order which, according to
Brady et al. (2005), should be obtainable irrespective of research context/setting.
4.5.2.3 Influence of Perceived Service Quality on Customer Value
The influence of service quality (explanatory variable) on perceived-customer value (dependent
variable) has been measured by applying simple regression analysis (Table 4.10). The findings
revealed that overall service quality has a positive and significant influence on customer value (β
= 0.544, p<0.001). The index of perceived-customer value was computed as the mean score of
the value items/variables used in the study. Almost 30% of the customer value, as perceived by
the hotel customers/guests, was found to be explained by the overall service quality.
Page 160
147
Table 4.10: Regression of service quality on customer value
R R2 Adjusted R
2 Df F Sig. Durbin-Watson
0.544 0.296 0.295 1 182.327 0.000 1.908
Regression Coefficients
Model Unstandardized
Coefficients
Standardized
Coefficients
T Sig.
B SE β Tolerance VIF
Constant 0.947 0.221 - 4.283 0.000 - -
Overall Service
Quality
0.713 0.053 0.544 13.503 0.000 1.000 1.000
Dependent Variable: Customer Value
(Source: Survey data, 2014)
Accordingly, the relationship between overall service quality and customer value can be
represented as:
Customer Value= 0.947 + 0.544 (Overall Service Quality)
This indicated that one unit increase in overall service quality will improve customer value by
0.544 times. Thus, third Hypothesis (H3) was supported as:
H3: Perceived service quality positively and significantly influences customer value in
the Ethiopian hotel sector
The result was found consistent with previous research works of Cronin, Bradly and Hult (2000),
Chen (2008), and Lertwannawit and Gulid (2011), which suggested that service quality influence
customer value, positively. This further suggests that in order to enhance customer value, hotel
Page 161
148
managers need to investigate and device the mechanisms of improving overall perception of their
service quality.
4.5.2.4 Influence of Perceived Service Quality on Behavioral Intentions through Mediating
Effect of Customer Satisfaction
Hypothesis 5 stated that customer satisfaction mediates the influence of perceived service quality
on behavioral intentions of the hotel customers in Ethiopia. In order to test this hypothesis,
following procedure was adopted.
i. Test the effect (significance) of independent variable on mediator variable;
ii. Test the effect of independent variable on dependent variable; and
iii. Test the mediator variable effect on the dependent variable in the presence of
independent variable, in the same model.
If these conditions manifest in the hypothesized direction, then the influence of the independent
variable on the dependent should be less in the third (combined) regression equation than that in
the second. The perfect mediation exists if the independent variable has no significant influence
on the dependent variable, when the mediator variable is controlled. However, partial mediation
exists when both the independent and mediating variables significantly influence the dependent
in the same (third) regression equation (Baron & Kenny, 1986).
In this way, the direct and indirect (mediated by customer satisfaction) effects of service quality
on behavioral intentions of the study respondents were computed (see Figure 4.8). The
regression analysis revealed significant (t=17.315, p<0.001) influence of perceived service
Page 162
149
quality on customer satisfaction. Similarly, the effect of service quality on behavioral intentions
was observed to be significant (t=12.199, p<0.001). Additionally, satisfaction was found to be
significantly influencing behavioral intentions (t=12.147, p<0.001) as did service quality
(t=3.079, p<0.003) in the same multiple regression (equation).
Furthermore, the indirect influence of customer satisfaction on service quality-behavioral
intentions relationship was also tested by using Sobel‘s (1982) statistics (explicitly testing the
significance of the mediation effect). Accordingly, the computed test value appeared to be 9.972
(p<0.001), which showed that customer satisfaction mediated the influence of service quality on
behavioral intentions.
iii.
i. (β=0.188, SE=0.06, t=3.079**)
(β=0.695, SE=0.04, t=17.315**) (β=0.566, SE=0.05, t=12.147**)
ii.
(β=0.663, SE=0.05, t=12.199**)
Figure 4.8: Customer satisfaction mediation model (**Significant at 0.01 level)
Therefore, by considering that service quality contributed less (though significantly) to the
construct of behavioral intention when combined with customer satisfaction, partial mediation by
the later (customer satisfaction) has been signified (Baron & Kenny, 1986). As a result, fifth
Hypothesis (H5) was supported as:
H5: Customer satisfaction mediates the influence of perceived service quality on
behavioral intentions of the hotel customers in Ethiopia
Percieved Service Quality
(Independent Variable)
Customer Satisfaction
(Mediating Variable)
Behavioral Intentions
(Dependent Variable)
Page 163
150
This finding was observed to be consistent with other studies (Jay & Dwi, 2000; Zabkar et al.,
2010; Ravichandran, Bhargavi & Kumar, 2010; Naik, Gantasala & Prabhakar, 2010; Jani & Han,
2011; Basheer, 2012). However, researchers like Oh (1999), Konstantinos, Nikos and Dimitri
(2002), Salazar, Costa and Rita (2009), and Kuruzum & Koskal (2010) indicated the effect of
customer satisfaction on behavioral intentions as contextual, as guided by their studies in USA,
Greece, Portugal and Turkey, respectively.
4.5.2.5 Influence of Perceived Service Quality on Behavioral Intentions through Mediating
Effect of Customer Value
Hypothesis 6 stated that customer value mediates the influence of perceived service quality on
behavioral intentions of the Ethiopian hotel customers. Accordingly, the mediating effect of
customer value was examined by adopting Baron and Kenny‘s (1986) approach, as discussed
earlier. In the regression analysis, behavioral intentions construct was believed to be dependent
on perceived service quality and customer value (being independent variables).
The relationship between the independent and dependent variables was presented in Figure 4.9.
Significant relationships between the independent and dependent variables were found to be
presented in all the three regression equations. Specifically, while the first regression analysis
revealed that perceived service quality significantly influencing customer value (t=13.503,
p<0.001), the second regression equation indicated the significant influence (t=12.199, p<0.001)
of service quality on behavioral intentions in the Ethiopian hotel sector.
Page 164
151
i. iii.
(β=0.713, SE=0.05, t=13.503**) (β=0.431, SE=0.06, t=7.006**)
(β=0.325, SE=0.04, t=6.921**)
ii.
(β=0.663, SE=0.05, t=12.199**)
Figure 4.9: Customer value mediation model (**Significant at 0.01 level)
When the construct of value, as perceived by the customers, was added with service quality in
the same regression model, the two independent variables were found to be significantly
affecting behavioral intentions; perceived service quality (t=7.006, p<0.001) and perceived value
(t=6.921, p<0.001). These results also indicated partial mediation, being the influence of
perceived quality on behavioral intentions became smaller in the third regression equation than
in the second (Baron and Kenny 1986).
In addition, the indirect effect of perceived value on service quality-behavioral intentions
relationship was tested by using Sobel‘s (1982) statistics, whereby the computed test value
appeared to be 6.150 (p<0.001). This revealed that customer-perceived value mediated the
influence of service quality on behavioral intentions, though the relationship remained partially,
but significantly mediated, and supported the sixth Hypothesis (H6) as:
H6: Customer value mediates the influence of perceived service quality on behavioral
intentions of the Ethiopian hotel customers
Perceived Service Quality
(Independent Variable)
Customer Value
(Mediating Variable)
Behavioral Intentions
(Dependent Variable)
Page 165
152
This empirical finding was found to be in line with other previous researches, who reported that
customer value mediates the relationship between service quality and behavioral intentions,
across varying settings/contexts (Michael et al., 2009; Naik, Gantasala & Prabhakar, 2010;
Lertwannawit & Gulid, 2011).
4.5.2.6 Effect of Service Quality on Behavioral Intentions
In order to examine the effect of overall perceived-service quality on behavioral intentions, four
regression models/equations were computed. Tables 4.11 to 4.14 presented the results of the
same.
Table 4.11: Regression of service quality on behavioral intentions
R R2 Adjusted R
2 Df F Sig. Durbin-Watson
0.506 0.256 0.254 1 148.811 0.000 1.879
Regression Coefficients
Model Unstandardized
Coefficients
Standardized
Coefficients
t Sig.
B SE β Tolerance VIF
Constant 1.430 0.227 - 6.290 0.000 - -
Overall Service
Quality
0.713 0.054 0.506 12.199 0.000 1.000 1.000
Dependent Variable: Behavioral Intentions
(Source: Survey data, 2014)
The first regression model was run with perceived overall service quality as the predictor
variable against the construct of behavioral intentions (Table 4.11), whereby the perceived
service quality was found to be explaining almost 26% of the variation in the behavioral
intentions. The result of the β coefficient indicated that a unit increase in overall quality will
Page 166
153
improve the behavioral intentions of the respondents by 0.506 folds (t=12.199, p<0.001).
Accordingly, the relationship between overall service quality and behavioral intentions can be
represented as:
Behavioral Intentions= 1.430 + 0.506 (Overall Service Quality)
In addition, the individual dimensions of service quality (being independent variables) were
regressed with the construct of behavioral intentions (as dependent). Table 4.12 presented with
the results of the same.
Table 4.12: Regression of service quality dimensions on behavioral intentions
R R2 Adjusted R
2 Df F Sig. Durbin-Watson
0.641 0.411 0.403 1 49.760 0.000 1.945
Regression Coefficients
Model Unstandardized
Coefficients
Standardized
Coefficients
T Sig.
B SE β Tolerance VIF
Constant 0.443 0.232 - 1.909 0.057 - -
Assurance 0.157 0.062 0.128 2.541 0.011 0.542 1.846
Reliability 0.318 0.062 0.267 5.116 0.000 0.504 1.986
Responsiveness 0.040 0.072 0.032 0.559 0.577 0.407 2.455
Empathy 0.201 0.061 0.191 3.319 0.001 0.416 2.405
Room
Tangibles
0.085 0.052 0.077 1.642 0.101 0.627 1.594
F&B Tangibles 0.108 0.040 0.124 2.720 0.007 0.660 1.515
Dependent Variable: Behavioral Intentions
(Source: Survey data, 2014)
Accordingly, all the service quality dimensions were found to be explaining about 40% variation
in the behavioral intentions. The analysis of β coefficients indicated varying patterns of
Page 167
154
contribution that the construct of behavioral intentions received from different service quality
dimensions.
For example, while the dimension of reliability appeared to be the largest significant contributor
(β=0.267, p<0.001) to determine favorable behavioral intentions, followed by empathy (β=0.191,
p<0.002), assurance (β=0.128, p<0.012) and F&B tangibles (β=0.124, p<0.008), dimensions of
responsiveness (β=0.032) and room tangibles (β=0.077) were appeared to be insignificant
predictors of behavioral intentions (at 95% confidence level), at least in the context of Ethiopian
hotel sector. This revealed that a unit increase in reliability, empathy, assurance and F&B
tangibles, will be increasing the behavioral intentions of the responding hotels‘ customers by
0.267, 0.191, 0.128 and 0.124 times, respectively. Moreover, the result was found to be free from
the multicollinearity problem, as indicated by the statistics of Tolerance and VIF (see Table
4.12). The other two regression equations were computed to examine the influence of overall
service quality on individual items of behavioral intentions (i.e., customer/guest revisits and
WOM/recommendations) as presented in Table 4.13 and 4.14.
Table 4.13: Regression of service quality on customer revisits
R R2 Adjusted R
2 Df F Sig. Durbin-Watson
0.466 0.217 0.215 1 120.148 0.000 1.905
Regression Coefficients
Model Unstandardized
Coefficients
Standardized
Coefficients
T Sig.
B SE β Tolerance VIF
Constant 1.483 0.253 - 5.870 0.000 - -
Overall Service
Quality
0.662 0.060 0.466 10.961 0.000 1.000 1.000
Dependent Variable: Customer Revisits
(Source: Survey data, 2014)
Page 168
155
The regression analysis revealed that the independent variable (overall perceived-service quality)
explained 21.5% variance in customer revisits to the hotel. In addition to that, regression
coefficient (β) indicated that overall perceived-service quality has significant influence on
customer revisits to the hotel. In other words, one unit increase in service quality, as perceived
by the customers, will increase their revisits to the hotels by 0.466 times.
Similarly, as presented in the Table 4.14, overall service quality was found to be explaining
19.5% variation in WOM recommendations (positively communicating/recommending the
services to others by hotels‘ customers). Moreover, the result revealed that a unit change in
perceived service quality will improve the WOM recommendations by 0.443 folds.
Table 4.14: Regression of service quality on WOM recommendations
R R2 Adjusted R
2 Df F Sig. Durbin-Watson
0.443 0.196 0.195 1 105.812 0.000 1.943
Regression Coefficients
Model Unstandardized
Coefficients
Standardized
Coefficients
T Sig.
B SE β Tolerance VIF
Constant 1.377 0.270 - 5.100 0.000 - -
Overall Service
Quality
0.664 0.065 0.443 10.286 0.000 1.000 1.000
Dependent Variable: WOM Recommendations
(Source: Survey data, 2014)
In all the cases, the independent variable of overall perceived-service quality was observed to be
significantly contributing, though with varying degrees, to the dependent variables of behavioral
Page 169
156
intentions (β= 0.506, p<0.001), customer revisits (β=0.466, p<0.001) and WOM
recommendations (β= 0.443, p<0.001). Therefore, seventh Hypothesis (H7) was supported as:
H7: Service quality has a direct and significant influence on the behavioral intentions
of hotels’ customers in Ethiopia
This result was found consistent with previous research works of Cronin, Bradly and Hult (2000)
and Lertwannawit and Gulid (2011). Additionally, Konstantinos, Nikos and Dimitri (2002) found
buying intentions and WOM communication being positively influenced by perceived service
quality, as revealed in the context of this study.
The results failed to confirm that perceived value has greater impact on behavioral intentions
than service quality and customer satisfaction, as found in some earlier researches (e.g., Oh,
1999 and Tam, 2000). Rather, the findings of this study revealed that service quality had a
significantly (p<0.001) strong influence on behavioral intentions, though the relationship
appeared to be partially mediated by customer- perceived value and satisfaction. In a nutshell, it
can be inferred that if hotels‘ customers perceived quality/performance of service offerings, with
acceptable levels of value and satisfaction, they would be exerting favorable behavioral
intentions (in terms of revisits and positive WOM recommendations).
4.6 Analysis of Differences
An attempt was made to examine the perceived differences across the study constructs of service
quality, customer value, satisfaction and behavioral intentions, as guided by the respondents‘
profiles (in terms of gender, age, nationality etc.) and hotels‘ characteristics (e.g., star category,
Page 170
157
location etc.). This was done in order to examine the way customers/guests‘ profiles and
associated hotel characteristics determine their perceptions of service quality, value, satisfaction
and behavioral intentions. For the purpose of analysis, t-test and ANOVA were performed.
While, t-test was applied to compare two categories (mean scores), ANOVA was used to
compare the mean scores from three or more categories.
4.6.1 t-test
In order to compare the respondents‘ perceptions on service quality, customer value, satisfaction
and behavioral intentions by their gender (male or female), nationality (Ethiopian or Foreigner)
and hotel location (in or outside Addis Ababa), the t-test was used. The statistics (t-test) was
assumed to be helpful in identifying any significant differences between two groups (of
respondents, objects etc.) mean scores, pertaining to the study variables/constructs.
Table 4.15 presents the mean scores and t-test results for the study constructs/dimensions by the
gender of the respondents. Accordingly, there appeared to be a significant (p<0.05) difference in
the overall quality perceptions of the male and female respondents of the study. Specifically,
female (Mean=4.243, SD=0.533) respondents were found to be better perceiving the service
quality of the corresponding hotel(s) than their male counterparts (Mean=4.112, SD=0.541).
Among the six-identified service quality dimensions, only empathy was observed to be having
significant difference (p<0.01) between the two genders. This revealed the service quality as
context specific (Dabholkar, Thorpe & Rents, 1996), in the Ethiopian hotel sector. Further, no
statistically significant difference was observed in the perceived-overall value, satisfaction and
behavioral intentions of the male and female customers/guests.
Page 171
158
Table 4.15: Group statistics and t-test result by the respondents’ gender
Dimension/Construct Gender Mean (Std. Dev.) t-value Sig.
Male (N=312) Female (N=123)
Assurance 4.187 (0.587) 4.260 (0.554) 1.189 0.235
Reliability 4.115 (0.591) 4.065 (0.613) 0.791 0.429
Responsiveness 4.147 (0.582) 4.224 (0.547) 1.270 0.205
Empathy 4.083 (0.689) 4.273 (0.609) 2.677 0.008
Room Tangibles 3.977 (0.658) 4.109 (0.598) 1.934 0.054
F & B Tangibles 3.927 (0.830) 4.085 (0.756) 1.825 0.069
Overall Service Quality 4.112 (0.541) 4.243 (0.533) 2.296 0.022
Perceived Value 3.899 (0.719) 3.926 (0.687) 0.367 0.713
Customer Satisfaction 4.097 (0.591) 4.124 (0.582) 0.437 0.662
Behavioral Intentions 4.171 (0.696) 4.199 (0.743) 0.366 0.714
(Source: Survey data, 2014; Df. = 433)
Table 4.16 highlights the differences caused by nationality of the respondents in their perceptions
of service quality, perceived-value, customer satisfaction and behavioral intentions (mean
scores). In general, the service quality dimensions of assurance, responsiveness and empathy
were perceived to be significantly (p<0.05) different by the study respondents of the two
nationalities: Ethiopians and foreigners.
Foreigners, being the respondents of this study, were found to be having better perceptions
across all the service quality dimensions than Ethiopians, though both the groups rated the
perceived service quality as above average (with a mean score of over 3). Similarly, the
foreigners (Mean=3.957, SD=0.674) perceived corresponding hotel services with higher value
than their Ethiopian counterparts (Mean=3.793, SD=0.773), and the difference appeared to be
significant (p<0.05).
Page 172
159
Table 4.16: Group statistics and t-test result by the respondents’ nationality
Dimension/Construct Nationality Mean (Std. Dev.) t-value Sig.
Ethiopians (N=133) Foreigners (N=302)
Assurance 4.017 (0.587) 4.291 (0.554) 4.658 0.000
Reliability 4.086 (0.613) 4.107 (0.590) 0.340 0.734
Responsiveness 4.072 (0.609) 4.211 (0.552) 2.345 0.019
Empathy 4.017 (0.759) 4.189 (0.624) 2.476 0.014
Room Tangibles 3.961 (0.729) 4.038 (0.602) 1.157 0.248
F&B Tangibles 3.943 (0.882) 3.985 (0.781) 0.490 0.624
Overall Service Quality 4.082 (0.564) 4.178 (0.529) 1.709 0.088
Perceived Value 3.793 (0.773) 3.957 (0.674) 2.227 0.026
Customer Satisfaction 4.042 (0.642) 4.132 (0.562) 1.468 0.143
Behavioral Intentions 4.067 (0.777) 4.228 (0.672) 2.187 0.029
(Source: Survey data, 2014; Df. = 433)
In addition, significant difference (p<0.05) in behavioral intentions of the two responding groups
was observed, whereby foreigners (Mean=4.228, SD=0.672) revealed favorable intentions in
terms of revisit and WOM recommendations than Ethiopian (Mean=4.067, SD=0.777)
customers/guests of the hotels. The finding revealed that foreigners, being the hotel guests, had
better perspectives for re-experiencing and appreciating Ethiopian hospitality than Ethiopians (by
themselves). This may be attributed to the fact that the foreigners, being study respondents,
perceived higher customer value, as associated with service provisions, than their domestic
(Ethiopian) counterparts. Though, some qualitative investigation to support this claim would be
needed, which appeared to be beyond the scope of this study.
However, no statistically significant difference in the overall service quality and customer
satisfaction was obtained between the two groups/nationalities (of respondents). Since the
majority of the guests for the three and above star hotels were assumed to be foreigners,
Page 173
160
favorable was to learn that they have better perceptions on service quality. Therefore, Ethiopian
respondents of the study were observed being more demanding and critical in assessing their
perceptions on service quality, value, satisfaction and behavioral intentions.
On the other hand, foreign guests were appeared to be more understanding of Ethiopian
conditions/situations. The results indicated that the selected dimensions of service quality,
perceived-value and behavioral intentions remained contextual (Oh, 1999; Konstantinos, Nikos
& Dimitri, 2002; Tsuar, Lin & Wu, 2008; Micheal et al., 2009; Kuruuzmu & Koksal, 2010), in
terms of their assessment by nationality, at least in the Ethiopian hotel sector.
Table 4.17: Group statistics and t-test result by the hotel location
Dimension/Construct Hotel Location Mean (Std. Dev.) t-value Sig.
Addis Ababa (N=341) Regional City (N=94)
Assurance 4.271 (0.563) 3.975 (0.574) 4.499 0.000
Reliability 4.123 (0.604) 4.018 (0.565) 1.516 0.130
Responsiveness 4.194 (0.568) 4.078 (0.585) 1.748 0.081
Empathy 4.172 (0.675) 4.010 (0.649) 2.068 0.039
Room Tangibles 4.049 (0.642) 3.890 (0.637) 2.132 0.034
F&B Tangibles 3.969 (0.797) 3.984 (0.868) 0.157 0.876
Overall Service Quality 4.190 (0.543) 4.000 (0.508) 3.050 0.002
Perceived Value 3.912 (0.688) 3.888 (0.785) 0.287 0.775
Customer Satisfaction 4.132 (0.587) 4.007 (0.584) 1.826 0.069
Behavioral Intentions 4.203 (0.709) 4.090 (0.706) 1.373 0.170
(Source: Survey data, 2014; Df. = 433)
Table 4.17 presented the perceived differences in service quality, customer value, satisfaction
and behavioral intentions of the respondents as guided by the hotel location. Accordingly, the
Page 174
161
service quality dimensions of assurance, empathy and room tangibles were perceived to be
significantly different (p<0.05) by the study respondents, based on the hotel location (in Addis
Ababa or region). Specifically, the hotels in Addis Ababa command better customer perceptions
for the dimensions of assurance (Mean=4.271, SD=0.563), empathy (Mean=4.172, SD=0.675)
and room tangibles (Mean=4.409, SD=0.642) than those in the regional cities. This may be
attributed to the fact that the hotels in Addis Ababa (being the capital of Ethiopia) maintain
relatively more resources than those in the regions, which can be used in delivering better service
performance/quality as perceived by the respondents. Additionally, as many three and above star
hotels were found to be in Addis Ababa, the observed variation in the dimension of room
tangibles would be well expected.
Similarly, the overall service quality, as perceived by the responding customers, was observed to
be significantly different (p<0.01) between the hotels located in the Addis Ababa and other
regional cities. Though, hotel location was found being non-significant (p>0.05) in determining
the respondents‘ perceived-value, satisfaction, and behavioral intentions. In a nutshell,
perception on service quality was found to be significantly varying with the hotel locations (in
and outside Addis Ababa), whereby the hotels in Addis Ababa were perceived with better
services than those from the regional cities.
4.6.2 Analysis of Variance (ANOVA)
Analysis of Variance (ANOVA) was used to determine if there exist significant differences
among the respondents‘ perceptions of service quality, customer value, satisfaction and
behavioral intentions across their visit purposes, number of nights stay, number of visits, age
Page 175
162
groups and hotels‘ star category. The one-way ANOVA procedure produces a one-way analysis
of variance for a quantitative dependent variable by a single factor (independent) variable.
Analysis of variance is used to test the hypothesis that several means are equal.
Table 4.18: ANOVA- by the respondents’ purpose of visit
Dimension/Construct Sum of squares Df. F Sig.
Assurance Between groups 1.099 3 1.096 0.350
Within groups 144.031 431
Reliability Between groups 1.631 3 1.530 0.206
Within groups 153.169 431
Responsiveness Between groups 0.449 3 0.453 0.715
Within groups 142.298 431
Empathy Between groups 0.967 3 0.711 0.546
Within groups 195.404 431
Room Tangibles Between groups 0.949 3 0.761 0.516
Within groups 179.037 431
F&B Tangibles Between groups 7.921 3 4.083 0.007
Within groups 278.748 431
Overall Service
Quality
Between groups 0.542 3 0.614 0.606
Within groups 126.745 431
Perceived Value Between groups 4.841 3 3.253 0.022
Within groups 213.764 431
Satisfaction Between groups 0.852 3 0.818 0.484
Within groups 149.576 431
Behavioral Intentions Between groups 1.276 3 0.844 0.470
Within groups 217.238 431
(Source: Survey data, 2014)
The basic objective, therefore, was to understand whether respondents‘ perceptions of the study
constructs vary across the selected profile variables (for the customers and hotels). Table 4.18
Page 176
163
presented the results of ANOVA analysis, whereby significant difference in the perception of
F&B tangibles dimension (F=4.083, p<0.008) has been witnessed, along with that of perceived
value (F=3.253, p<0.03), caused by the respondents‘ purpose of visit (business, leisure etc.).
However, no statistically significant variations in perceived overall-service quality, value,
satisfaction and behavioral intentions of the respondents were obtained as guided by their
purpose of visit.
Figure 4.10: Overall service quality by the respondents’ purpose of visit
As presented in Figure 4.10, the overall service quality was perceived to be higher by the
respondents visiting for personal reasons, followed by leisure customers/guests of the hotels. In
addition, those visiting for business purposes and staying as transit customers were found to be
perceiving corresponding hotel‘s service quality as relatively lower (but above average). Though,
the variations in perceived service quality remained insignificant (Table 4.18) across the
respondents‘ purpose of visit.
Page 177
164
On the other hand, respondents visiting the corresponding hotels for personal reasons perceived
relatively higher value than those visiting for other reasons (e.g., leisure, business and transit),
while transit customers were appeared to be perceiving the hotel service provisions with lowest
value, but above average (Figure 4.11). These differences in the visiting purposes remained
significant (Table 4.18) in determining the respondents‘ perceived value of the service.
Figure 4.11: Perceived value by the respondents’ purpose of visit
In other words, hotels‘ customers/guests varied in their perceptions of service value based on
their purpose of visit. As shown above on Fig. 4.11 guests visiting the hotels for personal and
leisure purpose perceived more value for their money than visiting the hotels for business and
transit purposes.
Page 178
165
Figure 4.12: Overall satisfaction level by the respondents’ purpose of visit
Furthermore, respondents visiting for personal reasons were found to be more satisfied than
those visiting for other purposes (Figure 4.12). While relatively lower (but above average) level
of satisfaction was noticed with transit/layover respondents, variation in their satisfaction across
the visiting purpose remained statistically insignificant. In addition, the respondents visiting the
hotel for leisure purpose were found to be holding relatively favorable behavioral intentions, as
compared to those visiting for transit, personal and business purposes (Figure 4.13). However,
the respondents‘ visiting purpose was observed to be maintaining no statistically significant
difference (Table 4.18) in their behavioral intentions (of revisit and arousing positive WOM).
Page 179
166
Figure 4.13: Behavioral intentions by the respondents’ purpose of visit
Furthermore, Table 4.19 presented the ANOVA analysis based on the length of stay (in number
of nights) by the respondents in the corresponding hotel(s). Accordingly, respondents‘
perceptions on service reliability (F=3.598, p<0.03), overall service quality (F=3.494, p<0.04),
value (F=4.541, p<0.02) and satisfaction (F=4.706, p<0.02) were found to be significantly
varying by their length of stay in the hotel. However, the number of nights that respondents
stayed in the corresponding hotels was appeared to be insignificant determinant of their
perceptions on the remaining dimensions of service quality and behavioral intentions (Table
4.19).
Page 180
167
Table 4.19: ANOVA- by respondents’ length of stay
Dimension/Construct Sum of squares Df. F Sig.
Assurance Between groups 0.958 2 1.435 0.239
Within groups 144.172 432
Reliability Between groups 2.536 2 3.598 0.028
Within groups 152.263 432
Responsiveness Between groups 0.969 2 1.477 0.230
Within groups 141.778 432
Empathy Between groups 2.333 2 2.597 0.076
Within groups 194.038 432
Room Tangibles Between groups 0.346 2 0.416 0.660
Within groups 179.640 432
F&B Tangibles Between groups 0.104 2 0.078 0.925
Within groups 286.565 432
Overall Service
Quality
Between groups 2.026 2 3.494 0.031
Within groups 125.261 432
Perceived Value Between groups 4.501 2 4.541 0.011
Within groups 214.103 432
Satisfaction Between groups 3.208 2 4.706 0.010
Within groups 147.220 432
Behavioral Intentions Between groups 1.853 2 1.848 0.159
Within groups 216.660 432
(Source: Survey data, 2014)
Figure 4.14 presented the comparison of overall service quality mean scores by the respondents‘/
guests‘ length of stay. While, the level of perceived service quality was found to be highest with
the respondents who stayed more than 2 nights in the corresponding hotels, the lowest (though
above average) level for the same was maintained by those staying for one night. As mentioned
Page 181
168
earlier, this difference in the perceived service quality, guided by length of stay , was found to be
statistically significant (Table 4.19). In a nutshell, the more the customers/guests stay in hotel,
the better would be their perceptions on service quality. This can be attributed to the fact that
longer experience with the service incites more confidence in service assessment via
repetition/reliability of service provision/performance, which in turn enhances the service
experience (or quality perceptions) and associated perceived value and satisfaction (as revealed
through Figures 4.15 and 4.16 respectively).
Figure 4.14: Overall service quality by the respondents’ length of stay
Accordingly, the perceived value of the services by the study respondents was found to be
significantly (p<0.02) varying based on the number of nights they stayed in the corresponding
hotel, whereby the customers who stayed for relatively longer (more than 2 nights) were
observed to be maintaining, relatively, high value perceptions (see Figure 4.15) than those spent
less number of nights (two or one).
Page 182
169
Figure 4.15: Perceived value by respondents’ length of stay
The perceived value of the hotel services was experienced to be above average (over 3 mean
score) by all the three respondents groups (stayed for 1 night, 2 nights and more than 2 nights).
Figure 4.16: Overall satisfaction by respondents’ length of stay
Page 183
170
In a similar manner, the overall satisfaction level of the respondents with service
performance/quality was found to be significantly (p<0.02) varying across the number of their
night stays, whereby the customers/guests stayed for more than 2 nights in the corresponding
hotels were claimed to be more satisfied (Figure 4.16) than those who stayed relatively less (1 or
2 nights). This can also be attributed to the fact that satisfaction increases by experience (if
remained positive), which may further motivate a favorable chance to extend the stay (for more
nights/days) in the same hotel, as also supported by their value perceptions (being the
respondents felt the hotel/service affordable to them).
Figure 4.17: Behavioral intentions by the respondents’ length of stay
Though, no statistically significant difference has been observed in the behavioral intentions of
the respondents as guided by their length of night stay(s) in the corresponding hotels (Table
4.19), still the customers/guests who stayed longer were appeared to be having more favorable
Page 184
171
intentions to revisit by themselves and to spread positive WOM to others about the hotel
services, as compared to those staying for lesser nights (one or two). In a nutshell, as mentioned
earlier, longer stays in hotel increase the service experience and motivate the visitors (of hotels)
to repeat the same again and again in future, perhaps, guided by their reliability of service
provisions. In other words, with repeated (or relatively) longer service experience, in a more
consistent/reliable manner, customers would start enjoying the service delivery/provision, which
in turn invite them to experience the same service again and again.
Caused by this, perhaps, the study respondents were found to be maintaining statistically
significant differences in their perceptions of service reliability (F=6.581, p<0.003) and
behavioral intentions (F=5.195, p<0.007) as guided by their number of visits (or revisits) to the
hotels. However, based on their number of visits to the corresponding hotels, the respondents
perceived overall service quality, customer value and satisfaction insignificantly (Table 4.20).
Page 185
172
Table 4.20: ANOVA- by the respondents’ number of visits
Dimension/Construct Sum of squares Df. F Sig.
Assurance Between groups 0.265 2 0.395 0.674
Within groups 144.865 432
Reliability Between groups 4.577 2 6.581 0.002
Within groups 150.222 432
Responsiveness Between groups 0.678 2 1.030 0.358
Within groups 142.069 432
Empathy Between groups 0.303 2 0.334 0.716
Within groups 196.068 432
Room Tangibles Between groups 0.120 2 0.144 0.866
Within groups 179.866 432
F&B Tangibles Between groups 2.133 2 1.619 0.199
Within groups 284.536 432
Overall Service
Quality
Between groups 0.346 2 0.588 0.556
Within groups 126.942 432
Perceived Value Between groups 0.856 2 0.849 0.429
Within groups 217.748 432
Satisfaction Between groups 0.444 2 0.640 0.528
Within groups 149.984 432
Behavioral Intentions Between groups 5.132 2 5.195 0.006
Within groups 213.382 432
(Source: Survey data, 2014)
Page 186
173
Figure 4.18 presented that the respondents visiting twice to the hotel were found to be highest in
their overall service quality perceptions, followed by those repeating their service experiences
more than two times and first time visitors to the corresponding hotels.
Figure 4.18: Overall service quality by the respondents’ number of visits
However, their perceptions on value and associated satisfaction with service provision remained
higher with those who revisit the hotel more than 2 times, as compared to others (first and second
time guests/visitors), as presented in Figures 4.19 and 4.20. Though, such differences across the
constructs of perceived service quality, value and satisfaction remained insignificantly directed
by the respondents‘ revisits to the corresponding hotels (see Table 4.20). In other words, the
differences across service quality, perceived value and satisfaction cannot be attributed to the
respondents number of visits, rather the later significantly caused varying perceptions in terms of
service reliability (F=6.581, p<0.003).
Page 187
174
Figure 4.19: Perceived value by the respondents’ number of visits
Figure 4.20: Overall satisfaction by number of visits
Page 188
175
Similarly, the behavioral intentions of revisit and WOM recommendations by the respondents
were observed to be higher for those visited the same hotel for more than 2 times, followed by
second time and first time guests to the corresponding hotels, respectively (Figure 4.21).
Therefore, the finding revealed that higher the number of revisits to the hotels, favorable would
be the behavioral intentions of the hotels‘ customers/guests. This can be attributed to the fact that
customers, in general, acquire better understanding and taste for the service while repeating their
experience with it, in order to make, in their eyes, stronger perceptions about the reliability of the
service, which in turn, improve their intentions to revisit and positive WOM to others.
Figure 4.21: Behavioral intentions by number of visits
A further attempt was made to reveal the role of respondents‘ age in determining their
perceptions on service quality, value, satisfaction and behavioral intentions (see Table 4.21).
Page 189
176
Accordingly, the respondents‘ age was found to be a non-significant (p>0.05) determinant of
service quality, customer value, satisfaction and behavioral intentions, as perceived by the
respondents.
Table 4.21: ANOVA- by respondents’ age
Dimension/Construct Sum of squares Df. F Sig.
Assurance Between groups 1.102 3 1.099 0.349
Within groups 144.028 431
Reliability Between groups 0.255 3 0.237 0.871
Within groups 154.545 431
Responsiveness Between groups 0.194 3 0.195 0.900
Within groups 142.553 431
Empathy Between groups 0.928 3 0.682 0.563
Within groups 195.443 431
Room Tangibles Between groups 0.247 3 0.197 0.898
Within groups 179.739 431
F&B Tangibles Between groups 4.130 3 2.100 0.100
Within groups 282.539 431
Overall Service
Quality
Between groups 0.943 3 1.072 0.361
Within groups 126.345 431
Perceived Value Between groups 0.904 3 0.597 0.618
Within groups 217.700 431
Satisfaction Between groups 0.857 3 0.823 0.482
Within groups 149.571 431
Behavioral Intentions Between groups 0.351 3 0.231 0.875
Within groups 218.162 431
(Source: Survey data, 2014)
Page 190
177
This may be attributed to the fact that customers, perhaps, select their hotels and corresponding
services more based on their requirements to stay/visit than the age. As a result, while factors
like purpose of visit and length of night stays were appeared to be significantly (p<0.05)
determining respondents‘ perceptions of service quality, associated value and satisfaction, the
number of revisits to the corresponding hotels shaped their behavioral intentions, more
significantly.
Figure 4.22: Overall service quality by the respondents’ age category
However, as depicted in Figure 4.22, respondents varied in terms of their levels of perceived
service quality across the age brackets. Accordingly, the senior age respondents (above 60 years)
of the hotels were found to be having higher level of overall service quality than those falling in
the ages 31-60 years (though remained above average in their perceptions of service quality).
Similarly, the level of perceived value was found to be higher with senior age (above 60 years)
respondents of the study, as compared to younger (18-30 years), middle aged (31-45 years) and
Page 191
178
relatively matured (46-60 years) counterparts (see Figure 4.23). However, these differences in
service quality and perceived value were remained insignificant (p>0.05) as presented in Table
4.21.
Figure 4.23: Perceived value by the respondents’ age category
For the remaining constructs of customer satisfaction (Figure 4.24) and behavioral intentions
(Figure 4.25), senior age respondents (above 60 years) were observed to be maintaining higher
levels than those appeared to be with relatively younger categories (below 60 years). However,
age category was not found to be significantly discriminating the customer satisfaction and
behavioral intentions to revisit and positive WOM recommendations to others by the study
respondents. As mentioned before, this can be attributed to the fact that customers, while
selecting hotels and related service provisions (both tangibles and intangibles), pay more
attention to their requirements associated with their purpose of visit and length of stay rather than
the age.
Page 192
179
Figure 4.24: Overall satisfaction by the respondents’ age category
Moreover, hardly any separate/unique service provision and/or value can be witnessed in line
with customers/guests ages, whereby senior citizens were provided with certain advantages (in
terms of service delivery, price etc.) over their younger counterparts and vice-versa. Rather all
the guests were expected to be served equally by the corresponding hotels, in terms of facilities,
respect and staff behavior to them, which may cause age as a non-significant determinant to the
respondents‘ perceptions of service quality, value, satisfaction and behavioral intentions.
Page 193
180
Figure 4.25: Behavioral intentions by the respondents’ age category
As a result of the above analysis, one case see that while certain customers/guests‘ socio-
demographic profile variables (like gender, nationality and length of stay) significantly
determine their perceptions of overall service quality, their age and purpose of visit failed to have
any significant difference in service quality, satisfaction and behavioral intentions. Similarly,
gender and number of visits of the guests to the hotels failed to determine their value perceptions
and corresponding satisfaction, though length of stay was found determining them more
significantly.
Finally, it was assumed that the respondents‘ perceptions on service quality, value, satisfaction
and behavioral intentions vary across the hotel stars, whereby, a five star hotel was considered to
be having better service provision/performance than those rated with lower stars (three and four).
Accordingly, the ANOVA results presented in the Table 4.22 revealed that hotel star categories
maintained significant variations in the respondents‘ perceptions of overall service quality
Page 194
181
(F=6.230, p<0.003), associated satisfaction (F=3.557, p<0.03) and behavioral intentions
(F=4.219, p<0.02). However, hotel stars remained insignificant in determining perceived value
of the services.
This may be attributed to the fact that when customers select a particular star hotel to stay in,
they already perceived the service delivery/quality against the charges/payment being made.
Therefore, star ratings of the hotels can be assumed as a promise from the service provider to
their customers/guests, whereby the service delivery/provisions vary with associated price
tags/charges (relatively less for three stars to high for five star hotel categories). The same
argument guides the insignificant contribution of hotel star category in determining F&B
tangibles perceptions of the respondents, whereby customers order as per their tastes, whether
served in three or above stars.
As expected, the overall service quality was perceived to be highest in the context of five-star
hotels (Figure 4.26). Moreover, the variations in the overall service quality, as guided by star
category of the corresponding hotels in Ethiopia, were appeared to be significant (see Table
4.22).
Page 195
182
Table 4.22: ANOVA- by the hotels star category
Dimension/Construct Sum of squares Df. F Sig.
Assurance Between groups 8.385 2 13.245 0.000
Within groups 136.745 432
Reliability Between groups 5.855 2 8.492 0.000
Within groups 148.944 432
Responsiveness Between groups 3.649 2 5.667 0.004
Within groups 139.098 432
Empathy Between groups 7.975 2 9.144 0.000
Within groups 188.396 432
Room Tangibles Between groups 2.558 2 3.114 0.045
Within groups 177.428 432
F&B Tangibles Between groups 1.545 2 1.170 0.311
Within groups 285.124 432
Overall Service
Quality
Between groups 3.568 2 6.230 0.002
Within groups 123.719 432
Perceived Value Between groups 0.992 2 0.985 0.374
Within groups 217.612 432
Satisfaction Between groups 2.437 2 3.557 0.029
Within groups 147.991 432
Behavioral Intentions Between groups 4.187 2 4.219 0.015
Within groups 214.327 432
(Source: Survey data, 2014)
The respondents perceived relatively better service performance/quality being offered by three-
star than four-star category hotels, selected in the study. This may be attributed to the fact that
the responding customers perceived the highest value for three-star hotel services than that for
four-star (Figure 4.27).
Page 196
183
Figure 4.26: Overall service quality by hotel stars category
Figure 4.27: Perceived value by hotel stars category
Page 197
184
As presented earlier, customers select the star category and corresponding services being guided
by their purpose of visit and length of stay among other factors. Therefore, they perceive the
associated value accordingly, and would not feel comfortable when they paid for higher class
(star category) but obtaining lower class services. Moreover, while selecting a particular star
category hotel the guests assume a certain level of service performance (being guided by their
prior experience and /or the hotel standard) and would not consider a lower level service
provision as acceptable.
As a result, perhaps, significant difference (Table 4.22) in customer satisfaction has been
observed across the hotel star categories (Figure 4.28), whereby respondents were found to be
more satisfied with the service provision of five-star hotels, followed by three and four stars.
Similarly, significant difference in their behavioral intentions was reported being guided by the
star categories of the corresponding hotels.
Accordingly, while respondents were found to be favorably intended to revisit five-star hotels,
along with spreading positive WOM to others about the hotel services, they were having
relatively less intention (though above average) to behave like, in the context of three and four
stars hotels. Such findings revealed the significant role that hotel stars (category) can have in
determining customers/guests satisfaction and intentions to revisit and WOM communications,
perhaps, guided by their service quality perceptions.
Page 198
185
Figure 4.28: Overall satisfaction by hotel stars category
Figure 4.29: Behavioral intentions by the hotels star category
Page 199
186
In a nutshell, the findings revealed the contextual nature of the study constructs of service
quality, perceived value, satisfaction and behavioral intentions, whereby their values were
observed to be influenced by respondents‘ purpose of visit, length of night stay, number of visits,
and hotel star ratings. However, the respondents were not found to be significantly varying
across these constructs, guided by their age (an important demographic variable), at least in the
context of hotel sector of Ethiopia.
By considering the above, one can see that while both hotels‘ locations and star categories
significantly affect guests‘ perceptions of overall service quality, these remained insignificant in
determining value by the hotels‘ guests. Though, star category was found to significantly
determine customer satisfaction and behavioral intentions.
4.7 Summarizing the Results
The study attempted to examine the relationship between service quality, customer satisfaction,
value and behavioral intentions in the Ethiopian hotel sector. In order to measure the service
quality, a 35 items data collection instrument has been developed by modifying the basic
SERVPERF model to fit within the context of hotel sector in Ethiopia. All the scale items were
found to be valid to measure their respective constructs, being having the factor loadings of 0.6
and above (Sergeesh, Anusree & Mohapatra, 2014).
The tangibles dimension of service quality construct was loaded in two factors, hence making the
service quality dimensions to be six, namely: Assurance, Empathy, Reliability, Responsiveness,
F&B tangibles and Room tangibles, in the context of star hotel category. Hence, the study
Page 200
187
proposes the tangibles dimensions of service quality should be separately seen as F&B tangibles
(which are directly associated with food & beverage products and facilities) and Room tangibles
(which constitutes guest room related tangibles). This is a new addition to the concept of service
quality based on empirical findings from the hotel sector. It is also logically sound proposition to
distinguish food and related items from room and related items as the quality perceived in one
(room) does not necessary reflect the same in the other (food and beverage). Besides, customers
might give differing priority to F&B tangibles and Room tangibles based on their apparent need.
Hence, having distinct treatment for the two types of tangibles in hotels is essential. Therefore,
the traditional five dimensions of service quality (SERVPERF) should be expanded to the six by
splitting tangibles dimension into two (F&B tangibles and Room tangibles) in the hotel sector.
Except for the service quality, the remaining constructs of customer satisfaction, perceived value
and behavioral intentions were found maintaining uni-dimensionality, thus revealed associated
construct validity (Sergeesh, Anusree & Mohapatra, 2014). In addition, the Cronbach alpha
coefficients were computed to test the internal consistency of the service quality dimensions and
other constructs used in the study. High alpha coefficients (over 0.7) revealed acceptable scale
reliabilities (Hair et al., 2010) in total and across the study constructs.
Apart from measuring perceived service quality, customer value, satisfaction and behavioral
intentions, an additional item was used to identify customers‘ WOM by providing options to the
respondents to select from A-WOM, BC-WOM, D-WOM and E-WOM. It was targeted to
capture and analyze the relevant target audiences of customers‘ WOM, in order to understand the
pattern of WOM recommendations by the hotels‘ guests. Accordingly, it was found that majority
Page 201
188
(39%) of the guests are most likely to recommend the hotel through A-WOM (recommendation
to Acquaintances) to their friends and family.
Whereas, significant proportion of the respondents claimed to use BC-WOM (recommend to
Business Contacts- 27%) and D-WOM (Direct recommendation to the hotel- 21%) the
proportion of the respondents who are most likely to use E-WOM (recommend Electronically)
appeared to be relatively lower (13%). Although researchers like Zhao et al (2015) have recently
discussed the influence of E-WOM on tourist booking intentions to hotels, other forms of the
WOM proposed in this study are new additions to the concept of WOM literature.
Furthermore, service quality was found to be significantly and positively influencing customer
value, satisfaction and behavioral intentions, whereby the highest contribution of the perceived
service quality was ensured towards behavioral intentions (β=0.640, p<0.001), followed by
customer satisfaction (β=0.544, p<0.001) and perceived value (β=0.506, p<0.001), as witnessed
through the regression analysis. Moreover, perceived value and satisfaction were found to be
partially mediating the influence of service quality on behavioral intentions.
Finally, an attempt was made to reveal the role of guests‘ profile variables and hotel
characteristics in determining perceived service quality, value, satisfaction and behavioral
intentions. As revealed through t-test and ANOVA statistics, significant differences across the
perceived service quality, customer value, satisfaction and behavioral intensions were observed,
being guided by the respondents‘ profile variables (e.g., gender, nationality, purpose of visit and
Page 202
189
their length of night stay) and that of the corresponding hotels‘ characteristics (e.g., location and
star category). Table 4.23 summarizes the results of the proposed research hypotheses.
Table 4.23: Summary of the results of hypothesis testing
Hypothesis Finding(s) Test Result
H1: Quality is determined by the
perceived performance of the
service quality
attributes/dimensions in the hotel
sector of Ethiopia
Multiple regression analysis indicated
that service quality
attributes/dimensions had a
significantly positive influence on
perceived-service quality. The six
service quality dimensions were found
to be explaining 69.8% variation in the
overall service quality.
Supported
H2: Perceived service quality
positively and significantly
influences the customer satisfaction
in the Ethiopian hotel sector
Perceived service quality explained
40.8% variability in customer
satisfaction. Additionally, service
quality was found to be exerted
positive and significant (β=0.640,
p<0.001) influence on customer
satisfaction.
Supported
H3-Perceived service quality
positively and significantly
influences customer value in the
Ethiopian hotel sector
Overall service quality explained
29.5% variation in perceived customer
value. Moreover, perceived service
quality was found to be positively and
significantly (β=0.544, p<0.001)
influencing customer value.
Supported
H4: Customer satisfaction
associates, positively and
significantly, with customer value in
the context of Ethiopian hotels
Correlation analysis revealed a positive
and significant association (r=0.729,
p<0.001) between customer satisfaction
and customer value.
Supported
Page 203
190
H5: Customer satisfaction mediates
the influence of perceived service
quality on behavioral intentions of
the hotel customers in Ethiopia
Mediation analysis, by using Baron and
Kenny‘s (1986) approach, revealed that
customer satisfaction partially, though
significantly (p<0.01), mediated the
influence of perceived service quality
on behavioral intentions.
Supported
H6: Customer value mediates the
influence of perceived service
quality on behavioral intentions of
the Ethiopian hotel customers
Similarly, customer value partially,
though significantly (p<0.01), mediated
the impact of perceived service quality
on behavioral intentions.
Supported
H7: Service quality has a direct and
significant influence on the
behavioral intentions of hotels’
customers in Ethiopia
Regression analysis revealed that
overall service quality explained 25.4%
variation in behavioral intentions, while
remained significant (p<0.001)
contributor to individual items of
revisit (β=0.466) and WOM (β=0.433).
Overall, a unit change in perceived
service quality will improve behavioral
intentions by 0.506 times (β=0.506,
p<0.001).
Supported
4.8 Summary of the Chapter
In line with the stated research objectives, this chapter presented the data analysis and discussion
of the results, based on the hypotheses testing. An early exploration of the data supported the use
of exploratory factor analysis (EFA), regression analysis and other parametric statistics (t-test
and ANOVA). Principal component analysis (PCA) of the service attributes/quality yielded six
Page 204
191
factors/dimensions: Assurance, Reliability, Responsiveness, Empathy, Room tangibles and Food
& Beverage (F&B) tangibles. This finding was supported by the existing literature stating service
quality as a multi-dimensional construct.
Accordingly, the reliability scores, by using Cronbach alphas, of service quality dimensions and
other study constructs of perceived value, satisfaction and behavioral intentions were computed
and found to be acceptable. Additionally, descriptive statistics were deployed to present the
respondent‘s profile and service quality perceptions. Regression analysis attempted to examine
the significance of the relationships between the constructs (as hypothesized through the
conceptual framework). All the seven hypotheses were tested and found to be fully supported.
The following chapter presents a discussion on major findings, inline with the stated research
questions, to draw the conclusion.
Page 205
192
CHAPTER 5
DISCUSSION OF FINDINGS AND CONCLUSION
This chapter discusses the major findings of the study while synthesizing the same with previous
literature. More specifically, the chapter presents discussion of findings on service quality and its
influence on customer satisfaction, perceived-value, and behavioral intentions, in the context of
Ethiopian hotel sector. Additionally, discussions are presented on findings related to the guests‘
profile and hotel characteristics in association with the study constructs (service quality,
satisfaction, value and behavioral intentions). Lastly, conclusions are drawn, based on the
findings, in order to address the research questions.
5.1 Service Quality Measurement (Modified SERVPERF)
This research used modified SERVPERF instrument for the purpose of measuring service
quality. Multi-stage research designs were applied to develop a modified instrument, considered
to be valid and reliable, to measure service quality and associated constructs in the context of
Ethiopian hotel sector. Accordingly, exploratory study was conducted to acquire full
understanding of the research variables pertinent to the research context. Relevant literature and
web reviews, and focus group discussions were performed, which further contributed to the
development of (modified) data collection instrument.
In addition to careful selection of well informed and responsible professionals for FGD to
enhance the trustworthiness of qualitative data, Exploratory Factor Analysis (EFA) and
Cronbach‘s alpha coefficients were used to test the construct validity and reliability of the scales,
Page 206
193
respectively. The EFA and Cronbach‘s alpha results proved that the instrument developed by
modifying the SERVPERF model is a valid and reliable tool to measure service quality and
associated constructs of customer satisfaction, value and behavioral intentions in the hotel sector.
With respect to the factors determining guests‘ perceptions of service quality, the results of PCA
revealed that perceived service quality consisted of six determinants/dimensions: Assurance,
Responsiveness, Reliability, Empathy, Room Tangibles, and Food & Beverage (F&B) Tangibles.
Therefore, this study supported the argument that both tangible and intangible factors of service
performance/quality remain important in service quality perceptions of the hotel‘s guests
(Milman, 2009). On the other hand, the empirical findings of the study proposed that the
‗tangibles‘ dimensions of service quality grouped into F&B tangibles and Room tangibles, which
appeared to be different from previous researchers (Parasuraman et al., 1985, 1988).
5.2 Relationship between Service Quality, Perceived Value, Customer
Satisfaction and Behavioral Intentions
The findings of the study confirm that the constructs of service quality influences customer
satisfaction, customer value and behavioral intentions are interrelated. This is inline with other
previous studies (e.g., Oh, 1999; Cronin, Bradly & Hult, 2000; Maria, Lorenzo & Antonio, 2007;
Sutanto, 2009; Kassim & Abdulah, 2010; Jani & Han, 2011; Malik, 2012). By considering the
specific research context of Ethiopian hotel sector, such findings can help to enrich our
understanding on the apparent relationships between the stated constructs (service quality,
customer satisfaction, value and behavioral intentions).
Page 207
194
Moreover, researchers like Thanika (2004) found that the contribution of service quality
dimensions to overall service quality varies in different contexts. In line to this, the study
identified that all the service quality dimensions were contributing with varying degree to the
overall service quality perception in the hotel sector. A number of other researchers also
commented that evaluation of service quality is contextual, thus difficult to find exact
dimensions that contribute equally to the overall service quality under different research contexts
(Cronin, Bradly & Hult, 2000; Konstantinos, Nikos & Dimitri, 2002; Gallazar & Saura, 2006;
Maria, Lorenzo & Antonio, 2007; Tsaur, Lin & Wu, 2008; Michael et al., 2009; Kasim &
Abdullah 2010; Naik, Gantasala & Prabhakar, 2010; Gounaris, Dimitriadis & Stathakopoulos,
2010; Jani & Han, 2011; Lertwannawit & Gulid, 2011; Basheer,2012; Simon,2012).
As per the study findings, three most important contributors to overall service quality (in order of
importance) include: responsiveness, empathy and reliability. The dimension of room tangibles
maintains least contribution along with the dimensions of assurance and F&B tangibles. This can
be considered as an important contribution to understand service quality dimensions in Ethiopian
hotel sector; different from the findings of other researches like Oh (1999).
Moreover, customer satisfaction was found significantly contributing to behavioral intentions of
revisit and inspiring positive WOM communications by the respondents. This empirical finding
confirmed the previous literature while suggesting that customer satisfaction affects behavioral
intentions (Jay & Dwi, 2000; Fiju, Frenie & Sid, 2004; Sultano, 2009; Naik, Gantasala &
Prabhakar, 2010; Basher, 2012).
Page 208
195
Similarly, majority (69%) of the respondents are maintaining relatively good (above average)
value perceptions, which ultimately determines behavioral intentions. Also, researchers like
Cronin, Bradly and Hult (2000), Shahin and Reza (2010) and Raza et al. (2012) suggested that
customer value influences the behavioral intentions of customers.
The study further attempted to examine the direct relationship between service quality
dimensions and behavioral intentions, whereby four of the six service quality dimensions were
found to be having significant influence on behavioral intentions. These dimensions include:
Reliability, Empathy, F&B Tangibles and Assurance in their order of importance. These findings
appeared to be in line with the earlier studies by Jay and Dwi (2000), Naik, Gantasala and
Prabhakar (2010) and Basher (2012), that report the varying contribution of service quality
dimensions in predicting behavioral intentions. Accordingly, this empirical finding is unique, as
might not be replicated in other research contexts, and adds knowledge on the peculiar nature of
relationships between service quality dimensions and behavioral intentions in the Ethiopian hotel
sector.
5.3 Role of Socio-Demographic Profile and Hotel Characteristics
In line with the research objectives, attempts were made to examine the association of guests‘
socio-demographic profiles and their perceptions of service quality, satisfaction, value and
behavioral intentions. Additionally, the associations between hotels‘ characteristics and guests‘
perceptions on study constructs were analyzed. Accordingly, customers‘ gender was found
maintaining significant association with the empathy dimension of service quality; female
customers perceived more empathy than their male conterpart.
Page 209
196
On the other hand, related to customers‘ nationality and their perceptions on service quality, it
was revealed that guests‘ nationality influence their perceptions of assurance, responsiveness and
empathy. The empirical findings revealed that of the two nationality groups of customers
(Ethiopian and Foreigners), the Foreigners were found to be having better service quality
perceptions (on the above stated dimensions) than Ethiopian guests. However, no significant
variations were found with respect to overall service quality and other service quality dimensions
between the two groups/nationalities.
This indicated that the hotels remained more responsive, empathetic and effective in providing
their foreign guests with welcoming and courteous service than their domestic (Ethiopian)
customers. As a result, perhaps, the foreign guests were found to be more appreciating the
Ethiopian hospitality than their Ethiopian counterparts (who already have accustomed to it).
Nonetheless, since majority of the three and above star hotels‘ customers/guests were assumed to
be foreigners, more favorable it would be for them to get admiration of their service assurance
from this group (foreign customers).
Additionally, it was found that foreign guests perceived more value than Ethiopians. Thus the
empirical findings revealed that guests‘ nationality has significant links/association with their
value perceptions too, at least in the context of hotel services. This can be attributed to the fact
that most of the star category hotel‘s rooms prices were perceived to be more affordable for the
foreigners (who pay in Dollars) than Ethiopians (paying in local currency- Ethiopian Birr) (Note:
by now 1 US Dollar = 21 Ethiopian Birr).
Page 210
197
Similar to this, foreign guests were claimed with more favorable behavioral intentions towards
the hotels than their Ethiopian counterparts. This revealed the existence of relationship between
guests‘ nationality/group and their behavioral intentions, as more foreign nationality guests
revealed that they would more likely to revisit and recommend the hotels than the
local/Ethiopian guests to the hotels. This may be attributed to the fact that the foreigners, being
study respondents, perceived higher customer value, as associated with service provisions, than
Ethiopian guests.
Since the majority of the guests for the three and above star hotels were foreigners, favorable
was to learn that they have better perceptions on service quality, customer value and behavioral
intentions. Therefore, while Ethiopian respondents of the study were observed being more
demanding and critical in assessing their perceptions on hotels‘ service quality, value,
satisfaction and corresponding behavioral intentions, foreign guests showcased their
understanding of Ethiopian conditions/situations (at least in the hotel sector).
Previous researchers also indicated that the selected dimensions of service quality, perceived-
value and behavioral intentions remained contextual (Oh, 1999; Konstantinos, Nikos & Dimitri,
2002; Tsuar, Lin & Wu, 2008; Micheal et al., 2009; Kuruuzmu & Koksal, 2010). Therefore the
empirical findings showing significant variation of customers‘ perceptions on service quality,
customer value and behavioral intentions in relation to nationality/group provides better insight
to understand the nature of relationship that the research variables maintain in the Ethiopian hotel
context.
Page 211
198
In addition to the assessments made to assess the role of socio-demographic profiles of hotels‘
guests and their perceptions on the research variables, further analysis was carried out to identify
possible links between hotels characteristics and customers‘ perceptions. Consequently, based on
the hotel location (in Addis Ababa or regional sites), the service quality dimensions of assurance,
empathy and room tangibles were perceived significantly different (p<0.05) by the responding
guests. The empirical findings revealed that guests perceived higher service quality in hotels
within Addis Ababa than those in regions, across the dimensions of assurance, empathy and
room tangibles. This may be attributed to the fact that the hotels in Addis Ababa (being the
capital city) maintain relatively more resources than those in the regions, which can be used to
deliver/ensure better service.
Additionally, as many three and above star hotels were found in Addis Ababa, the observed
variation in the dimension of room tangibles would be well expected. Similarly, hotels in Addis
Ababa were claimed to be with higher overall service level than those from regional cities.
Therefore, perceptions on service quality were found varying, significantly, with the hotel
locations (in and outside Addis Ababa), whereby the hotels in Addis Ababa were assumed
providing better services to their customers/guests than those from the regions. Such findings
revealed contextual nature of selected service quality dimensions (Dabholkar, Thorpe & Rents,
1996; Oh, 1999; Konstantinos, Nikos & Dimitri, 2002; Tsuar, Lin & Wu, 2008; Micheal et al.,
2009), while determining the role of hotel location in assessing the service
provision/performance, at least in the Ethiopian context.
Page 212
199
Further to this, analysis of variance (ANOVA) has been conducted to examine the perceptions of
customers on the research variables related to the nature of visits and hotels‘ characteristics.
Accordingly, it was found that perceived-value vary, significantly, based on the guests‘ visit
purpose. It was observed that guests visiting the hotels for personal and leisure purpose
perceived more value for their money that those who stayed in the hotels for business and transit
purposes. This can be attributed to the fact that customers compare the services against what they
actually pay for directly (like personal) or indirectly (like business and transit category) in
determining the value perceptions. In general, the customers visiting for personal reasons and
that for leisure would have more interest for value; paying from their own pockets as compared
to others (business and transit guests), who do not pay directly for the service. Thus, relatively
higher value perceptions, by those who directly pay for the service, indicate that the hotels were
able to satisfy their customers.
The analysis further revealed that there exist significant variations on guests‘ perception of
overall service quality, value and satisfaction based on their length of stay in the hotels.
Generally, it was observed that the more nights guests‘ stay in a hotel, better would be their
perceptions of reliability, overall service quality, value and satisfaction.
Additionally, based on the number of visits guests made to the hotel, the analysis revealed
significant variation across the guests‘ perceptions of reliability and behavioral intentions.
Accordingly, it was observed that the guests those repeatedly visiting a hotel, perceived more
reliability in the service than those coming for the first time. Moreover, returning guests were
Page 213
200
likely to revisit and recommend the hotels more than first timers. This is an important finding
that indicates reliable service ensures coming-back of the guests.
On the other hand, based on the hotel star category, guests‘ perceptions of overall service quality,
customer satisfaction and behavioral intentions revealed significant variations. Accordingly,
hotels with higher star rating were perceived with better overall service quality, providing more
satisfaction to their guests, and more likely to create favorable behavioral intentions than those
with lesser star rating. Also, hotels with higher star ratings appeared to be better with regard to
service quality dimensions of reliability, assurance, empathy, responsiveness and room tangibles.
However, no significant variation was found on F&B tangibles between different star category
hotels.
These findings are in line with earlier research works of Oh (1999), Tsuar, Lin and Wu (2008),
Salazar, Costa and Rita (2009), and Kuruuzmu and Koksal (2010), which reported the domains
of service quality, customer value, satisfaction and behavioral intentions being contextual, as
varying across the nature of service, country/culture and other profile variables (including socio-
demographics). Finally, WOM recommendations from the hotel customers in Ethiopia were
found having four potential audience groups: A-WOM, BC-WOM, D-WOM and E-WOM.
Though, majority of the customers were found prefering A-WOM to recommend the hotel to
their ‗Acquaintances‘, followed by D-WOM (those who prefer to give their comments ‗Directly‘
to the hotel staff and management), BC-WOM (who give comments and recommendations about
the hotel to their ‗Booking Contacts‘) and E-WOM (who used ‗Electronic media or internet‘).
Such findings revealed that hotel‘s guests feel more comfortable to communicate their
Page 214
201
experiences and service provisions (they enjoyed) with those close to them (easily/conveniently
avaliable), when recommending to others.
5.4 Conclusion
This study was desined to examine the influence of service quality on customer satisfaction,
value and behavioral intentions of hotel customers in Ethiopia by specifically focusing on three,
four and five star hotels‘ customers. In general, the aim of the study was to understand as to how
hotels‘ customers/guests evaluate service quality and to examine the relationship between the
constructs of perceived quality, customer value, satisfaction and behavioral intentions. As a
result, service quality was conceptualized as a formative construct, representing quality
attributes/dimensions forming the perceptions about service performance/quality, in line with
Zabkar et al. (2010). Accordingly, in the context of hotel sector, the study revealed six
underlying dimensions of service quality as: Assurance, Responsiveness, Reliability, Empathy,
Room Tangibles, and Food & Beverage (F&B) Tangibles. In addition, the effects of respondents‘
profile and hotels‘ characteristics on the perceived service quality, customer value, satisfaction
and behavioral intentions were examined.
All the identified quality attributes/dimensions were found, significantly, influencing the overall
perception of service performance/quality with varying contribution. For example, the dimension
of Room Tangibles was reported being the highest significant contributor to the service quality,
followed by F&B Tangibles, Empathy, Responsiveness, Reliability and Assurance. Additionally,
significantly strong relationship between service quality and perceived value supported the
Page 215
202
conceptualization of perceived quality as a dimension of customer value, as witnessed in the
research by Sanchez et al. (2006).
Consistent with the earlier researches in the services domain (Cronin, Bradly & Hult, 2000; Chen
& Chen, 2010); findings of this study support that the cognitive responses (service quality and
perceived value) guide the emotional (customer satisfaction) and the behavioral (intentions)
responses. Also, the study supports Cronin, Bradly and Hult‘s (2000) argument that the
relationship between the service constructs is far more complex than that generally reported in
the literature, and that perceived service quality directly affects customer value, satisfaction and
behavioral intentions (Petrick & Backman, 2004).
While perceived service quality was found explaining 40.8% variation in the customer
satisfaction, variations caused by service quality in perceived-value (29.5%) and behavioral
intentions (25.4%) remained significant. In a similar manner, perceived service quality was
observed contributing (directly) to the behavioral intentions of revisit and WOM
recommendations. These findings were found in line with the research works of Lee, Yoon and
Lee (2007) and Chen and Chen (2010).
Another important finding of this study can be assumed as the partial mediation of both
perceived value and satisfaction in the service quality-behavioral intentions relationship.
Nonetheless, customer satisfaction appeared being better mediating the relationship than that by
the perceived value. This result was supported by Tam‘s (2000) study, which reported that
perceived value has an indirect effect on behavioral intentions via customer satisfaction.
Page 216
203
Moreover, service quality dimensions of Reliability, Empathy, F&B tangibles, and Assurance
were found contributing, significantly, to behavioral intentions in the context of hotel sector in
Ethiopia.
The findings, in general, revealed that the study constructs have extensive integration with each
other. For example, beyond service quality and customer satisfaction, perceived value should
also be considered as important in determining behavioral intentions of revisit and WOM
recommendations by the hotel customers/guests. Other researchers like Oh (1999) and Tam
(2000) also support this argument.
Additionally, the study attempted to address its objective to examine the role of customers‘
profile and hotels‘ characteristics in determining service quality perceptions, customer value,
customer satisfaction and behavioral intentions in the Ethiopian hotel sector. The empirical
findings revealed that profile variables like gender, nationality, purpose of visit, length of stay,
hotel location and star category influence the perceptions of service quality, customer value,
satisfaction and behavioral intentions, with varying degree and significance level. This supported
the argument that such constructs remained contextual (by nature), and their values differ across
the customers‘ profile and/or service settings (Oh, 1999; Tsuar, Lin & Wu, 2008; Salazar, Costa
& Rita, 2009; Kuruuzmu & Koksal, 2010). In general, while a significant difference between
male and female appeared with respect to their overall service quality perceptions, nationality
was observed differentiating respondent‘s perceived value and behavioral intentions, more
significantly.
Page 217
204
While the respondents‘ perceived value was, significantly, determined by their purpose of visit
and length of night stay, associated satisfaction was attributed to the hotel star category and the
guests‘ length of stay. Similarly, the respondents‘ behavioral intentions were found affected,
significantly, by their number of visits and the star category of the hotel. However, respondents‘
age was not observed commanding their perceptions on service quality, value, satisfaction and
behavioral intentions, significantly, at least in the Ethiopian hotel sector. This can be attributed to
the fact that there exists, literally, no difference in the hotel service provision(s) for different age-
group customers.
In a nutshell, the study contributed to the development of theory by demonstrating the
conceptualization of the perceived service quality in the Ethiopian hotel sector. From the
theoretical perspective, this study supported the cognitive-affective-behavioral framework, as
perceived-value and customer satisfaction partially mediated the relationship between service
quality and behavioral intentions. According to Corley and Gioia (2011), a theoretical
contribution can be evaluated being incremental or revelatory based on its originality and also
based on its utility as being practical and scientific. Accordingly, the empirical findings of this
study can be considered as contribution to knowledge, as:
i) The study synthesized the factors that determine the service quality perceptions in the
hotel sector of Ethiopia, by emphasizing the multidimensional nature of service
quality across the service contexts/settings. This can be considered as incremental
theoretical contribution to the knowledge of service quality having practical utility,
particularly, in the hotel sector.
Page 218
205
ii) The study used modified SERVPERF (perceptions only) approach. This adds to the
knowledge on the measurement of service quality and provides a scientific tool to
measure service quality and its association with customer satisfaction, value and
behavioral intentions in specific context (hotel sector).
iii) The empirical findings also revealed that service quality has a direct influence on
perceived value, satisfaction and behavioral intentions of revisit and positive WOM
communications (though with varying degrees). This confirms the findings of
previous studies and only adds knowledge to understand the specific situation in the
study context.
iv) As revealed in the study, customer satisfaction influence, significantly, the behavioral
intentions of hotel customers in Ethiopia; same held true for perceived value.
However, the effect of satisfaction on behavioral intention remained higher than that
of perceived value.
v) The findings further suggested customer value should be incorporated in studies
attempting to determine the relationship between perceived service quality and
behavioral intentions.
vi) The study revealed that certain profile variables belonging to the customers and hotels
(like gender, nationality, purpose of visit, length of night stay, and star ratings of the
hotel) were influencing perceived service quality, customer value, satisfaction and
behavioral intentions. These account to valuable theoretical contributions since they
bring incremental knowledge to understand the pertinent relationships between the
research variables and customers‘ profiles and hotels‘ characteristics.
Page 219
206
vii) Finally, WOM recommendations from the hotel customers in Ethiopia were found having
four potential audience groups: A-WOM, BC-WOM, D-WOM and E-WOM; each
with varying degree of impact. Accordingly, majority of the customers appeared to
prefer A-WOM to recommend the hotel to their ‗Acquaintances‘, followed by D-
WOM (those who prefer to give their comments ‗Directly‘ to the hotel staff and
management), BC-WOM (who give comments and recommendations about the hotel
to their ‗Booking Contacts‘) and E-WOM (who used ‗Electronic media or internet‘).
The proposition on the dimensions of WOM could be considered as a novel
contribution to the understanding of customers‘ word-of-mouth.
5.5 Summary of the Chapter
In the first part of this chapter, discussion on the study findings was presented. Accordingly, the
chapter discussed the study contribution in the light of findings, specific to the measurement of
service quality in the hotel sector- as proposing a valid and reliable instrument. The chapter also
discussed that the exploratory factor analysis (EFA) revealed six service quality dimensions,
with varying degrees of contributions to determine overall service quality. Additionally, the
chapter discussed the role/contribution that service quality has in influencing, directly, the
behavioral intentions of the hotels‘ guests.
The mediating effects of customer satisfaction and value on the relationship between service
quality and behavioral intentions have been discussed, whereby customer satisfaction was
observed strongly mediating the service quality-behavioral intentions relationship than
perceived-value. In addition, the chapter discussed findings related to the roles that customer‘s
Page 220
207
socio-demographics (e.g., gender, nationality, visit purpose and length of stay in the hotel) and
hotel‘s characteristics (e.g., star rating and location) play in determining guests‘ perceptions of
service quality, value, satisfaction and behavioral intentions. All the discussions on the study
findings were made by synthesizing them with previous researches.
Finally, conclusion was drawn in the light of findings, and contributions of the study were
highlight. Based on the findings and conclusion, the following chapter presents theoretical,
policy and managerial implications, along with the limitations of the study and directions for
future research.
Page 221
208
CHAPTER 6
THEORETICAL, POLICY AND MANAGERIAL IMPLICATIONS
This chapter presents the implications of the study to guide relevant stakeholders in theory and
policy formulation, and decision-making by practitioners/managers, pertaining to the domain of
service quality, customer value, satisfaction and behavioral intentions. In addition, the chapter
highlights the limitations of the study and provides directions for further research.
6.1 Theoretical Implications
The SERVPERF is found to be a valid and reliable approach/model to measure service quality in
the hotel sector. This can be considered as an incremental theoretical contribution since it adds-
up on the knowledge of measuring service quality in specific service context (Hotel sector).
Accordingly, empirical findings of the study revealed service quality construct with six (6)
dimensions: Assurance, Responsiveness, Empathy, Reliability, F&B tangibles and Room
tangibles. The proposition of this study to separately treat tangibles related to ‗Food and
Beverage‘ from that of ‗Guest Rooms‘ is a new addition to the conceptualization of service
quality, and regarded as a theoretical contribution. Hence, researchers conducting studies in the
hotel sector can apply these dimensions separately to better understand their relative
importance/weight in varying contexts (e.g., Resorts, Motels etc.).
The proposition of the study on dimensions of WOM can also be considered as a novel
theoretical contribution; by conceptualizing customers‘ WOM recommendations different from
traditional and E-WOM ways. Other forms of WOM suggested by this study have not been
Page 222
209
discussed by other researchers so far. Therefore, understanding WOM in terms of A-WOM, BC-
WOM, D-WOM and E-WOM expands the conceptualization of WOM and gives insight on how
different forms of WOM would influence customers‘ decision making process.
The findings of this study accepting all the seven hypothesized relationships have a theoretical
implication being all the hypothesized relationships comply with the results of earlier studies.
However, due to the peculiar nature of the Ethiopian hotel sector, the nature of relationships
among the research variables were appeared to maintain slight differences. For example,
although service quality was found influencing the behavioral intentions of customers like
previous studies, the nature and extent of the mediating role of customer satisfaction and value in
service quality-behavioral intentions relationship appeared different in the hotel context.
Specifically, customer satisfaction mediates the relationship between service quality and
behavioral intentions bettern than that of perceived-value.
Furthermore, findings pertaining to the association of customers‘ profile variables and hotels‘
characteristics with their perceptions of service quality, value, satisfaction and behavioral
intentions amount to incremental theoretical contribution in the service/tourism marketing, and
specific to hotel sector. Accordingly, this study expanded the body of knowledge by adding
discussions to show how socio-demographic variables like gender and nationality, influence
customers‘ evaluation of service quality, value, satisfaction and behavioral intentions.
Apparently, foreign guests are found maintaining more favorable evaluations of hotels‘ service
quality, perceived-value and behavioral intentions than local (Ethiopian) customers. This may
have significant implications, and invites further qualitative investigation.
Page 223
210
6.2 Policy Implications
The study developed, and tested for validity and reliability, a standard instrument to measure
service quality and its relationship with perceived-value, customer satisfaction and behavioral
intentions in the hotel sector. Hence, hotels, MoCT and relevant stakeholders in the sector should
enforce the application of such a standard scientific instrument to evaluate the guests‘
perceptions of hotel service quality and the way it relates with other constructs (like customer
satisfaction and behavioral intentions).
The findings of this study revealed that the most significant determinants of service quality in the
hotel sector include responsiveness, empathy and reliability. Hence, in developing policies and
strategies for the hotel sector, significant attention should be paid to enhance service
responsiveness, empathy and reliability dimensions to ensure service quality. These three
dimensions, being more related to the human element of service delivery, have important policy
implications. As a result, focus should be on attracting qualified/trained hotel employees,
enhancing their skills through training and development, and empower them to be more
responsive to guests‘ needs/queries (wherever required) to provide better service experience to
them. Even though, all the service quality dimensions were found contributing, significantly, to
the overall service quality perceptions, concentrating on human side by the hotel management
would be valuable, being difficult to imitate by their competitors (compared to those of
tangibles).
In addition, findings revealed that foreign guests perceived more service quality and value to
their money (when staying in star category hotels) than Ethiopian guests, thus are more likely to
Page 224
211
revisit and recommend the hotel than local/Ethiopian counterparts. This has important policy
implication; indicates, from international tourism perspectives, that our hotels provide
better/more hospitality to the international guests. Though, the hotel management should look
into possible causes of relatively lower perceptions as observed by Ethiopian guests to devise
appropriate strategy to bring them at par with foreign guests. One possible reason for lower value
perceptions might be the currency (exchange) rate applied for rooms in three, four and five star
hotels. Since Ethiopians earn their income in local currency, paying the room rates in Dollars
would make it more expensive to them than foreign guests/tourists.
In a nutshell, the empirical findings showing significant associations between the research
variables and guests‘ demographic profiles provide insight to develop segmentation bases for
hotel customers. Future studies targeting to socio-demographic variables, would be helpful in
developing specific policies for segmentation and targeting hotel customers to offer services in a
more customized way/manner. Also, by considering that hotels in Addis Ababa were perceived
with better service quality than hotels found in regional cities, MoCT should work hard to
formulate policies to help improving the hotel standards in regional cities too.
6.3 Managerial Implications
The study found out that different forms of WOM have varying degrees of importance on
customers‘ recommendations. The majority of the customers use A-WOM to recommend the
hotels to their family and friends who seek to obtain trustworthy information from them. This is
a good opportunity for hotel managers to capitalize on this unpaid advertising to let their guests
be satisfied and recommend them to their acquaintances. The reverse is also true; if we
disappoint our customers, they will tell to their friends/relatives not to come to us. Besides this,
Page 225
212
customers‘ using A-WOM would not be communicating their intentions to do so; leaving the
management in dark about what is going on in customers‘ mind. Therefore, attentive attempt
should be made to get customers‘ feedback before they leave our hotel and ensure any corrective
actions when needed.
The other important managerial implication is BC-WOM, being second largest group to more
likely to spread WOM to ‗Booking Contacts‘. This being very important decision makers of
corporate clients, the nature of information communicated through BC-WOM would make or
break the business relationships. Therefore, here again greater care should be taken first to please
these corporate clients and then closely follow-up their feedback on the service delivery/quality,
and make immediate corrections before they make a potentially destructive BC-WOM.
The findings of the study revealed that four of the six service quality dimensions have significant
contribution to influence behavioral intentions of the guests. These can have important
managerial implications. Therefore, hotel managers should develop their understanding of
reliability, empathy, F&B tangibles and assurance, and put appropriate strategies in place to
influence customers‘ behavioral intentions to revisit and positive-WOM recommendations.
Specifically, management should take necessary steps to enhance service reliability by providing
dependable and error free services to its guests. This might take establishing flawless operational
process with qualified and motivated employees (equipped with modern service equipments and
machineries). Hence, the hotel management should ensure smooth functioning of all the service
Page 226
213
components (e.g., software, hardware and humanware) to meet service standards in a more
reliable manner.
Furthermore, employees should be trained and motivated to provide a caring/friendly service to
the guests, and by giving personal attention to their requests/queries with confidence and
professionally. In line to this, routine and surprise checks to these areas would be highly
recommended. Also, the management needs to pay due attention to the quality of food and
beverage served to their guests. This goes with attracting qualified chef‘s and cooks, securing
quality and reliable source for food preparation (raw) materials and continuously up-dating the
food and beverage products to meet guests‘ needs and tastes.
The dimension of ‗F&B tangibles‘, which includes the ambience of bars and restaurants, food
and beverage quality, along with complimentary breakfast, was found to be determining the
service quality perceptions of the hotel customers/guests. Hence, the hotel management should
improve the ambience of associated bars and restaurants by making contemporary arrangements.
Also, it was noted that guests‘ purpose of visit to the hotel and their length of stay have
significant association with their perceptions of service, quality, value and behavioral intentions.
Consequently, guests staying in the hotel for personal reasons and leisure purpose perceived
more value than those staying for business and transit purposes. This implies that guests who are
directly paying for their rooms are convinced that they are getting more value for money than
others (whose bills are usually covered by others like company). Hotel management can make
Page 227
214
more assessment to find the reasons behind this and attempt to enhance the value perceptions of
business and transit guests.
The findings also indicated that guests staying more nights, usually, perceived higher level of
service quality, satisfaction and value than those staying for short. This implies that hotels are
giving more attention to their guests who stay longer, or the guests feel more comfortable as they
go along with the hotel services, overtime.
As reliability dimension of service quality maintains significant influence on guests‘ behavioral
intentions (of revisit and provoke positive WOM), this implies that even if guests are satisfied,
what makes them to come back is the reliability of service. Therefore, hotel managers should
give substantial attention to provide error free, dependable service as it makes the customers
come back and recommend their hotels.
6.4 Limitations and Directions for Future Research
The absence of up-to-date and complete set of secondary data is perceived as a major limitation
of this study. Particularly, data pertaining to exact number of star hotels and their regional
distribution are found unavailable with the MoCT. As a result, 2010 data were used to form the
sampling base for the survey. However, complete set of information was acquired (in terms of
available rooms, services etc.) to draw sample of respondents from the participating hotels.
Apart from service quality, there might be other variables influencing customer satisfaction,
perceived value and behavioral intentions, being mediators and moderators, though this study
Page 228
215
examined the link between these constructs alone. Though, the methodology and the statistical
tools used in the study were meant to serve the research objectives and to test the hypothesized
relationships, the usage of Sobel-test can only determine the significance of meadiation effect.
Future studies can use path modeling for testing meadiation (by customer satisfaction and
perceived-value) and validating the proposed model.
Service quality was considered as a stand-alone construct in this study, as suggested by Gallarza
and Saura (2006). However, further studies could investigate service quality as a part of
perceived value, in line with Oh (2000) and Sweeney and Soutar (2001). In addition, future study
should expand the scope of this research in terms of the number and type of hotels (beyond three,
four and five star categories), including an examination of the external validity of the findings
with reference to other types of hotels (below three stars or not falling under any star category),
motels and resorts, while making a comparison across service quality, value perceptions,
satisfaction and behavioral intentions constructs, even within cities or regions.
Moreover, future research should examine the direct and indirect effect of individual value
dimensions on customer satisfaction and behavioral intentions, by conceptualizing perceived
value construct made of factors like personal/social value, monetary value and emotional value
(Sweeney and Soutar, 2001). Although the study attempted to capture the relevant
variables/constructs that have relationship with service quality, the role of consumer
demographics and hotel characteristics as moderators, would also be examined in service
quality-behavioral intentions relationship by future researches.
Page 229
216
6.5 Chapter Summary
This chapter presented the implications forwarded for different stakeholders. Specifically, in the
light of study findings, theoretical, policy and managerial implications are forwarded. While
certain service quality dimensions like reliability, F&B tangibles and assurance are highlighted
to be significant for developing theoretical models and facilitating managerial decisions in hotel
sector, star rating and corresponding hotel facilities can have policy implications to the sector.
Hotels managers are advised to ensure quality service more through humanware by recruiting
and selecting trained/qualified staff with empathetic behavior, along with paying attention to
other determinants of service quality. Finally, the chapter presented limitations of the study by
highlighting the challenges faced in obtaining secondary data and provided directions to future
research.
Page 230
217
References
Aaker, D.A, Kumar, V. and Day, G.S. (1998) Marketing Research, New York: Wiley.
Abubakar, M.M., Mokhtar, S.S.M. and Abdullateef, A.O. (2013) ‗The Moderating Effect of
Long-Term Orientation Culture on the Relationship between Trust, Personalization and
Customer Satisfaction and Loyalty: A Proposed Framework‘, International Journal of Academic
Research in Business and Social Sciences, Vol. 3, No. 9, pp. 117-131.
Adams, J., Khan, H., Raeside, R. and White, D. (2010) Research Methods for Graduate Business
and Social Science Studies, 5th
ed., London: SAGE Publications.
Adrian, P. (1998) Principles of Service Marketing, New York: McGraw-hill Publishing.
Anderson, E.W. and Sullivan, M.W. (1993) ‗The antecedents and consequences of customer
satisfaction for firms‘ Marketing science, 12(2), pp.125-143.
Ajzen, I. (1971) ‗Attitudinal vs. Normative Messages: An Investigation of the Differential
Effects of Persuasive Communication on Behavior‘, Sociometry, Vol. 34, June, pp. 263-280.
Alexandris, K., Dimitriadis, N. and Markata, D. (2002) ‗Can Perceptions of Service Quality
Predict Behavioral Intentions?: An Exploratory Study in the Hotel Sector in Greece‘, Managing
Service Quality, Vol. 12, No. 4, pp. 224-231.
Altinay, L. and Paraskevas, A. (2008) Planning Research in Hospitality and Tourism, London:
Butterworth-Heinemann.
Amin, M., Yahya, Z., Aniza Ismayatim, W.F., Nasharuddin, S.Z. and Kassim, E. (2013) ‗Service
Quality Dimension and Customer Satisfaction: An Empirical Study in the Malaysian Hotel
Industry‘, Services Marketing Quarterly, Vol. 34, No. 2, pp. 115-132.
Armitage, C.J. and Conner, M. (2001) ‗Efficacy of the Theory of Planned Behavior: A Meta-
analytical Review‘, British Journal of Social Psychology, Vol. 40, pp.471-499.
Page 231
218
Arasli, H., Mehtap-Smadi, S. and Katircioglu, S.T. (2005) ‗Customers service quality in the
Greek Cypriot banking industry‘, Managing Service Quality, Vol. 15, No. 1, pp. 41-56.
Asad, M. and Tim, L., (2010) ‗Customer Perceptions of Service Quality in Luxury Hotels in
New Delhi, India: an Exploratory Study‘, International Journal of Contemporary Hospitality
Management, Vol. 22, No. 2, pp. 160-173.
Altinay, L. and Paraskevas, P. (2008) ‗ Data collection techniques‘, Planning Research in
Hospitality and Tourism, pp.107-135.
Bagozzi, R. (1992) ‗The Self Regulation of Attitude, Intention and Behavior ‘,Journal of Social
Psychology, Vol. 55, No. 2, pp. 178- 204.
Baker, D.A. and Crompton, J.L.(2000) ‗Quality, Satisfaction and Behavioral Intentions‘, Journal
of Tourism Research, Vol. 27, No. 3, pp.785-804.
Barbara, R., L., and Pamela, M. (2004) ‗Service Failure and Recovery: Evidence from the Hotel
Industry‘, International Journal of Contemporary Hospitality Management, Vol.15, No.1, pp.6-
17.
Baron, R. M., and Kenny, D. A. (1986) ‗The Moderator–mediator Variable Distinction in Social
Psychological Research: Conceptual, Strategic, and Statistical Considerations‘, Journal of
Personality and Social Psychology, Vol. 51, Iss. 6, pp.1173-1180.
Basheer, A.G. (2012) ‗The Relationships between Service Quality, Satisfaction and Behavioral
Intentions of Malaysian Spa Center Customers‘, International Journal of Business and Social
Science, Vol. 3, No. 1.pp. 198-205.
Babakus, E. and Boller, G.W. (1992) ‗An empirical assessment of the SERVQUAL
scale‘, Journal of Business research, 24(3), pp.253-268.
Bedi, M. (2010) ‗An Integrated Framework for Service Quality, Customer Satisfaction and
Behavioral Responses in Indian Banking Industry- A Comparison of Public and Private Sector
Banks‘, Journal of Services Research, Vol. 10, No. 1, pp. 157-172.
Best, R.J. (2004) Market-Based Management Strategies for Growing Customer value and
profitability. 3rd
ed., Pearson: Prentice Hall.
Berry, L.L. (1980) ‗Services Marketing is Different‘, Business, 30(3), pp.24-29.
Page 232
219
Bettman, J.R., Luce, M.F. and Payne, J.W. (1998) ‗Constructive Consumer Choice Processes‘,
Journal of Consumer Research, Vol. 25, No. 3, pp.187-217.
Biljana, A. and Zekiri, J. (2011) ‗Measuring Customer Satisfaction with Service Quality using
American Customer Satisfaction Model (ACSI Model)‘, International Journal of Academic
Research in Business and Social Science, Vol. 1, No. 3, pp.232-258.
Blaxter, L., Hughes, C. and Tight, M. (2006) How to Research? 3rd
ed., Berkshire: Open
University Press.
Bolton, R.N. and Drew, J.H. (1991)‗A Multi-stage Model of Customers‘ Assessments of Service
Quality and Value‘, Journal of Consumer Research, Vol.17, No. 4, pp.375-384.
Boulding, W., Kalra, A., Staelin, R. and Zeithaml, V.A. (1993) ‗A Dynamic Process Model of
Service Quality: From Expectations to Behavioral Intentions‘, Journal of Marketing Research,
Vol. 30, No. 1, pp.7-28.
Brady, M.K. and Cronin, J.J.Jr. (2001) ‗Some New Thoughts on Conceptualizing Perceived
Service Quality: A Hierarchical Approach‘, Journal of Marketing, Vol. 65, July, pp.34-49.
Brady, M.K., Knight, G.A., Cronin, J.J., Tomas, G., Hult, M. and Keillor, B.D. (2005)
‗Removing the Conceptual Lens: a Multinational, Multi-setting Comparison of Service
Evaluation Models‘, Journal of Retailing, Vol. 81, No. 3, pp.215-230.
Brown, S.W. and Swartz, T. (1989) ‗A Gap Analysis of Professional Service Quality‘, Journal of
Marketing, Vol. 53, No. 2, pp. 92-98.
Bryman, A. (2012) Social Research Methods, 4th
ed., Oxford: Oxford University Press.
Bryman, A. and Bell, E. (2007) Business Research Methods, 2nd
ed., Oxford: Oxford University
Press.
Burns, A.C. and Bush, R.F. (2000) Marketing Research, New Jersey: Prentice Hall Publishing.
Burns, D. and Neisner, L. (2006) ‗Customer Satisfaction in a Retail Setting: The Contribution of
Emotion‘, International Journal of Retail & Distribution Management, Vol. 34, No. 1, pp. 49-
66.
Page 233
220
Carrillat, F.A., Jaramillo, F. and Mulki, J.P., 2007. The validity of the SERVQUAL and
SERVPERF scales: A meta-analytic view of 17 years of research across five
continents. International Journal of Service Industry Management, 18(5), pp.472-490.
Caro, L.M. and Garcia, J.A.M. (2008) ‗Developing a Multidimensional and Hierarchical Service
Quality Model for the Travel Agency Industry‘, Tourism Management, Vol. 29, Iss.,4, pp.706-
720.
Caro, L.M. and Garcia, J.A.M. (2007) ‗Measuring Perceived Service Quality in Urgent Transport
Service‘, Journal of Retailing and Consumer Services, 14(1), pp.60-72.
Carman, J.M. (1990) ‗Consumer Perceptions Of Service Quality: An Assessment ‗, Journal of
retailing, 66(1), p.33.
Chang, H. (2008) ‗Increasing Hotel Customer Value through Service Quality Cues in Taiwan‘,
The Service Industries Journal, Vol. 28, No. 1, pp.73–84.
Chaniotakis, I.E. and Lymperopoulos, C. (2009)‗Service Quality Effect on Satisfaction and
Word of Mouth in the Health Care Industry‘, Managing Service Quality, Vol. 19, No. 2, pp.229-
242.
Chatura R. and Neely A. (2003) ‗Some Moderating Effects on the Service Quality-Customer
Retention Link‘, International Journal of Operations & Production Management, Vol. 23, No. 2,
pp.230-248.
Chen, C, Chen, S, and Lee, H. (2013) ‗Interrelationships between Physical Environment Quality,
Personal Interaction Quality, Satisfaction and Behavioral Intentions in Relation to Customer
Loyalty: The Case of Kinmen‘s Bed and Breakfast Industry‘, Asia Pacific Journal Of Tourism
Research, Vol. 18, No. 3, pp. 262-287.
Chen, C. (2008) ‗Investigating Structural Relationships between Service Quality, Perceived
Value, Satisfaction, and Behavioral Intentions for Air Passengers: Evidence from Taiwan‘,
Journal of Travel & Tourism Marketing, Vol.17, No. 1, pp. 709-717.
Chen, C., Lee, H., Chen, S. and Huang, T. (2011) ‗Tourist Behavioral Intentions in Relation to
Service Quality and Customer Satisfaction in Kinmen National Park, Taiwan‘, International
Journal of Tourism Research, Vol.13, No.5, pp. 416-432.
Chen, C.F. and Chen, F.C. (2010) ‗Experience Quality, Perceived Value, Satisfaction and
Behavioral Intentions for Heritage Tourists‘, Tourism Management, Vol. 31, No. 1, pp.29-35.
Page 234
221
Cho, H., Byun, B. and Shin, S. (2014) ‗An Examination of the Relationship between Rural
Tourists' Satisfaction, Revisitation and Information Preferences: A Korean Case Study‘,
Sustainability, Vol. 6, No. 9, pp. 6293-6311.
Cho, Y. and Rutherford, B. (2011) ‗Customers‘ Relationship with the Service Firm and Its Sales
Personnel: Does Gender Matter?‘, Journal of Marketing Theory and Practice, Vol. 19, No. 3, pp.
325-336.
Choi, T.Y. and Chu, R. (2000) ‗Levels of Satisfaction among Asian and Western Travellers‘,
International Journal of Quality & Reliability Management, Vol. 17, No. 2, pp.116-132.
Chowdhary, N. and Parakash, M. (2007) ‗Prioritizing Service Quality Dimensions, Managing
Service Quality: An International Journal, Vol. 17, No. 5, pp. 493-509.
Churchill, G. (1979)‗A Paradigm for Developing Better Measures of Marketing Constructs‘,
Journal of Marketing Research, Vol. 16 (Feb.), pp. 64-73.
Churchill, G., and Iacobucci, D. (2002) Marketing Research: Methodology and Foundation, 8th
ed., New York: South West Publishers.
Cooper, D. and Schindler, P. (2008) Business Research Methods, 10th
ed., New York: McGraw
Hill Publishers.
Creswell, J.W. (2009) Research Design: Qualitative, Quantitative and Mixed Methods
Approaches, 3rd
ed., Thousand Oaks, California: Sage Publications.
Cronbach, L.J. and Meehl, P.E. (1955) ‗Construct Validity in Psychological Tests‘,
Psychological Bulletin, Vol. 52, No. 4, pp. 281-302.
Cronin, J. and Taylor, S. (1994) ‗SERVPERF versus SERVQUAL: Reconciling Performance-
Based and Perceptions-Minus-Expectations Measurement of Service Quality‘, Journal of
Marketing, Vol. 58, pp. 125-131.
Cronin, J. and Tayor S. (1992) ‗Measuring Service Quality: Reexamination and Extension‘,
Journal of Marketing, Vol.56, July, pp.56-57.
Page 235
222
Cronin, J., Bradly, M. and Hult, T. (2000) ‗Assessing the Effect of Quality, Value, and Customer
Satisfaction on Customer Behavioral Intention in Service Environment‘, Journal of Retailing,
Vol. 76, No.2, pp. 193-218.
Crosby, P. (1995) Philip Crosby’s Reflections on Quality, New York: McGraw-Hill.
Croney, K., and Gioia, D. (2011) ‗Building Theory about Theory Building: What Constitutes a
Theoretical Contribution?‘, Academy of Management Review, Arizona State University, Vol. 36,
No. 1, 12-32.
Crossan, F. (2003) ‗Research Philosophy: Towards an Understanding‘, Nurse Researcher, Vol.
11, No. 1, pp. 46-55.
Cole, S.T. and Illum, S.F. (2006) ‗ Examining the Mediating Role of Festival Visitors‘
Satisfaction in the Relationship between Service Quality and Behavioral Intentions‘, Journal of
Vacation Marketing, 12(2), pp.160-173.
Dabholkar, P., Thorpe, D.I. and Rents, J.O. (1996), ‗A Measure of Service Quality for Retail
Stores‘, Journal of the Academy of Marketing Science, Vol. 24, Winter, pp. 3-16.
Daniel, C. and Berinyuy, L. (2010) ‗Using the SERVQUAL Model to Assess Service Quality
and Customer Satisfaction: An Empirical Study of Grocery Stores in Umea‘, Umea University.
Deming, W.E. (1986) Out of the Crisis, Cambridge: MIT Center for Advanced Engineering
Study.
Devellis, R.F. (1991) Scale Development: Theory and Applications, Applied Social Research
Methods, Series 26, New Bury Park: Sage Publications.
Devine, F. and Heath, S. (1999) Sociological Research Methods in Context. Palgrave Macmillan.
Dormann, C.F., Elith, J., Bacher, S., Buchmann, C., Carl, G., Carré, G., Marquéz, J., Gruber, B.,
Lafourcade, B., Leitão, P.J., Münkemüller, T., McClean, C., Osborne, P.E., Reineking, B.,
Schröder, B., Skidmore, A.K., Zurell, D. and Lautenbach, S. (2013) ‗Collinearity: a Review of
Methods to Deal with it and a Simulation Study Evaluating their Performance‘ Ecography, Vol
36, No. 1, pp. 27-46.
Drost, E. (2011) ‗Validity and Reliability in Social Science Research‘, Education Research and
Perspectives, Vol.38, No. 1, pp. 105-123.
Page 236
223
Duman, T. and Mattila, A.S. (2005) ‗The Role of Affective Factor on Perceived Cruise Vacation
Value‘, Tourism Management, Vol. 26(3), pp.311-323.
Ebisa, G. and Andualem, G. (2013) ‗Hotel Sector Investment in Ethiopia‘, Journal of Business
Management, Vol. 1, No. 2, pp. 35-54.
Edward, M. and Sahadev, S. (2011) ‗Role of Switching Costs in the Service Quality, Perceived
Value, Customer Satisfaction and Customer Retention Linkage‘, Asia Pacific Journal of
Marketing and Logistics, Vol. 23, No. 3, pp. 327-345.
Eggert, A. and Ulaga, W. (2002) ‗Customer Perceived Value: a Substitute for Satisfaction in
Business Markets?‘, Journal of Business and Industrial Marketing, Vol. 17, No. 2/3, pp. 107-
118.
Enquist, B., Edvardsson, B. and Sebhatu, S.P. (2007) ‗Values-based service quality for
sustainable business‘, Managing Service Quality, Vol. 17, No. 4, pp.385–403.
Fecikova, I. (2004) ‗An index method for measurement of customer satisfaction‘, The TQM
Magazine, Vol. 16 Iss: 1, pp. 57-66.
Fairchild, A. and Mackinnon, D.( 2009) ‗ A General Model for Testing Mediation and
Moderation Effects‘, Society for Prevention Research, Springer, Vol. 10, pp. 87-99.
Festus O., Maxwell K. H. and Godwin J. (2006)‗Service Quality, Customer Satisfaction, and
Behavioral Intentions in Service Factory‘, Journal of Services Marketing, Vol. 20, No. 1, pp.59-
72.
Field, A. (2009) Discovering Statistics Using SPSS, 3rd
ed., London: Sage Publications.
Fiju, A., Frenie, F. and Sid, G. (2004) ‗Evaluating Service Quality in a UK Hotel Chain: a Case
Study‘, International Journal of Contemporary Hospitality Management, Vol. 16, No. 6, pp.
380-384.
Fornell, C., Johnson, M.D., Anderson, E.W., Cha, J. and Bryant, B.E.(1996) ‗The American
customer satisfaction index: nature, purpose, and findings‘, The Journal of Marketing, pp.7-18.
Flick, U. (2009) An Introduction to Qualitative Research. Sage.
Page 237
224
Fournier, S. and Mick, D.G. (1999) ‗Rediscovering Satisfaction‘, Journal of Marketing, Vol. 63,
No. 4, pp.5-23.
Francis, B. (1995) ‗SERVQUAL: Review, Critique, Research Agenda‘, European Journal of
Marketing, Vol. 30, No.1, pp.8-32.
Francois, A., Jaramillo, C.F. and Mulki, J. (2007) ‗The Validity of the SERVQUAL and
SERVPERF Scales A Meta-analytic View of 17 Years of Research Across Five Continents‘,
International Journal of Service Industry Management, Vol. 18, No. 5,pp. 472-490.
Gallarza, M. and Saura, I. (2006) ‗Value Dimensions, Perceived Value, Satisfaction and Loyalty:
An Investigation of University Students‘ Travel Behavior‘, Journal of Tourism Management,
Vol. 27, No. 3, pp. 437-452.
Garvin, D.A. (1984) ‗What Does Product Quality Really Mean?‘, Sloan Management Review,
Fall, pp. 25-43.
Gavin, E. and Philip, D. (1997) ‗Improving Service Quality: Lessons and Practice from the Hotel
Sector‘, Managing Service Quality, Vol. 7, No. 5, pp. 224-226.
Gilbert, G.R and Cleopatra V. (2006)‗A Cross-Industry Comparison of Customer Satisfaction‘,
Journal of Services Marketing, Vol., 20, No.5, pp.298–308.
Gilbert, G.R., Veloutsou , C., Goode, M.M.H. and Mountinho, L. (2004) ‗Measuring Customer
Satisfaction in the Fast Food Industry: A Cross National Approach‘, Journal of Services
Marketing, Vol. 18 No. 5, pp. 371-83.
Gounaris, S., Dimitriadis, S. and Stathakopoulos, V. (2010) ‗An Examination of the Effects of
Service Quality and Satisfaction on Customers' Behavioral Intentions in E‐shopping‘, Journal
of Services Marketing, Vol. 24, No. 2, pp.142-156.
Graziano, A. and Raulin, M. (2010) Research Methods: The Process of Inquiry, 7th
ed., Boston:
Prentice-Hall.
Green, P., Tull, D. and Albaum, G. (2005) Research for Marketing Decisions, 5th
ed., New
Delhi: Prentice-Hall India.
Page 238
225
Gregory, R.J. (1992) Psychological Testing: History, Principles and Applications, Boston: Allyn
and Bacon Inc.
Grönroos, C. (1990) Service Management and Marketing, Lexington, Mass: Lexington Books.
Grönroos, C. (2000) Service Management and Marketing: a Customer Relationship Management
Approach, 2nd
ed., Chichester: Wiley.
Guba, E.G. (1990) The Paradigm Dialog, Newbury Park, CA: Sage Publications.
Gummesson, E. (2003) ‗All Research is Interpretive!‘, Journal of Business and Industrial
Marketing, Vol. 18, Iss.6/7, pp. 482-492.
Gustafsson, A. Johnson, M.D. and Roos, I. (2005) ‗The effects of customer satisfaction,
relationship commitment dimensions, and triggers on customer retention‘, Journal of Marketing,
Vol.69, pp. 210-218.
Hair, J., Black, W.C., Babin, B.J. and Anderson, R.E. (2010) Multivariate Data Analysis, 7th
ed.,
New Jersey: Pearson Education International.
Halil, N. and Kashif, H. (2005a) ‗Perceptions of Service Quality in North Cyprus Hotels‘,
International Journal of Contemporary Hospitality Management, Vol. 17, No. 6, pp. 469-480.
Halil, N. and Kashif, K. (2005b) ‗Diagnosing the Zone of Tolerance for the Hotel Services‘,
Managing Service Quality, Vol. 15, No.3, pp. 259-277.
Han, H. and Ryu, K. (2009) ‗The roles of the physical environment, price perception, and
customer satisfaction in determining customer loyalty in the restaurant industry‘, Journal of
Hospitality and Tourism Research, Vol. 33, No. 1, pp. 487–510.
Heskett, J.L., Sasser, W.E. Jr. and Schlesinger, L.A. (1997) The Service-Profit Chain, New York,
NY: Free Press
Hokey, M. and Hyesung, M., (1997) ‗Benchmarking the Quality of Hotel Services: Managerial
Perspectives‘, International Journal of Quality& Reliability Management, Vol. 14, No. 6, pp.
582-590.
Page 239
226
http://www.tripadvisor.com/Hotels-g293791-Addis_Ababa-Hotels.html (accessed on June 25-30,
2013)
Huang, H. (2012) ‗Golf Event Sports Tourists: Behavioral Intentions and Perceptions of Service
Quality, Value, Satisfaction, and Image‘, PhD Thesis, Texas Tech University.
Hutchinson, J., Lai, F. and Wang, Y. (2008) ‗Understanding the Relationships of Quality, Value,
Equity, Satisfaction and Behavioral Intentions among Golf Travelers‘, Journal of Tourism
Management, Vol. 30, No. 2, pp.298-308.
James, A.F. and Mona, J.F. (2006) Service Management: Operation, Strategy, Information
Technology, 5th
ed., New Delhi: Tata McGraw-Hill.
Jani, D. and Han, H. (2011) ‗Investigating Key Factors Affecting Behavioral Intentions:
Evidence from Full Service Restaurant Setting‘, International Journal of Contemporary
Hospitality Management, Vol. 23, No.7, pp. 1000-1018.
Jani, D. and Han, H. (2013) ‗Personality, Social Comparison, Consumption Emotions,
Satisfaction, and Behavioral Intentions‘, International Journal of Contemporary Hospitality
Management, Vol. 25, No. 7, pp. 970-993.
Jay, K. and Dwi, S. (2000) ‗Customer loyalty in the Hotel Industry: The role of Customer
Satisfaction and Image‘, International Journal of Contemporary Hospitality Management,
Vol.12, No. 6, pp. 346-35.
Jing, B. and Andrew, C. (2009) ‗A Conceptual Framework of Hotel Experience and Customer
Based Brand Equity: Some Research Questions and Implications‘, International Journal of
Contemporary Hospitality Management, Vol. 22, No. 2, pp. 174-193.
Johnson, R.B. and Onwuegbuzie, A.J. (2004) ‗Mixed methods research: A research paradigm
whose time has come‘ Educational researcher, 33(7), pp.14-26.
Johnson, M.D. and Fornell, C. (1991) ‗A Framework for Comparing Customer Satisfaction
Across Individuals and Product Categories‘, Journal of economic psychology, 12(2), pp.267-
286.
Juan, C. and Zornoza, C., (2000) ‗Validity and Reliability in Perceived Quality Measurement
Models‘ International Journal of Quality & Reliability Management, Vol. 17, No. 8, pp. 899-
918.
Page 240
227
Juran, J. (1988) Quality Control Handbook, 4th
ed., New York: McGraw-Hill.
Jones, S. (2005) Toward an Acceptable Definition of Service [service-oriented
architecture]. IEEE software, 22(3), pp.87-93.
Kaul, S. (2007) ‗ Measuring Retail Service Quality: Examining Applicability of International
Research Perspectives in India‘, Vikalpa, 32(1), pp.15-26.
Kassim, N. and Abdullah, A. (2010) ‗The Effect of Perceived Service Quality Dimensions on
Customer Satisfaction, Trust, and Loyalty in E-commerce Settings: A Cross Cultural Analysis‘,
Asia Pacific Journal of Marketing and Logistics, Vol. 22, No. 3, pp. 351-371.
Kenneth, E.C. and David, L.K. (2003) Service Marketing: Operation, Management and Strategy,
2nd
ed., New Jersey: Atomic Dog Publishing.
Khan, N., Latifah, S. and Kadir, S.A. (2011) ‗The impact of perceived value dimension on
satisfaction and behavior intention: Young-adult consumers in banking industry‘, African
Journal of Business Management, Vol. 5, No. 11, pp. 4087-4099.
Kitapci, O., Dortyol, I.T., Zührem, Y. and Gulmez, M. (2013) ‗The Paths from Service Quality
Dimensions to Customer Loyalty‘, Management Research Review, Vol. 36, No. 3, pp. 239-255.
Kim, S. and Jin, B. (2002) ‗Validating the Retail Service Quality scale for US and Korean
Customers of Discount Stores: an Exploratory Study‘, Journal of Services Marketing, 16(3),
pp.223-237.
Konstantinos, A., Nikos, D. and Dimitri, M. (2002) ‗Can Perception of Service Quality Predict
Behavioral Intentions? An exploratory Study in the Hotel Sector in Greece‘, Managing Service
Quality, Vol.12,No. 4, pp. 224-231.
Kothari, C.R. (2004) Research Methodology: Methods and Techniques, 2nd
ed., New Delhi: New
Age Publishers.
Kotler, P. (1991) Marketing Management: Analysis, Planning, Implementation and Control,
New Jersey: Prentice Hall.
Kotler, P. and Armstrong, G. (2006) Principles of Marketing, 11th
ed., New Delhi: Prentice-Hall
India.
Page 241
228
Kotler, P. and Keller, K. (2009) A Framework for Marketing Management, 4th
ed., New Delhi:
Pearson Education Inc.
Koutouvalas, D.K., Siomkos, G.J. and Mylonakis, J. (2005) ‗Perceived service quality
management and loyalty in public versus private banks operations: some empirical evidence‘,
Int. J. Services and Operations Management, Vol. 1, No. 2, pp.101–122.
Kozak, M. (2001) ‗Comparative Assessment of Tourist Satisfaction with Destinations Across
Two Nationalities‘, Journal of Tourism Management, Vol. 22, No. 4, pp. 391-401.
Kozikowski, A. (2012) The Interaction between Service Quality and Word-of-Mouth on Service
Quality Perceptions, Satisfaction, Loyalty, Value and Trust, PhD Thesis, Hofstra University.
Krejcie, R.V. and Morgan, D.W. (1970) ‗Determining Sample Size for Research Activity‘,
Educational and Psychological Measurement, Vol. 30, pp. 607-610.
Krueger, R. and Casey, M. (2009) Focus Groups: A Practical Guide for Applied Research, 4th
ed., New Jersey: SAGE Publications.
Kruger, R. (2002) Designing and Conducting Focus Group Interviews, University of Minnesota
Press.
Kumar, A. and Lim, H. (2008) ‗Age Differences in Mobile Services Perception: Comparison of
Generation Y and Baby Boomers‘, Journal of Services Marketing, Vol. 22, No. 7, pp568-577.
Kuruuzum, A. and Koksal, C. (2010) ‗The Impact of Service Quality on Behavioral Intention in
Hospitality Industry‘, International Journal of Business and Management Studies, Vol.2, No.1,
pp.9-15.
Lai, I. (2015) ‗The Roles of Value, Satisfaction, and Commitment in the Effect of Service
Quality on Customer Loyalty in Hong Kong-Style Tea Restaurants‘, Cornell Hospitality
Quarterly, Vol. 56, No. 1, pp.118-138.
Ladhari, R. (200) ‗Alternative Measures of Service Quality: a Review‘, Managing Service
Quality: An International Journal, 18(1), pp.65-86.
Lee, C.K., Yoon, Y.S. and Lee, S.K. (2007) ‗Investigating the Relationship among Perceived
Value, Satisfaction, and Recommendation: the Case of the Korean DMZ‘, Tourism Management,
Vol. 28, No. 1, pp. 204-214.
Page 242
229
Lee, H., Lee, Y. and Yoo, D. (2000) ‗The Determinants of Perceived Service Quality and its
Relationship with Satisfaction‘, Journal of Services Marketing, Vol.14, No.3,pp. 217-223.
Lee, M.J., Lee, S. and Joo, Y.M. (2015) ‗The effects of exhibition service quality on exhibitor
satisfaction and behavioral intentions‘, Journal of Hospitality Marketing & Management, Vol.
24, pp. 683–707.
Lertwannawit, A. and Gulid, N. (2011) ‗International Tourists‘ Service Quality Perception and
Behavioral Loyalty toward Medical Tourism in Bangkok Metropolitan Area‘, Barcelona
European Academic Conference, Barcelona, Spain.
Levesque T.J. and McDougall, G.H. (1996) ‗Customer Dissatisfaction: The Relationship
between Types of Problems and Customer Response‘, Canadian Journal of Administrative
Sciences, Vol. 13, No. 3, pp. 264-276.
Lewis, B.R. (1993) ‗Service Quality Measurement‘,Journal of Marketing Intelligence and
Planning, Vol. 11, No. 4, pp. 4-12.
Lehtinen, U. and Lehtinen, J.R. (199) ‗Two Approaches to Service Quality
Dimensions‘, Service Industries Journal, 11(3), pp.287-303.
Li, S., Yu-Ying, H. and Yang, M.M.( 2011) ‗How Satisfaction Modifies the Strength of the
Influence of Perceived Service Quality on Behavioral Intentions‘, Leadership in Health Services,
Vol. 24, No. 2, pp. 91-105.
Liana, V., Rohit, G.P. and Chekitan, D. (2005) ‗Service Innovation and Customer Choices in the
Hospitality Industry‘, Journal of Managing Service Quality, Vol. 15, No. 6, pp.555-576.
Lovelock, C.H. and Yip, G.S. (1991) ‗Developing Global Strategies for Service
Businesses‘ California management review, 38(2), pp.64-86.
Lu, T., Tu, R. and Jen, W. (2011) ‗The Role of Service Value and Switching Barriers in an
Integrated Model of Behavioral Intentions‘, Total Quality Management & Business Excellence,
Vol. 22, No. 10, pp. 1071-1089.
Page 243
230
Malhotra, N.K, (2004) Marketing Research: An Applied Orientation, 4th
ed., New Jersey:
Pearson Education Inc.
Malik, S.U. (2012) ‗Customer Satisfaction, Perceived Service Quality and Mediating Role of
Perceived Value‘,International Journal of Marketing Studies, Vol. 4, No.1, pp.68-75.
Mangold, W. G., Miller, F. and Brockway, G. R. (1999) ‗Word-of-mouth communication in the
service marketplace‘, The Journal of Services Marketing, Vol. 13, No. 1, pp. 73-89.
Martinez, J.A. and Martinez, L., 2010. Some insights on conceptualizing and measuring service
quality. Journal of Retailing and Consumer Services, 17(1), pp.29-42.
Marco, A.R. (2001) ‗Measuring and Managing Service Quality: Integrating Customer
Expectations‘, Managing Service Quality, Vol. 11, No. 1, pp. 22-31.
Marczyk, G., Dematteo, D. and Festinger, D. (2005) Essentials of Research Design and
Methodology, New Jersey: John Wiley and Sons Inc.
Mardia, K.V. (1970) ‗Measures of Multivariate Skewness and Kurtosis with Applications‘,
Biometrika, Vol. 57, pp. 519-530.
Maria, A.G., Lorenzo, R.C. and Antonio F.B., (2007) ‗Assessing Tourist Behavioral Intentions
through Perceived Service Quality and Customer Satisfaction‘, Journal of Business Research,
Vol. 60, No. 2, pp. 31-46.
Marinkovic, V., Senic, V., Ivkov, D., Dimitrovski, D. et al. (2014) ‗The Antecedents of
Satisfaction and Revisit Intentions for Full-Service Restaurants‘, Marketing Intelligence &
Planning, Vol. 32, No. 3, pp. 311-327.
Markovic, S. and Jankovic, S.R. (2013) ‗Exploring the Relationship between Service Quality
and Customer Satisfaction in Croatian Hotel Industry‘, Tourism and Hospitality Management,
Vol. 19, No. 2, pp. 149-164.
Mason, M. and Nassivera, F. (2013) ‗A Conceptualization of the Relationships between Quality,
Satisfaction, Behavioral Intention, and Awareness of a Festival‘, Journal of Hospitality
Marketing & Management, Vol. 22, No. 2, pp. 162-182.
Page 244
231
Matzler, K., Hinterhuber, H.H., Daxer, C. and Huber. M. (2005) ‗The relationship between
customer satisfaction and shareholder value‘, Total Quality Management, Vol. 16, No. 5, pp.
671-680.
McDougall, G.H. and Levesque, T. (2000) ‗Customer Satisfaction with Services: Putting
Perceived Value into Equation‘, Journal of Services Marketing, Vol. 14, pp. 392-410.
McNeill, P. and Chapman, S. (2005) Research Methods. Psychology Press.
Mehta, S.C., Lalwani, A.K. and Li Han, S. (2000), ‗Service quality in retailing: relative
efficiency of alternative measurement scales for different product-service environments‘,
International Journal of Retail & Distribution Management, 28(2), pp.62-72.
Meyer, A. and Westerbarkey, P. (1996)‗ Measuring and Managing Hotel Guest Satisfaction‘,
Service quality in hospitality organizations, pp.185-203.
Miaoulis, G. and Michener, R.D. (1976) An Introduction to Sampling, Dubuque, Iowa: Kandall
Hunt Publishing Company.
Michael, D. (2003) ‗Does Organizational Climate Add to the Service Quality in Hotels?‘,
International Journal of Contemporary Hospitality Management, Vol. 15, No.4, pp.206-213.
Michael, D., Jonathan, H.W., Bai-Ding, H. and Christopher, G. (2009) ‗An empirical Study of
Behavioral Intentions in the Taiwan Hotel Industry‘, Journal of Innovative Marketing, Vol. 5,
No. 3, pp.30-50.
Milman, A. (2009), ‗Key Attributes for Evaluating the Guest Experience at Theme Parks‘,
International Journal of Tourism Research, Vol. 11, pp. 373-387.
MoCT (2006) Tourism Statistics Bulletin: 2003-2005, Addis Ababa: Federal Democratic
Republic of Ethiopia, Ministry of Culture and Tourism, No. 8.
MoCT (2010) Tourism Statistics Bulletin: 2006-2008, Addis Ababa: Federal Democratic
Republic of Ethiopia, Ministry of Culture and Tourism, No. 9.
MoCT (2011) Hotel Star Rating Criteria for Ethiopian Hotels, Addis Ababa: Federal
Democratic Republic of Ethiopia, Ministry of Culture and Tourism, Unpublished.
MoCT (2013a) Tourism Statistics Bulletin: 2009-2012, Addis Ababa: Federal Democratic
Republic of Ethiopia, Ministry of Culture and Tourism, No. 10.
Page 245
232
MoCT (2013b) International Visitors’ Exit Survey Report- Phase I, Addis Ababa: Federal
Democratic Republic of Ethiopia, Ministry of Culture and Tourism.
Morgan, N. A., Anderson, E.W. and Mittal, V. (2005) ‗Understanding firms‘ customer
satisfaction information usage‘, Journal of Marketing, Vol. 69, No. 3, pp. 131-51.
Mosahab, R., Mohammad, O. and Ramayah, T. (2010) ‗Service Quality, Customer Satisfaction
and Loyalty: A Test of Mediation‘, International Business Research, Vol. 3, No. 4, pp. 72-81.
Morales, M. and Ladhari, R. (2011) ‗Comparative Cross-Cultural Service Quality: an
Assessment of Research Methodology‘, Journal of Service Management, 22(2), pp.241-265.
Murasiranwa, E., Nield, K. and Ball, S. (2010) ‗Hotel Service Quality and Business
Performance in Five Star Hotels Belonging to UK Hotel Chain‘ International ICHRIE
Conference, July 2010.
Nadiri, H. and Tümer, M. (2009) ‗ Retail service Quality and Behavioral Intentions: An
Empirical Application of the Retail Service Quality Scale in Northern Cyprus‘, E+ M Ekonomie
a Management, (2), p.127.
Naik, C.N., Gantasala, S.G. and Prabhakar,G.V.(2010) ‗ Service Quality (SERVQUAL) and its
effect on Customer Satisfaction in Retailing‘, European Journal of Social Sciences, Vol.16,
No.2, pp. 231-243.
Nancy, B., Chitiris, L. and Paravantis, J. (2009) ‗The Relationship between Internal and External
Service Quality‘, International Journal of Contemporary Hospitality Management, Vol. 21, No.
3, pp. 275-293.
Negi, R. (2009) ‗Determining Customer Satisfaction through Perceived Service Quality: A study
of Ethiopian Mobile Users‘, International Journal of Mobile Marketing, Vol. 4, No.1, pp. 31-38.
Negi, R. (2010) ‗Determining Satisfaction through Customer-Perceived Service Quality and
value: Evidence from Ethiopian telecommunications‘, International Journal of Services and
Operations Management, Vol. 7, No. 3, pp. 333-350.
Nelson, T. and Hailin, Q. (2000) ‗Service Quality in China's Hotel Industry: a Perspective from
Tourists and Hotel Managers‘, International Journal of Contemporary Hospitality Management,
Vol. 12, No. 5, pp. 316-326.
Page 246
233
Newman, K. (2001) ‗Interrogating SERVQUAL: a Critical Assessment of Service Quality
Measurement in a High Street Retail Bank‘, International journal of bank marketing, 19(3),
pp.126-139.
Nowacki, M.M. (2009) ‗Quality of Visitor Attractions, Satisfaction, Benefits and Behavioral
Intentions of Visitors: Verification of a Model‘, International Journal of Tourism Research, Vol.
11, pp. 297-309.
Naderian, A. and Baharun, R.( 2015) ‗Service Quality and Consumer Satisfaction and Loyalty
association Moderated by Switching Cost in Hospitality Industry‘, International Journal of
Hospitality & Tourism Systems, 8(1), pp.10-22.
Nunnaily, J.C. (1978) Psychometrtc Theory New York: McGraw-Hill.
Osborne, J., and Waters, E. (2002) ‗Four Assumptions of Multiple Regression that Researchers
Should Always Test‘, Practical Assessment, Research & Evaluation, Vol.8, No. 2, pp.1-9.
O‘Leary, Z. (2014) The Essential Guide to Doing Your Research Project, 2nd
Ed., Los Angeles:
Sage Publication.
Oh, H. (1999) ‗The Relationships between Service Quality, Satisfaction, and Behavioral
Intentions of Malaysian Spa Center Customers‘, International Journal of Hospitality
Management, Vol. 18, No. 2.
Ok, C., Back, K. and Shanklin, C. W. (2007) ‗Mixed findings on the service recovery paradox‘,
The Service Industries Journal, Vol. 27, No. 6, pp. 1-16.
Olive, G. and Martin, A.O. (1996) ‗SERVQUAL and the Northern Ireland Hotel Sector: a
Comparative Analysis- Part I‘, Journal of Managing Service Quality, Vol. 6, No. 6, pp. 25–32.
Oliver, L. (1997) Satisfaction: a Behavioral Perspective on the Consumer, New York: McGraw-
Hill.
Oliver, R.L. (1997) Satisfaction: A Behavioral Perspective on the Consumer, New York, NY:
McGraw-Hill.
Page 247
234
Oriade, A.D. (2013) ‗An Empirical Investigation of the Relationship between Perceived Quality,
Value, Satisfaction and Behavioral Intentions among Visitors to UK Attractions‘, PhD Thesis,
University of Salford.
Olsen, S.O. (2002) ‗Comparative Evaluation and the Relationship between Quality, Satisfaction,
and Repurchase Loyalty‘, Journal of the academy of marketing science, 30(3), pp.240-249.
Osarenkhoe, A., Byarugaba, J.M., Birungi, M.K., Okoe, A.F. and Bennani, A.E. (2014)
‗Technology-Based Service Encounter—A Study of the Use of E-Mail as a Booking Tool in
Hotels‘, Journal of Service Science and Management, 7(06), p.419.
Osarenkhoe A., and Bennani A.(2007) ‗An exploratory study of implementation of customer
relationship management strategy‘, Business Process Management Journal, Vol. 13 Iss: 1,
pp.139 – 164.
Olorunniwo, F., Hsu, M.K. and Udo, G.J. (2006) ‗ Service quality, customer satisfaction, and
behavioral intentions in the service factory‘, Journal of Services Marketing, 20(1), pp.59-72.
Ozdemir, V.E. and Hewett, K.. (2010) ‗The effect of collectivism on the importance of
relationship quality and service quality for behavioral intentions: A cross-national and cross-
contextual analysis‘ Journal of International Marketing, 18(1), pp.41-62.
Papadimitriou, D (2013) 'Service Quality Components as Antecedents of Satisfaction and
Behavioral Intentions: The Case of a Greek Carnival Festival', Journal of Convention & Event
Tourism, 14, 1, pp. 42-64.
Parasuraman A. (2002) ‗Service Quality and Productivity‘, Journal of Managing Service
Quality, Vol. 12, No. 1 pp. 6-9.
Parasuraman, A., Berry, L.L. and Zeithaml, V.A. (1991) ‗Refinement and Reassessment of the
SERVQUAL Scale‘, Journal of Retailing, Vol. 67, No. 4, pp. 420-450.
Parasuraman, A., Zeithaml, V.A. and Berry, L.L. (1985) ‗A Conceptual Model of Service Quality
and its Implications for Future Research‘, Journal of Marketing, Vol. 49, pp. 41-45.
Parasuraman, A., Zeithaml, V.A. and Berry, L.L. (1988) ‗SERVQUAL: a Multiple-item Scale
for Measuring Consumer Perceptions of Service Quality‘, Journal of Retailing, Vol. 64, No. 1,
pp.12-40.
Parker, C. and Mathews, B.P. (2001) ‗Customer satisfaction: Contrasting Academic and
Consumers‘ Interpretations‘, Marketing Intelligence & Planning, 19(1), pp.38-44.
Page 248
235
Perran, A. (1995) ‗Dimensions of Service Quality: A Study in Istanbul‘, Managing Service
Quality, Vol. 5, No. 6, pp. 39-43.
Petrick, J.F., and Backman, S.J. (2002) ‗An Examination of the Construct of Perceived Value for
the Prediction of Golf Travelers‘ Intentions to Revisit‘, Journal of Travel Research, Vol. 41, No.
1, pp. 38-45.
Patterson, P.G. and Spreng, R.A. (1997) ‗Modeling the relationship between perceived value,
satisfaction and repurchase intentions in a business-to-business, services context: an empirical
examination‘, International Journal of service Industry management, 8(5), pp.414-434.
Pollack, B.L. (2008) ‗The nature of the service quality and satisfaction relationship: empirical
evidence for the existence of satisfiers and dissatisfiers‘, Managing Service Quality, 18(6),
pp.537-558.
Ramanathan, U. and Ramanathan, R. (2011) ‗Guests' Perceptions on Factors Influencing
Customer Loyalty‘, International Journal of Contemporary Hospitality Management, Vol. 23,
No. 1, pp. 7-25.
Ravichandran, K., Bhargavi, K. and Kumar, A. (2010) ‗Influence of Service Quality on Banking
Customers‘ Behavioral Intentions‘, International Journal of Economics and Finance, Vol. 2,
No. 4.
Rayka, P., Anneke, F. and Ross C. (2005), ‗Impediments to Improvements in Service Quality in
Luxury Hotels‘, Journal of Managing Service Quality, Vol. 15, No. 4, pp.357-373.
Raza , M., Ahmad, S., Hayat M. and Khurram, B. (2012) ‗Relationship between Service
Quality, Perceived Value, Satisfaction and Revisit Intentions in Hotel Industry‘, Interdisciplinary
Journal of Contemporary Research in Business, Vol.4, No. 8.
Reichheld, F.F. and Sasser, W.E.J. (1990) ‗Zero Defections: Quality Comes to Services‘,
Harvard Business Review, Vol. 68, No. 5, pp. 2-9.
Riadh, L. (2009a) ‗Service Quality, Emotional Satisfaction, and Behavioral Intentions: A study
in the Hotel Industry‘, Managing Service Quality, Vol. 19, No. 3, pp. 308-33.
Riadh, L. (2009b) ‗A Review of Twenty Years of SERVQUAL Research‘, International Journal
of Quality and Services Science, Vol. 1, No. 2, pp. 172-198.
Page 249
236
Rust, R.T. and Zahorik, A.J. (1993) ‗Customer Satisfaction, Customer Retention, and Market
Share‘, Journal of Retailing, Vol. 69, No. 2, pp. 193-215.
Rust, R.T. and Oliver, R.L. eds. (1993) Service Quality: New directions in Theory and Practice.
Sage Publications.
Reisinger, Y. and Turner, L.W. (2002) ‗Cultural differences between Asian tourist markets and
Australian hosts, Part 1‘, Journal of travel Research, 40(3), pp.295-315.
Ryu, K. and Han, H. (2010) ‗Influence of the quality of food, service, and physical environment
on customer satisfaction and behavioral intention in quick-casual restaurants: Moderating role of
perceived price‘, Journal of Hospitality & Tourism Research, Vol. 34, No. 3, pp. 310-329.
Ryu, K., Lee, H. and Kim, W.G. (2012) ‗The Influence of the Quality of the Physical
Environment, Food and Service on Restaurant Image, Customer Perceived Value, Customer
Satisfaction, and Behavioral Intentions‘, International Journal of Contemporary Hospitality
Management, Vol. 24, No. 2, pp. 200-223.
Salazar, A., Costa, J. and Rita, P. (2010) ‗A Service Quality Evaluation Scale for the Hospitality
Sector: Dimensions, Attributes and Behavioral Intentions‘, Worldwide Hospitality and Tourism
Themes, Vol. 2, No. 4, pp.383-39.
Salkind, N. (2009) Exploring Research, 7th
ed., New Delhi: Prentice-Hall India.
Sánchez, J., Callarisa, L., Rodríguez, R.M. and Moliner, M.A. (2006) ‗Perceived Value of the
Purchase of a Tourism Product‘, Tourism Management, Vol. 27, No. 3, pp. 394-409.
Sanchez-Gutierrez, J., Gonzalez-Uribe, E.G. and Coton, S.G.H. (2011) ‗Customer satisfaction in
the hospitality industry in Guadalajara, Mexico‘, Advances in Competitiveness Research, Vol.
19, No. 4, pp. 17-30.
Sandstrom, S., Edvardsson, B., Kristensson, P. and Magnusson, P. (2008) ‗Value in use through
Service Experience‘, Managing Service Quality, Vol. 18, No. 2, pp.112-126.
Sanjay, K. J. and Gupta, G. (2004) ‗Measuring Service Quality: SERVQUAL vs. SERVPERF
Scales‘, VIKALPA, Vol. 29, No. 2, pp.25-38.
Page 250
237
Sarantakos, S. (1998) Social Research, 2nd
Ed., South Yarra, Victoria: Macmillan Education.
Saunder, M., Lewis, P. and Thornhill, A. (2007) Research Methods for Business Students, 4th
ed.,
London: Pearson Education Ltd.
Swan, J.E. and Combs, L.J. (1976) ‗Product Performance and Consumer Satisfaction: A New
Concept‘, Journal of marketing, 40(2), pp.25-33.
Shahin, A. and Reza, D. (2010) ‗Correlation Analysis of Service Quality Gaps in Four Stars
Hotels in Iran‘, International Business Research Journal, Vol. 3, No.3, pp. 40-47.
Sheth, J.N., Newman, B.I. and Gross, B.I. (1991) Consumption Value and Market Choice,
Cincinnati, OH: South Western Publishing Company.
Seth, N., Deshmukh, S.G. and Vrat, P. (2005) ‗Service Quality Models: a Review‘, International
journal of quality & reliability management, 22(9), pp.913-949.
Simon, G.N. (2012) ‗Linking Quality, Satisfaction and Behavioral Intentions in Ghana‘s Mobile
Telecommunication Industry‘, European Journal of Business and Management, Vol. 4, No.7,
pp.1-17.
Smith, A. and Bolton, R. (1998) ‗An experimental investigation of customer reactions to service
failure and recovery encounters: Paradox or peril?‘, Journal of Service Research, Vol. 1, No. 1,
pp. 65-81.
Sobel, M.E. (1982), ‗Asymptotic Intervals for Indirect Effects in Structural Equations Models‘,
in S. Leinhart, (ed.), Sociological Methodology, San Francisco, CA: Jossey-Bass, pp. 290-312.
Som, A.P.M., Marzuki, A., Yousefi, M. and AbuKhalifeh, A.N. (2012) ‗Factors Influencing
Visitors‘ Revisit Behavioral Intentions: A Case Study of Sabah, Malaysia‘, International Journal
of Marketing Studies, Vol. 4, No. 4, pp. 39-50.
Spinks, W., Lawley, M. and Richins, H. (2005) ‗Satisfaction with Sunshine Coast Tourist
Attractions: The Influence of Individual Visitor Characteristics‘, The Journal of Tourism Studies,
Vol. 16, No. 1, pp.12-23.
Spreng, R.A., Harrell, G.D. and Mackoy, R.D. (1995) ‗Service recovery: Impact on satisfaction
and intentions‘, Journal of Services Marketing, Vol. 9, No. 1, pp. 15-23.
Page 251
238
Sergeesh, S., Anusree, M.R. and Mohapatra, S. (2014) Business Research: An Applied
Orientation, Geneva: Springer International Publishing.
Stenkamp, J.E.M. (1990) ‗Conceptual Model of the Quality Perception Process‘, Journal of
Business Research, Vol. 21, pp. 309-333.
Sutanto, J.E. (2009) ‗Dimension Quality of Service Influence Customer Satisfaction in Hotel: A
Case of an Examination of the Transactional Model in Service Industry‘, in proceedings of
International Seminar on Industrial Engineering and Management, Bali.
Swanson, S.R. and Kelley, S.W. (2001) ‗Service recovery attributions and word-of-mouth
intentions‘, European Journal of Marketing, Vol. 35, No. 1/2, pp. 194-211.
Sweeney, J.C. and Soutar, G.N. (2001) ‗Consumer Perceived Value: The Development of a
Multiple Item Scale‘, Journal of Retailing, Vol. 77, No. 2, pp. 203-220.
Tam, J. (2000) ‗The Effects of Service Quality, Perceived Value and Customer Satisfaction on
Behavioral Intentions‘, Journal of Hospitality and Leisure Marketing, Vol. 6, No.4, pp.31-43.
Teas, K.R. (1993) ‗Consumer Expectations and the Measurement of Perceived Service Quality‘,
Journal of Professional Services Marketing, Vol. 8, No. 2, pp. 33-53.
Thanika, D.J. (2004) ‗Exploring International Tourists‘ Perceptions of Hotel Operations by
Using a Modified SERVQUAL Approach: A Case Study of Mauritius‘, Journal of Managing
Service Quality, Vol. 14, No. 5, pp. 350–364.
Theodorakis, N.D. and Alexandris, K. (2008) ‗Can service quality predict spectators' behavioral
intentions in professional soccer?‘, Managing Leisure, 13(3-4), pp.162-178.
Thompson, K. and Schofield, P. (2007) ‗An Investigation of the Relationship between Public
Transport Performance and Destination Satisfaction‘, Journal of transport geography, 15(2),
pp.136-144.
Tsai, M., Chin, C. and Chen, C. (2010) ‗The Effect of Trust Belief and Salesperson‘s Expertise
on Consumer‘s Intention to Purchase: Applying the Theory of Reasoned Action‘, Journal of
Social Behavior and Personality, Vol. 38, No. 2, pp. 273-287.
Tsaur, S., Lin, C. and Wu, C. (2008) ‗Cultural Differences of Service Quality and Behavioral
Intentions in Tourist Hotels‘, Journal of Hospitality and Leisure Marketing, Vol. 13, No. 1.
Page 252
239
Tse, K.K. and Wilton, P.C. (1988) ‗Models of consumer satisfaction formation: An extension‘,
Journal of Marketing Research, Vol. 25, No. 2, pp. 204-14.
Tsitskari, E., Antoniadis, C.H. and Costa, G. (2014) ‗Investigating the Relationship among
Service Quality, Customer Satisfaction and Psychological Commitment in Cyprian Fitness
Centers‘, Journal of Physical Education and Sport, Vol. 4, No. 4, pp. 514-520.
Ueltschy, L.C., Laroche, M., Eggert, A. and Bindl, U. (2007) ‗Service quality and satisfaction:
An international comparison of professional services perceptions‘, The Journal of Services
Marketing, Vol. 21, No.6, pp. 410-423.
UNDP (2014) Ethiopia: Country Economic Brief, Analysis Issue No. 1, United Nations
Development Program, Ethiopia Country Office, February.
Vargo, S.L. and Lusch, R.F. (2004) ‗The Four Service Marketing Myths: Remnants of a Goods-
Based, Manufacturing Model‘, Journal of service research, 6(4), pp.324-335.
Veal, A.J. (2006) Research Methods for Leisure and Tourism: A practical guide, 3rd
ed., London:
Pitman.
Vida, I. and Readon, J. (2008) ‗Domestic Consumption: Rational, Affective or Normative
Choice‘, Journal of Consumer Marketing, Vol. 25, pp. 34-44.
Walliman, N. (2011) Your Research Project: Designing and Planning Your Work, 3rd
ed.,
London: Sage.
Wardhana, A., Rustandi, B. and Syahputra, K. (2014) ‗Analysis of the effects of Service Quality,
Customer Value, and Customers Satisfaction to Behavioral Intentions at Auto 2000 Car Service
Stationsin Indonesia‘, International Journal of Science and Research, Vol. 3, No. 11, pp. 2440-
2445.
Wen, C. (2012) ‗The Impact of Quality on Customer Behavioral Intentions Based on the
Consumer Decision Making Process as Applied in E-commerce‘, Ph.D. Thesis, University of
North Texas.
Wen, C., Qin, H., Prybutok, V.R. and Blankson, C. (2012) ‗The Role of National Culture on
Relationships Between Customers' Perception of Quality, Values, Satisfaction, and Behavioral
Intentions‘, The Quality Management Journal, Vol. 19, No. 4, pp. 7-23.
Page 253
240
Wilkinson, D. and Birmingham, P. (2003) Using Research Instruments: A Guide for
Researchers, London: TJ International Ltd.
William, J. P., Taylor W. and Jayawardena C. ( 2003) ‗People and Quality: the Case of Delta
Hotels‘, International Journal of Contemporary Hospitality Management, Vol. 15, No. 6, pp.
349-351.
Yamane, Taro (1967) Statistics: an Introductory Analysis, 2nd
ed., New York: Harper & Row.
Yuan, J. and Jang, S. (2008) ‗The effects of quality and satisfaction on awareness and behavioral
intentions: Exploring the role of a wine festival‘, Journal of Travel Research, Vol. 46, No. 3, pp.
279-288.
Yuksel, A. and Rimmington, M. (1998) ‗Customer Satisfaction Measurement‘, Cornell Hotel &
Restaurant Administration Quarterly, Vol. 39, No. 6, pp. 60-67.
Zabkar, V., Makovec, M., Brencic and Dmitrovic, T. (2010) ‗Modeling Perceived Quality,
Visitor Satisfaction and Behavioral Intentions at the Destination Level‘, Journal of Tourism
Management, Vol. 31, No. 4, pp. 537-546.
Zeithaml, V.A. (1988) ‗Consumer Perceptions of Price, Quality, and Value: A Means-End
Model and Synthesis of Evidence‘, Journal of Marketing, Vol. 52, No. 3, pp. 2-22.
Zeithaml, V.A. (2000) ‗Service quality, profitability, and the economic worth of customers:
What we know and what we need to learn‘, Journal of the Academy of Marketing Science, Vol.
28, pp. 67-85.
Zeithaml, V.A. and Bitner, M.J. (2001) Service Marketing: Integrating Customer Focus Across
Firms, 2nd
ed., New Delhi: Tata McGraw-Hill.
Zeithaml, V., Berry, L. and Parasuraman, A. (1996) ‗The Behavioral Consequences of Service
Quality‘, Journal of Marketing, Vol. 60, pp. 31- 46.
Zhang, Y. (2008) ‗Problems Existing in China's Hotel Service and Study on the Strategy from
the Aspect of Customer Value‘, Journal of Politics and Law, Vol. 1, No.2, pp.60-63.
Page 254
i
Annex-A: Questionnaire UNIVERSITY OF SOUTH AFRICA (UNISA)
SCHOOL OF BUSINESS LEADERSHIP (SBL)
QUESTIONNAIRE TO BE FILLED BY THE HOTEL GUESTS/CUSTOMERS
Dear Hotel Guest,
My name is Tewodros Mesfin. I am a Doctoral Student at the University of South Africa
(UNISA) and I am doing my dissertation under the supervision of Dr. Rakshit Negi. You are
requested to participate in the doctoral research in title: ―The Influence of Service Quality on
Customer Satisfaction, Customer Value and Behavioral Intentions in the Hotel Sector of
Ethiopia‖.
This questionnaire is designed to gather data from hotel guests regarding their service experience
in the hotel. The aim of this survey is to identify and measure the influence of service quality on
the satisfaction, value and behavioral intentions of hotel guests in Ethiopia and suggest viable
strategies for improved service quality in hotels.
Your response is highly valuable for the study and there are no identified risks from participation
in the survey. The survey is anonymous. Participation in the research is completely voluntarily. It
will take you approximately 7-10 minutes to complete filling this questionnaire.
Reports to the survey will only be communicated in aggregate form to protect the identity of the
respondents and participating hotels. The findings of the study will be published in academic
journals and presented in research conferences. If you wish to get the report on the findings of
the study you may contact me on the below email address.
In advance, I thank you for your kind cooperation and precious time. For any further information
the researcher may be reached on the following addresses:
Tewodros Mesfin
Cell: 0911633663
Email: [email protected]
Page 255
ii
Note: This questionnaire has two parts. Part one, collects data on personal information for group
demographic analysis and part two to collect data on the opinion of hotel guests regarding their
service experience, satisfaction value and behavioral intentions.
Part I: Personal Information
1. Purpose of visit:
A. Business
B. Leisure
C. Transit/layover
D. Personal
2. How many nights did you stay in this hotel?
A. One night
B. Two nights
C. More than two nights
3. How many times did you stay in this hotel :
A. First time
B. Second time
C. More than two times
4. Gender :
A. Male
B. Female
5. Age group:
A. 18-30
B. 31-45
C. 46-60
D. Above 60
6. Nationality: _______________
Part II. Service Quality, Customer value, Satisfaction & Behavioral Intentions
This part of the questionnaire has 36 questions in order to obtain your opinion on the hotel
service experience. The first 35 questions have 5 alternative choices (Strongly Agree, Agree,
Neutral, Disagree and Strongly Disagree) to respond with. Please put ―√‖ mark in the box that
best represents your opinion. For the last question you may select (tick-mark) more than one
choice.
Page 256
iii
S.N
.
Item Strongly
Agree
Agree Neutral Disagree Strongly
Disagree
1 The hotel provides reliable (timely)
airport transfer service
2 The hotel staff welcome guests that
creates a comfortable feeling
3 The hotel staff are always courteous
4 The hotel staff have good command of
English
5 The check-in and check-out services
are quick and easy at the hotel
6 The hotel provides services as being
promised (during reservation)
7 The hotel staff perform services
right/correctly at the first time
8 The hotel staff are willing to provide
prompt assistance to guests‘ requests
and problems
9 The hotel staff provide service to meet
guests‘ best interest (as per the
requirements)
10 The hotel staff provide service in a
caring fashion being friendly
11 The hotel staff provide undivided
attention to the guest
12 The hotel staff have neat appearance
13 I am quite satisfied with the service
received from the hotel‘s staff
14 The hotel‘s rooms are clean and
comfortable
15 The hotel‘s rooms have visible
(quality) amenities like TV, phone,
safe, refrigerator etc.
16 The hotel rooms are quiet
17 The bathrooms in the hotel are neat and
clean
18 The hotel rooms are equipped with
effective internet connectivity
19 The hotel maintains reasonable room
rates to offer high value for money to
its customers
20 I am quite satisfied with the appearance
of facilities in the hotel room(s)
21 The hotel‘s Bar(s) and Restaurant(s)
have good ambience
Page 257
iv
22 The complimentary breakfast at the
hotel is of good quality
23 The hotel‘s restaurant(s) offer good
quality food
24 The hotel restaurant delivers prompt
service to its customers
25 Pricing at the hotel‘s restaurant is
reasonable (dictates value for money to
customers)
26 Pricing at the hotel‘s bar is reasonable
(dictates value for money to customers)
27 The hotel provides modern recreation
facilities (e.g. Spa, Gym, etc.)
28 The hotel guarantees/ensures reliable
reservation services
29 The hotel billing and payment systems
are free from error
30 The hotel location is convenient (for
my purpose of visit)
31 The overall service quality of the hotel
is acceptable
32 Overall, the price I paid is reasonable
compared to the value of services being
received from the hotel
33 I am satisfied with the hotel‘s overall
service provisions
34 I will use this hotel services again
whenever I get the chance
35 I will recommend to others about the
hotel service
36 Please specify to which of the following you are most likely to tell about the hotel service
(you may tick more than one)
The hotel management / staff
Friends , family and colleagues
The parties who booked you in the hotel ( ex. Travel agents, booking sites,
airliners, your company, sponsors )
Post comments on websites ( ex. Tripadvisor.com, expedia.com etc)
---END---
Page 258
v
Annex-B: Summary of Reviewed Literature
Author Title Country Nature of the
paper
Number of
Items
assessed
Sample
Size
Findings
Asad &
Tim, 2010
Customer
perceptions of
service quality in
luxury hotels in
New Delhi- an
exploratory study
India Research
paper using
Modified
SERVQUAL
23 271 Service quality is affected by
Hotel ambience and staff
courtesy, F&B product and
service quality, Staff
presentation and knowledge,
reservation services, and overall
value for money in order of
importance
Jing &
Andrew,
2009
A conceptual
framework of
hotel experience
and customer-
based brand
equity: Some
research
questions and
implications
Hong
Kong
Conceptual
paper
- - Service performance should be
nurtured
Service performance demands
greater attention to create and
maintain hotel brand equity
because it relates to quality of
experience
WOM has also notable effect
on brand equity
Riadh,
2009a
Service quality,
emotional
satisfaction and
behavioral
intentions: A
study in the hotel
industry
Canada Research
paper
presenting a
conceptual
model
26 200 Service quality affects through
emotional satisfaction and
behavioral intentions directly or
indirectly.
Riadh,
2009b
A review of 20
years of
SERVQUAL
research
- Meta analysis - 30
Research
Papers
Despite criticisms the use of
different scores, reliability,
validity( convergent,
discriminant ,and predictive),
emphasis on process,
hierarchical construct ,
reflective scale, the
applicability of generic and
scale in different setting, the
SERVQUAL is useful
instrument for service quality
researches
Page 259
vi
Francois,
Jaramillo
and
Mulki,
2007
The validity of
the SERVQUAL
and SERVPERF
scales : A meta
analytic view of
17 years of
research across 5
continents
- Meta Analysis - 42
Research
papers
SERVQUAL and SERVPERF
are equally valid predictors of
overall service quality
Adapting SERVQUAL scale to
context improves its predictive
validity alike SERVPERF
Rayka ,
Anneke &
Ross,
2005
Impediments to
improvements in
service quality in
luxury hotels
Australia Research
paper through
semi
structured
interview
- 22 Budget constraints, Staff
attitude, Lack of mentoring and
High customer expectations
were found as major
impediments of service quality
Liana,
Rohit &
Chekitan,
2005
Service
innovation and
customer choices
in hospitality
industry
USA Research
paper using
Web based
survey
11 1000 Service innovation largely
affects customers choice of
economy hotels
Leisure travelers are greatly
influenced by innovative
amenities
Halil &
Kashif,
2005a
Perception of
service quality in
North Cyprus
hotels
Cyprus Research
paper using
SERVPERF
22 320 SERVPERF is sufficient to
measure service quality
Two dimensions tangibles and
intangibles affect service
quality
Halil &
Kashif,
2005b
Diagnosing the
zone of tolerance
for hotel sector
Cyprus Research
paper using
HOTELZOT
23 50 ―Intangibles‖ created great gap
in service quality
Fiju,
Frenie &
Sid, 2004
Evaluating
service quality in
UK hotel chain :
a case study
UK Case study - 6 hotels Management interaction with
guests, employee empowerment
and training, establishment of
standard service procedures,
and free communication on
compliments and complaints
are suggested important factors
to improve service quality.
Thanika,
2004
Exploring
international
tourists‘
perception of
hotel operation
by using
modified
SERVQUAL
approach- a case
of Mauritius
Mauritius Research
paper using
Modifies
SEVQUAL
39 410 ―Reliability‖ factor greatly
affects service quality
Page 260
vii
Barbara &
Pamela,
2004
Service failure
and recovery :
evidence from
the hotel industry
UK Research
paper using
survey
26 149 The impact of service failure on
customers satisfaction is
affected by; type of service
failure, magnitude of failure,
recovery strategy and
effectiveness of the strategy
Sanjay &
Gupta,
2004
Measuring
service quality :
SERVQUAL Vs.
SERPERF scales
- Conceptual
paper on
SERVQUAL
and
SERVPERF
- - SERVQUAL provides more
pragmatic diagnosis than
SERVPERF. Its diagnostic
power makes SERVQUAL
preferable for service quality
researches meant for
managerial intervention. When
perception equals expectation
SERVQUAL doesn‘t invite
managerial intervention where
as SERVPERF does
Micheal ,
2003
Does
organizational
climate add to
service quality
hotels?
USA Conceptual
model of
organizational
culture and
climate and
performance
- - Supportive organizational
culture and climate shapes
employee commitment and
work ethics which contributes
for service quality
William,
Taylor &
Jayaworde
na, 2003
People and
quality: the case
of Delta Hotels
Canada Case analysis
on successful
hotel
- - Customer focus, employee
empowerment, team work,
continuous improvement and
eliminating errors are major
contributors for the success of
Delta‘s service quality
Konstanti
nos, Nikos
& Dimitri,
2002
Can perceptions
of service quality
predict
behavioral
intentions? An
exploratory study
in the hotel sector
of Greece
Greece Research
paper
Five
dimensions
of
SERVQUA
L
205 ― Empathy‖ and ―Assurance‖
Dimensions were most
important to affect customers
purchase intension and WOM
Parasuram
an , 2002
Service Quality
and productivity :
a synergetic
perspective
Conceptual
framework
Two:
service
quality and
productivity
- Comments that there could be
synergy between service quality
and productivity if managers
keep balance of company‘s
perspective and customers‘
perspective of productivity as
opposed to solely producer‘s
perspective of productivity.
Page 261
viii
Marco,
2001
Measuring and
managing service
quality:
integrating
customer
expectations
Spain Research
paper
comparing the
effectiveness
of
SERVPERF
SERVQUAL
SERVPEX
26 1152 SERVPEX provides more
predictive value than
SERVQUAL in measuring
service quality. To reduce
service gap strategies are
suggested to manage customers
expectation including proper
positioning and mission
statements, communication
campaign, service guarantee,
pricing strategy and
consistently excellent service
delivery.
Juan &
Zornoza,
2000
Validity and
reliability in
perceived quality
measurement
models
Spain Research
paper
comparing
SERVPERF
and EP
models
- - Suggested that that SERVPERF
has greater reliability, greater
convergent and discriminate
validity, explains variance more
completely, and consequently
introduces less bias than EP
(evaluated performance) model.
Jay &
Dwi, 2000
Customer loyalty
in the hotel
industry : the role
of customer
satisfaction and
image
New
Zealand
Research
paper through
survey
29 items 106
guests
Customer satisfaction and hotel
image positively and directly
correlates with customer
loyalty. Housekeeping service
greatly affects customers‘
evaluation of service quality
and their satisfaction.
Nelson &
Hailin,
2000
Service quality in
China‘s hotel
Industry : a
perspective from
tourists and hotel
managers
China Research
paper using
Modified
SERVQUAL
35 270 Managers over estimate their
service delivery than tourist
perception of the same.
Delivery gap and internal
evaluation gap is major
contributor of service shortfalls.
Hokey &
Hyesung,
1997
Benchmarking
the quality of
hotel services:
managerial
perspectives.
South
Korea
Research
paper using
AHP
14 144 Hotel Ambience and employee
courtesy are major factors
affecting service quality.
Gavin &
Philip,
1997
Improving
service quality:
lessons and
practice from the
hotel sector
UK Paper
reviewing
recent practice
- - Employee empowerment
contributes for service quality.
Standard and scientific
approach shall be used to
measure service quality and
Customer satisfaction.
Page 262
ix
Olive &
Martin,
1996
SERVQUAL and
Northern Ireland
hotel service: a
Comparative
analysis –part I
Ireland Research
paper using
SERVQUAL
and
Management
interview
22 10 TQM Program has positive
impact on raising service
quality.
Francis,
1995
SERVQUAL:
review, critique,
research agenda
- Critical review
on
SERVQUAL
literatures
- - Discussed criticisms on
SERVQUAL including: failure
of SERVQUAL to draw on
established theories ; lack of
universal applicability of the 5
dimensions; focus on process
not on outcome; impracticality
of P-E gaps, dynamism of
customers expectation ; limited
number of items to capture
service quality dimensions;
double administration of
instrument creating respondents
boredom and confusion; impact
of moment of truth on
customers‘ evaluation of
service quality ignored; and
concludes that the instrument
lacks face and construct
validity.
Perran,
1995
Dimensions of
service quality in
Istanbul
Turkey Research
paper
Modified
SERVQUAL
- 228 Major factors affecting service
quality were found to be
courtesy and staff competence,
communication and transaction
, tangibles, customer
understanding, accuracy and
speedy service, solution to
problems and accuracy in hotel
reservation.
Zeithaml
& Bitner,
2001
The nature of
determinants of
customer
expectations of
service
- Theoretical
model
- - A theoretical model discusses a
gap between desired service
and adequate service( within
expected service) as zone of
tolerance and presents 17
propositions about service
expectations.
Page 263
x
Shahin &
Reza,
2010
Correlation
Analysis of
Service Quality
Gaps in a Four-
Star Hotel
in Iran
Iran Correlation
analysis using
SERVQUAL
29 items &
12
dimensions
38 Almost all of the service quality
gaps are positive and ―price‖ as
a service quality dimension has
the highest positive value.
Communication also has the
highest correlation with other
service quality dimensions.
Jani &
Han, 2011
Investigating the
key factors
affecting
behavioral
intentions
Evidence from a
full-service
restaurant setting
USA Research
paper using
structural
equation
modeling
24 items &
7
dimensions
- Affect is noted to be a major
contributor to both customer
satisfaction and behavioral
intentions. Customer
satisfaction is a direct
antecedent to trust but indirect
to commitment.
Malik,
2012
Customer
Satisfaction,
Perceived Service
Quality
and Mediating
Role of Perceived
Value
Pakistan Research
paper using
quantitative
approach
42 items - Results suggested that
perceived value is an important
factor in customers‘ evaluation
of satisfaction.
Edward &
Sahadev,
2011
Role of switching
costs in the
service quality,
perceived value,
customer
satisfaction and
customer
retention linkage
India Research
paper using
conceptual
model and
survey
16 items &
5
dimensions
220 The findings suggest that
service firms may benefit from
pursuing a combined strategy of
increasing customer satisfaction
and switching costs both
independently and in tandem,
depending upon the product-
market characteristics.
Sutanto,
2009
Dimension of
quality of service
influence ,
customer
satisfaction in
the hotel
Indonesia Case study on
the
examination
of transaction
model in
service
industry
- 130 Customer satisfaction was
influenced most by dimension
quality of service (e.g. technical
or outcome dimension,
functional or process related
dimension, corporate image)
Daniel &
Berinyuy,
2010
Using the
SERVQUAL
Model to assess
Service Quality
and Customer
Satisfaction
USA Empirical
study using
SERVQUAL
- - the SERVQUAL model was not
a good instrument to measure
service quality because some of
the items under the dimensions
overlapped and regrouped
under different dimensions
from the factor analysis carried
out
Page 264
xi
Annex-C: Identified Literature Gaps in the Study Context
Author Variables Relationship Mediating
variable
Context Remark Gap
Simon, 2012 Quality,
Satisfaction,
Behavioral
intentions
Service quality
affects Behavioral
intentions through
Customer
satisfaction.
Customer
satisfaction
Telecom
(Ghana)
New Service
quality
dimensions are
proposed:
Customer
relations,
reputational
image quality,
real network in
addition to
tangibles
Dimensions
of behavioral
intentions not
specified;
Customer
value not
captured
Basheer,
2012
Quality,
Satisfaction,
Behavioral
intentions
Service quality
affects satisfaction
and behavioral
intentions.
None Spa
(Malaysia)
Tangible and
empathy
dimension has
strong impact
but assurance no
impact on
service quality
Only revisit
is considered
as behavioral
intentions
dimension
Customer
value not
captured
Jani & Han,
2011
Service
encounter
performance
(SEP),
Perceived
price, Affect,
Satisfaction,
Trust,
Commitment,
Behavioral
intentions
Affect is noted to
be a major
contributor to both
customer
satisfaction and
behavioral
intentions.
Customer
satisfaction is a
direct antecedent to
trust but indirect to
commitment.
Service encounter
performance has
direct impact on
customer
Satisfaction.
Affect,
perceived
price
moderate
between SEP
and
Satisfaction;
Trust &
commitment
moderate
between
Satisfaction
and
Behavioral
Intentions
Restaurant
(S. Korea)
Trust &
commitment
captured as
moderating
variables
between
Customer
Satisfaction
&Behavioral
Intentions
Dimensions
of behavioral
intentions
specified
differently
Lertwannawit
& Gulid,
2011
Service
quality, Value
, Satisfaction,
Brand trust,
Behavioral
loyalty
Service quality
directly affects
Satisfaction, Value
and Brand trust
which in turn affect
Behavioral Loyalty
Value,
Satisfaction,
Brand Trust
Medical
tourism
(Thailand)
Nationality had
no impact on the
constructs
The Five
SERVQUAL
dimensions
captured
Page 265
xii
Kuruuzum &
Koskal, 2010
Service
quality,
Behavioral
intentions
Service Quality
affects Behavioral
intentions (strong
impact on pay more
and loyalty
dimensions)
None Hotel
(Turkey)
Five
SEVQUAL and
five Behavioral
intentions
dimensions
captured
Customer
satisfaction
and customer
value not
captured
Naik,
Gantasala &
Prabhakar,
2010
Service
quality,
Satisfaction,
Behavioral
intentions
Service quality
both directly and
indirectly (through
satisfaction) affects
behavioral
intentions
Satisfaction Retail
(India)
Identified 3
service quality
dimensions:
tangible,
responsiveness
and recovery &
knowledge (not
in SERVQUAL)
Behavioral
intentions
dimensions
not well
specified;
customer
value not
captured
Ravichandran
, Bhargavi &
Kumar, 2010
Service
quality,
Behavioral
intentions
Service quality
affects Behavioral
intentions
None Bank
(India)
Tangible,
empathy,
responsiveness
dimensions have
strong impact on
behavioral
intentions
Satisfaction
and value not
captured,
dimensions
of behavioral
intentions are
not
exhaustively
captured
Gounaris,
Dimitriadis &
Stathakopoul
os (2010
Service
quality, e-
satisfaction,
Behavioral
intentions
Service quality
affects behavioral
intentions through
e- satisfaction
e-
satisfaction
E-
commerce
(Greece)
Three
behavioral
intentions
dimensions
(WOM, Revisit
& Repurchase )
captured and
Four e- service
quality driver
identified
Customer
value not
captured
Kasim &
Abdullah,
2010
Service
Quality,
Customer
satisfaction,
Trust and
Loyalty
Service quality has
direct impact on
customer
satisfaction; and
customer
satisfaction affects
trust; satisfaction
and trust influence
WOM which
affects loyalty
Trust and
WOM
E-shopping
(Malaysia
& Qatar)
The two cultures
happened to be
similar having
no significant
difference on
findings
Customer
value is not
captured
Page 266
xiii
Žabkar et al.,
2010
Perceived
quality,
Satisfaction,
Behavioral
intentions
Service quality
influences both
customer
satisfaction and
behavioral
intentions
Satisfaction Tourist
destination
(Slovenia)
Destination
attribute
considered to be
service quality
dimension
Dimensions
of behavioral
intentions not
fully
captured;
Value not
captured
Salazar,
Costa & Rita,
2010
Service
quality,
Behavioral
intentions
Service quality
affects behavioral
intentions (strong
effect on
recommend and
moderate effect on
revisit dimensions)
None Hotel
(Portugal)
Among the five
service quality
dimensions
tangible
influenced more
customers‘
evaluation;
behavioral
intentions
dimensions
captured
Customer
satisfaction
and customer
value not
captured;
Micheal et
al., 2009
Service
quality, Value,
Image,
Satisfaction,
Behavioral
intentions
Service quality
affects customer
satisfaction through
Value ; Service
quality affects
behavioral
intentions through
image and
customer
satisfaction
Value,
Satisfaction
and Image
Hotel
(Tiawan)
3 primary and
12 sub-
dimensions of
service quality
identified;
Nature of travel
and occupation
affect perceived
value
Behavioral
intentions
dimensions
not
exhaustively
captured
Hutchinson &
Wang, 2008
Quality,
Value,
Satisfaction,
Equity ,
Behavioral
intentions
Service quality
does not directly
influence value ,
satisfaction or
behavioral
intentions but it
affects Equity;
Equity affects
Value and
Satisfaction which
impacts Behavioral
intentions
Equity Golf travel
(USA)
Divergent
outcome on the
relationship of
the constructs
found; Revisit
and WOM
dimensions of
behavioral
intentions were
strongly affected
by satisfaction
and value
Tsaur & Wu,
2008
Culture,
Service quality,
Behavioral
intentions
Culture affects
perceived service
quality; behavioral
intentions dimensions
of pay more, loyalty
and external response
were affected by
culture, whereas
internal response and
switch were not
affected
None Hotels From
different
countries
The impact of
cultural difference
on service quality
and behavioral
intentions were
emphasized ; five
dimensions of
behavioral
intentions
captured
Customer
satisfaction
and customer
value not
captured
Page 267
xiv
Chen, 2008 Perceived
performance
(service ),
perceived
value,
satisfaction,
behavioral
intentions
There chain of
impact i.e.,
Perceived
Performance-
Perceived Value-
Satisfaction-
Behavioral
intentions,
respectively
affecting the next
construct; Both
perceived value and
satisfaction affect
behavioral
intentions (the
effect of value is
stronger)
Satisfaction
and
Perceived
Value
Transport
(Taiwan)
Comparison of
effects between
value and
satisfaction
constructs was
made
Behavioral
intentions
dimensions
not
exhaustively
captured
Maria,
Lorenzo &
Antonio,
2007
Service
quality,
Customer
satisfaction,
Behavioral
intentions
Service quality and
customer
satisfaction affect
Behavioral
intentions
None Spa
(Spain)
Simultaneous
influence of
service quality
and customer
satisfaction was
observed
Behavioral
intentions
dimensions
not
exhaustively
captured
Gallazar &
Saura, 2006
Value,
Satisfaction,
Loyalty
Value affects
Satisfaction which
influences loyalty
Satisfaction Travel
(Spain)
Service quality
was captured as
one of eight
items affecting
value
Behavioral
intentions
dimensions
not
exhaustively
captured
Konstantinos,
Nikos &
Dimitri, 2002
Service
quality
behavioral
intentions
Service quality
affects Behavioral
intentions
None Hotel
(Greece)
Service quality
dimensions
explained a very
high proportion
of variance in
WOM
communications
and purchase
intentions
Behavioral
intentions
dimensions
not
exhaustively
captured
Cronin,
Bradly &
Hult, 2000
Quality,
Value,
Customer
Satisfaction,
Behavioral
Intentions
Service quality
affects satisfaction
and value which
influence
Behavioral
intentions
Satisfaction
and Value
6 industries Sacrifice was
measured as
variable
affecting service
value
Behavioral
intentions
dimensions
not
exhaustively
captured
Page 268
xv
Oh, 1999 Perceived
service
quality,
perceived
customer
value,
customer
satisfaction,
Behavioral
intentions
Perceived Service
quality affects
perceived customer
value and
satisfaction which
affect behavioral
intentions
(repurchase
intentions and
WOM)
Perception,
Customer
satisfaction
and
Customer
value
Hotel
(USA)
The influence of
perception on
the constructs
was emphasized
Used single-
item overall
measures for
most
variables;
Service
quality
dimensions
not captured;
few
behavioral
intentions
dimensions
captured
Page 269
xvi
Annex-D: Focus Group Discussion Guideline
Introduction
Thank you for your willingness to participate in this focus group discussion
The aim of this session is to gather info. on major issue related to service quality,
customer satisfaction, value and behavioral intentions of hotel customers in Ethiopia
This focus group discussion is conducted as part of exploratory data gathering for a
Doctoral thesis under the topic ― The influence of Service quality on the customer
satisfaction, value and behavioral intentions in the hotel sector of Ethiopia‖
Your contributions are highly valuable to identify those service quality and behavioral
intentions variables pertinent and unique to Ethiopian hotel
Please be assured that your contributions are anonymous and you will be communicated
about the findings of the research in future
General Guideline
A focus group will have 5-7 members
The sessions will be recorded
Group members shall be from same category / hotel managers, experts, clients/
Each session shall take 30-45 minutes
There shall be free discussion no one shall be interrupting, disagreeing, disregarding
others‘ idea
Only open guides will be there to make the group contribute more
Finally the ideas shall be summarized and presented to make sure no idea is missed
The group will be given a list of service quality and behavioral intentions issues to
prioritize
Discussion topics
1. In your opinion what are the variables related to service quality/ What constitutes quality
hotel services
2. If you have to prioritize which one do you think are the most important to customers
3. How do you think service quality can be related to customers‘ behavioral intentions
Page 270
xvii
4. What are the most common customers‘ behavioral intentions you have observed
5. Which behavioral intentions you prefer most as a hotel manager
6. What must be the focus of the hotel to improve service quality
7. Can you mention the typical behavioral intentions of satisfied customers
8. Please refer the table and prioritize service quality , and behavioral intentions items
Please rank the below items/ issues/ related to service quality and customers‘ behavioral
intentions based on their importance, commonness and preference by the hotel.
Rank
Most
Important
Service quality items Remark ( you may comment the
item is relevant or not )
Warm welcome at front desk
Staff courtesy
Staff professional service
Check in check out promptness
Keeping service promises
Staff delivering service right the first time Staff readiness/ willingness to help guests
The hotel staff provide service to meet guests best
interest
Staff friendliness
The hotel staff provide undivided attention to the guest
The hotel staff having neat appearance
Guest room cleanness and comfort
Guest room amenities / TV, phone, safe, iron,
refrigerator etc/
Guest rooms quietness
Bath rooms cleanliness and comfort
Sleep quality
Prompt room service
Bar/s and Restaurant/s ambience
Quality of food
Restaurant service
Breakfast quality & variety
Hotel modern facilities ( recreation, compound,
business center etc )
Hotel guarantees reliable service
Hotel billing and payment systems are error free
Page 271
xviii
Other
Other Most
Common Behavioral intention items Most preferable
Do nothing
Revisiting the hotel
Recommending the hotel family, friends
Willingness to pay price premium/ higher rates/
Posting comments on websites / triadvisor.com,
expedia.com/
Reporting to the corporate client ( booker, sponsor)
Reporting to the hotel management
Other
Page 272
xix
Annex-E: Kurtosis and Skewness values of the scale items
Item Mean
Std.
Deviation
Skewness Kurtosis
The hotel staff welcome guests that creates a comfortable
feeling
4.48 .623 0.999 1.42
The hotel staff are always courteous 4.27 .718 0.487 0.807
The hotel staff have good command of English 3.88 .883 0.465 0.367
The check-in and check-out services are quick and easy at
the hotel
4.25 .727 0.785 0.679
The hotel provides services as being promised (during
reservation)
4.16 .822 0.735 0.071
The hotel staff perform services right/correctly at the first
time
4.14 .789 0.734 0.363
The hotel staff are willing to provide prompt assistance to
guests‘ requests and problems
4.24 .796 1.006 1.199
The hotel staff provide service to meet guests‘ best interest
(as per the requirements)
4.13 .806 0.723 0.355
The hotel staff provide service in a caring fashion being
friendly
4.24 .788 0.994 1.085
The hotel staff provide undivided attention to the guest 4.04 .869 0.771 0.466
The hotel staff have neat appearance 4.19 .780 0.777 0.581
I am quite satisfied with the service received from the
hotel‘s staff
4.26 .723 0.690 0.083
The hotel‘s rooms are clean and comfortable 4.17 .841 0.947 0.802
The hotel‘s rooms have visible (quality) amenities like TV,
phone, safe, refrigerator etc.
4.00 .964 0.818 0.112
The hotel rooms are quiet 4.05 .966 0.580 0.586
The bathrooms in the hotel are neat and clean 4.16 .918 0.638 0.102
The hotel rooms are equipped with effective internet
connectivity
3.52 1.207 0.692 0.666
The hotel maintains reasonable room rates to offer high
value for money to its customers
3.90 .900 0.704 0.800
I am quite satisfied with the appearance of facilities in the
hotel rooms
4.03 .766 0.769 0.387
The hotel‘s bar(s) and restaurant(s) have good ambience 4.06 .785 1.063 0.929
The complimentary breakfast at the hotel is of good quality 3.91 .952 1.246 1.651
The hotel‘s restaurant(s) offer good quality food 4.03 .857 0.751 0.610
The hotel restaurant delivers prompt service to its customers 4.02 .765 0.528 0.236
Pricing at the hotel‘s restaurant is reasonable and dictates
value for money to customers
3.90 .887 0.577 0.023
Page 273
xx
Pricing at the hotel‘s bar is reasonable and dictates value
for money to customers
3.80 .906 0.449 0.104
The hotel guarantees/ensures reliable reservation services 4.03 .829 0.625 0.269
The hotel billing and payment systems are free from error 4.07 .876 0.915 0.934
The overall service quality of the hotel is acceptable 4.15 .541 0.070 0.549
Overall, the price I paid is reasonable compared to the value
of services being received from the hotel
4.03 .834 0.732 0.288
I am satisfied with the hotel‘s overall service provisions 4.15 .761 0.920 1.549
I will use this hotel services again whenever I get the
chance
4.23 .769 0.781 0.522
I will comment to others about the hotel service 4.13 .811 0.816 0.747
Source: Survey data, 2014
Page 274
xxi
Annex-F: t-test Tables
1. Differences by Respondents’ Gender (Male vs. Female)
Independent Samples Test
Levene's Test
for Equality of
Variances
t-test for Equality of Means
F Sig. t Df Sig.
(2-
tailed)
Mean
Difference
Std. Error
Difference
95% Confidence
Interval of the
Difference
Lower Upper
Assurance
Equal variances
assumed .386 .535 -1.189 433 .235 -.07320 .06154 -.19415 .04775
Equal variances
not assumed
-1.220 235.793 .224 -.07320 .06001 -.19141 .04502
Reliability
Equal variances
assumed .297 .586 .791 433 .429 .05034 .06361 -.07468 .17537
Equal variances
not assumed
.779 216.455 .437 .05034 .06462 -.07703 .17772
Responsiveness
Equal variances
assumed .026 .871 -1.270 433 .205 -.07750 .06102 -.19742 .04243
Equal variances
not assumed
-1.305 236.883 .193 -.07750 .05937 -.19446 .03947
Empathy
Equal variances
assumed .275 .600 -2.677 433 .008 -.19038 .07111 -.33015
-
.05061
Equal variances
not assumed
-2.824 251.017 .005 -.19038 .06742 -.32315
-
.05760
Room Tangibles
Equal variances
assumed .697 .404 -1.934 433 .054 -.13219 .06835 -.26653 .00214
Equal variances
not assumed
-2.015 244.057 .045 -.13219 .06561 -.26143
-
.00296
Food Tangibles
Equal variances
assumed .109 .741 -1.825 433 .069 -.15748 .08630 -.32710 .01213
Equal variances
not assumed
-1.900 243.885 .059 -.15748 .08287 -.32071 .00575
Overall Service Quality
Equal variances
assumed 3.892 .049 -2.296 433 .022 -.13172 .05738 -.24449
-
.01895
Equal variances
not assumed
-2.311 226.550 .022 -.13172 .05701 -.24406
-
.01939
Page 275
xxii
Perceived value
Equal variances
assumed .002 .968 -.367 433 .713 -.02779 .07564 -.17645 .12087
Equal variances
not assumed
-.375 233.157 .708 -.02779 .07414 -.17386 .11828
Satisfaction
Equal variances
assumed .022 .883 -.437 433 .662 -.02744 .06274 -.15075 .09587
Equal variances
not assumed
-.440 226.712 .660 -.02744 .06231 -.15023 .09535
Behavioral Intentions
Equal variances
assumed 2.224 .137 -.366 433 .714 -.02771 .07562 -.17634 .12092
Equal variances
not assumed
-.356 211.322 .722 -.02771 .07776 -.18100 .12557
(Source: Survey data, 2014)
Page 276
xxiii
2. Differences by Respondents’ Nationality (Ethiopian vs. Foreigners)
Independent Samples Test
Levene's Test
for Equality of
Variances
t-test for Equality of Means
F Sig. t df Sig.
(2-
tailed)
Mean
Difference
Std. Error
Difference
95% Confidence
Interval of the
Difference
Lower Upper
Assurance
Equal variances
assumed .731 .393 -4.658 433 .000 -.27385 .05879 -.38940 -.15829
Equal variances
not assumed
-4.553 239.593 .000 -.27385 .06014 -.39233 -.15537
Reliability
Equal variances
assumed .149 .700 -.340 433 .734 -.02115 .06222 -.14343 .10113
Equal variances
not assumed
-.335 243.769 .738 -.02115 .06316 -.14556 .10326
Responsiveness
Equal variances
assumed .501 .479 -2.345 433 .019 -.13924 .05938 -.25594 -.02254
Equal variances
not assumed
-2.258 231.789 .025 -.13924 .06165 -.26071 -.01777
Empathy
Equal variances
assumed 2.901 .089 -2.476 433 .014 -.17230 .06959 -.30908 -.03552
Equal variances
not assumed
-2.297 214.187 .023 -.17230 .07501 -.32015 -.02445
Room Tangibles
Equal variances
assumed 6.333 .012 -1.157 433 .248 -.07748 .06699 -.20915 .05419
Equal variances
not assumed
-1.074 214.613 .284 -.07748 .07214 -.21966 .06471
Food Tangibles
Equal variances
assumed 4.311 .038 -.490 433 .624 -.04149 .08465 -.20787 .12489
Equal variances
not assumed
-.467 226.944 .641 -.04149 .08876 -.21638 .13340
Overall Service
Quality
Equal variances
assumed .400 .528 -1.709 433 .088 -.09610 .05623 -.20663 .01443
Equal variances
not assumed
-1.667 238.291 .097 -.09610 .05767 -.20970 .01750
Page 277
xxiv
Perceived value
Equal variances
assumed 5.455 .020 -2.227 433 .026 -.16372 .07352 -.30823 -.01921
Equal variances
not assumed
-2.112 224.168 .036 -.16372 .07753 -.31651 -.01093
Satisfaction
Equal variances
assumed 2.068 .151 -1.468 433 .143 -.08984 .06119 -.21010 .03042
Equal variances
not assumed
-1.394 224.750 .165 -.08984 .06444 -.21684 .03715
Behavioral
Intentions
Equal variances
assumed 1.811 .179 -2.187 433 .029 -.16081 .07352 -.30531 -.01630
Equal variances
not assumed
-2.068 222.671 .040 -.16081 .07778 -.31408 -.00753
(Source: Survey data, 2014)
Page 278
xxv
3. Differences by Hotel Locations (Addis Ababa vs. Regional Cities)
Independent Samples Test
Levene's Test
for Equality of
Variances
t-test for Equality of Means
F Sig. t df Sig.
(2-
tailed)
Mean
Difference
Std. Error
Difference
95% Confidence
Interval of the
Difference
Lower Upper
Assurance
Equal variances
assumed .057 .811 4.499 433 .000 .29657 .06592 .16701 .42614
Equal variances
not assumed
4.448 145.997 .000 .29657 .06667 .16481 .42834
Reliability
Equal variances
assumed 2.729 .099 1.516 433 .130 .10528 .06947 -.03126 .24182
Equal variances
not assumed
1.573 156.457 .118 .10528 .06692 -.02689 .23746
Responsiveness
Equal variances
assumed .271 .603 1.748 433 .081 .11651 .06665 -.01449 .24751
Equal variances
not assumed
1.719 144.952 .088 .11651 .06778 -.01744 .25047
Empathy
Equal variances
assumed 1.279 .259 2.068 433 .039 .16140 .07807 .00797 .31484
Equal variances
not assumed
2.115 153.080 .036 .16140 .07632 .01063 .31218
Room Tangibles
Equal variances
assumed .000 .997 2.132 433 .034 .15929 .07472 .01244 .30614
Equal variances
not assumed
2.141 149.133 .034 .15929 .07440 .01228 .30630
Food Tangibles
Equal variances
assumed 1.969 .161 -.157 433 .876 -.01483 .09478 -.20113 .17146
Equal variances
not assumed
-.149 139.188 .882 -.01483 .09950 -.21156 .18189
Overall Service
Quality
Equal variances
assumed 19.339 .000 3.050 433 .002 .19062 .06249 .06779 .31344
Equal variances
not assumed
3.171 156.799 .002 .19062 .06011 .07189 .30934
Page 279
xxvi
Perceived value
Equal variances
assumed 1.551 .214 .287 433 .775 .02373 .08277 -.13895 .18640
Equal variances
not assumed
.266 134.967 .791 .02373 .08915 -.15259 .20004
Satisfaction
Equal variances
assumed 1.132 .288 1.826 433 .069 .12487 .06840 -.00957 .25931
Equal variances
not assumed
1.832 148.931 .069 .12487 .06818 -.00985 .25959
Behavioral
Intentions
Equal variances
assumed .385 .535 1.373 433 .170 .11339 .08258 -.04891 .27569
Equal variances
not assumed
1.376 148.652 .171 .11339 .08242 -.04947 .27625
(Source: Survey data, 2014)
Page 280
xxvii
Annex-G: ANOVA Tables
1. By Respondents’ Purpose of Visit
ANOVA
Sum of Squares df Mean Square F Sig.
Assurance
Between Groups 1.099 3 .366 1.096 .350
Within Groups 144.031 431 .334
Total 145.130 434
Reliability
Between Groups 1.631 3 .544 1.530 .206
Within Groups 153.169 431 .355
Total 154.799 434
Responsiveness
Between Groups .449 3 .150 .453 .715
Within Groups 142.298 431 .330
Total 142.747 434
Empathy
Between Groups .967 3 .322 .711 .546
Within Groups 195.404 431 .453
Total 196.371 434
Room Tangibles
Between Groups .949 3 .316 .761 .516
Within Groups 179.037 431 .415
Total 179.986 434
Food Tangibles
Between Groups 7.921 3 2.640 4.083 .007
Within Groups 278.748 431 .647
Total 286.669 434
Overall Service Quality
Between Groups .542 3 .181 .614 .606
Within Groups 126.745 431 .294
Total 127.287 434
Perceived value
Between Groups 4.841 3 1.614 3.253 .022
Within Groups 213.764 431 .496
Total 218.604 434
Satisfaction
Between Groups .852 3 .284 .818 .484
Within Groups 149.576 431 .347
Total 150.428 434
Behavioral Intentions
Between Groups 1.276 3 .425 .844 .470
Within Groups 217.238 431 .504
Total 218.514 434
(Source: Survey data, 2014)
Page 281
xxviii
2. By Respondents’ Night Stay
ANOVA
Sum of Squares df Mean Square F Sig.
Assurance
Between Groups .958 2 .479 1.435 .239
Within Groups 144.172 432 .334
Total 145.130 434
Reliability
Between Groups 2.536 2 1.268 3.598 .028
Within Groups 152.263 432 .352
Total 154.799 434
Responsiveness
Between Groups .969 2 .485 1.477 .230
Within Groups 141.778 432 .328
Total 142.747 434
Empathy
Between Groups 2.333 2 1.167 2.597 .076
Within Groups 194.038 432 .449
Total 196.371 434
Room Tangibles
Between Groups .346 2 .173 .416 .660
Within Groups 179.640 432 .416
Total 179.986 434
Food Tangibles
Between Groups .104 2 .052 .078 .925
Within Groups 286.565 432 .663
Total 286.669 434
Overall Service Quality
Between Groups 2.026 2 1.013 3.494 .031
Within Groups 125.261 432 .290
Total 127.287 434
Perceived value
Between Groups 4.501 2 2.251 4.541 .011
Within Groups 214.103 432 .496
Total 218.604 434
Satisfaction
Between Groups 3.208 2 1.604 4.706 .010
Within Groups 147.220 432 .341
Total 150.428 434
Behavioral Intentions
Between Groups 1.853 2 .927 1.848 .159
Within Groups 216.660 432 .502
Total 218.514 434
(Source: Survey data, 2014)
Page 282
xxix
3. By Respondents’ Number of Visits
ANOVA
Sum of Squares df Mean Square F Sig.
Assurance
Between Groups .265 2 .133 .395 .674
Within Groups 144.865 432 .335
Total 145.130 434
Reliability
Between Groups 4.577 2 2.289 6.581 .002
Within Groups 150.222 432 .348
Total 154.799 434
Responsiveness
Between Groups .678 2 .339 1.030 .358
Within Groups 142.069 432 .329
Total 142.747 434
Empathy
Between Groups .303 2 .152 .334 .716
Within Groups 196.068 432 .454
Total 196.371 434
Room Tangibles
Between Groups .120 2 .060 .144 .866
Within Groups 179.866 432 .416
Total 179.986 434
Food Tangibles
Between Groups 2.133 2 1.066 1.619 .199
Within Groups 284.536 432 .659
Total 286.669 434
Overall Service Quality
Between Groups .346 2 .173 .588 .556
Within Groups 126.942 432 .294
Total 127.287 434
Perceived value
Between Groups .856 2 .428 .849 .429
Within Groups 217.748 432 .504
Total 218.604 434
Satisfaction
Between Groups .444 2 .222 .640 .528
Within Groups 149.984 432 .347
Total 150.428 434
Behavioral Intentions
Between Groups 5.132 2 2.566 5.195 .006
Within Groups 213.382 432 .494
Total 218.514 434
(Source: Survey data, 2014)
Page 283
xxx
4. By Respondents’ Age Category
ANOVA
Sum of Squares df Mean Square F Sig.
Assurance
Between Groups 1.102 3 .367 1.099 .349
Within Groups 144.028 431 .334
Total 145.130 434
Reliability
Between Groups .255 3 .085 .237 .871
Within Groups 154.545 431 .359
Total 154.799 434
Responsiveness
Between Groups .194 3 .065 .195 .900
Within Groups 142.553 431 .331
Total 142.747 434
Empathy
Between Groups .928 3 .309 .682 .563
Within Groups 195.443 431 .453
Total 196.371 434
Room Tangibles
Between Groups .247 3 .082 .197 .898
Within Groups 179.739 431 .417
Total 179.986 434
Food Tangibles
Between Groups 4.130 3 1.377 2.100 .100
Within Groups 282.539 431 .656
Total 286.669 434
Overall Service Quality
Between Groups .943 3 .314 1.072 .361
Within Groups 126.345 431 .293
Total 127.287 434
Perceived value
Between Groups .904 3 .301 .597 .618
Within Groups 217.700 431 .505
Total 218.604 434
Satisfaction
Between Groups .857 3 .286 .823 .482
Within Groups 149.571 431 .347
Total 150.428 434
Behavioral Intentions
Between Groups .351 3 .117 .231 .875
Within Groups 218.162 431 .506
Total 218.514 434
(Source: Survey data, 2014)
Page 284
xxxi
5. By Hotel Star Category
ANOVA
Sum of Squares df Mean Square F Sig.
Assurance
Between Groups 8.385 2 4.193 13.245 .000
Within Groups 136.745 432 .317
Total 145.130 434
Reliability
Between Groups 5.855 2 2.928 8.492 .000
Within Groups 148.944 432 .345
Total 154.799 434
Responsiveness
Between Groups 3.649 2 1.825 5.667 .004
Within Groups 139.098 432 .322
Total 142.747 434
Empathy
Between Groups 7.975 2 3.988 9.144 .000
Within Groups 188.396 432 .436
Total 196.371 434
Room Tangibles
Between Groups 2.558 2 1.279 3.114 .045
Within Groups 177.428 432 .411
Total 179.986 434
Food Tangibles
Between Groups 1.545 2 .772 1.170 .311
Within Groups 285.124 432 .660
Total 286.669 434
Overall Service Quality
Between Groups 3.568 2 1.784 6.230 .002
Within Groups 123.719 432 .286
Total 127.287 434
Perceived value
Between Groups .992 2 .496 .985 .374
Within Groups 217.612 432 .504
Total 218.604 434
Satisfaction
Between Groups 2.437 2 1.218 3.557 .029
Within Groups 147.991 432 .343
Total 150.428 434
Behavioral Intentions
Between Groups 4.187 2 2.093 4.219 .015
Within Groups 214.327 432 .496
Total 218.514 434
(Source: Survey data, 2014)