Page 1
Master thesis in Infection Biology and Epidemiology
The influence of sewage cleaning plants and rainfall on
the microbiological surface water quality
and
the backflow into groundwater
by Pascal Scheidegger
2007
Swiss Tropical Institute, Basel
Cantonal Laboratory Basel-Landschaft
Bureau for Environment and Energy, Basel-Landschaft
Supervision
Prof. Dr. phil. II Marcel Tanner (Director of the Swiss Tropical Institute)
&
Dr. phil. II Paul Svoboda (Department Head of the Division Microbiology, Cantonal Laboratory
Basel-Landschaft)
&
Dr. phil. II Adrian Auckenthaler (Bureau for Environment and Energy, Basel-Landschaft)
Page 2
Table of contents__________________________________________________________________ 1
Table of contents
ACKNOWLEDGEMENTS ............................................................................................................................................3
ABBREVIATIONS .........................................................................................................................................................4
SUMMARY .....................................................................................................................................................................5
1. INTRODUCTION .......................................................................................................................................................7
1.1 BACTERIOLOGY ....................................................................................................................... 7
1.1.1 ENTEROBACTERIACEAE.......................................................................................................... 7
1.1.2 CAMPYLOBACTER................................................................................................................. 18
1.1.3 PSEUDOMONAS..................................................................................................................... 21
1.2. VIROLOGY ............................................................................................................................. 23
1.2.1 NOROVIRUS.......................................................................................................................... 23
1.2.2 ROTAVIRUS .......................................................................................................................... 24
1.3 PROTOZOOLOGY .................................................................................................................... 25
1.3.1 GARDIA LAMBLIA ................................................................................................................. 26
1.3.2 CRYPTOSPORIDIUM PARVUM................................................................................................ 27
1.4 M ICRO-ORGANISMS IN WATER : INITIAL POSITION ............................................................... 28
PART A: SURFACE WATER ........................................................................................................... 29
DRAINAGE OF SETTLEMENT AREAS................................................................................................ 30
SCP OPERATING MODE.................................................................................................................. 31
PART B: GROUNDWATER AND DRINKING WATER ....................................................................... 32
RAW WATER AND RAW WATER PROCESSING.................................................................................. 33
DRINKING WATER.......................................................................................................................... 34
WATER SUPPLY IN SWITZERLAND ................................................................................................. 35
PROBLEMS OF WATER SUPPLY....................................................................................................... 35
PROBLEMS WITH CONTROL SYSTEMS............................................................................................. 36
1.5 SIGNIFICANCE , AIMS , OBJECTIVES ........................................................................................ 37
2. MATERIAL AND METHODS ................................................................................................................................39
2.1 SAMPLING AND SAMPLING AREAS .......................................................................................... 39
2.1.1. PART A: SURFACE WATER................................................................................................... 39
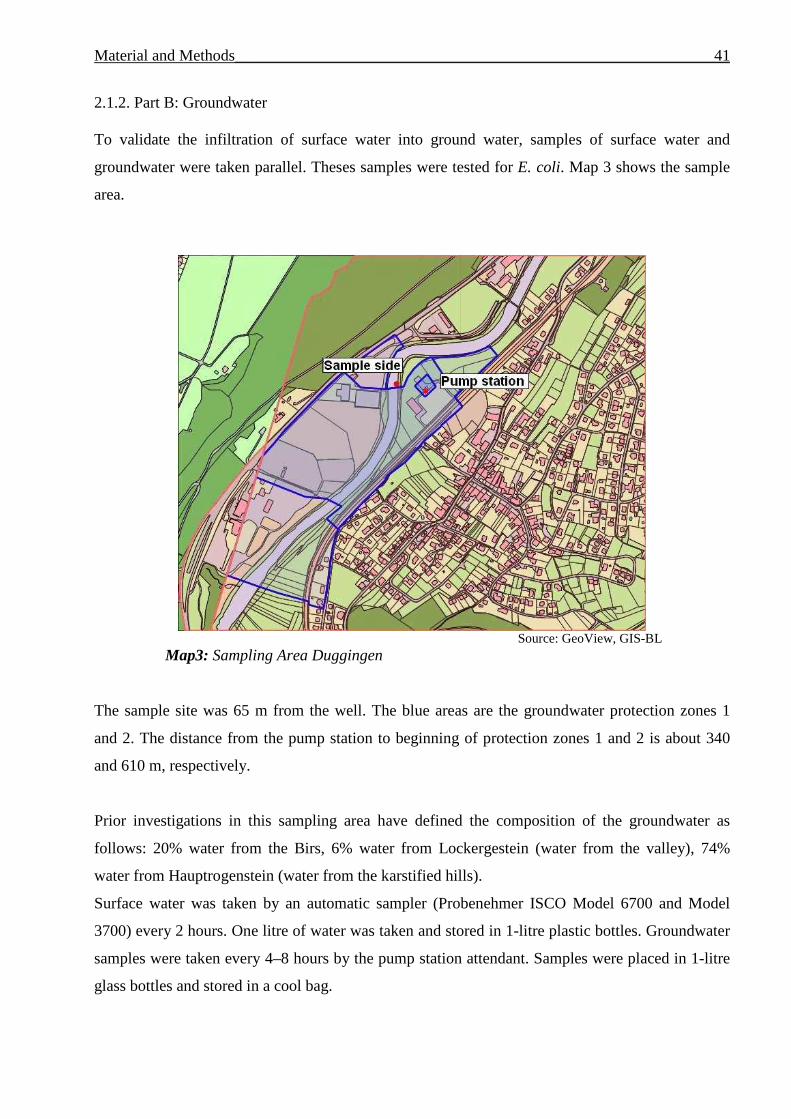
2.1.2. PART B: GROUNDWATER..................................................................................................... 41
FURTHER PARAMETERS................................................................................................................. 42
2.2 ANALYTICAL PROCEDURES .................................................................................................... 42
Page 3
Table of contents__________________________________________________________________ 2
2.2.1 BACTERIOLOGY.................................................................................................................... 42
2.2.2 VIROLOGY ............................................................................................................................ 46
3. RESULTS..................................................................................................................................................................48
3.1. PART A: SURFACE WATER .................................................................................................... 48
3.1.1. INDICATOR ORGANISMS....................................................................................................... 48
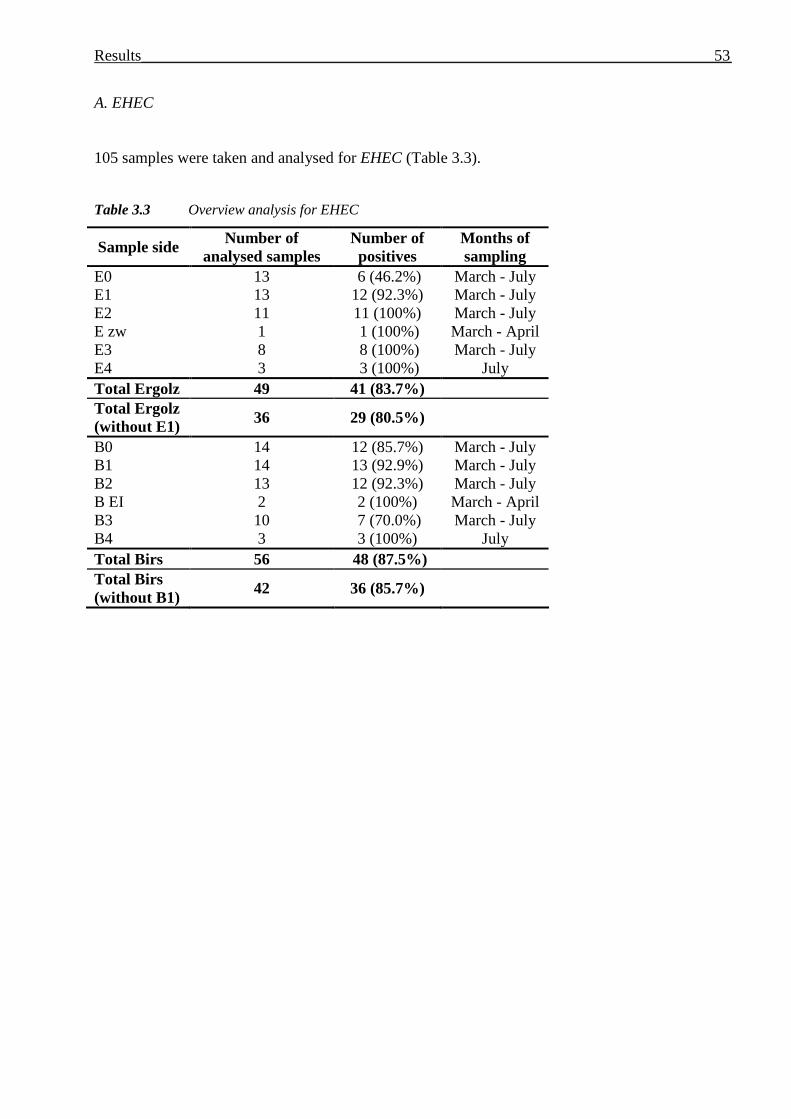
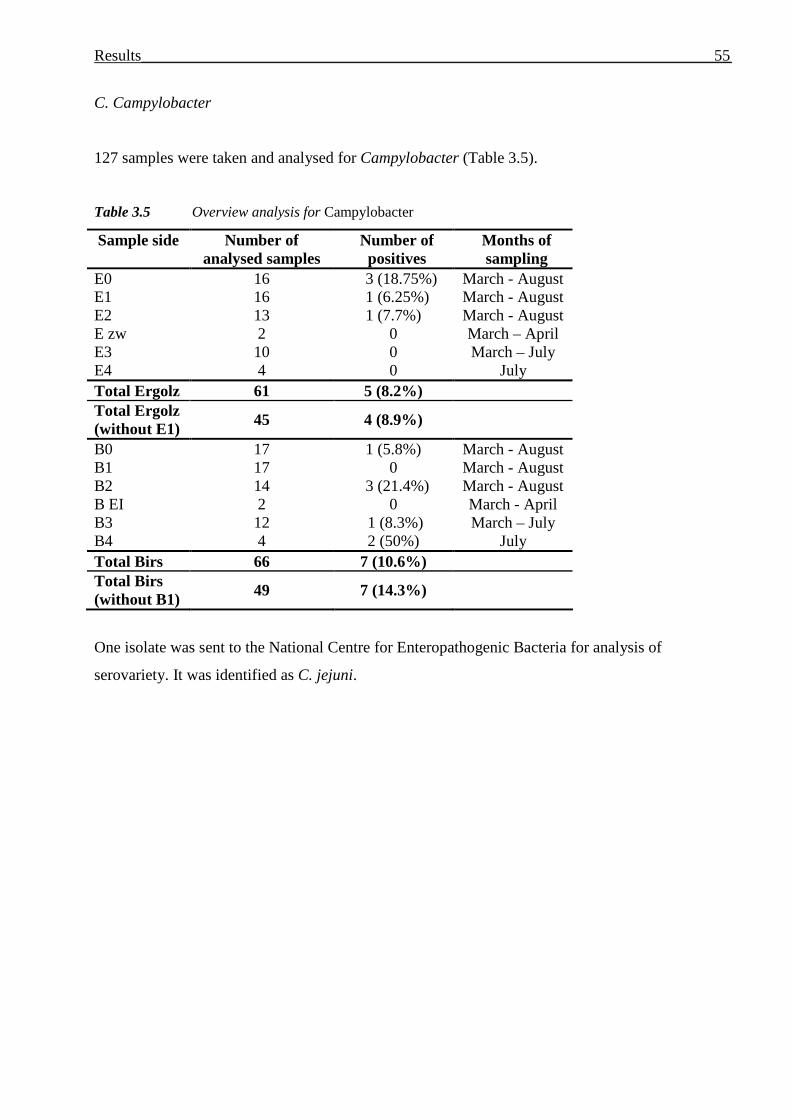
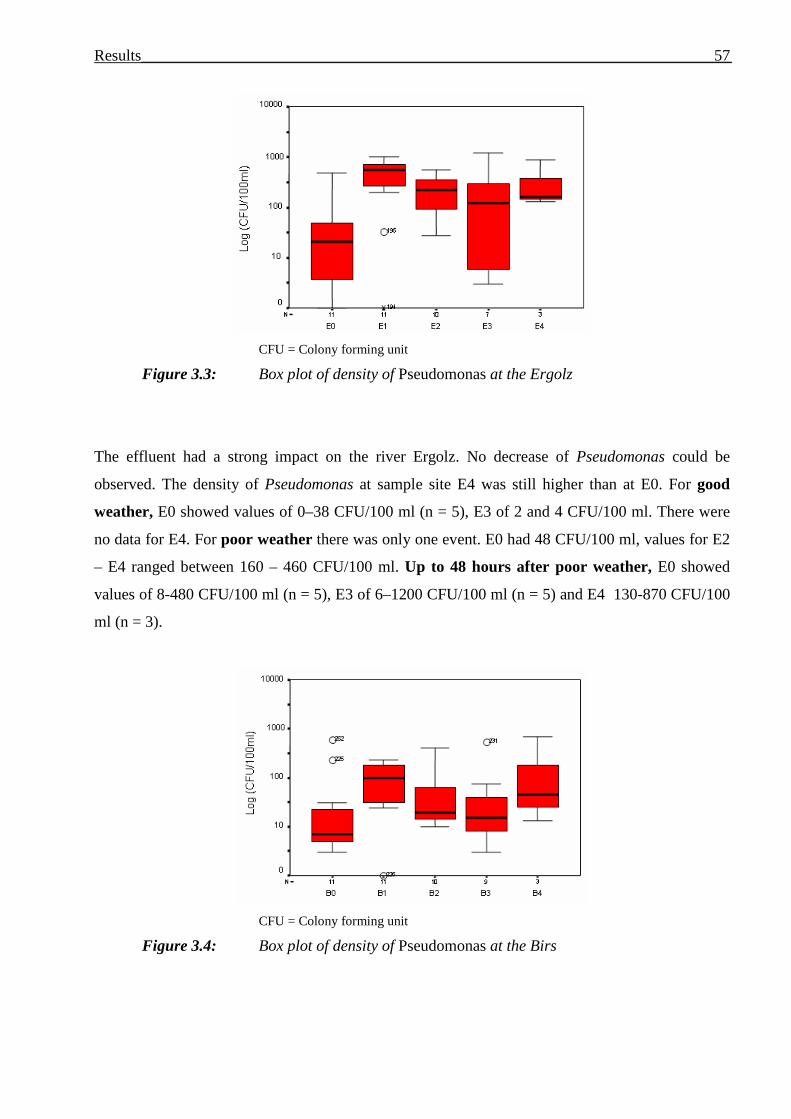
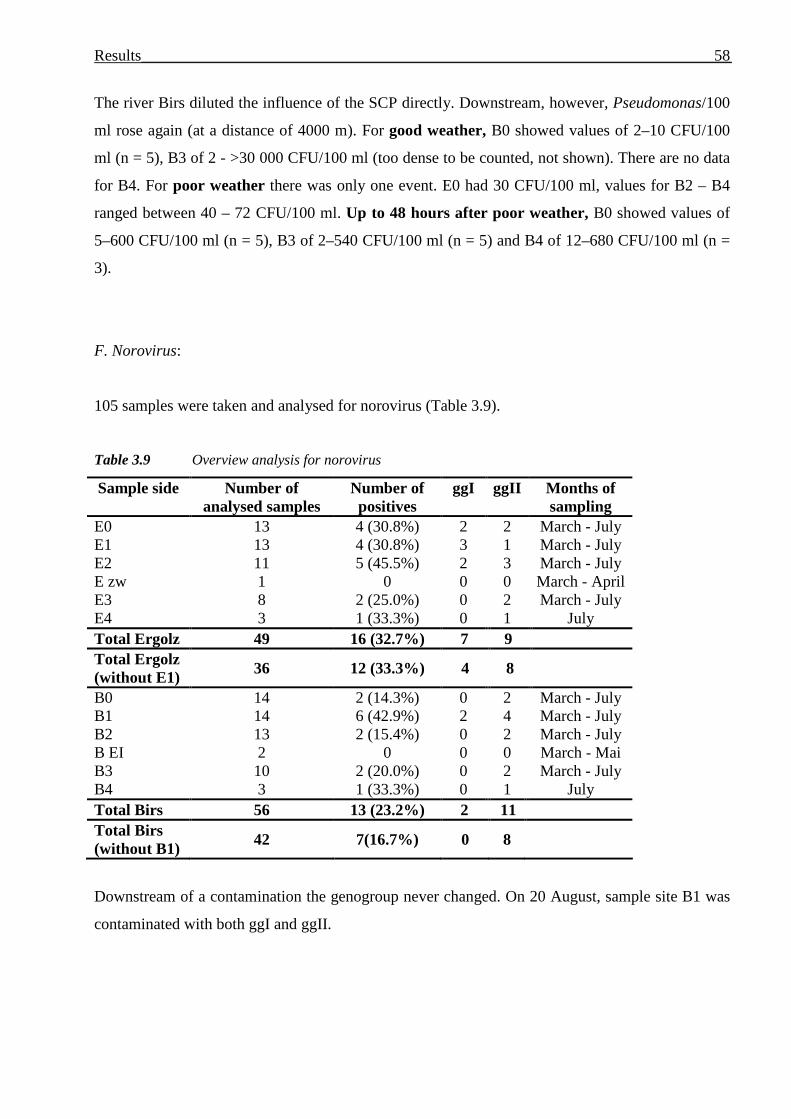
3.1.2. PATHOGENS......................................................................................................................... 52
3.1.3 WATER QUALITIES................................................................................................................ 62
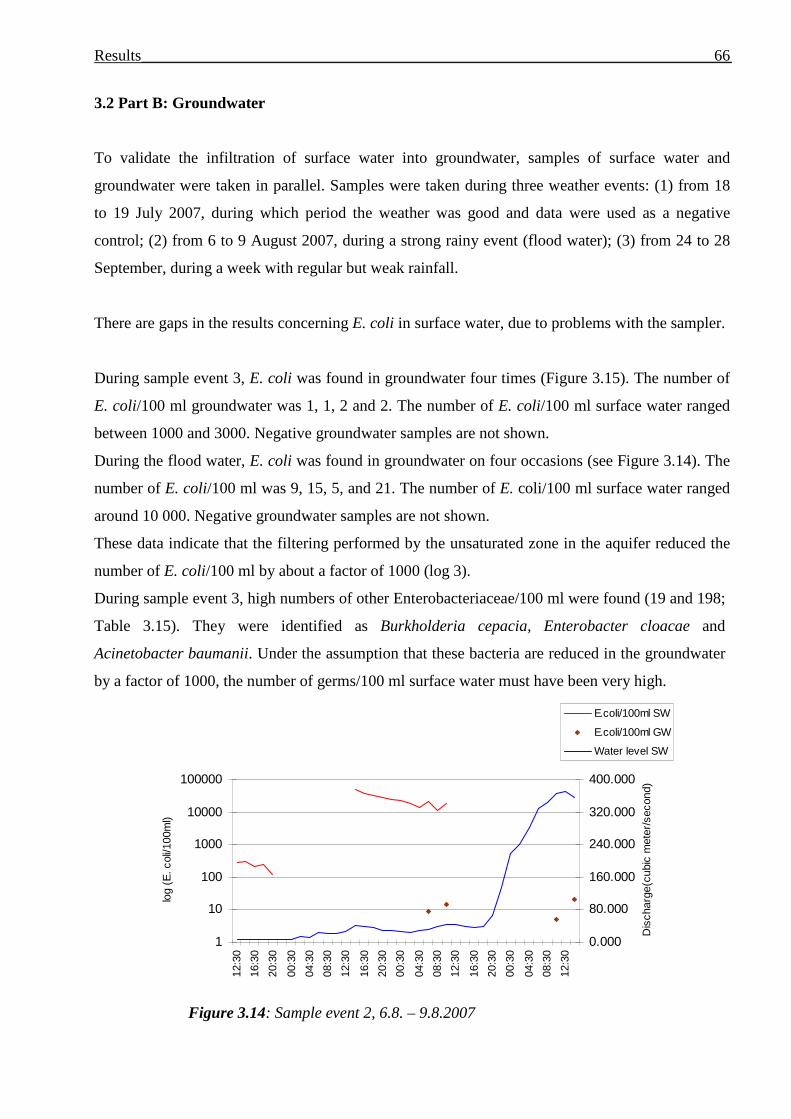
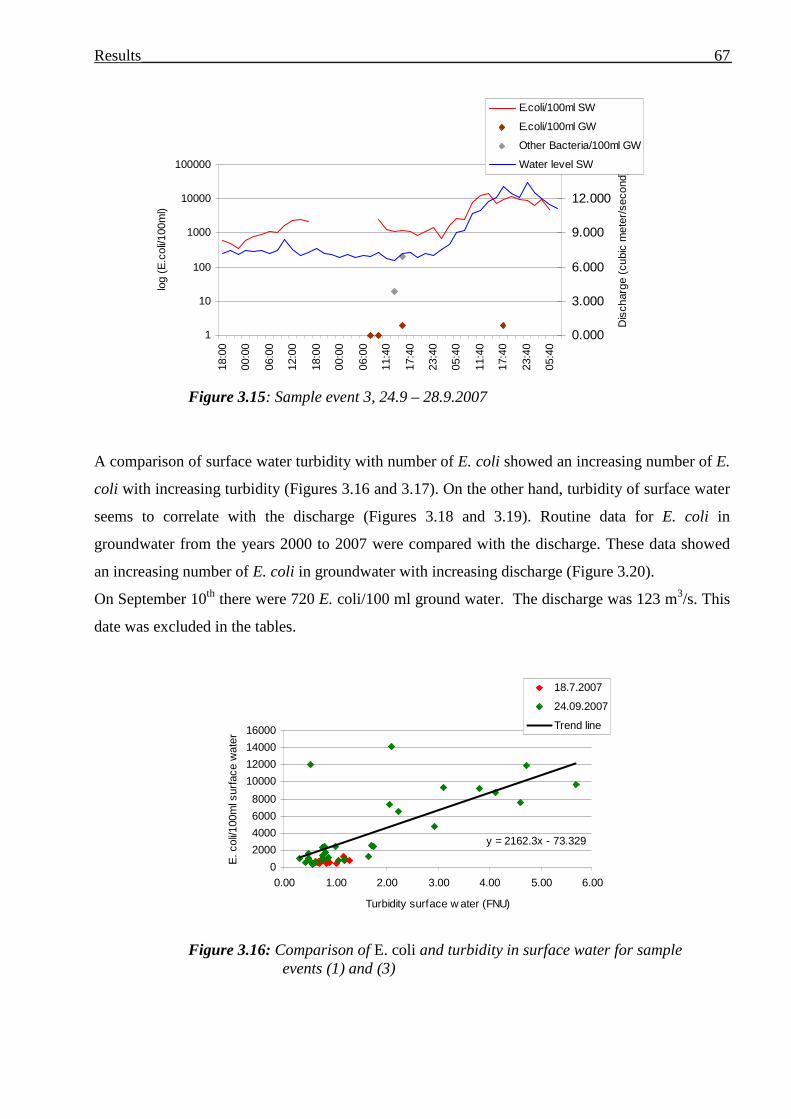
3.2 PART B: GROUNDWATER ....................................................................................................... 66
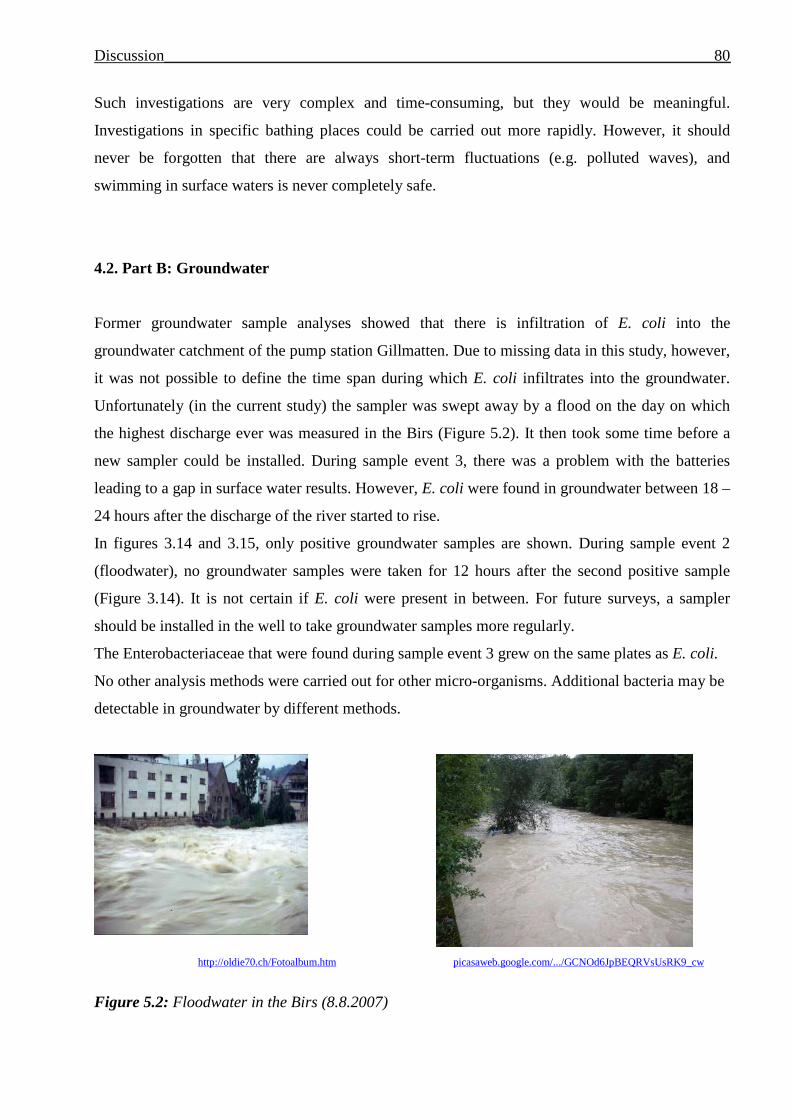
4. DISCUSSION............................................................................................................................................................70
4.1. PART A: SURFACE WATER .................................................................................................... 70
4.1.1. INDICATOR ORGANISMS: ...................................................................................................... 70
4.1.2. PATHOGENS AND THE INFLUENCE OF SCPS ......................................................................... 73
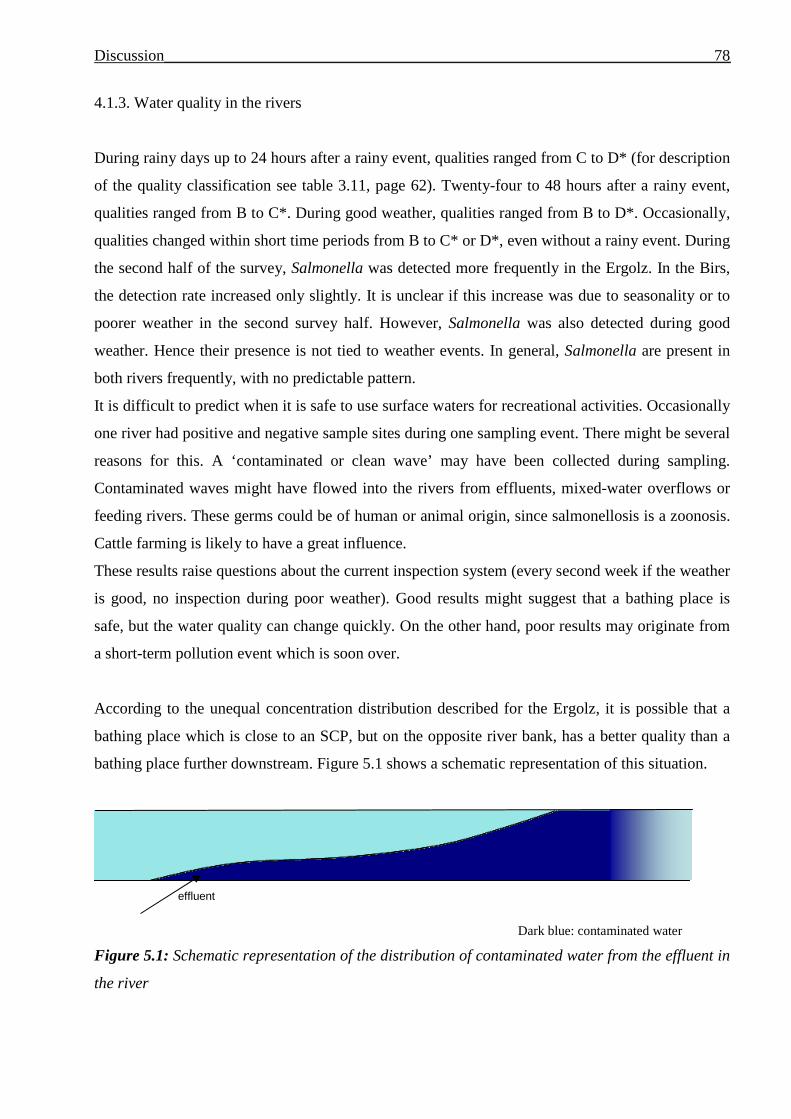
4.1.3. WATER QUALITY IN THE RIVERS.......................................................................................... 78
4.2. PART B: GROUNDWATER ...................................................................................................... 80
4.3. SUMMARY OF THE MOST IMPORTANT POINTS ...................................................................... 82
5. PROSPECT...............................................................................................................................................................83
6. REFERENCES.......................................................................................................................................................... 84
APPENDIX ....................................................................................................................................................................88
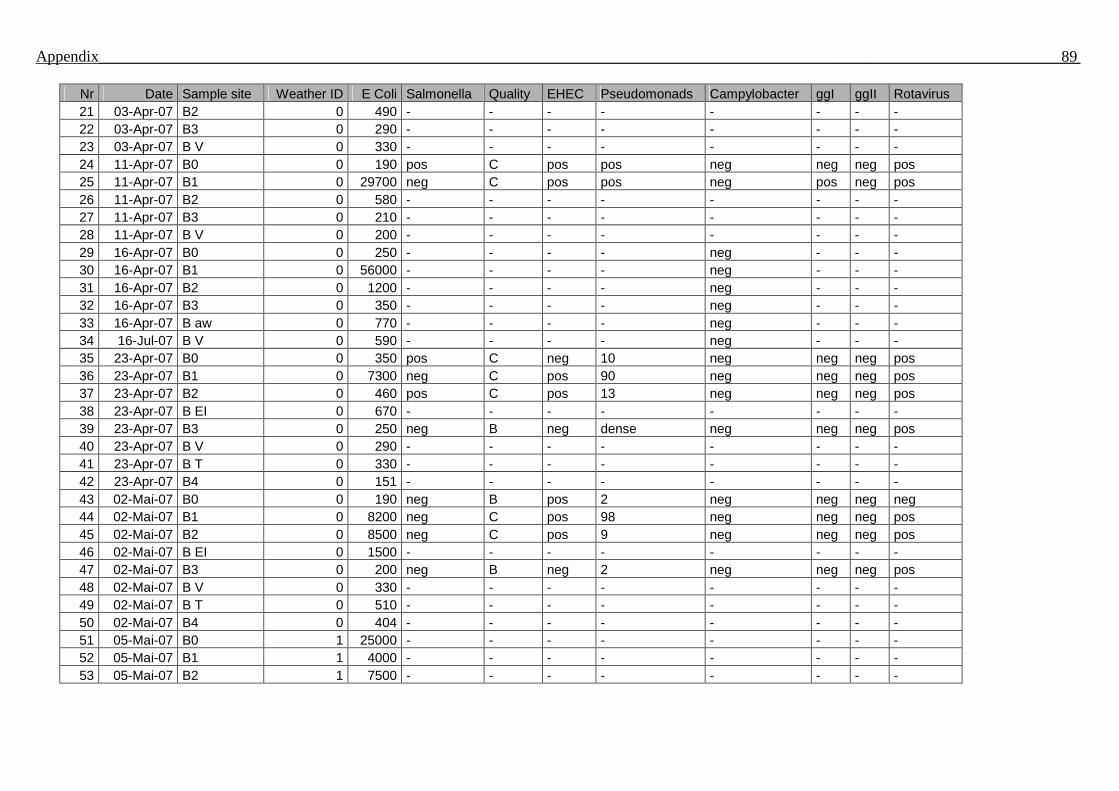
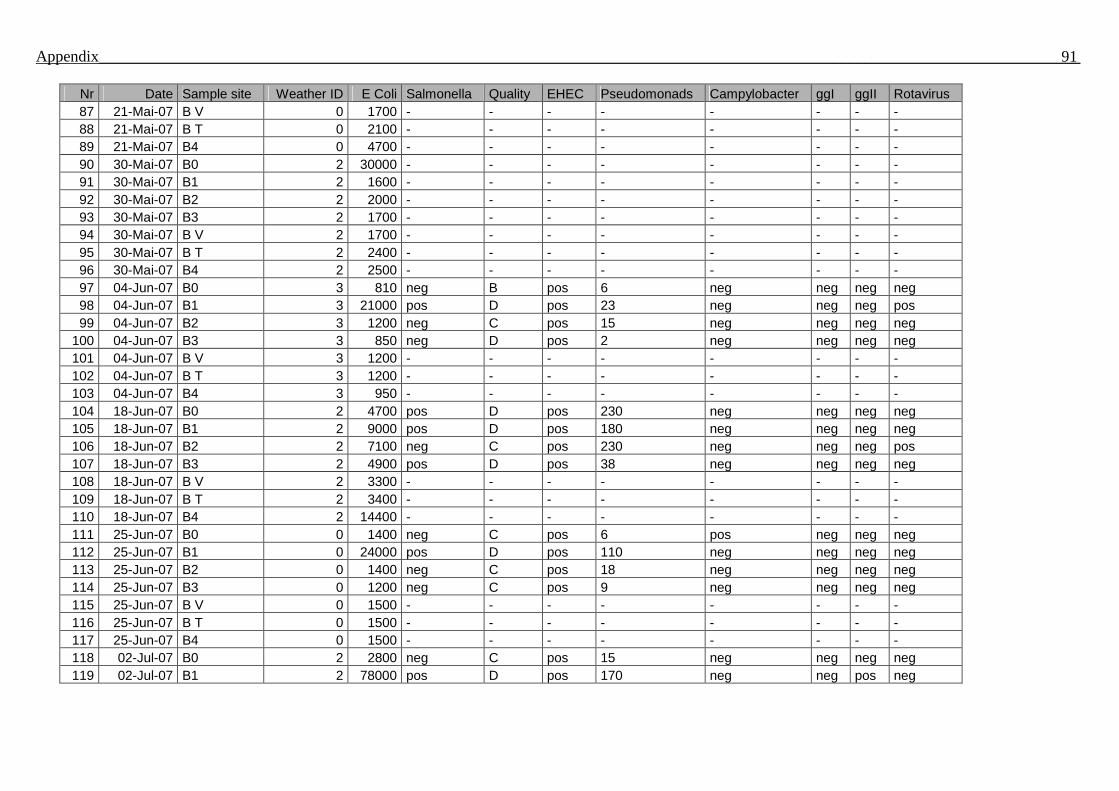
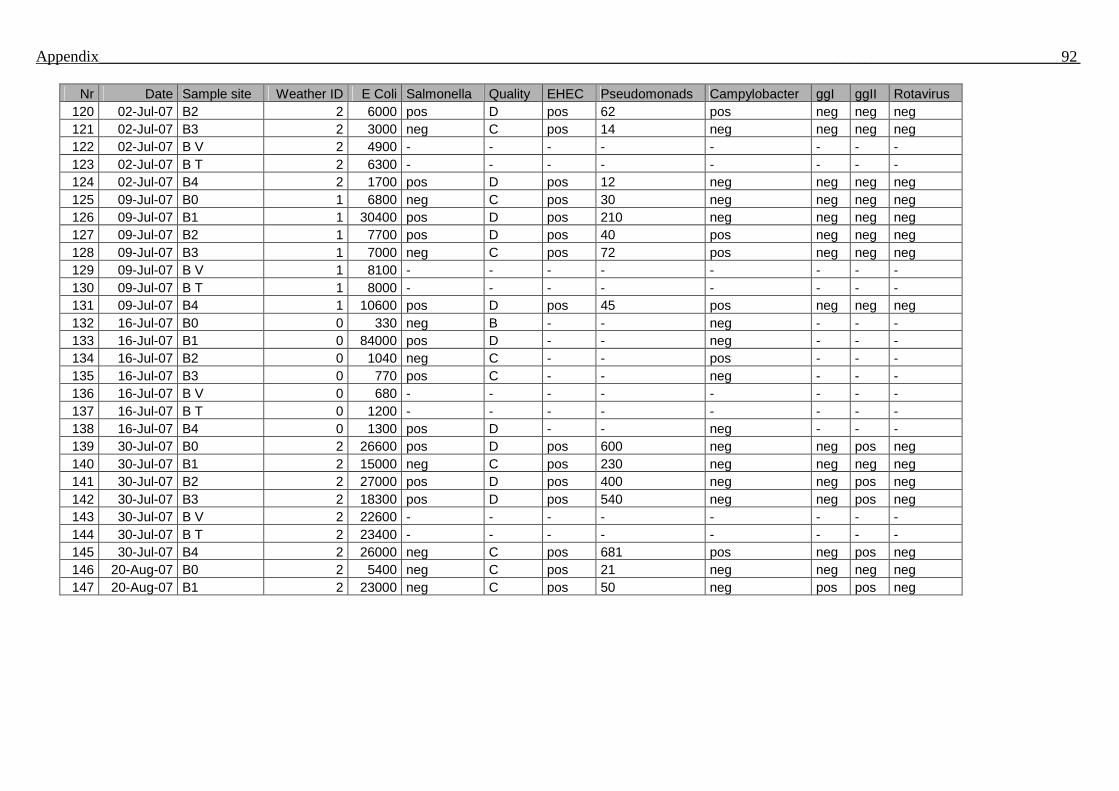
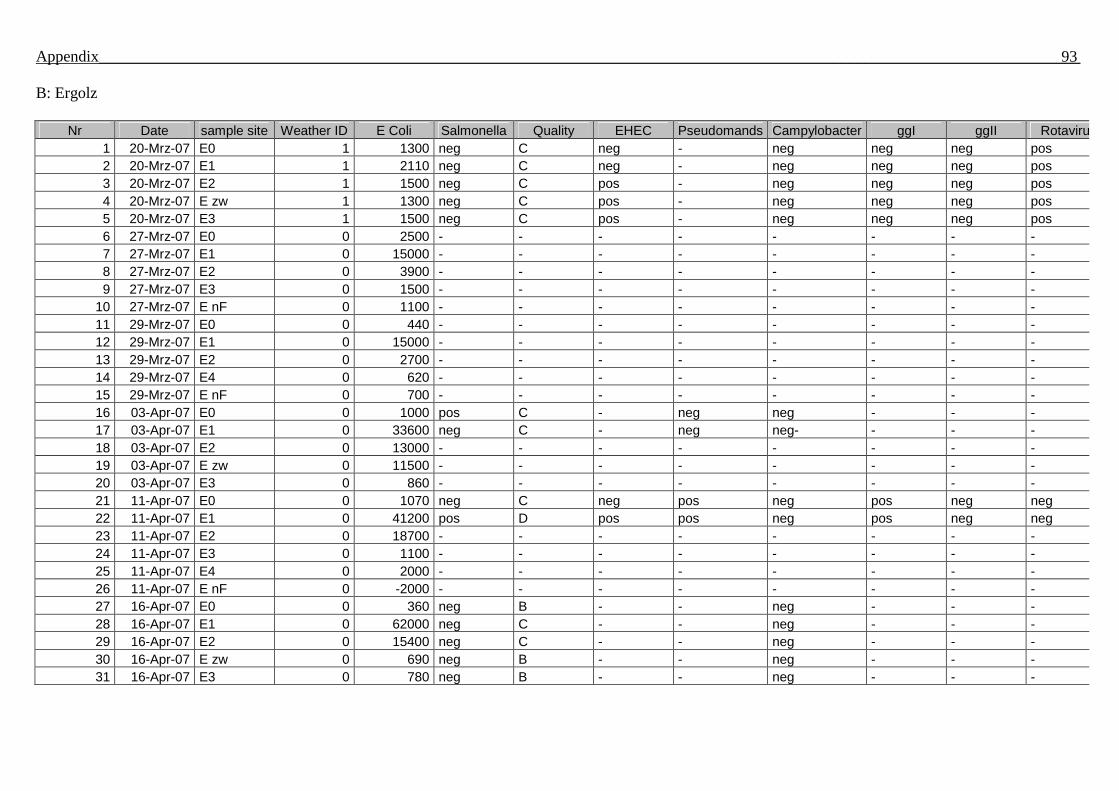
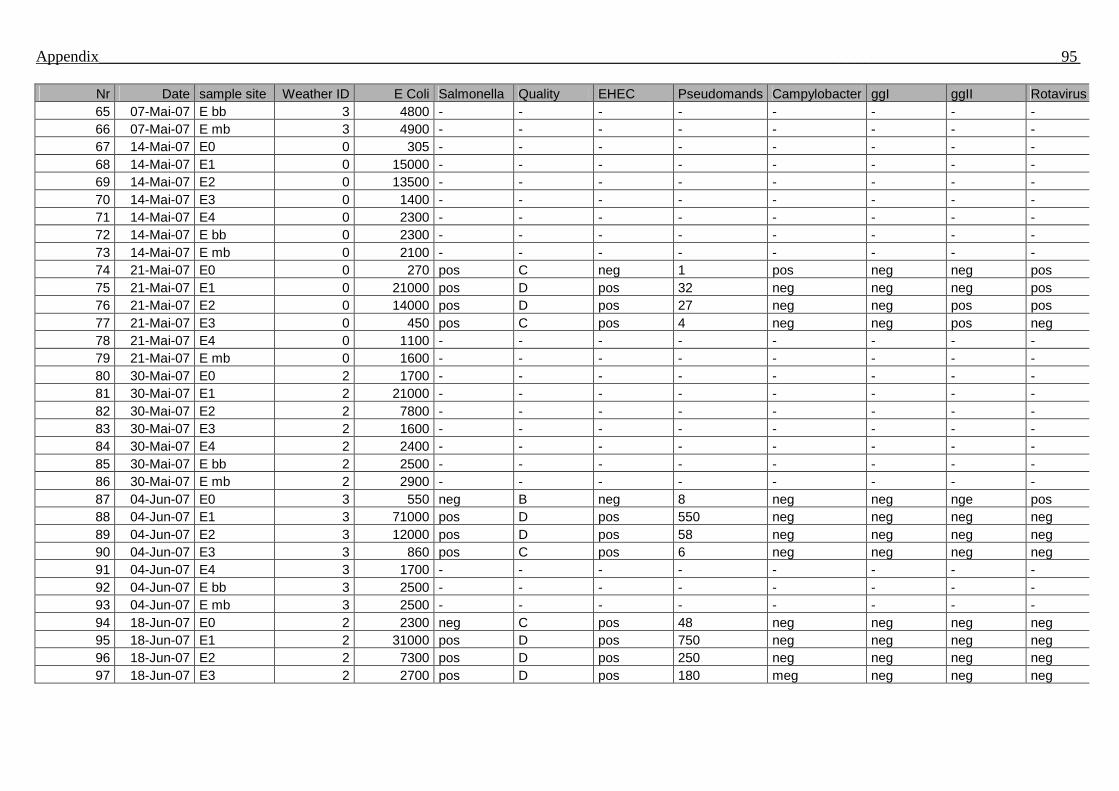
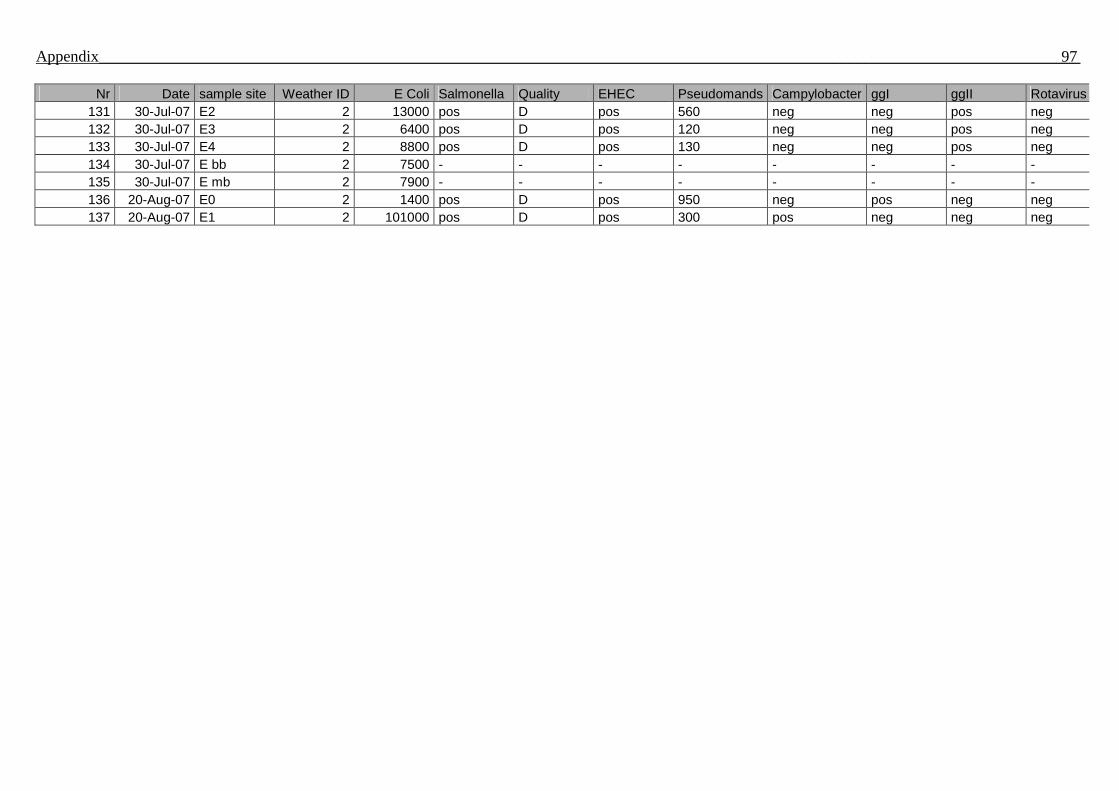
APPENDIX I. DATA OF SURFACE WATER SAMPLES ...................................................................... 88
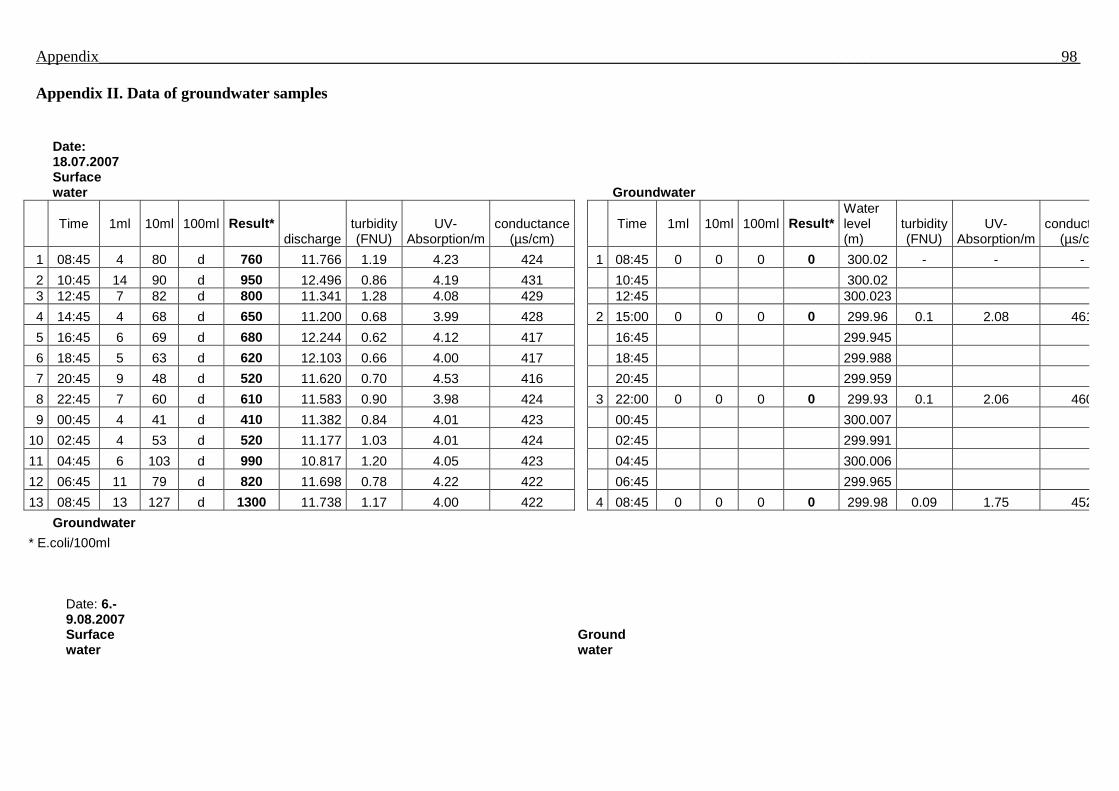
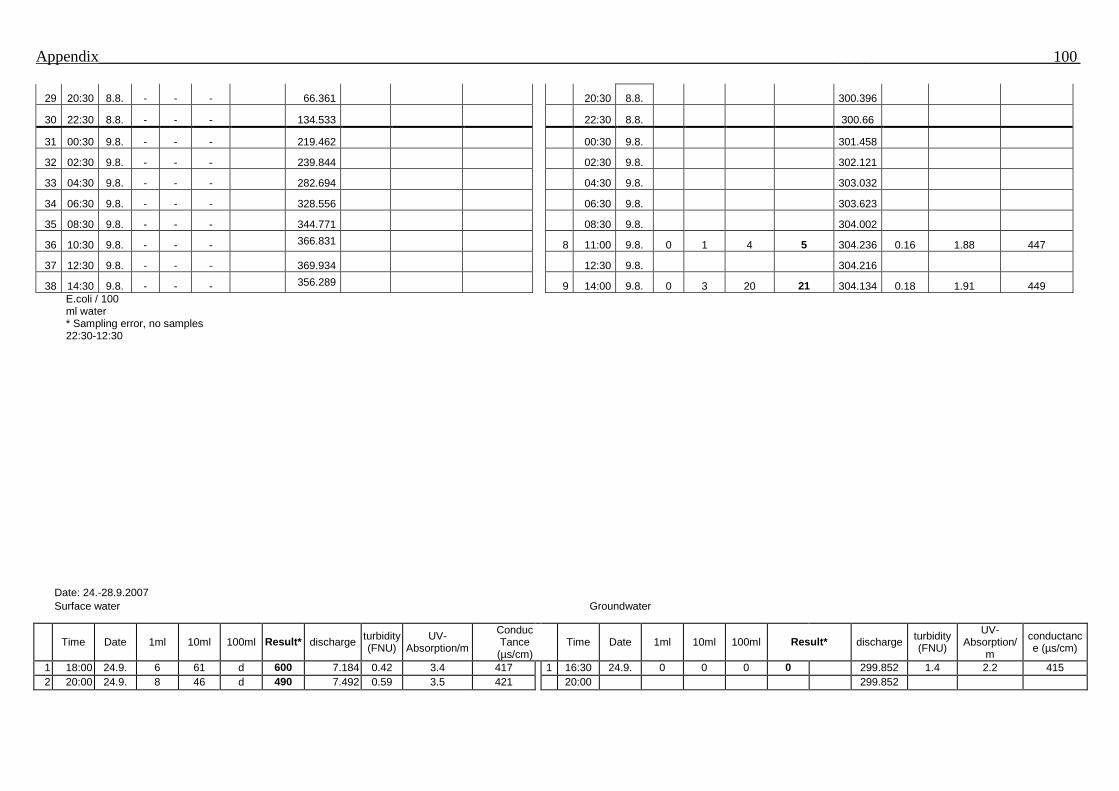
APPENDIX II. DATA OF GROUNDWATER SAMPLES ...................................................................... 98
APPENDIX III. SAMPLE SITE DIAGRAMS .................................................................................... 102
APPENDIX IV. SAMPLE EVENT DIAGRAMS ................................................................................ 104
APPENDIX V. TABLES ‚ INFLUENCE OF SCPS’ ........................................................................... 111
Page 4
Acknowledgements________________________________________________________________ 3
Acknowledgements
The present thesis based on a framework of cooperation between the Swiss Tropical Institute (STI)
in Basel and the Cantonal Laboratory Basel-Landschaft in Liestal (KLBL). I want to thank Prof.
Dr. Marcel Tanner (Director of the STI) and Dr. Paul Svoboda who made this collaboration
possible and gave me the opportunity for doing this thesis. Moreover I thank the KLBL for
financial support of this MSc thesis.
I thank Prof. Dr. Marcel Tanner, my supervisor from the STI, for his support and advices in the
beginning of the study.
I thank Dr. Paul Svoboda, my supervisor from the KLBL, for the guidance and support through my
thesis, and for the creative discussions.
I thank Dr. Adrian Auckenthaler from the Bureau for Environment and Energy Basel-Landschaft
for his support concerning groundwater and for the creative discussions.
I want to thank the stuff of the laboratory for the great support and the excellent atmosphere. A
special thank goes to Jürg Grimbichler for introducing me to the lab techniques and for helping out
in difficult situations. I thank Elisabeth Thommen and Ursula Löffel for their support in the
laboratory.
A special thank goes to Anne Blomstein for proof-reading the MSc thesis and the critical remarks.
I thank Jan Hattendorf from the STI for helping me in statistical questions.
Finally I thank my family for their support and confidence during the whole time.
Page 5
Abbreviations_____________________________________________________________________ 4
Abbreviations AIDS Acquired immunodeficiency syndrome
AMK Aerobic mesophyl germs
BAG Bundesamt für Gesundheit (Federal bureau for health)
E. coli Escherichia coli
EHEC Enterohaemorrhagic E.coli
GW Groundwater
HIV Human immunodeficiency virus
HUS Haemolytic uraemic syndrome
KLBL Cantonal laboratory Basel-Landschaft
PCR Polymerase chain reaction
SCP Sewage cleaning plant
SD Standard deviation
SLBL Schweizerisches Lebensmittelbuch
STI Swiss tropical institute
SW Surface water
UV Ultra-violet
VT1, VT2 Verocytotoxin 1 and 2
WHO World health organisation
WWCP Waste water cleaning plant
Page 6
Summary________________________________________________________________________ 5
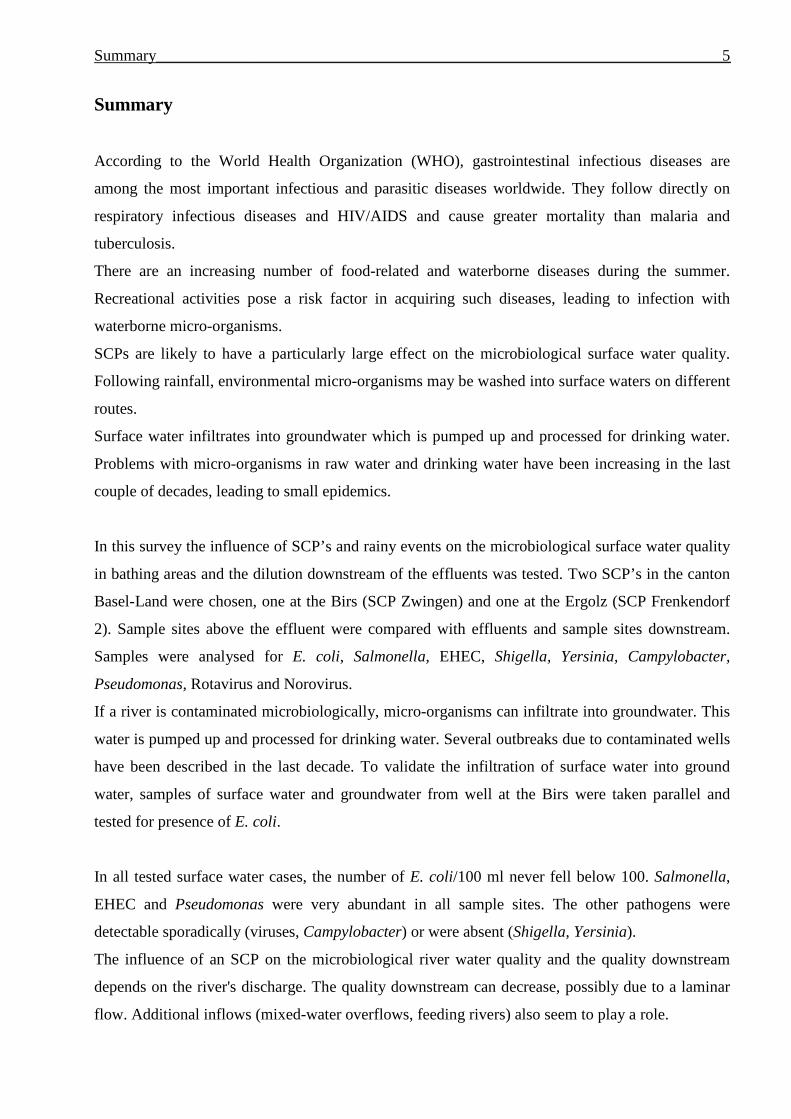
Summary According to the World Health Organization (WHO), gastrointestinal infectious diseases are
among the most important infectious and parasitic diseases worldwide. They follow directly on
respiratory infectious diseases and HIV/AIDS and cause greater mortality than malaria and
tuberculosis.
There are an increasing number of food-related and waterborne diseases during the summer.
Recreational activities pose a risk factor in acquiring such diseases, leading to infection with
waterborne micro-organisms.
SCPs are likely to have a particularly large effect on the microbiological surface water quality.
Following rainfall, environmental micro-organisms may be washed into surface waters on different
routes.
Surface water infiltrates into groundwater which is pumped up and processed for drinking water.
Problems with micro-organisms in raw water and drinking water have been increasing in the last
couple of decades, leading to small epidemics.
In this survey the influence of SCP’s and rainy events on the microbiological surface water quality
in bathing areas and the dilution downstream of the effluents was tested. Two SCP’s in the canton
Basel-Land were chosen, one at the Birs (SCP Zwingen) and one at the Ergolz (SCP Frenkendorf
2). Sample sites above the effluent were compared with effluents and sample sites downstream.
Samples were analysed for E. coli, Salmonella, EHEC, Shigella, Yersinia, Campylobacter,
Pseudomonas, Rotavirus and Norovirus.
If a river is contaminated microbiologically, micro-organisms can infiltrate into groundwater. This
water is pumped up and processed for drinking water. Several outbreaks due to contaminated wells
have been described in the last decade. To validate the infiltration of surface water into ground
water, samples of surface water and groundwater from well at the Birs were taken parallel and
tested for presence of E. coli.
In all tested surface water cases, the number of E. coli/100 ml never fell below 100. Salmonella,
EHEC and Pseudomonas were very abundant in all sample sites. The other pathogens were
detectable sporadically (viruses, Campylobacter) or were absent (Shigella, Yersinia).
The influence of an SCP on the microbiological river water quality and the quality downstream
depends on the river's discharge. The quality downstream can decrease, possibly due to a laminar
flow. Additional inflows (mixed-water overflows, feeding rivers) also seem to play a role.
Page 7
Summary________________________________________________________________________ 6
During poor weather, contamination of rivers is higher than during good weather. However, the
river water quality is very dynamic and there are great differences for both good and poor weather.
The river water quality improved again two to three days after a rain event.
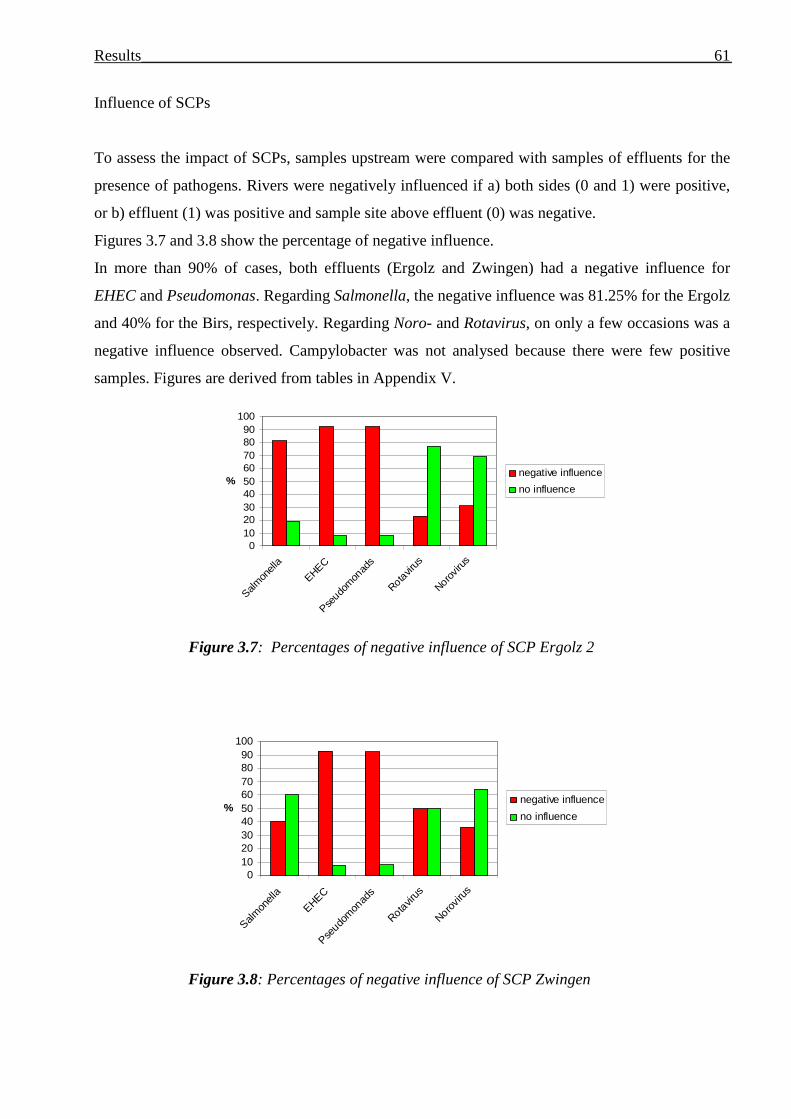
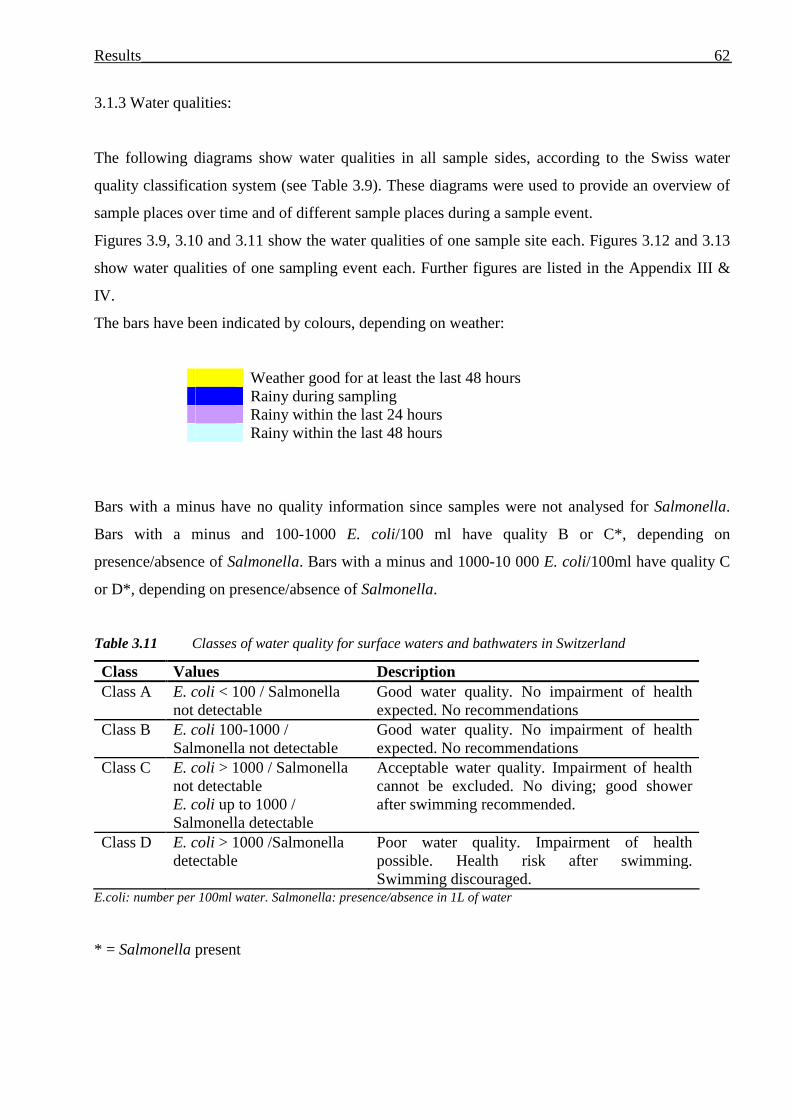
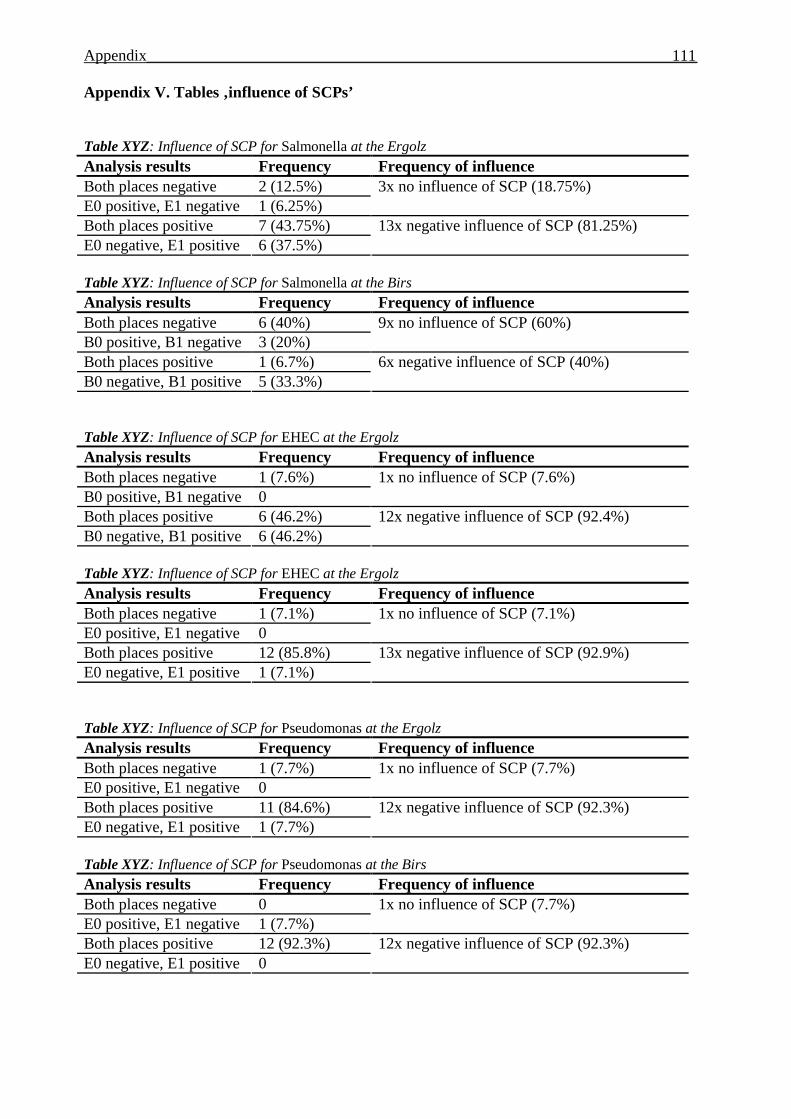
For Pseudomonas and EHEC, the influence of SCPs on river water quality is largely negative. The
same applies for Salmonella in the Ergolz. For all other pathogens, there was a negative influence
in 50% or less of cases.
The river water quality is very dynamic. Sites downstream can have different qualities within one
day, or the quality of one site can change within a few days, even when the weather conditions
remain stable.
The filtering of surface water performed by the unsaturated zone in the aquifer reduced the number
of E. coli/100 ml groundwater by about a factor of 1000 (log 3). By simple observation of surface
water (discharge, turbidity) one can estimate if E. coli are likely to be found in groundwater. For
each well influenced by river water, a critical value regarding discharge and turbidity should be
defined. This value gives the point from which E. coli are likely to be found in groundwater. If the
river exceeds this value, tests should be mandatory.
Page 8
Introduction______________________________________________________________________ 7
1. Introduction
The following section provides insights into important properties of surface water, groundwater
and micro-organisms. Systematic, pathogenesis and epidemiological aspects together with
virulence factors of waterborne micro-organisms will be described. Problems related to the
presence of micro-organisms in surface water and groundwater and how the human environment
influences these natural cycles will be discussed.
1.1 Bacteriology
1.1.1 Enterobacteriaceae
The family of Enterobacteriaceae includes more than 100 species and is the most important
bacterial family for human medicine. Their natural environment is the gut of human beings and
animals. Some of them are harmless commensals, whereas others are slightly to strongly
pathogenic.
Enterobacteriaceae are the most important micro-organisms causing intestinal infections in
humans. Some species cause diseases with typical clinical symptoms such as diarrhoea, typhoid
fever, dysentery or pest. Other species are opportunists that cause nosocomial infections such as
urinary tract infection, pneumonia, wound infections and sepsis.
Enterobacteriaceae are Gram-negative, motile, aerobic and facultative anaerobic rods with rounded
ends. They are about 0.5–1.5 µm thick and 2–4 µm long and often peritrichously flagellated.
Typical and common species are Escherichia coli (including VTEC, EPEC, ETEC, EIEC, EaggEC
— see Table 1.1), Salmonella, Shigella, Yersinia, Proteus, Citrobacter, Klebsiella, Enterobacter,
Serratia, Providencia, Morganella.
Page 9
Introduction______________________________________________________________________ 8
A. Escherichia
E. coli is a natural habitant of the human and animal gut. In healthy people it is a harmless
commensal. The presence of E. coli in drinking water, surface water bathwater and food is often
attributed to faecal contamination from agricultural and urban/residential areas. For surface and
bathwater there are four classes of quality in Switzerland (see chapter 1.4, Part A: Surface water).
Most types of E. coli are harmless. However, some strains can cause severe diseases, such as
bloody diarrhoea, and occasionally kidney failure.
General pathogenesis
E. coli possesses a range of pathogenic factors.
O- and K-antigen protect the organism from complement and phagocytosis in the absence
of antibodies.
Many strains express haemolysin(s). These enzymes are important for the release of
essential ferric ions bound to haemoglobin.
Some strains express siderophores (e.g. enterobactin) which remove ferric ions from
mammalian iron transport proteins such as transferrin and lactoferrin.
Pathogenesis and epidemiology of extraintestinal infections
E. coli can generally cause both intestinal infections such as diarrhoea and extraintestinal infections
such as urinary tract infections. Extraintestinal infections occur when E. coli colonizes places other
than the gut. Typical manifestations are wound infections, infections of the gall bladder,
appendicitis, peritonitis, neonatal meningitis, sepsis and urinary tract infections.
About 15% of all nosocomial sepsis is caused by E. coli, usually by strains of septic E. coli
(SEPEC). SEPEC are serum resistant.
E. coli is also the most common cause of urinary tract infection outside the hospital. This infection
manifests in the lower part of the urinary tract (urethritis, cystitis, urethrocystitis) or it can affect
the renal pelvis and the kidney (cystopyelitis, pyelonephritis).
Page 10
Introduction______________________________________________________________________ 9
Most E. coli infections are thought to be caused by organisms originating from the patient's own
flora.
Infections occurring in the absence of mechanical anomalies are thought to be caused by the
pathovar UPEC (uropathogenic E. coli).
Pathogenesis and epidemiology of intestinal infections
Table 1.1 provides an overview of enteropathogenic strains of E. coli.
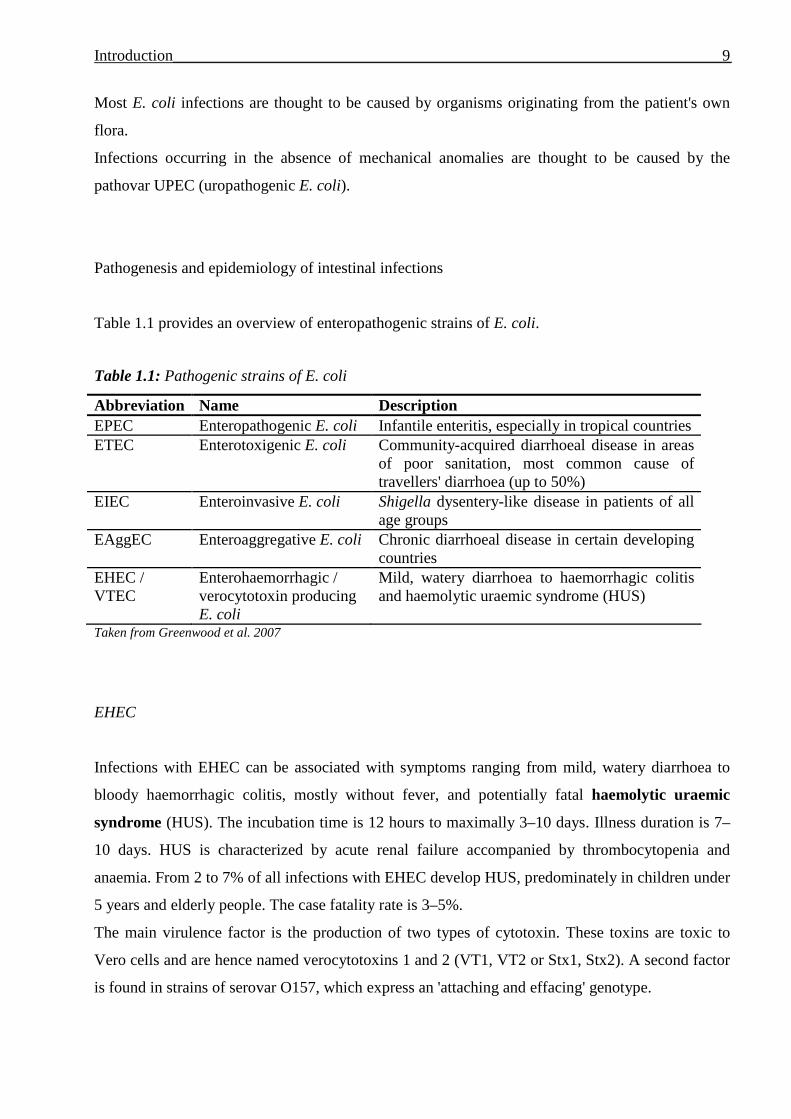
Table 1.1: Pathogenic strains of E. coli
Abbreviation Name Description EPEC Enteropathogenic E. coli Infantile enteritis, especially in tropical countries ETEC Enterotoxigenic E. coli Community-acquired diarrhoeal disease in areas
of poor sanitation, most common cause of travellers' diarrhoea (up to 50%)
EIEC Enteroinvasive E. coli Shigella dysentery-like disease in patients of all age groups
EAggEC Enteroaggregative E. coli Chronic diarrhoeal disease in certain developing countries
EHEC / VTEC
Enterohaemorrhagic / verocytotoxin producing E. coli
Mild, watery diarrhoea to haemorrhagic colitis and haemolytic uraemic syndrome (HUS)
Taken from Greenwood et al. 2007
EHEC
Infections with EHEC can be associated with symptoms ranging from mild, watery diarrhoea to
bloody haemorrhagic colitis, mostly without fever, and potentially fatal haemolytic uraemic
syndrome (HUS). The incubation time is 12 hours to maximally 3–10 days. Illness duration is 7–
10 days. HUS is characterized by acute renal failure accompanied by thrombocytopenia and
anaemia. From 2 to 7% of all infections with EHEC develop HUS, predominately in children under
5 years and elderly people. The case fatality rate is 3–5%.
The main virulence factor is the production of two types of cytotoxin. These toxins are toxic to
Vero cells and are hence named verocytotoxins 1 and 2 (VT1, VT2 or Stx1, Stx2). A second factor
is found in strains of serovar O157, which express an 'attaching and effacing' genotype.
Page 11
Introduction______________________________________________________________________ 10
VT 1 and 2 are located on a bacteriophage plasmid and are very similar to the Shiga toxin
produced by Shigella dysenteriae. Through infestation with such a toxin-coding phage any strain of
E. coli could change to EHEC (Burnens, 2001).
VT1 and 2 bind to the surface protein Gb3 (globotriosylceramide) of several eukaryotic cells.
Binding to Gb3 receptors located in the kidney leads to HUS. There are several VT2 variants with
similar effects but immunological differences that bind to Gb4 (globotetraosylceramide). After
binding to eukaryotic cells, the toxins are internalized and remain active within the endosomes.
One subunit of the toxin prevents protein synthesis and results in cell death.
Strains of serovar EHEC O157 carry a gene for 'attaching and effacing' (eae). As for EPEC, this
gene is located on a 'pathogenicity island' in the bacterial chromosome. In areas of attachment of
these genotypes to target cells the brush border microvilli are lost (effaced).
The three genes (vt1, vt2, eae) are not associated with each other. Each gene can occur alone or in
combination with the others within one EHEC, depending on strain.
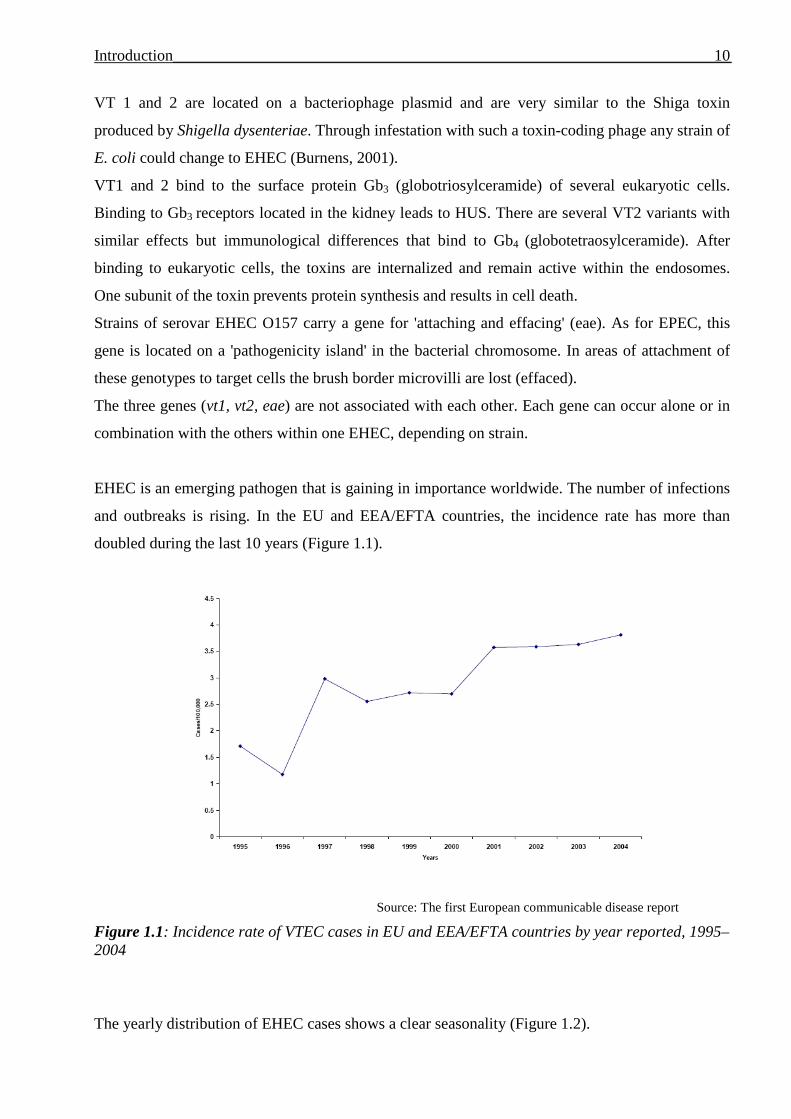
EHEC is an emerging pathogen that is gaining in importance worldwide. The number of infections
and outbreaks is rising. In the EU and EEA/EFTA countries, the incidence rate has more than
doubled during the last 10 years (Figure 1.1).
Source: The first European communicable disease report
Figure 1.1: Incidence rate of VTEC cases in EU and EEA/EFTA countries by year reported, 1995–2004
The yearly distribution of EHEC cases shows a clear seasonality (Figure 1.2).
Page 12
Introduction______________________________________________________________________ 11
In 2005 data from 11 EU countries, Iceland and Norway showed the highest incidence rate in
children ≤ 4 years of age (9.04 per 100 000), falling rapidly with increasing age. There is no real
difference between the incidence rates of males and females (European Epidemiological Report,
2007).
Outbreaks often occurred within communities, in nursing homes for elderly people or in day care
centres for young children. In May 2000 an outbreak in the community Walkerton (Ontario,
Canada) led to 7 deaths and more than 2300 illnesses (Canada Communicable Disease Report,
2000). The drinking water supply was contaminated by rainwater runoff containing cattle faeces.
Source: The first European communicable disease report
Figure 1.2: Distribution of VTEC cases by month, for selected European countries, 2005 (n = 2031)
The infection dose is estimated to be 10–100 germs. The main source of infection is the
consumption of raw minced meat. Unpasteurized milk, apple juice, cooked meat, sprouts and
contaminated water are important sources as well. Humans are the main reservoir. Livestock such
as cattle, sheep and to a lesser extend goats, pigs and chickens are also important. Infection can be
transmitted by the faecal-oral route due to unhygienic behaviour.
B. Salmonella
In the last 20 years, Salmonella enterica has become one of the most common causes of food
poisoning in various countries. Nowadays it is accepted that there is only one species, S. enterica,
Page 13
Introduction______________________________________________________________________ 12
with seven subspecies (enterica, arizonae, diarizonae, houtenae, indica, salamae, bongori) (Le
Minor und Popoff, 1987). Reeves et al. (1989) suggested that S. enterica ssp. bongori should be
described as a separate species. A clearly defined classification system is still lacking.
Most clinical important serotypes belong to the species S. enterica ssp. enterica. As the name
suggests, S. enterica primarily causes diseases of the intestines. There are more than 2000
serotypes that are classified due to their somatic (O) and flagellar (H) antigens.
Pathogenesis
There are four clinical manifestations:
• gastroenteritis
• bacteraemia / septicaemia
• typhoid fever / enteric fever
• asymptomatic carrier state
With respect to the enteric illness they elicit, Salmonella spp. can be divided into two fairly distinct
groups: typhoidal serovars and non-typhoidal/enteric serovars. Typhoid salmonellosis is caused by
serovars typhi and paratyphi A, B, C. Important serovars for enteric salmonellosis are enteritidis
and typhimurium.
In enteric salmonellosis the bacteria are taken up orally in contaminated food of animal origin
(eggs, meat) or water. They adhere to cells of the ileum and colon and invade the mucosa. Germs
persist in epithelial cells and sometimes in macrophages, producing an enterotoxin, giving rise to
local inflammation (Figure 1.3). After an incubation time of 6–72 hours after ingestion, the disease
usually begins with acute diarrhoea and sickness. Diarrhoea lasts for 3–5 days, accompanied by
fever and abdominal pain. The disease is usually self-limiting. In cases of strong loss of water and
electrolytes, hospitalization is necessary.
Page 14
Introduction______________________________________________________________________ 13
Source: www.gsbs.utmb.edu/microbook/ch021.htm
Figure 1.3: Infection cycle of enteric salmonellosis
In typhoid salmonellosis, bacteria are taken up orally in contaminated food or water or via smear
infection. They adhere to cells of the jejunum and enter the lymphatic tissue by transcytosis
through cells of the mucosa and phagocytosis by macrophages. Germs proliferate in mesenterial
lymph nodes and spread in the lymph and blood. Secondary sites of infection include the spleen,
liver and bone marrow Subsequently, after 1–14 days incubation, a generalized septic disease
pattern develops, beginning with gradually increasing fever, followed by headache, leucopoenia,
splenic swelling, abdominal roseola and occasionally bloody diarrhoea after 3 weeks. Typhoid
fever is a more severe illness and can be fatal.
Virulence factors
Salmonella possess a wide range of effector proteins, which are injected directly into host cells
with help of two type III secretion systems. These proteins disturb several cellular metabolic
processes, with the result that water and electrolyte regulation are disturbed or Salmonella is taken
up into host cells. Other factors are invasins or adhesins on the bacterial surface.
Page 15
Introduction______________________________________________________________________ 14
Epidemiology
Typhoid salmonellosis is not a problem in countries with good sanitation. In northern and central
Europe, typhoid salmonellosis is imported by travellers and epidemic outbreaks only following the
rare coincidence of several risk factors. However, in countries with poor sanitation, typhoid
salmonellosis is still prevalent with many millions of cases each year. S. typhi and S. paratyphi are
restricted to humans, although livestock can occasionally be a source of S. paratyphi.
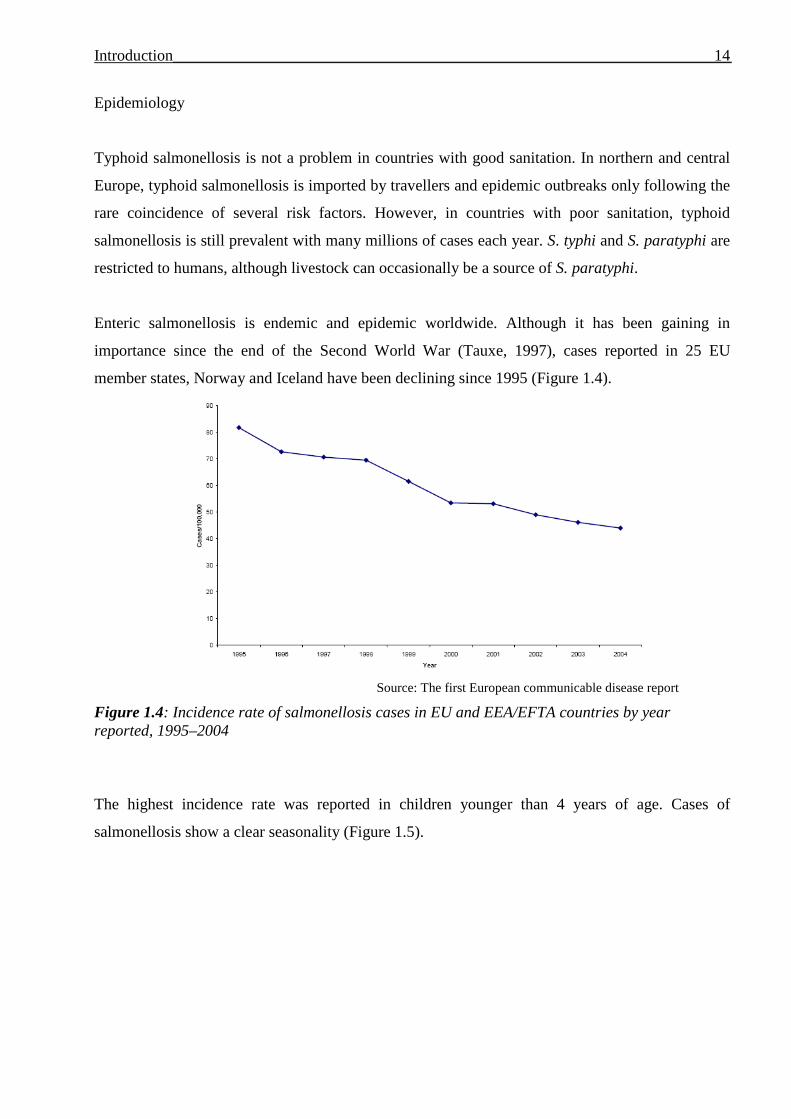
Enteric salmonellosis is endemic and epidemic worldwide. Although it has been gaining in
importance since the end of the Second World War (Tauxe, 1997), cases reported in 25 EU
member states, Norway and Iceland have been declining since 1995 (Figure 1.4).
Source: The first European communicable disease report
Figure 1.4: Incidence rate of salmonellosis cases in EU and EEA/EFTA countries by year reported, 1995–2004
The highest incidence rate was reported in children younger than 4 years of age. Cases of
salmonellosis show a clear seasonality (Figure 1.5).
Page 16
Introduction______________________________________________________________________ 15
Source: The first European communicable disease report
Figure 1.5: Distribution of salmonellosis cases by month, for selected European countries, 2005 (n = 89317)
C. Shigella
Shigellae are the causative organism of bacterial dysentery. The genus comprises four species:
Shigella dysenteriae, S. flexneri, S. boydii and S. sonnei. Shigellae are non-motile and rod-like.
They have complex antigenic patterns and classification is based on somatic O-antigens.
Pathogenesis
Shigellae are predominately transmitted by the faecal-oral route through direct person-to-person
contact or via contaminated food and water. Flies have been identified as a transmission vector
from contaminated faecal waste. More recently, sexual transmission among men having sex with
men has become a more common cause of outbreaks in several countries. The infective dose is
very low (10 to several hundred germs). The incubation time for disease is 2–5 days. Bacteria
remain localized in the intestinal epithelial cells of the terminal ileum and colon. They are taken up
by M-cells and phagocytosed by macrophages. Inside macrophages they lyse the phagosome and
induce apoptosis. After cell death, bacteria are taken up by enterocytes on the basolateral side.
Inside enterocytes bacteria proliferate, leading to cell destruction. Neighbouring enterocytes are
invaded by lateral transfer from infected cells. Depending on species, the clinical picture can vary
from a mild, self-limiting diarrhoea to very serious presentations such as high fever, dysentery
Page 17
Introduction______________________________________________________________________ 16
(bloody and pyic diarrhoea, enterospasms and tenesmus, massive intestinal bleeding), megacolon
or HUS. Reactive arthritis can follow the enteric symptoms. Severe illnesses are usually caused by
S. dysenteriae.
Virulence factors
Shigella possesses a 180- to 240-kb plasmid encoding invasins. S. dysenteriae produces the
chromosome-coded Shiga toxin, which inhibits eukaryotic protein synthesis.
Epidemiology
Bacterial dysentery is present worldwide. In industrialized countries with good sanitation it occurs
only sporadically, and shigellosis is a typical travellers' disease. In developing countries with poor
sanitation and hygiene, the disease is endemic and probably epidemic. Worldwide there are over 2
million infections each year, resulting in 600 000 deaths. In developing countries, shigellosis is a
leading cause of childhood death.
In 25 EU member states, Iceland and Norway, the incidence has been declining over the last 10
years. The highest incidence was in children younger than 4 years of age (3.5 per 100 000),
representing 10% of all cases. The incidence rises again at age group 25–44. There is a clear
seasonality, with an increase from winter to summer and a peak in August and September
(European disease epidemiological report, 2007).
Waterborne outbreaks of shigellosis have been recorded. As the organisms are not particularly
stable in water environments, their presence in drinking water indicates recent human faecal
pollution.
D. Yersinia
The genus Yersinia includes 11 species of which 3 are of medical importance for humans: Yersinia
pestis (plague), Y. enterocolitica and Y. pseudotuberculosis (both enteric diseases). Y.
enterocolitica is a pleomorphic, peritrichous flagellated, short rod. All types of yersiniosis are
zoonoses.
Page 18
Introduction______________________________________________________________________ 17
Pathogenesis
Germs of Y. enterocolitica are taken up orally in raw/undercooked meat and water. Direct
transmission from animals or humans by smear infection is also possible, but seldom. Germs reach
the lower intestinal tract, penetrate the mucosa and are transported to mesenterial lymph nodes by
macrophages. Incubation time is 3–7 days. There are two different clinical patterns.
• Intestinal yersiniosis: fever, diarrhoea, abdominal pain and lymph adenitis are the main
symptoms. Mimicking appendicitis in adolescents and colitis in adults is possible.
• Extraintestinal yersiniosis: manifestations such as arthritis, lymphadenopathy, erythaema
nodosum (inflammation of fat cells under the skin) can appear.
Virulence factors
All pathogenic strains isolated from humans have a 70-kb virulence plasmid containing several vir
determinants. These plasmids code for polypeptides for cell adherence, phagocytosis resistance,
serum resistance and cytotoxicity. In addition there are chromosomal virulence genes for invasins,
enterotoxins and iron uptake systems.
Epidemiology
Y. enterocolitica is present worldwide in domestic and wild animals. The main reservoirs are pigs.
Pathogenic Y. enterocolitica has been detected in sewage and polluted surface waters. Y.
enterocolitica in drinking water are more commonly non-pathogenic strains, probably of
environmental origin.
In 2005, 9660 cases were recorded in EU countries with an overall incidence rate of 2.23 per
100 000. From 1995 to 2004, the incidence rates were relatively stable or slightly rising with two
clear peaks in 1998 and 2002. The main affected age group are children younger than 4 years of
age. There is no clear seasonality, but a slightly higher number of cases in the second half of the
year (European disease epidemiological report, 2007).
Although most Yersinia spp. detected in water are probably non-pathogenic, circumstantial
evidence has been presented to support transmission of Y. enterocolitica to humans from untreated
drinking water. But since Yersinia is sensitive to disinfection processes, protection of raw water
Page 19
Introduction______________________________________________________________________ 18
supplies from human and animal waste and adequate disinfection minimizes the presence of
Yersinia in water supplies.
E. Opportunistic Enterobacteriaceae
Many Enterobacteriaceae have only marginal pathogenicity. They are classical opportunists.
Usually harmless for healthy people, they can occasionally cause fatal infections in patients with
underlying diseases, predominately in hospitals. Infections caused by such species are urinary and
respiratory tract infection, wound infections, infections of the skin and subcutis and sepsis. In
germs associated with hospitals, resistance against antibiotics is common, and multidrug resistance
has often been observed. Typical species are Citrobacter, Klebsiella, Enterobacter, Serratia,
Proteus, Morganella, Providencia.
1.1.2 Campylobacter
The genus Campylobacter includes many species of which Campylobacter jejuni, C. fetus and to a
lesser extend C. coli and C. lari are of medical importance.
Campylobacter species are small, spiral, Gram-negative rods. They have one flagellum at one or
both poles which enable their rapid, darting motility. Campylobacter grows in microaerophilic
conditions (5% oxygen, 10% CO2). It is the most common cause of bacterial enteritis in
industrialized countries and the most frequently reported zoonosis. Amongst all Campylobacter
species, C. jejuni is the most important (90–95% of all Campylobacter infections). About 1000
organisms can cause infection. Campylobacter species readily take up naked DNA from their
surroundings and as a consequence are genetically diverse.
Pathogenesis
Germs are taken up orally. Incubation time is 2–5 days. Typical disease patterns are watery or
sometimes bloody diarrhoea, accompanied by abdominal pain and fever, nausea and sometimes
vomiting. The infection is usually self-limiting after a few days and hospitalization is only
Page 20
Introduction______________________________________________________________________ 19
necessary in very severe cases. However, 1 or 2 weeks after the onset of the disease, two different
relapses may occur in the form of reactive (aseptic) arthritis or, rarely, the potentially fatal
Guillain-Barré syndrome, a post-infective polyneuropathy (acute demyelinating disease of the
peripheral nerves).
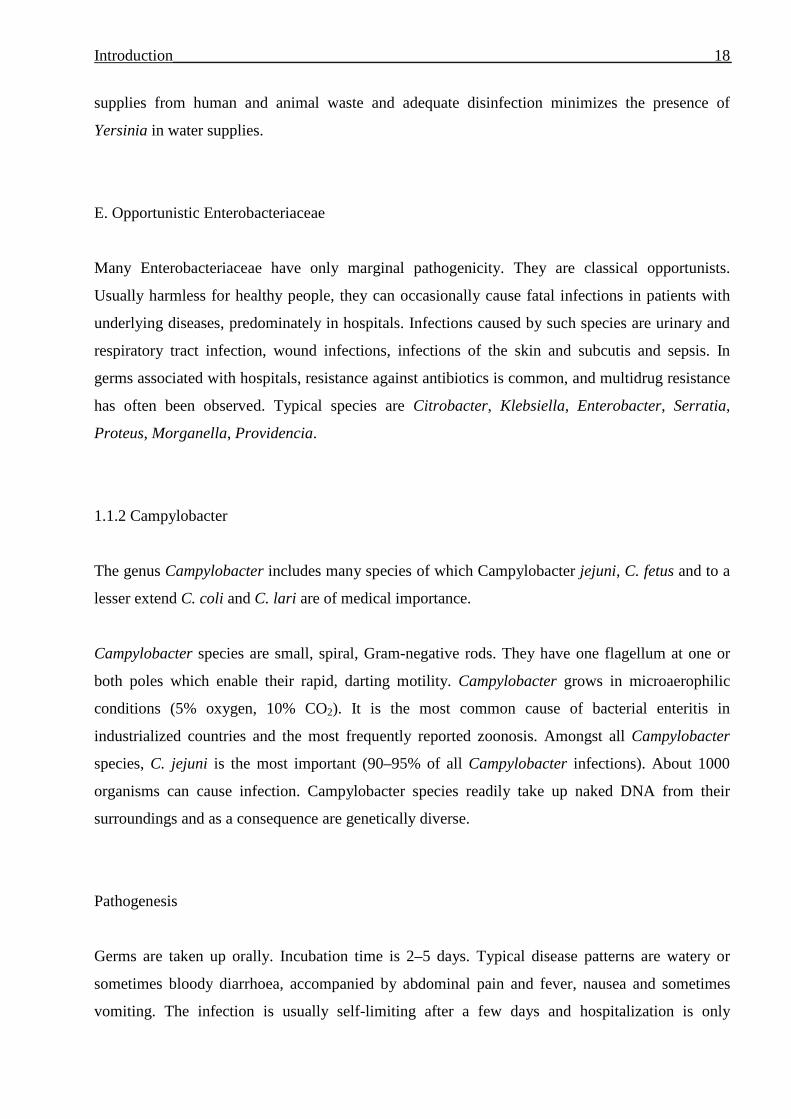
It is primarily the jejunum and ileum that are colonized, with occasional extension into the colon
and rectum. The bacteria produce a cytotoxin, translocate directly across the cell layer or invade
host cells (Figure 1.6). Subsequent cell damage stimulates an inflammatory response. Bacteria are
still detectable in stool samples weeks after recovery.
Figure 1.6: Campylobacter pathogenesis
Virulence factors
Campylobacter species produce an enterotoxin and several cytotoxins. They have a capsular
polysaccharide which acts as an epitope for antibody production. This epitope is thought to initiate
Guillain-Barré syndrome. Antibodies cross-react with myelin of peripheral nerves.
Epidemiology
Campylobacter is transmitted from animals to humans by oral uptake of contaminated food and
water. Other routes of transmission are direct contact with infected animals and smear infection
between humans. Swimming in natural surface waters is also a risk factor. The main reservoirs are
animals, especially wild birds, poultry and cattle. The main sources of infection are meat,
Page 21
Introduction______________________________________________________________________ 20
unpasteurized milk and contaminated water. Campylobacter does not multiply in food. Occurrence
of germs in the environment is strongly dependent on rainfall and waterfowl. Contaminated
drinking water supplies have been identified as a significant source of outbreaks of
campylobacteriosis.
Campylobacteriosis shows a clear seasonality, with a peak in August (Figure 1.7). The incidence in
14 EU countries, Norway and Iceland increased between 1995 (85 000 cases) to 2002–2004
(180 000–190 000 cases) (Figure 1.8).
Source: The first European communicable disease report
Figure 1.7: Incidence rate of campylobacteriosis cases in EU and EEA/EFTA countries by year reported, 1995–2004
Source: The first European communicable disease report
Figure 1.8: Distribution of salmonellosis cases by month, for selected European countries, 2005 (n = 28145)
Page 22
Introduction______________________________________________________________________ 21
The highest incidence is in children younger than 4 years of age (European disease epidemiological
report, 2007). In developing countries the disease is hyperendemic.
1.1.3 Pseudomonas
Pseudomonads are Gram-negative, aerobic, non-fermenting rods. They are motile and have one or
two polar flagella. Pseudomonads are opportunistic human pathogens and usually cause
nosocomial diseases and diseases in people with predisposing factors, in immunocompromised
patients (AIDS, leukaemia, neutropenia) and in patients consuming immunosuppressive medicine.
In healthy people, infections are very rare and only mild.
Pseudomonads are ubiquitous in wetlands (soil, surface water, sewage, oceans, on plants), in faeces
and in small amounts in the gut of humans and animals. The clinically most important species is
Pseudomonas aeruginosa. This is due to several reasons:
• good adaptability
• innate resistance to many antibiotics and disinfectants
• many virulence factors
Pathogenesis
The pathogenesis of P. aeruginosa is very complex. It usually enters the body through damaged
sites. The germ adheres to host cells via adhesive pili. From the point of entry, the germ invades
the body. P. aeruginosa can infect almost any external site or organ.
There are several disease patterns caused by an infection with P. aeruginosa, depending on site of
entry and the host's immunocompetence. These patterns are colonization of wounds and burns,
post-operative wound infections, infection of the urinary tract, ears (otitis externa) and eyes, sepsis,
endocarditis in drug addicts, pneumonia in patients with cystic fibrosis, and septicaemia and
meningitis in infants.
Virulence factors
P. aeruginosa has many virulence factors:
Page 23
Introduction______________________________________________________________________ 22
• exotoxin A (ADP-ribosyltransferase): blocks translation by inactivation of elongation factor
EF2
• exoenyme S (ribosyltransferase): inactivates cytoskeleton proteins of eukaryotic cells
• cytotoxin: damages cells by making pores in the cell membrane
• several metal proteases: hydrolysing elastin, collagen, laminin
• two phospholipases C: membrane active
Epidemiology
P. aeruginosa is able to proliferate in wet environments with poor life conditions. Thus there are
many sources of infection in hospitals, bathrooms and kitchens — washbasins, toilets, cosmetics,
air conditioners, inhalers, respirators, anaesthetic machines, dialysis machines — but also in
swimming pools and spas. Primary sources may also be infected patients and germ carriers.
P. aeruginosa is resistant to many disinfectants and antiseptics commonly used in hospitals. It may
even multiply in such liquids. Healthy carriers usually harbour strains in the gastrointestinal tract.
But in the community, the carriage rate seldom exceeds 10%.
Transmission may occur directly via medical staff or indirectly via contaminated apparatus. The
presence of germs in dust and eschar shed from burns suggests that infection can be airborne.
Severely burned patients and those with chest injuries that require artificial ventilation are very
susceptible. Pulmonary infection frequently precedes septicaemia, which is often fatal. Eye
infections may occur via contaminated lenses or by use of contaminated medicine during
ophthalmic procedures. Ear infections or folliculitis (jacuzzi rash) may occur during use of poorly
maintained whirlpools, where the warm and aerated conditions are perfect for P. aeruginosa.
Epidemics of gastrointestinal infection can occur in newborn and young infants in paediatric wards
as a result of contaminated milk feeds. Infections in infants include septicaemia and meningitis.
It is easier to prevent than to cure infections with P. aeruginosa. Preventive measures include very
good disinfection of surgical materials and surfaces, avoiding admittance of high-risk patients to
wards where P. aeruginosa infections have recently occurred, no use of multidoses of creams or
drops for several patients. Once P. aeruginosa has gained access to the hospital environment it is
difficult to eradicate.
Page 24
Introduction______________________________________________________________________ 23
1.2. Virology
1.2.1 Norovirus
Noroviruses (genus Norovirus, family Caliciviridae) are a group of related, single-stranded RNA,
non-enveloped viruses that cause acute gastroenteritis in humans. Norovirus was recently approved
as the official genus name for the group of viruses provisionally described as 'Norwalk-like viruses'
(NLVs). They are 35–40 nm in diameter und their surface shows typical cup-like cavities (calyx =
cup) which can be seen under electron microscopy.
Until recently, norovirus could only be detected by electron microscopy, but the diagnosis of
norovirus as a cause of outbreaks of acute gastroenteritis has improved with increasing use of the
reverse transcriptase-polymerase chain reaction (RT-PCR). This method detects the norovirus
RNA and can be used to test stool as well as environmental samples. Norovirus cannot be
propagated in cell culture systems.
The genus Norovirus has two different clades: genogroup 1 and genogroup 2 (Vinjé et al., 1997).
Pathogenesis
The viruses are excreted by faeces and in vomit. Routes of transmission are person-to-person
contact, inhalation of contaminated aerosols, dust particles or airborne particles of vomit, ingestion
of contaminated water and food (often shellfish harvested from contaminated waters). Replication
takes place in the jejunum. Villi become broadened and blunted, enterocytes become cuboidal and
vacuolated. Incubation time is 12–72 hours. The disease is self-limiting and practically no
mortality has been reported (Dijuretic and al., 1996). Symptoms are nausea, vomiting and
abdominal cramps. Diarrhoea occurs in 40–100% of cases depending on the isolate. Some patients
have fever, chills, headache and muscular pain. Diarrhoea is more frequent in adults, while
vomiting is more often described in children and infants (Lodder et al. 1998). Symptoms are
generally mild, and hospitalization is seldom required. The disease can be asymptomatic.
Page 25
Introduction______________________________________________________________________ 24
Epidemiology
The disease occurs worldwide in all age groups, but predominately in infants, schoolchildren and
elderly people. Together with rota- and adenoviruses, noroviruses are the most common viral
enteritis-causing agents. The disease is suggested to be underreported due to mild symptoms and
the asymptomatic course of the disease.
Humans are considered to be the only source of human-infectious species, although subclinical
infection and excretion of contaminated faeces of primates have been described.
Human caliciviridae often cause small epidemics, usually in winter. Since vomiting is often a main
symptom, the disease is also called 'winter-vomiting disease'.
Many outbreaks have been linked to contaminated drinking water supplies.
Studies indicate that excreted viruses can remain viable for several years and that the infectious
dose is 10–100 particles. Due to these low infection doses, minor contamination of hands, work
surfaces, taps, carpets etc. can be a major source of infection.
Asymptomatic excretion of noroviruses is not uncommon. Such individuals may serve as an
important reservoir of infection, particularly in hospitals or catering services.
1.2.2 Rotavirus
Rotaviruses belong to the family Reoviridae, together with coltiviruses, orthoreoviruses and some
genera infectious for plants and animals. Reovirus is an abbreviation for 'respiratory enteric orphan
virus', meaning that no disease could be associated with the virus after its discovery.
Members of the genus Rotavirus consist of 11 segmented, double-stranded RNA strands, each
strand coding for one protein. They have a non-enveloped, icosahedral capsid with a diameter of
50–65 nm. The capsid is surrounded by a double-layered shell, giving the virus the appearance of a
wheel — hence the name rotavirus. The diameter of the entire particle is about 80 nm.
Rotaviruses are serologically divided into seven groups, A–G, each with several subgroups.
Groups A–C are infectious for humans, group A being the most important. Groups D–G infect a
wide spectrum of animals.
Page 26
Introduction______________________________________________________________________ 25
Pathogenesis
Human rotaviruses (HRVs) are transmitted by the faecal-oral route. One patient excretes up to 1011
particles in only 1 g of faeces. Excretion periods last approximately 8 days. The most important
transmission routes are person-to-person contact and inhalation of airborne HRVs or aerosols
containing the virus. Ingestion of contaminated food and water plays a less important role, but
outbreaks due to these sources have been described. The virus infects cells in the villi of the small
intestine where it disrupts the transport of sodium and glucose. Acute infection has an abrupt onset
of severe watery diarrhoea with fever, abdominal pain and vomiting. Dehydration and metabolic
acidosis may develop. The disease may be fatal if not treated appropriately.
Epidemiology
Due to the high number of excreted particles in stools, domestic sewage and environments polluted
by human faeces are likely to contain large numbers of HVRs. Viruses have been detected in
sewage, rivers, lakes and treated drinking water.
The presence of HRVs in drinking water constitutes a public health risk, even if transmission by
ingestion is not the most common route. There is some evidence that rotaviruses are more resistant
to disinfection than other enteric viruses.
HRVs are the most frequent pathogen for diarrhoea in children from 6 months to 2 years of age.
However, they also play a role in elderly people.
In developing countries, diarrhoeal diseases are the most common cause of death in children, and
20% of all these cases are due to rotaviruses. In industrialized countries, HRVs play a role in
hospitals and in children's homes, primarily in winter. They can persist for a long time on surfaces
and skin (hands) and are therefore very easily transmitted. The best prophylaxis is meticulous
hygiene.
1.3 Protozoology
The information here for Gardia spp. has been taken from Melanie Wiki, 2006 (A new method for
detection of Gardia lamblia and its application in monitoring surface water), that concerning
Page 27
Introduction______________________________________________________________________ 26
Cryptosporidium spp. from Sandra Ruchti, 1999 (Zur Epidemiologie von Cryptosporidium sp.:
Oocysten-Dichten in Oberflächen-, Roh-, und Trinkwasser im Lützeltal (Bl/So)).
Protozoans are eukaryotic, unicellular, heterotrophic organisms which often have a parasitic life
cycle. Typical for many protozoans is the ability to build cysts or oocysts, which enable them to
survive for a long time in the environment, withstanding dryness, high temperatures and other
inhospitable conditions.
1.3.1 Gardia lamblia
Gardia lamblia is a flagellated parasite of the small intestine causing lamblia dysentery. The
parasite is found worldwide with different prevalence rates. Parasites are excreted as a cyst in high
numbers in human or animal faeces. These cysts can survive for several months in cold water and
are relatively resistant to environmental dehydration.
Together with Cryptosporidium and E. coli, Gardia is the most common pathogen identified as
causing human infections through contaminated drinking and surface water.
Pathogenesis and disease pattern
Parasites are taken up orally. Less than 10 cysts can cause disease. The incubation time is usually
1–2 weeks, but can vary from 1 to 45 days. The parasites manifest in the small intestine, where
they cause inflammation and disturb resorption. The pathogenesis is unclear, but they probably
produce toxin-like proteins. Symptoms are diarrhoea, abdominal pain, vomiting, signs of
malabsorption and loss of weight. The disease can be acute, chronic or asymptomatic. The parasite
is often eliminated spontaneously after a few weeks. In asymptomatic and chronic cases, the
parasite can persist for many years inside the intestine. Chronic cases may endure for many years.
Epidemiology
Routes of transmission are faecal-oral by direct contact of humans with other humans or animals,
or indirectly via contaminated food or water.
Page 28
Introduction______________________________________________________________________ 27
Most frequent risks are swimming in surface water, uptake of contaminated water or travelling to
endemic areas.
Parasites are found worldwide. In Europe the average prevalence rate is 3–4%. In developing
countries, it is up to 50%. In both cases, rates can vary regionally.
Humans are the main host but there are several animal reservoirs, predominately mammals (cattle,
sheep, dog).
Males have a significantly higher risk for acquisition than females. The disease is very common in
children in developing countries and in day care centres in industrialized countries.
Reports about seasonality vary, and increases have been recorded in both summer and winter.
In chronic and asymptomatic cases, cysts are excreted in faeces for a long time in high numbers.
Due to the parasite’s resistance in the environment, infected patients contribute to a high
environmental contamination and a problem for public health.
1.3.2 Cryptosporidium parvum
Cryptosporidiosis is a zoonosis with a large animal reservoir. Parasites have been identified in
more than 70 mammals, including pets (dog, cat), livestock (cattle, sheep, goat, pig) and wild
animals (deer, badger, fox). Parasites form oocysts which are excreted in human or animal faeces.
These oocysts can survive in cool water for months and are resistant to normal concentrations of
chloride and ozone in water supply systems. They are, however, immobilized by UV and destroyed
by warm water (70°C for a few minutes).
Pathogenesis and disease pattern
Parasites are taken up orally. Thirty to 100 oocysts can cause disease. The incubation time is 5–28
days. They manifest in the small intestine where they destroy microvilli and cause infiltration of
mucosa into cells. Symptoms are watery, mucous, seldom bloody diarrhoea, rapid weight loss,
dehydration, nausea and headache. The disease is usually latent or self-limiting, lasting 1–26 days
with mild symptoms. In HIV and immunocompromised patients, the disease can be very strong,
chronic and occasionally fatal, with serious cholera-like diarrhoea, nausea, vomiting, fever and
abdominal pain. Parasites are excreted in faeces for a long time.
Page 29
Introduction______________________________________________________________________ 28
Epidemiology
Route of transmission is faecal-oral by direct contact of humans with humans or animals, or
indirectly through drinking water and food.
The disease is found worldwide and is considered as one of the 'emerging diseases'. In
industrialized and developing countries, the general prevalence rate is 2% and 6%, respectively, for
HIV patients it is 14% and 24–50%, respectively. Young calves have a prevalence rate of 20–
100%.
Outbreaks have been associated with contaminated water (drinking water, surface water,
swimming pools and public supply systems).
There is no chemoprophylaxis. The best prophylaxis is good hygiene for excreters.
1.4 Micro-organisms in water: Initial position
A wide range of micro-organisms (viruses, bacteria, protozoa) and macro-organisms (helminths)
are found in watery environments such as surface water (Tougianidou et al. 1998), groundwater
and soil. Most of them are unidentified and not infectious. However, some of them are infectious
and are transmitted between humans via contaminated water or food. These food- and waterborne
pathogens can cause various diseases in humans, e.g. gastrointestinal or respiratory diseases or
infections of the skin and damaged sites.
According to the World Health Organization (WHO), gastrointestinal infectious diseases are
among the most important infectious and parasitic diseases worldwide. With an estimated 1.8
million deaths a year and 62 million disability-adjusted life years (DALYs), they follow directly on
respiratory infectious diseases and HIV/AIDS and cause greater mortality than malaria and
tuberculosis.
These germs are often distributed in human excretions, e.g. faeces or urine, and released into water.
Many micro-organisms can survive for a long time in surface water and groundwater without
proliferation. If their numbers exceed a critical value, they can become dangerous for the health of
people using these waters. Infections can be contracted after ingestion of contaminated water
during swimming and other activities.
In developing countries without a system for the distribution of clean drinking water, such
pathogens are a severe public health problem, because people use surface waters directly as
Page 30
Introduction______________________________________________________________________ 29
drinking water, for doing their laundry, for spending free time, to wash and as a toilet. Waterborne
pathogens can therefore spread easily between humans. In addition, such populations usually do
not have facilities to clean sewage, and the dirty water flows directly into rivers and lakes, thus
contaminating it with microbes from faeces or household waste.
In industrialized countries with an officially organized water supply, drinking water is processed
before it is distributed. Nevertheless, problems with surface water remain, although their
dimensions differ to those in developing countries. Since we do not drink from surface waters
directly, recreational activities pose the major risk factor. Swimming and diving with accidental
ingestion of water or pathogen contact with damaged body sites can lead to infection with
waterborne micro-organisms (Schijven et al. 2006). A number of outbreaks due to surface water
have been described in North America and Europe (Lee et al. 2002; C. Furtado et al. 1998; Bocca
et al. 2002), including Switzerland (Maurer A.D., Sturchler D., 2000).
According to the BAG report, there are an increasing number of food-related und waterborne
diseases during the summer. Most of these infections are caused by barbeques e.g. due to
insufficiently grilled meat or unhygienic handling of food, but little is known about the impact of
surface water.
The human environment (cities and villages, farms, camping places, sewage cleaning plants) has a
great influence on the microbiological quality of water.
Part A: Surface water
With a high population density in Switzerland, the country's surface waters are greatly influenced
by the human environment. In general, intense water use and garbage, infected livestock such as
calves and lambs, dunging with manure and sewage cleaning plant (SCP) drains can lead to
contamination with zoonotic and anthropzoonotic micro-organisms (Lodder et al 2005, Rose et al.
1998). SCPs have a particularly large effect. Sewage from households and industry, as well as
water from the environment, flows into these plants, accumulating huge masses of waste and
micro-organisms. Since SCPs release cleaned water into rivers and lakes but do not filter out
micro-organisms from sewage, these waters may have a higher contamination with micro-
organisms than waters without SCP input. Thus swimming areas in surface waters close to SCPs
are possibly more burdened with pathogens and may be hazardous to human health.
Following rainfall, environmental micro-organisms may be washed into surface waters. Soil,
animal faeces (livestock and wild animals) or garbage are possible sources. Another possible
Page 31
Introduction______________________________________________________________________ 30
source are SCPs. Since many plants do not have the capacity to clean all the additional rainwater,
the plants overflow and sewage drains off directly into surface waters uncleaned, contaminating
them with garbage and micro-organisms (Balayan M S. 1997).
Effluents from SCPs are believed to have the strongest influence on microbiological water quality,
and water quality improves as one moves further downstream from an SCP: after several hundred
meters, the downstream quality should again be good enough for recreational activities.
In Switzerland the microbiological qualities of surface waters and bathwaters are classified in four
ranges, A–D. Each range is defined by specific amounts of E. coli per 100 ml of water as an
indication of faecal pollution. The presence or absence of Salmonella is additionally indicated. For
each classification, there are recommendations concerning usage of described waters (see table
3.11, page 62).
Drainage of settlement areas
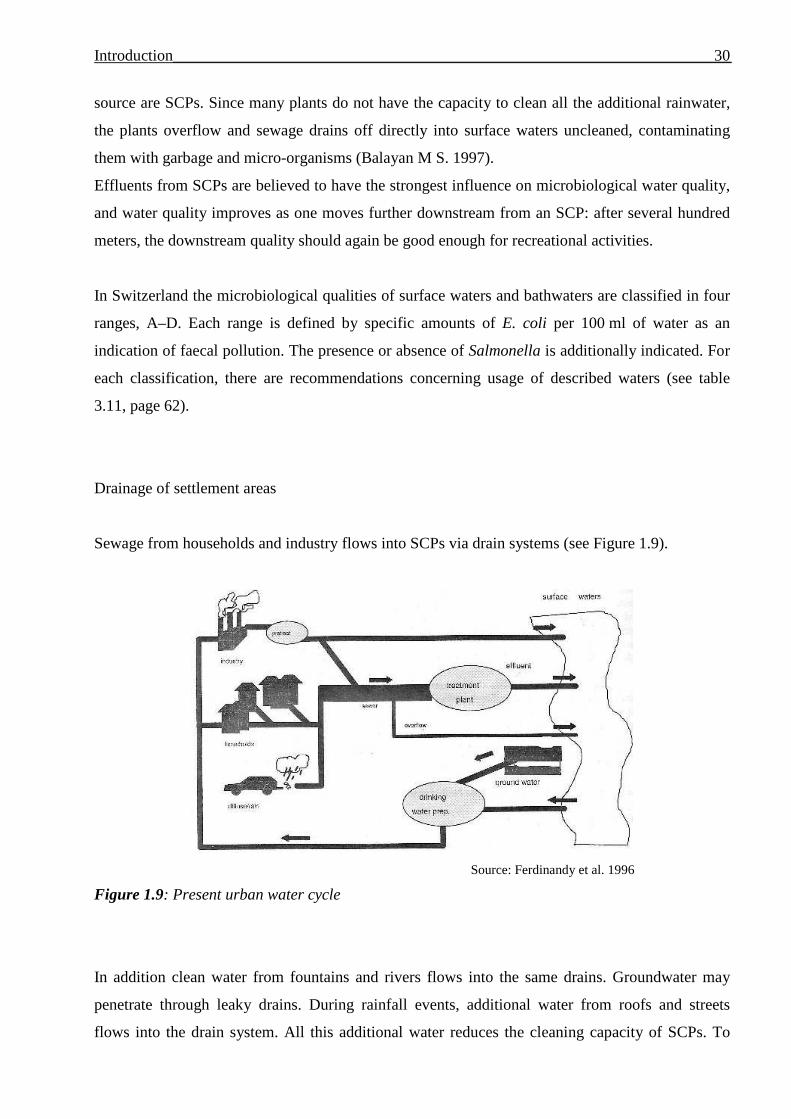
Sewage from households and industry flows into SCPs via drain systems (see Figure 1.9).
Source: Ferdinandy et al. 1996
Figure 1.9: Present urban water cycle
In addition clean water from fountains and rivers flows into the same drains. Groundwater may
penetrate through leaky drains. During rainfall events, additional water from roofs and streets
flows into the drain system. All this additional water reduces the cleaning capacity of SCPs. To
Page 32
Introduction______________________________________________________________________ 31
protect drains and plants from these masses of water, overflows are integrated into the drain
systems (mixed water drains). If the water amount exceeds the drain’s capacity, the additional
water flows over into secondary drains which lead directly into surface waters.
These discharging systems pollute surface waters strongly. There are several options to reduce this
pollution. In new buildings, rainwater and sewage can be separated into different drains. These
rainwater drains lead directly into surface waters. The same drains can be used for water from the
streets.
In existing drain systems and SCPs, mixed water pools can be installed. Additional water flows
over into these pools instead of surface waters, and gets pumped back when the water amount
reduces.
However, planning and installation of such systems needs time and money, and there are not yet a
sufficient number of such systems to disburden surface waters from sewage.
SCP operating mode
Common SCPs in Switzerland use three different methods for cleaning waste water: mechanical
cleaning, biological cleaning and chemical cleaning.
Mechanical cleaning
In a first step, raking systems of different sizes remove solid and large materials such as leftovers,
toilet articles and other wastes.
In a sand trap, heavy material and sand settle down and are removed. In the following pre-cleaning
pool, the flow rate slows down. Small materials settle down and are removed. Materials floating on
the surface are removed by a surface broach.
Biological cleaning:
In an aerated pool, bacteria clean the water in two steps.
First step: organic material is decomposed and ammonia is metabolized to nitrate (nitrification).
The pool is aerated so that the bacteria receive enough oxygen.
Second step: Bacteria metabolize nitrate to nitrogen. For this step no aeration is needed.
Page 33
Introduction______________________________________________________________________ 32
Chemical cleaning:
Phosphate must be removed from sewage. Metal salts (iron sulphate or aluminium chloride) are
added to which phosphates bind. The bound phosphate precipitates into the sewage sludge.
In the post-cleaning pool, bacteria settle down with sludge. Floating sludge is removed with a
surface broach. The clean water flows over the pool rim and is drained into local rivers or lakes.
Part B: Groundwater and drinking water
Switzerland is the moated castle in Europe. Every year there is an average rainfall of 60.1 m3 of
water, 13.1 billion m3 accrue from foreign countries and 20 billion m3 evaporate back to the
atmosphere. All in all, 262 000 million m3 of water reserves are stored in Switzerland (lakes,
glaciers, groundwater, dams and rivers), of which 1 billion m3 is processed for drinking water
every year. Twenty percent comes from surface waters and to 40% each from source waters and
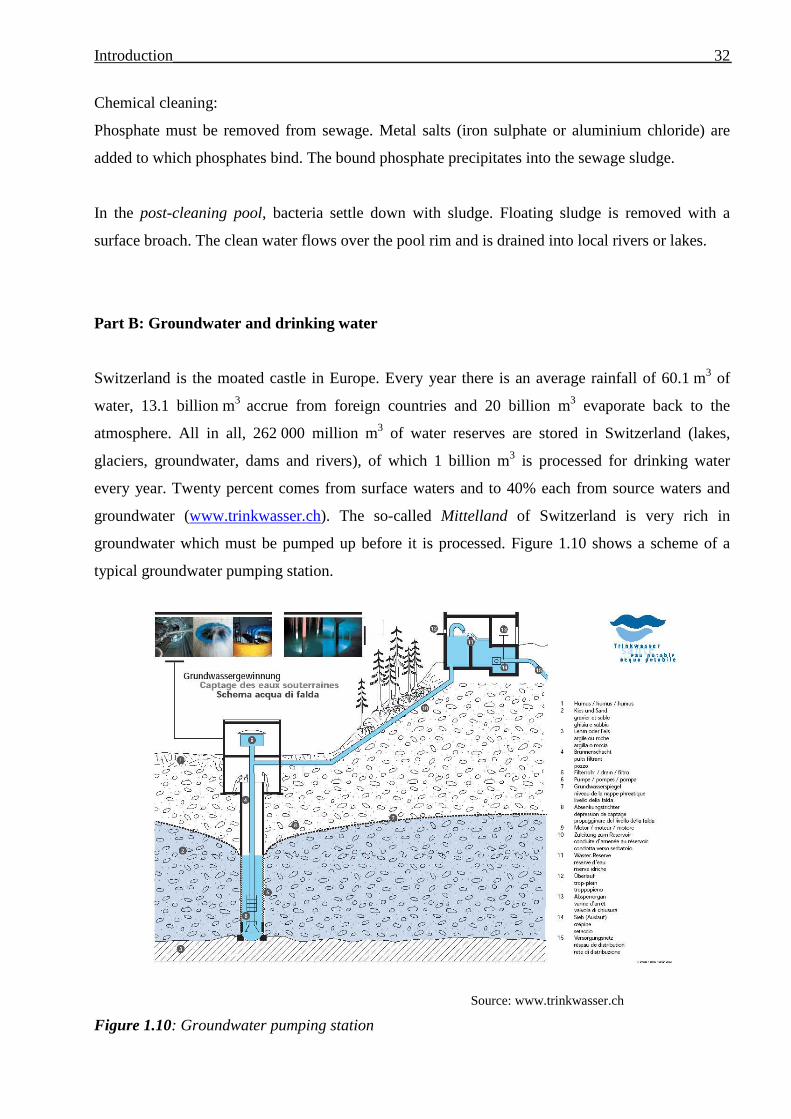
groundwater (www.trinkwasser.ch). The so-called Mittelland of Switzerland is very rich in
groundwater which must be pumped up before it is processed. Figure 1.10 shows a scheme of a
typical groundwater pumping station.
Source: www.trinkwasser.ch
Figure 1.10: Groundwater pumping station
Page 34
Introduction______________________________________________________________________ 33
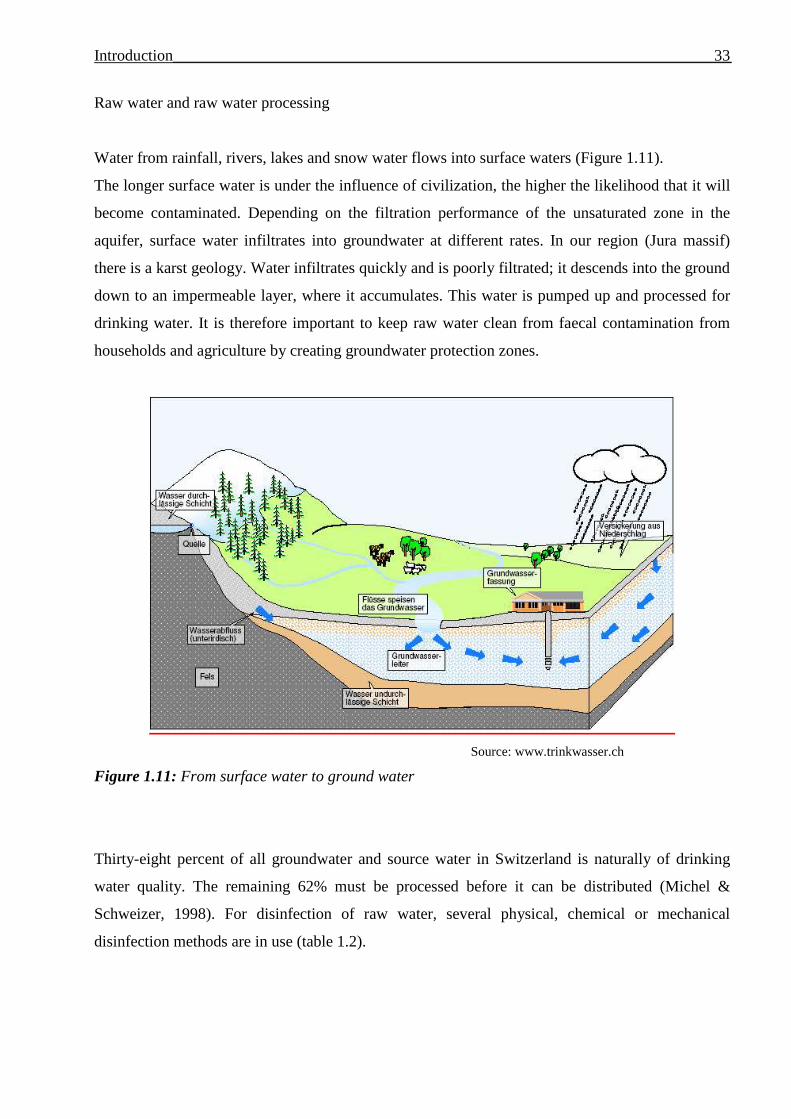
Raw water and raw water processing
Water from rainfall, rivers, lakes and snow water flows into surface waters (Figure 1.11).
The longer surface water is under the influence of civilization, the higher the likelihood that it will
become contaminated. Depending on the filtration performance of the unsaturated zone in the
aquifer, surface water infiltrates into groundwater at different rates. In our region (Jura massif)
there is a karst geology. Water infiltrates quickly and is poorly filtrated; it descends into the ground
down to an impermeable layer, where it accumulates. This water is pumped up and processed for
drinking water. It is therefore important to keep raw water clean from faecal contamination from
households and agriculture by creating groundwater protection zones.
Source: www.trinkwasser.ch
Figure 1.11: From surface water to ground water
Thirty-eight percent of all groundwater and source water in Switzerland is naturally of drinking
water quality. The remaining 62% must be processed before it can be distributed (Michel &
Schweizer, 1998). For disinfection of raw water, several physical, chemical or mechanical
disinfection methods are in use (table 1.2).
Page 35
Introduction______________________________________________________________________ 34
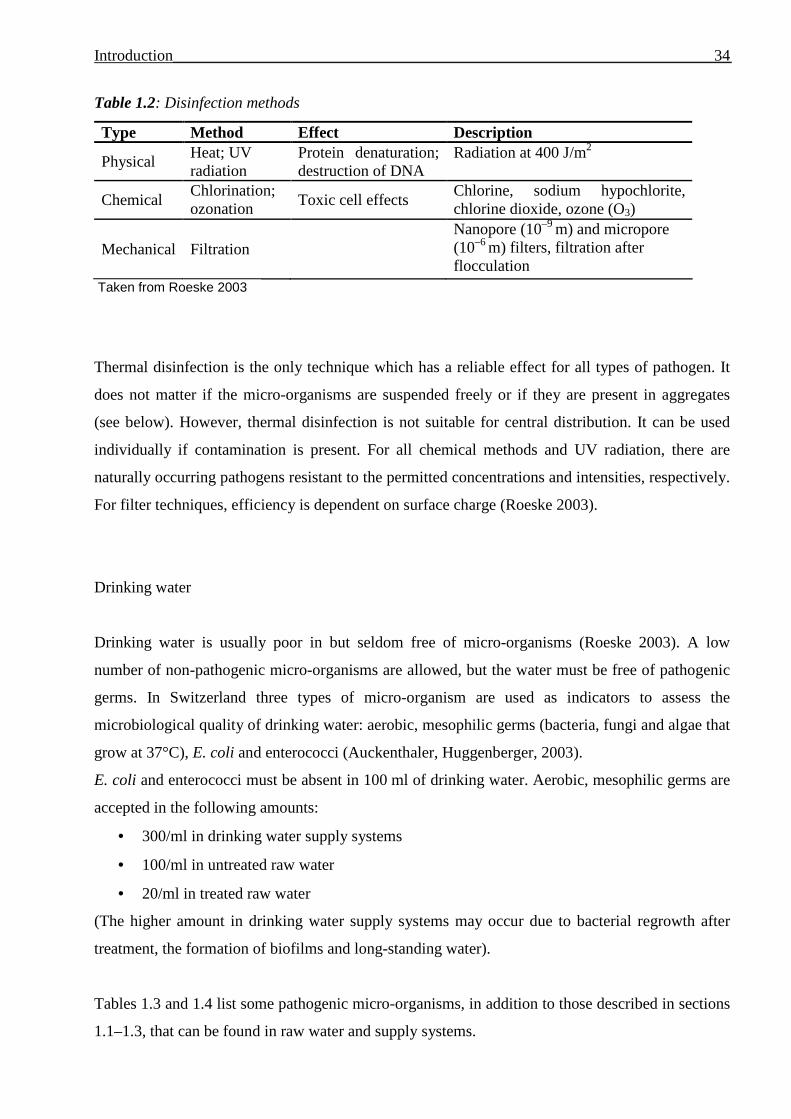
Table 1.2: Disinfection methods
Type Method Effect Description
Physical Heat; UV radiation
Protein denaturation; destruction of DNA
Radiation at 400 J/m2
Chemical Chlorination; ozonation
Toxic cell effects Chlorine, sodium hypochlorite, chlorine dioxide, ozone (O3)
Mechanical Filtration Nanopore (10–9 m) and micropore
(10–6 m) filters, filtration after flocculation
Taken from Roeske 2003
Thermal disinfection is the only technique which has a reliable effect for all types of pathogen. It
does not matter if the micro-organisms are suspended freely or if they are present in aggregates
(see below). However, thermal disinfection is not suitable for central distribution. It can be used
individually if contamination is present. For all chemical methods and UV radiation, there are
naturally occurring pathogens resistant to the permitted concentrations and intensities, respectively.
For filter techniques, efficiency is dependent on surface charge (Roeske 2003).
Drinking water
Drinking water is usually poor in but seldom free of micro-organisms (Roeske 2003). A low
number of non-pathogenic micro-organisms are allowed, but the water must be free of pathogenic
germs. In Switzerland three types of micro-organism are used as indicators to assess the
microbiological quality of drinking water: aerobic, mesophilic germs (bacteria, fungi and algae that
grow at 37°C), E. coli and enterococci (Auckenthaler, Huggenberger, 2003).
E. coli and enterococci must be absent in 100 ml of drinking water. Aerobic, mesophilic germs are
accepted in the following amounts:
• 300/ml in drinking water supply systems
• 100/ml in untreated raw water
• 20/ml in treated raw water
(The higher amount in drinking water supply systems may occur due to bacterial regrowth after
treatment, the formation of biofilms and long-standing water).
Tables 1.3 and 1.4 list some pathogenic micro-organisms, in addition to those described in sections
1.1–1.3, that can be found in raw water and supply systems.
Page 36
Introduction______________________________________________________________________ 35
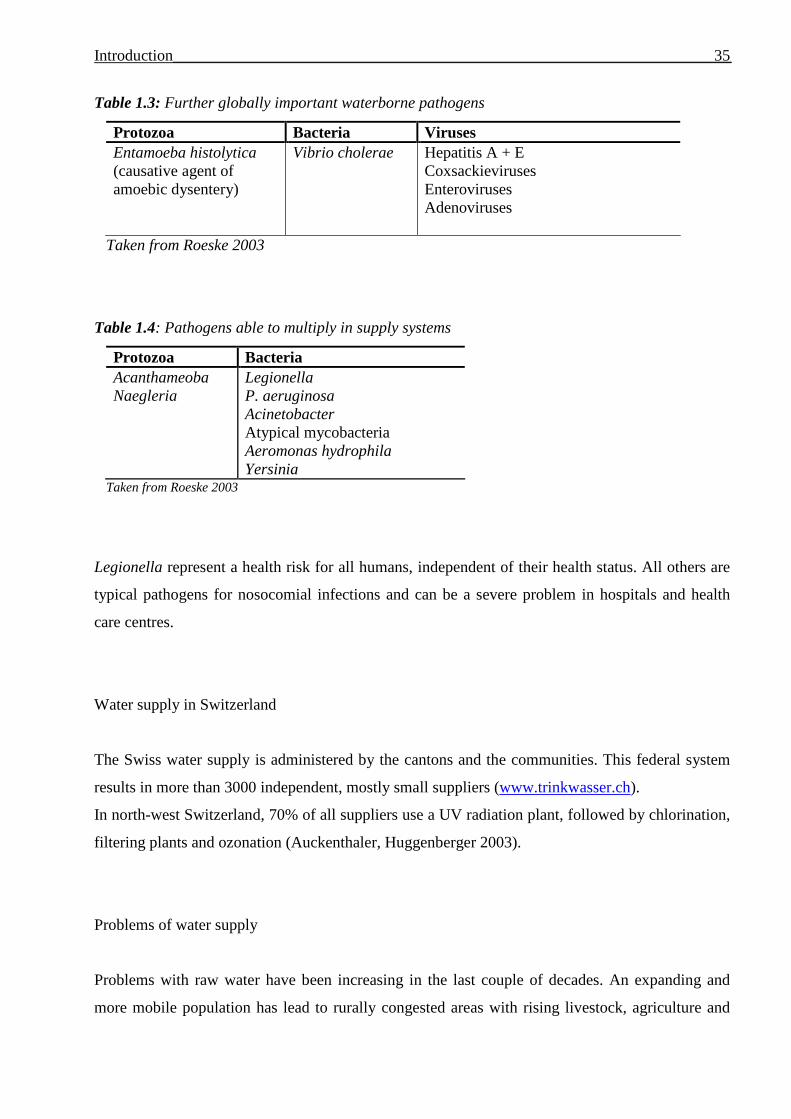
Table 1.3: Further globally important waterborne pathogens
Protozoa Bacteria Viruses Entamoeba histolytica (causative agent of amoebic dysentery)
Vibrio cholerae
Hepatitis A + E Coxsackieviruses Enteroviruses Adenoviruses
Taken from Roeske 2003
Table 1.4: Pathogens able to multiply in supply systems
Protozoa Bacteria Acanthameoba Naegleria
Legionella P. aeruginosa Acinetobacter Atypical mycobacteria Aeromonas hydrophila Yersinia
Taken from Roeske 2003
Legionella represent a health risk for all humans, independent of their health status. All others are
typical pathogens for nosocomial infections and can be a severe problem in hospitals and health
care centres.
Water supply in Switzerland
The Swiss water supply is administered by the cantons and the communities. This federal system
results in more than 3000 independent, mostly small suppliers (www.trinkwasser.ch).
In north-west Switzerland, 70% of all suppliers use a UV radiation plant, followed by chlorination,
filtering plants and ozonation (Auckenthaler, Huggenberger 2003).
Problems of water supply
Problems with raw water have been increasing in the last couple of decades. An expanding and
more mobile population has lead to rurally congested areas with rising livestock, agriculture and
Page 37
Introduction______________________________________________________________________ 36
water consumption. Groundwater intakes are often close to agricultural areas, protection zones are
often not well located (Auckenthaler, Huggenberger 2003) and sewage sludge is often used as
manure, introducing viruses into farmland (Baumgartner 2001). From 1973 to 1997, 21 new
pathogenic germs were discovered (Sonntag, 1997).
Processing plants have often not adjusted to this new situation and small suppliers do not have the
financial potential to maintain processing plants in state-of-the-art condition. Highly technical
processes have not been adapted to suit small suppliers.
Despite good processing of raw water, pathogenic micro-organisms sometimes reach distribution
systems, leading to small epidemics (Swerdlov et al. 1992, Beller et al. 1997, Maurer & Stürchler
1998, Häfliger et al. 2000). There may be several sources and causes of such outbreaks.
Germs in water may be freely suspended or form aggregates (bound to particles, surrounded with
slime or mucus). Most freely suspended micro-organisms are easily eliminated by singe-stage
processing. Elimination of aggregated micro-organisms is more difficult. Chemical disinfection
and UV radiation are not strong enough to kill germs beneath the surface. For them, filtration is the
best method.
Some micro-organisms build a biofilm after they have bound to a surface and started to multiply.
This biofilm is a protective layer of extracellular substances, anorganic substances and dead
organic material. Micro-organisms can spread out of such biofilms. They are a problem if present
in supply systems.
Single-stage processing (UV, chlorination, ozonation) are usually sufficient for clear groundwater.
The situation becomes more complicated if germs are present that can only be eliminated by
combined processing (filtration, activated carbon), or if fluctuations in turbidity occur (which is
typical for the karst geology in jura massif). Chlorination and ozonation cannot disinfect
aggregates and UV is only suitable when turbidity is less than 1 FNU (see chapter 2.1.2., part
‘further parameters’).
Problems with control systems
The microbial quality of raw water and drinking water is determined by the presence or absence of
indicator organisms. In raw water there is a correlation between pathogenic germs and the density
of indicator organisms. The more indicators are present, the higher the likelihood that pathogens
will be present. If there is a high density of indicators in raw water, disinfection can be
Page 38
Introduction______________________________________________________________________ 37
strengthened by use of more chemicals, or the supply can be halted until the quality has improved
naturally.
For drinking water, the correlation no longer holds. Indicator organisms are often eliminated easily
by single-state processing. The absence of indicator organisms in drinking water does not prove
that there are no pathogens present. Viruses and protozoa are more resistant to disinfection
methods and can reach the distribution system, leading to epidemics (MacKenzie et al., 1994;
Häfliger et al., 2000; Gornik et al., 2000).
1.5 Significance, aims, objectives
Surface waters are widely used for recreational activities. Quality controls occasionally indicate
that these places are contaminated with Salmonella. This bacterium can originate from inflows,
SCPs or humans themselves. According to the BAG report, there are an increasing number of
food-related and waterborne diseases during the summer. It is believed that some of these cases are
caused by contact and ingestion of contaminated surface water from bathing places.
Little is known about the influence of SCPs and rainy events on the microbiological quality of
surface waters. Two hypotheses were tested in this survey:
1) An SCP always has a great influence on the microbiological quality of surface water.
2) The quality after SCP effluent will be very poor for about 300 m. The pollution will decline with
growing distance from the effluent.
These two hypotheses are based on assumptions that have not yet been proven. This knowledge is
important for estimations of risks and dangers in spending time in pathogen-affected areas. If the
dilution downstream of a drain is known, one can appoint places that are safe and identify those
where it is not advisable to swim and spend time.
River water infiltrates into groundwater, which is used for drinking water processing. If the river
water is contaminated microbiologically, micro-organisms will also infiltrate into groundwater.
Several outbreaks due to contaminated wells have been described in the last decade (Swerdlov et
al. 1992, Beller et al. 1997, Maurer & Stürchler 1998, Häfliger et al. 2000). A better understanding
Page 39
Introduction______________________________________________________________________ 38
of the ‘surface water – groundwater’ system will help to minimize the presence of micro-organisms
in distribution systems and to keeping the food product ‘drinking water’ safe.
Objectives
This work consists of five objectives:
1. Application of common analysis methods for the detection of different pathogens in surface
waters.
2. Validation of methods under field conditions and during different environmental situations
(water level, rainy events) and definition of sampling sites located at the Birs and the
Ergolz (frequency of sampling points).
3. Monitoring the initial microbiological water quality close to water-cleaning plants (before
and after the effluent) and downstream of effluents.
4. Monitoring the same places during bad weather events.
5. Monitoring the backflow of micro-organisms from surface water into groundwater.
Page 40
Material and Methods______________________________________________________________ 39
2. Material and Methods
2.1 Sampling and sampling areas
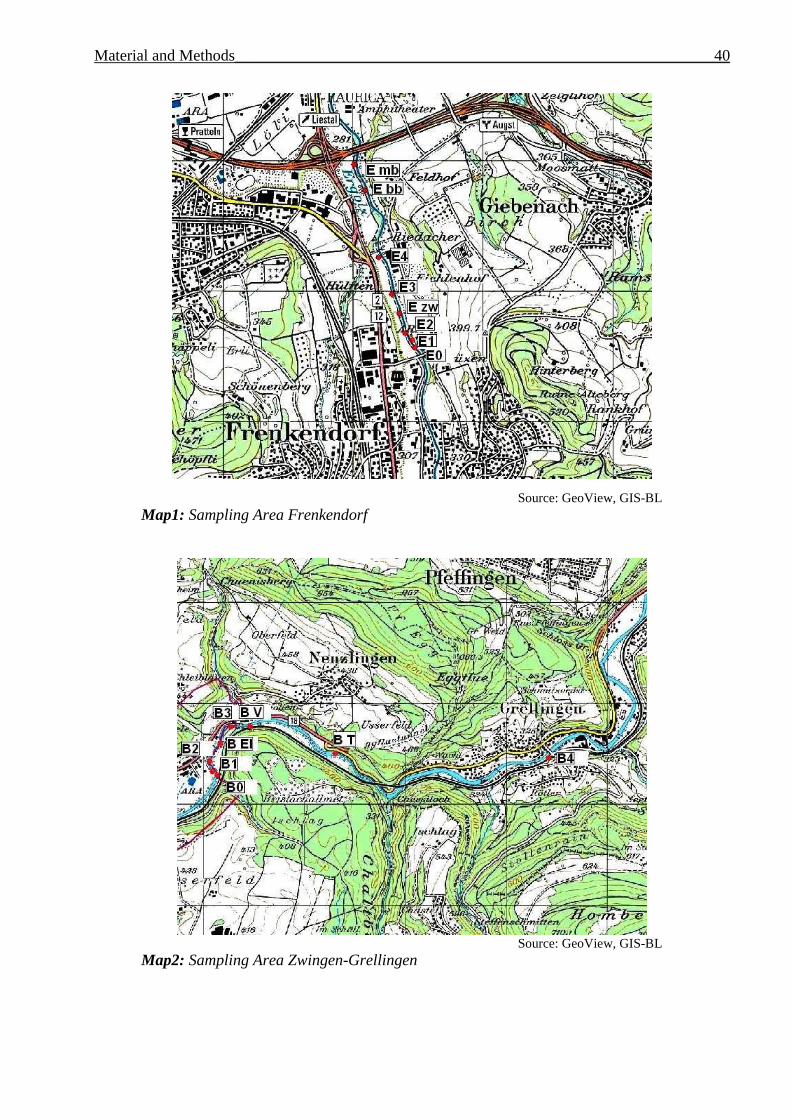
2.1.1. Part A: Surface water
To test the surface water qualities and influences of SCPs, two cleaning plants were chosen, one
located at the Ergolz (SCP Ergolz2) and one at the Birs (SCP Zwingen) (see Map 1 and 2). Sample
sites above the effluent were compared with effluents and sample sites downstream.
Sample sites are indicated by letters and numbers. The first letter stands for the river (E and B).
Sample sites where the E or B is followed by a number were analysed for E. coli and all pathogens.
Sample sites where the E or B is followed by letters were only analysed for E. coli.
E0/B0 → Sample site directly above SCP effluent E1/B1 → Effluent of SCP E2/B2 → Sample site after SCP effluent (10 – 20 m downstream of effluent) E zw → Sample site between E2 and E3, about 350 m downstream of effluent E3 → About 450 m downstream of effluent E4 → Before waterfall, about 850 m downstream of effluent Ebb → Bicycle bridge, about 1300 m downstream of effluent Emb → Motorway bridge, about 1600 m downstream of effluent B EI → End of island, about 290 m downstream of effluent B3 → Before weir, about 500 m downstream of effluent B V → Vis-à-vis Verdyol, about 640 m downstream of effluent B T → Level with the Eggfluh tunnel, about 1600 m downstream of effluent B4 → Level with the bridge in Grellingen, about 4000 m downstream of effluent During the period from 12 March 2007 to 20 August 2007 samples were collected on 23 different
days, resulting in 137 samples for the Ergolz (22 sampling days) and 147 samples for the Birs.
During sampling days, the weather situation was recorded. Information about water levels (runoff
in m3/s) was provided by the Federal Bureau for Hydrology.
When a test for all micro-organisms was to be made, 5 litres of water were taken in 5-litre plastic
canisters. If samples were taken only for analysis of E. coli, 0.5 litre of water was taken in 500-ml
glass bottles. Samples were taken at the river border of rivers, just below the surface.
Page 41
Material and Methods______________________________________________________________ 40
Source: GeoView, GIS-BL
Map1: Sampling Area Frenkendorf
Source: GeoView, GIS-BL
Map2: Sampling Area Zwingen-Grellingen
Page 42
Material and Methods______________________________________________________________ 41
2.1.2. Part B: Groundwater To validate the infiltration of surface water into ground water, samples of surface water and
groundwater were taken parallel. Theses samples were tested for E. coli. Map 3 shows the sample
area.
Source: GeoView, GIS-BL
Map3: Sampling Area Duggingen The sample site was 65 m from the well. The blue areas are the groundwater protection zones 1
and 2. The distance from the pump station to beginning of protection zones 1 and 2 is about 340
and 610 m, respectively.
Prior investigations in this sampling area have defined the composition of the groundwater as
follows: 20% water from the Birs, 6% water from Lockergestein (water from the valley), 74%
water from Hauptrogenstein (water from the karstified hills).
Surface water was taken by an automatic sampler (Probenehmer ISCO Model 6700 and Model
3700) every 2 hours. One litre of water was taken and stored in 1-litre plastic bottles. Groundwater
samples were taken every 4–8 hours by the pump station attendant. Samples were placed in 1-litre
glass bottles and stored in a cool bag.
Page 43
Material and Methods______________________________________________________________ 42
During three weather events, samples were taken: (1) from 18 to 19 July 2007, during which period
the weather was good and data were used as negative control; (2) from 6 to August 2007, during a
strong rainy event, at the end of which the sampler was swept away by a flood and the sampler
model was changed; (3) from 24 to 28 September, during a week with regular but weak rain
events.
Further parameters
For both surface water and groundwater, turbidity, conductance and UV light absorption were
measured.
Turbidity: the water was X-rayed by a light beam of 880 nm. Scattered light was measured at an
angle of 90°. Turbidity is a parameter for the quantity of particles in water.
UV absorption: UV absorption is a parameter for organic substances. It measures C=C double
bonds of organic material in water that are stimulated by UV light (254 nm). An apparatus
measures the light absorbance.
Conductance: conductance is a parameter for dissolved conducting particles. Low values in
groundwater predict a high amount of young water, since old water has more dissolved lime.
2.2 Analytical procedures
2.2.1 Bacteriology
E. coli: quantitative
The analysis was carried out according to Swiss food code law, chapter 56, E3 (2004). For the
sample taken at locations E1, E2, B1, B2, 0.1, 1 and 10 ml were analysed. For the other water
samples, volumes of 1, 10 and 100 ml were analysed. Samples were filtered with a 0.45-µm
cellulose nitrate membrane filter. Filters were placed onto Tryptone Bile Glucuronid Agar (TBX)
Page 44
Material and Methods______________________________________________________________ 43
and incubated at 44°C for 18–24 hours. After incubation all blue colonies were classified as E. coli.
Confirmation is not necessary. E. coli/100 ml was calculated.
EHEC: qualitative
The analysis was carried out according to the field manual of the Basel-Land cantonal, B-P-14,
based on V.K. Sharma et al. 2002. For the sample taken at locations E1, E2, B1, B2, 0.1, 1 and 10
ml were analysed. For the other water samples, volumes of 1, 10 and 100 ml were analysed.
Filtration was done with a 0.45-µm cellulose nitrate membrane filter.
The filters were incubated in 10 ml of Modified Tryptone Soy Broth (MTSB) for 6 hours at 42°C.
After incubation the tubes were cooled down to 4°C until further processing. From each tube, 100
µl of each tube was placed on TBX and spread. Plates were incubated for 18–24 hours at 37°C.
All grown colonies were dissolved with a wet swab in 2 ml of molecular biology grade water.
DNA extraction was done by QIAGEN BioRobot EZ1 (magnetic particle technology) and the EZ1
DNA Tissue Kit.
Analysis was by real-time PCR using a LightCycler (Roche) and QuantiTect Probe PCR Kit
(Qiagen). This kit detects the three genes stx1, stx2, eae.
Primers and probes:
System stx1:
Ecoli stx1 F 5'- GAC TGC AAA GAC GTA TGT AGA TTC G -3'
Ecoli stx1 R 5'- ATC TAT CCC TCT GAC ATC AAC TGC -3'
Ecoli stx1 Probe 5’-FAM- TGA ATG TCA TTC GCT CTG CAA TAG GTA CTC -DQ-
System stx2:
Ecoli stx2 F 5'- ATT AAC CAC ACC CCA CCG -3'
Ecoli stx2 R 5'- GTC ATG GAA ACC GTT GTC AC -3'
Ecoli stx2 Probe 5’-FAM- CAG TTA TTT TGC TGT GGA TAT ACG AGG GCT TG -
System eae:
Ecoli eae F 5'- GTA AGT TAC ACT ATA AAA GCA CCG TCG-3'
Ecoli eae R 5'- TCT GTG TGG ATG GTA ATA AAT TTT TG -3'
Ecoli eae Probe 5’-FAM- AAA TGG ACA TAG CAT CAG CAT AAT AGG CTT GCT -
Page 45
Material and Methods______________________________________________________________ 44
Salmonella/Shigella: qualitative
The analysis was carried out according to Swiss food law, chapter 56, E20 (2004). One litre of
sample water was filtered through a 0.45-µl cellulose nitrate membrane filter and a 12-µl cellulose
nitrate pre-filter. The filter was incubated in buffered peptone water, a non-selective pre-
enrichment broth, for 16–20 hours at 37°C.
- Salmonella
A 0.1-ml sample of the pre-enrichment broth was added to 10 ml Rappaport-Vasiliadis Soya Broth
and 1 ml was added to Tetrathionate Broth. Broths were incubated aerobically for 18–24 hours at
42°C.
Hektoen Enteric Agar and XLD medium (both Oxoid) were inoculated with each enrichment broth
and incubated aerobically at 37°C for 18–24 hours.
Presumptive colonies with a deep-black centre and transparent edge (fish eye) on a dark-green
(Hektoen) or red (XLD) surface were confirmed by API 20 E (Biomérieux).
-Shigella
A 10-ml sample of pre-enrichment broth was added to 100 ml of both MOSSEL-Bouillon and GN-
Enrichment bouillon HAJNA, and incubated aerobically for 18–24 hours at 37°C. Hektoen Enteric
Agar and XLD medium were inoculated with each enrichment bouillon and incubated aerobically
for 18–24 hours at 37°C.
Presumptive colonies that were green, moist, flat and transparent with a corded edge on Hektoen or
translucent with a corded edge and same colour as the medium on XLD medium were confirmed
by API 20 E (Biomérieux).
Campylobacter: qualitative
The analysis was carried out according to Swiss food code law, chapter 56, E22 (2004). A water
sample of 100 ml was filtered through a 0.2-µm mixed cellulose ester membrane filter. The filter
Page 46
Material and Methods______________________________________________________________ 45
was incubated in a modified Campylobacter-selective enrichment broth [nutrient broth No 2
(Oxoid) + agar + lysed horse blood + antibiotic solution) for 18–24 hours at 42°C.
Gélose Campylosel (CAM, Biomeriéux)) and Karmali plates (Oxoid) were inoculated with liquid
from the microaerophile part of the jar (1–1.5 cm beneath the surface) and incubated for 18–24
hours at 42°C in a microaerophile chamber.
Presumptive colonies from both plates were inoculated on two Columbia plates (Columbia agar
with sheep blood plus; Oxoid). One plate was incubated microaerophilically, the other aerobically,
for 18–24 hours at 42°C.
Colonies that grew microaerophilically but not aerobically were confirmed with an Accuprobe
Culture Identification Reagent Kit.
Pseudomonas aeruginosa: quantitative
The analysis was carried out according to Swiss food code law, chapter 56, E4 (2004). Three
volumes of 100, 10 and 1 ml were filtered through a 0.45-µm cellulose nitrate membrane filter.
The filters were placed onto Cetrimid selective Agar and incubated aerobically for at least 24 hours
at 42°C.
All colonies pigmented green, blue, red and/or colonies fluorescing under UV light (360 nm) were
confirmed with an oxidase test kit.
Pseudomonas/100 ml was calculated.
Yersinia enterolitica:
The analysis was carried out according to Swiss food code law, chapter 56, E 7.08 (5th Edition,
volume 2). One litre of sample water was filtered through a 0.45-µl cellulose nitrate membrane
filter and a 12-µl cellulose nitrate pre-filter. The filter was incubated aerobically in Yersinia-
selective enrichment broth for 18–24 hours at 37°C.
Yersinia selective agar Nr. A13 (CIN) plates were inoculated with the enrichment broth and
incubated for 18–24 hours at 37°C. Presumptive colonies were confirmed with API E 20.
Page 47
Material and Methods______________________________________________________________ 46
2.2.2 Virology
Quantitative real-time, one-step RT-PCR with sequence-specific probes
The analysis was carried out according to the field manual of the Basel-Land cantonal laboratory,
B-P-07 and B-P-15.
For RNA extraction, the QIAamp Viral RNA Mini Kit was used. The composition of the AVL
buffer differed from that in the handbook: 560 µl AVL buffer with carrier DNA mixed with 2440
µl AVL buffer without carrier DNA.
For rotavirus and norovirus, all steps were the same and the viruses were analysed together in 1
litre of filtered water.
Lysis of viral particles and RNA extraction
One litre of sample water was filtered through a charged 0.45-µm zetapor membrane filter and an
8-µl cellulose nitrate membrane pre-filter. The zetabor filter was placed into 3 ml of prepared AVL
buffer mixture, vortexed and incubated at room temperature for 15 min. The filter had to be in
constant contact with the buffer. Then, 3 ml ethanol (96–100%) was added and vortexed.
For extraction, a combination of the spin and vacuum protocols (Qiagen handbook, page 18 and
20) was performed: extraction was performed by using the vacuum protocol (QIAamp spin column
and a vacuum pump); washing and collection were performed using the spin protocol. The
collected RNA was frozen immediately.
Page 48
Material and Methods______________________________________________________________ 47
Real-time, one step RT-PCR
PCR was performed using the QuantiTect Probe RT-PCR Kit.
Virus Primer - probe designation Sequence : 5'–3'
Norovirus ggI COG1F CGY TGG ATG CGN TTY CAT GA COG1R CTT AGA CGC CAT CAT CAT TYA C RING1(a)-TP FAM-AGA TYG CGA TCY CCT GTC CA- RING1(b)-TP FAM-AGA TCG CGG TCT CCT GTC CA- Norovirus gg II COG2F CAR GAR BCN ATG TTY AGR TGG ATG AG COG2R TCG ACG CCA TCT TCA TTC ACA RING2-TP FAM-TGG GAG GGC GAT CGC AAT CT- Rotavirus RVp3F, sense ACC ATC TAC ACA TGA CCC TC RVp3R, antisense GGT CAC ATA ACG CCC C
RV-Probe FAM-ATG AGC ACA ATA GTT AAA AGC
TAA CAC TGT CAA
Y = C/T, R = A/G, B ≠ A und N = A/T/G/C
Page 49
Results__________________________________________________________________________ 48
3. Results
3.1. Part A: Surface water
To test the influence of SCPs on the microbiological quality of surface waters, two SCPs were
chosen. Sample sites above the effluent were compared with effluents and sample sites
downstream.
3.1.1. Indicator organisms:
Changes of E. coli density of within 0.5 log were considered as equal due to the naturally
inhomogeneous distribution of the bacterium in water or to counting mistakes on plates.
Figure 3.1 and 3.2 show box plots for E. coli density of at each sample site. Dots outside the plots
indicate outliers. Description of sample sites is in chapter 2.1.1., page 39.
Figure 3.1 Box Plot of density of E. coli at the Ergolz
Below the effluent of SCP Ergolz 2 at sample site E2, the number of E .coli was about 1 log higher
than above the effluent. The difference is significant (Mann-Whitney test, ntotal= 44, p< 0.001).The
river does not dilute the effluent water directly. For dilution it takes about 450 m (sample site E3),
where the number of E. coli was not significantly different to that at sample site E0 (Mann-
Page 50
Results__________________________________________________________________________ 49
Whitney test, ntotal=40, p= 0.338) anymore. Further downstream the mean number of E. coli/100 ml
increased again and had increased by more than 0.5 log at 1200m from the SCP.
The number of E. coli in the effluent was usually higher than 10 000 E. coli/100 ml, with a
maximum of 101 000 E. coli/100 ml. Only once did it fall below 10 000 (2110 E. coli/100 ml,
20.03.2007).
Figure 3.2 Box plot of density of E. coli at the Birs
After the effluent of SCP Zwingen at sample site B2, the number of E .coli/100 ml was the same
again as above the effluent (Mann-Whitney test, ntotal= 43, p= 0.489). The river dilutes the
influence of the SCP directly. At B EI the mean number increased again, but the sample size was
very small (n= 7). Further downstream, the mean was almost equal for a distance of about 4000 m
(B4). However, the standard deviation increased, meaning that the numbers of E. coli/100 ml of
single samples were scattered over a larger range. The density range in the effluent was very broad:
from 400 to 84 000 E. coli/100 ml.
Not all sample events showed the same pattern. On several occasions, the sample sites 0 and 1 had
approximately the same number of E. coli. Twice, the number of E. coli/100 ml in B1 was smaller
than in B0 (30.4.2007, good weather, 5600 and 400 E. coli/100 ml; 30.5.2007, poor weather, 30
000 and 1600 E. coli/100ml). Table 3.1 gives an overview of the relationship between sample sites
0 and 1, increasing unit and the weather. Weather events are described as poor, if it was raining
during sampling, or if it had rained within the last 48 hours before sampling.
Page 51
Results__________________________________________________________________________ 50
Table 3.1 Sample side relations of sample sides 0 and 1
Sample site relation Frequency Increase unit (log) Weather good Weather poor 1 7 4 E1 > E0 15 2 4 1
E1 = E0 6 - 1 5
1 5 3 B1 > B0 11 2 3 0
B1 = B0 9 - 3 7 B1 < B0 2 1 1 1
Sample site relation refers to number of E. coli. Weather events are described as good, if there was no rain for more than 48 hours before sampling.
Sample sites were compared for different weather events. Table AAC shows factors comparing
sample sites E0 with E1 and B0 with B1 (for good and bad weather) and factors comparing each
sample site during different weather events.
Table 3.2 Comparison of E. coli numbers between sample sites and weather events
Weather good Weather poor Factor
E0 778 (642.4 ) 5331 (6021.3) 6.9 E1 31 909 (21 767.7493) 37 874 (28 298.7) 1.2
Factor 41 7.1 B0 1335 (1668.79) 11 211 (11 230.8) 8.4 B1 26 372 (26 953.1) 19 150 (22 839.2) 0.73
Factor 19.8 1.7 Data: Mean E. coli/100ml (standard deviation). Outliers are included. Factors give the x-fold of compared sample sites.
Factors comparing sample site 0 with sample site 1 show a much higher difference for good than
for poor weather events (41 and 7.1 for the Ergolz, 19.8 and 1.7 for the Birs). In general, during
good weather, an SCP influences a river more strongly than during poor weather. Nonetheless
during poor weather, the densities for both sample sites are higher than during good weather.
Regarding single sample events during poor weather, there can be huge differences:
Birs 20.03.2007: B0 = 3900, B1 = 51 900
Birs 04.06.2007: B0 = 810 =, B1 21 000
Ergolz 05.05.2007: E0 = 3000, E1 = 61 000
Ergolz 30.05.2007: E0 = 1700, E1 = 21 000
Page 52
Results__________________________________________________________________________ 51
The results suggest that the concentration of E. coli is approximately eightfold more during poor
than during good weather (6.9 for the Ergolz and 8.4 for the Birs). SCPs show almost no difference
between different weather events. The mean of SCP Ergolz 2 (E1) was a little higher for poor
weather than for good weather. SCP Zwingen had a slightly better water quality during poor than
during good weather.
Influence of weather
Each sample event was analysed with respect to weather conditions. Data from the Federal Bureau
of Hydrology were used. These data indicate discharge in m3/sec. An increasing discharge was
regarded as a poor weather event.
Figures 3.3 and 3.4 show E .coli density at sample sites E0 and B0, respectively, compared with
the discharge. These sample sites were chosen since they should be under the smallest influence of
an SCP.
Log (E. coli/100 ml) correlated with discharge except on a few dates (e.g. Ergolz 25.6.2007 –
2.7.2007, Birs 27.3.2007 – 3.4.2007).
100
1000
10000
100000
27.0
3.20
07
29.0
3.20
07
03.0
4.20
07
11.0
4.20
07
16.0
4.20
07
23.0
4.20
07
02.0
5.20
07
05.0
5.20
07
06.0
5.20
07
07.0
5.20
07
14.0
5.20
07
21.0
5.20
07
30.0
5.20
07
04.0
6.20
07
18.0
6.20
07
25.0
6.20
07
02.0
7.20
07
09.0
7.20
07
16.0
7.20
07
30.0
7.20
07
log
(E.c
oli/1
00m
l)
0.000
2.000
4.000
6.000
8.000
10.000
12.000
14.000
Dis
char
ge (
cubi
c m
eter
/sec
ond)
log (E.coli/100ml)
Discharge (cubic meter/second)
Figure 3.3 Comparison E. coli and flow (cubic meter/sec) in the Ergolz, sample site E0
Page 53
Results__________________________________________________________________________ 52
100
1000
10000
100000
27.0
3.20
07
03.0
4.20
07
10.0
4.20
07
17.0
4.20
07
24.0
4.20
07
01.0
5.20
07
08.0
5.20
07
15.0
5.20
07
22.0
5.20
07
29.0
5.20
07
05.0
6.20
07
12.0
6.20
07
19.0
6.20
07
26.0
6.20
07
03.0
7.20
07
10.0
7.20
07
17.0
7.20
07
24.0
7.20
07
log
(E.c
oli/1
00m
l)
0.000
5.000
10.000
15.000
20.000
25.000
30.000
35.000
40.000
45.000
50.000
Dis
char
ge (
cubi
c m
eter
/sec
ond)
log (E.coli/100ml)Discharge (cubic meter/second)
Figure 3.4 Comparison E. coli and flow (cubic meter/sec) in the Birs, sample site B0
3.1.2. Pathogens
Analyses of surface water samples and SCP water for pathogens showed many differences between
different pathogens for both their presence/absence and the influence of the SCP.
Sample site prevalence
For the Ergolz, 137 samples were analysed during 22 sampling days. For the Birs, 147 samples
were analysed during 23 sampling days.
Page 54
Results__________________________________________________________________________ 53
A. EHEC
105 samples were taken and analysed for EHEC (Table 3.3).
Table 3.3 Overview analysis for EHEC
Sample side Number of analysed samples
Number of positives
Months of sampling
E0 13 6 (46.2%) March - July E1 13 12 (92.3%) March - July E2 11 11 (100%) March - July E zw 1 1 (100%) March - April E3 8 8 (100%) March - July E4 3 3 (100%) July Total Ergolz 49 41 (83.7%) Total Ergolz (without E1) 36 29 (80.5%)
B0 14 12 (85.7%) March - July B1 14 13 (92.9%) March - July B2 13 12 (92.3%) March - July B EI 2 2 (100%) March - April B3 10 7 (70.0%) March - July B4 3 3 (100%) July Total Birs 56 48 (87.5%) Total Birs (without B1)
42 36 (85.7%)
Page 55
Results__________________________________________________________________________ 54
B. Salmonella
119 samples were taken and analysed for Salmonella (Table 3.4).
Table 3.4 Overview analysis for Salmonella
Sample site Number of analysed samples
Number of positives
Months of sampling
E0 16 8 (50.0%) March - August E1 16 13 (81.3%) March - August E2 13 10 (76.9%) March - August E zw 2 0 March - April E3 10 7 (70.0%) March - July E4 4 4 (100%) July Total Ergolz 61 42 (68.8%) Total Ergolz (without E1)
45 29 (64.4%)
B0 15 4 (26.7%) March - August B1 15 6 (40.0%) March - August B2 12 4 (33.3%) March - August B EI 1 0 March - May B3 11 3 (27.3%) March - July B4 4 3 (75.0%) July Total Birs 58 20 (34.5%) Total Birs (without B1)
43 14 (32.6%)
Three isolates were sent to the National Centre for Enteropathogenic Bacteria to analyse
serovariety. They were identified as S. enterica ssp. enterica Enteritidis, S. enterica ssp. enterica
Kentucky and S. enterica ssp. enterica Brandenburg.
D. Shigella, Yersinia
A total of 83 samples each were examined between March and July. Yersinia and Shigella could
not be found in any samples.
Page 56
Results__________________________________________________________________________ 55
C. Campylobacter
127 samples were taken and analysed for Campylobacter (Table 3.5).
Table 3.5 Overview analysis for Campylobacter
Sample side Number of analysed samples
Number of positives
Months of sampling
E0 16 3 (18.75%) March - August E1 16 1 (6.25%) March - August E2 13 1 (7.7%) March - August E zw 2 0 March – April E3 10 0 March – July E4 4 0 July Total Ergolz 61 5 (8.2%) Total Ergolz (without E1)
45 4 (8.9%)
B0 17 1 (5.8%) March - August B1 17 0 March - August B2 14 3 (21.4%) March - August B EI 2 0 March - April B3 12 1 (8.3%) March – July B4 4 2 (50%) July Total Birs 66 7 (10.6%) Total Birs (without B1)
49 7 (14.3%)
One isolate was sent to the National Centre for Enteropathogenic Bacteria for analysis of
serovariety. It was identified as C. jejuni.
Page 57
Results__________________________________________________________________________ 56
B. Pseudomonads:
95 samples were taken and analysed for Pseudomonas (Table 3.6).
Table 3.6 Overview analysis for Pseudomonas
Sample side Number of analysed samples
Number of positives
Month of sampling
E0 13 11 (84.6%) March - July E1 13 12 (92.3%) March - July E2 10 10 (100%) March - July E3 7 7 (100%) March - July E4 3 3 (100%) July Total Ergolz 46 43 (93.4%) Total Ergolz (without E1)
33 31 (93.9%)
B0 13 13 (100%) March - July B1 13 12 (92.3%) March - July B2 10 10 (100%) March - July B3 10 10 (100%) March - July B4 3 3 (100%) July Total Birs 49 48 (97.9%) Total Birs (without B1)
36 36 (100%)
The concentration of bacteria in 100 ml of water ranged between 1 and 1200 cells for the Ergolz
and between 1 and 681 cells for the Birs.
Table 3.7 Quantities and statistical values for Pseudomonas in the Ergolz
Minimum 0 Range 1200 Median 170 Maximum 1200 Mean 300 SD 329.65 Amount of bacteria in 100 ml of water
Table 3.8 Quantities and statistical values Pseudomonas in the Birs
Minimum 0 Range 681 Median 22 Maximum 681 Mean 95.8 SD 161.22 Amount of bacteria in 100 ml of water
Page 58
Results__________________________________________________________________________ 57
CFU = Colony forming unit
Figure 3.3: Box plot of density of Pseudomonas at the Ergolz
The effluent had a strong impact on the river Ergolz. No decrease of Pseudomonas could be
observed. The density of Pseudomonas at sample site E4 was still higher than at E0. For good
weather, E0 showed values of 0–38 CFU/100 ml (n = 5), E3 of 2 and 4 CFU/100 ml. There were
no data for E4. For poor weather there was only one event. E0 had 48 CFU/100 ml, values for E2
– E4 ranged between 160 – 460 CFU/100 ml. Up to 48 hours after poor weather, E0 showed
values of 8-480 CFU/100 ml (n = 5), E3 of 6–1200 CFU/100 ml (n = 5) and E4 130-870 CFU/100
ml (n = 3).
CFU = Colony forming unit
Figure 3.4: Box plot of density of Pseudomonas at the Birs
Page 59
Results__________________________________________________________________________ 58
The river Birs diluted the influence of the SCP directly. Downstream, however, Pseudomonas/100
ml rose again (at a distance of 4000 m). For good weather, B0 showed values of 2–10 CFU/100
ml (n = 5), B3 of 2 - >30 000 CFU/100 ml (too dense to be counted, not shown). There are no data
for B4. For poor weather there was only one event. E0 had 30 CFU/100 ml, values for B2 – B4
ranged between 40 – 72 CFU/100 ml. Up to 48 hours after poor weather, B0 showed values of
5–600 CFU/100 ml (n = 5), B3 of 2–540 CFU/100 ml (n = 5) and B4 of 12–680 CFU/100 ml (n =
3).
F. Norovirus:
105 samples were taken and analysed for norovirus (Table 3.9).
Table 3.9 Overview analysis for norovirus
Sample side Number of analysed samples
Number of positives
ggI ggII Months of sampling
E0 13 4 (30.8%) 2 2 March - July E1 13 4 (30.8%) 3 1 March - July E2 11 5 (45.5%) 2 3 March - July E zw 1 0 0 0 March - April E3 8 2 (25.0%) 0 2 March - July E4 3 1 (33.3%) 0 1 July Total Ergolz 49 16 (32.7%) 7 9 Total Ergolz (without E1)
36 12 (33.3%) 4 8
B0 14 2 (14.3%) 0 2 March - July B1 14 6 (42.9%) 2 4 March - July B2 13 2 (15.4%) 0 2 March - July B EI 2 0 0 0 March - Mai B3 10 2 (20.0%) 0 2 March - July B4 3 1 (33.3%) 0 1 July Total Birs 56 13 (23.2%) 2 11 Total Birs (without B1)
42 7(16.7%) 0 8
Downstream of a contamination the genogroup never changed. On 20 August, sample site B1 was
contaminated with both ggI and ggII.
Page 60
Results__________________________________________________________________________ 59
E. Rotavirus
105 samples were taken and analysed for rotavirus (Table 3.10).
Table 3.10 Overview analysis for rotavirus
Sample side Number of analysed samples
Number of positives
Months of sampling
E0 13 6 (46.2%) March - July E1 13 3 (23.1%) March - July E2 11 4 (36.4%) March - July E zw 1 1 (100%) March - April E3 8 1 (12.5%) March - July E4 3 0 July Total Ergolz 49 15 (30.6%) Total Ergolz (without E1) 36 12 (33.3%)
B0 14 5 (35.7%) March - July B1 14 7 (50.0%) March - July B2 13 7 (53.8%) March - July B EI 2 2 (100%) March - May B3 10 3 (30.0%) March - July B4 3 0 July Total Birs 56 24 (42.9%) Total Birs (without B1)
42 17 (40.4%)
Page 61
Results__________________________________________________________________________ 60
Figures 3.5 and 3.6 summarize the findings for each pathogen at each sample site.
3
8
1
11
1313
13
13
38
1
11
41041316
16
7 310
13
13
38111
13
13
4
10
2
1316
16
0
10
20
30
40
50
60
70
80
90
100
E0
E1
E2
Ezw E
3E
4
E0
E1
E2
Ezw E
3E
4
E0
E1
E2
E3
E4
E0
E1
E2
E z
w E3
E4
E0
E1
E2
E z
w E3
E4
E0
E1
E2
E z
w E3
E4
Sample side
% p
ositi
ve f
indi
ngs
Salmonella EHEC Pseudomonads
Campylobacter
Rotavirus
Norovirus
Numbers in bars = sample size
Figure 3.5 Percent of positive findings at all sample sites along the Ergolz
3
10
2
13
14
14
14
14
3
10
2
14
1717
4
128
4
31010
13
133
10
2
1314
14
4
11
1
12
15
15
0
10
20
30
40
50
60
70
80
90
100
B0
B1
B2
B E
IB
3B
4
B0
B1
B2
B E
IB
3B
4
B0
B1
B2
B3
B4
B0
B1
B2
B E
IB
3B
4
B0
B1
B2
B E
IB
3B
4
B0
B1
B2
B E
IB
3B
4
Sample side
% p
ositi
ve s
ampl
es
Salmonella EHEC Pseudomonads
Camplyobacter
Rotavirus
Norovirus
Numbers in bars = sample size
Figure 3.6 Percent positive findings at all sample sites along the Birs
Page 62
Results__________________________________________________________________________ 61
Influence of SCPs
To assess the impact of SCPs, samples upstream were compared with samples of effluents for the
presence of pathogens. Rivers were negatively influenced if a) both sides (0 and 1) were positive,
or b) effluent (1) was positive and sample site above effluent (0) was negative.
Figures 3.7 and 3.8 show the percentage of negative influence.
In more than 90% of cases, both effluents (Ergolz and Zwingen) had a negative influence for
EHEC and Pseudomonas. Regarding Salmonella, the negative influence was 81.25% for the Ergolz
and 40% for the Birs, respectively. Regarding Noro- and Rotavirus, on only a few occasions was a
negative influence observed. Campylobacter was not analysed because there were few positive
samples. Figures are derived from tables in Appendix V.
0102030405060708090
100
Salmon
ella
EHEC
Pseudo
mon
ads
Rotavir
us
Norovir
us
%negative influence
no influence
Figure 3.7: Percentages of negative influence of SCP Ergolz 2
0102030405060708090
100
Salmon
ella
EHEC
Pseudo
mon
ads
Rotavir
us
Norovir
us
%negative influence
no influence
Figure 3.8: Percentages of negative influence of SCP Zwingen
Page 63
Results__________________________________________________________________________ 62
3.1.3 Water qualities:
The following diagrams show water qualities in all sample sides, according to the Swiss water
quality classification system (see Table 3.9). These diagrams were used to provide an overview of
sample places over time and of different sample places during a sample event.
Figures 3.9, 3.10 and 3.11 show the water qualities of one sample site each. Figures 3.12 and 3.13
show water qualities of one sampling event each. Further figures are listed in the Appendix III &
IV.
The bars have been indicated by colours, depending on weather:
Weather good for at least the last 48 hours Rainy during sampling Rainy within the last 24 hours Rainy within the last 48 hours
Bars with a minus have no quality information since samples were not analysed for Salmonella.
Bars with a minus and 100-1000 E. coli/100 ml have quality B or C*, depending on
presence/absence of Salmonella. Bars with a minus and 1000-10 000 E. coli/100ml have quality C
or D*, depending on presence/absence of Salmonella.
Table 3.11 Classes of water quality for surface waters and bathwaters in Switzerland
Class Values Description Class A E. coli < 100 / Salmonella
not detectable Good water quality. No impairment of health expected. No recommendations
Class B E. coli 100-1000 / Salmonella not detectable
Good water quality. No impairment of health expected. No recommendations
Class C E. coli > 1000 / Salmonella not detectable E. coli up to 1000 / Salmonella detectable
Acceptable water quality. Impairment of health cannot be excluded. No diving; good shower after swimming recommended.
Class D E. coli > 1000 /Salmonella detectable
Poor water quality. Impairment of health possible. Health risk after swimming. Swimming discouraged.
E.coli: number per 100ml water. Salmonella: presence/absence in 1L of water
* = Salmonella present
Page 64
Results__________________________________________________________________________ 63
E0
D*
D*
C*
D*D*
B
C
B
-
C*
C*
BB
CC*-
C- -
-
C
-
1
10
100
1000
10000
100000
20.0
3.
27.0
3.
29.0
3.
03.0
4.
11.0
4.
16.0
4.
23.0
4.
02.0
5.
05.0
5.
06.0
5.
07.0
5.
14.0
5.
21.0
5.
30.0
5.
04.0
6.
18.0
6.
25.0
6.
02.0
7.
09.0
7.
16.0
7.
30.0
7.
20.0
8.
log
(E.c
oli/1
00m
l)
Figure 3.9: Bar diagram of sampling place E0
E2
D*
C
D*D*
D*D*D*
C- -
- - CD*
D*-
- D*- D*
-
1
10
100
1000
10000
100000
20.0
3.
27.0
3.
29.0
3.
03.0
4.
11.0
4.
16.0
4.
23.0
4.
02.0
5.
05.0
5.
06.0
5.
07.0
5.
14.0
5.
21.0
5.
30.0
5.
04.0
6.
18.0
6.
25.0
6.
02.0
7.
09.0
7.
16.0
7.
30.0
7.
log
(E.c
oli/1
00m
l)
Figure 3.10: Bar diagram of sampling place E2
E3
-- -
C B - - --
- -C*
-C*
D*
B
D*D*
C*
D*
1
10
100
1000
10000
100000
20
.03
.
27
.03
.
03
.04
.
11
.04
.
16
.04
.
23
.04
.
02
.05
.
05
.05
.
06
.05
.
07
.05
.
14
.05
.
21
.05
.
30
.05
.
04
.06
.
18
.06
.
25
.06
.
02
.07
.
09
.07
.
16
.07
.
30
.07
.
log
(E.c
oli/1
00m
l)
09.07.2007: Density of E. coli too high to be counted (at least 30000/100ml). Figure 3.11: Bar diagram of sampling place E3
Page 65
Results__________________________________________________________________________ 64
16.07.
--C*C*
D*D*
C*
1
10
100
1000
10000
100000
E0 E1 E2 E3 E4 E bb E mb
log
(E.c
oli/1
00m
l)
Figure 3.12: Sampling event 16.7.2007, Ergolz
16.07.
B
D*
C C* - - D*
1
10
100
1000
10000
100000
B0 B1 B2 B3 B V B T B4
log
(E.c
oli/1
00m
l)
Figure 3.13: Sampling event 16.07.2007, Birs
Table 3.12 provides an overview of all qualities of each sample site that was analysed for
Salmonella.
Table 3.12 Summary of all water qualities
B0 B2 B3 B4 E0 E2 E3 E4 A - - - - - - - - B 4 1 2 - 4 - 2 - C 7 7 6 - 4 3 1 - C* 2 1 1 1 4 - 3 1 D* 2 3 2 3 4 10 4 3
Page 66
Results__________________________________________________________________________ 65
Sample places E0, B0:
Comparing sample sites above the effluents, the Birs was found to have a better quality than the
Ergolz. For both rivers, it is difficult to recognise a pattern of water qualities. The qualities differed
strongly from sample event to sample event, ranging from B up to D*. Qualities changed
frequently, e.g. at the Ergolz between the two samplings from 25 June and 2 July (B→D*), or
between 23 April and 2 May (B→C*, with only one small thunderstorm on 26 of April).
There is a slight tendency for water quality to diminish during or after rainy events. But even when
the weather remains stable, the water quality can change.
Sample places E2, B2:
The water qualities of surface waters after an effluent differ between the Ergolz and Birs. As
already seen in part ‘3.1.2 A. Salmonella’, SCP Ergolz 2 has a stronger and more burdening
influence on the river (in 81.25% of all sample events) than SCP Zwingen (40%).
Sample places E3, B3:
In both rivers, water qualities were similar again to those above the effluents, with qualities from B
to D*.
Sample places E4, B4:
Only four samples each were analysed for Salmonella. All these samples were taken in July. There
was a poor water quality for all these samples. E4 tested positive for Salmonella in all four
samples. B4 tested positive three times.
The density of E. coli corresponds to the situation discussed in chapter 3.1.1. The density of E.
coli in the effluents was 1 log higher than above the effluents. In the Ergolz, the density fell again
between sample sites E2 and E3 (450 m). In the Birs, the density had already fallen by sample site
B2. Salmonella still might have been present at these sites and would have reduced the quality
further. In a few sample events, the quality of the effluent is similar to the quality above the
effluent (see figures in Appendix IV). At the Birs, on two occasions, the quality of the effluent
was better than the quality on the sample side above the SCP (density of E. coli more than 1 log
higher).
Page 67
Results__________________________________________________________________________ 66
3.2 Part B: Groundwater
To validate the infiltration of surface water into groundwater, samples of surface water and
groundwater were taken in parallel. Samples were taken during three weather events: (1) from 18
to 19 July 2007, during which period the weather was good and data were used as a negative
control; (2) from 6 to 9 August 2007, during a strong rainy event (flood water); (3) from 24 to 28
September, during a week with regular but weak rainfall.
There are gaps in the results concerning E. coli in surface water, due to problems with the sampler.
During sample event 3, E. coli was found in groundwater four times (Figure 3.15). The number of
E. coli/100 ml groundwater was 1, 1, 2 and 2. The number of E. coli/100 ml surface water ranged
between 1000 and 3000. Negative groundwater samples are not shown.
During the flood water, E. coli was found in groundwater on four occasions (see Figure 3.14). The
number of E. coli/100 ml was 9, 15, 5, and 21. The number of E. coli/100 ml surface water ranged
around 10 000. Negative groundwater samples are not shown.
These data indicate that the filtering performed by the unsaturated zone in the aquifer reduced the
number of E. coli/100 ml by about a factor of 1000 (log 3).
During sample event 3, high numbers of other Enterobacteriaceae/100 ml were found (19 and 198;
Table 3.15). They were identified as Burkholderia cepacia, Enterobacter cloacae and
Acinetobacter baumanii. Under the assumption that these bacteria are reduced in the groundwater
by a factor of 1000, the number of germs/100 ml surface water must have been very high.
1
10
100
1000
10000
100000
12:3
0
16:3
0
20:3
0
00:3
0
04:3
0
08:3
0
12:3
0
16:3
0
20:3
0
00:3
0
04:3
0
08:3
0
12:3
0
16:3
0
20:3
0
00:3
0
04:3
0
08:3
0
12:3
0
log
(E. c
oli/1
00m
l)
0.000
80.000
160.000
240.000
320.000
400.000
Dis
char
ge(c
ubic
met
er/s
econ
d)
E.coli/100ml SW
E.coli/100ml GW
Water level SW
Figure 3.14: Sample event 2, 6.8. – 9.8.2007
Page 68
Results__________________________________________________________________________ 67
1
10
100
1000
10000
100000
18:0
0
00:0
0
06:0
0
12:0
0
18:0
0
00:0
0
06:0
0
11:4
0
17:4
0
23:4
0
05:4
0
11:4
0
17:4
0
23:4
0
05:4
0
log
(E.c
oli/1
00m
l)
0.000
3.000
6.000
9.000
12.000
15.000
Dis
char
ge (
cubi
c m
eter
/sec
ond)
E.coli/100ml SW
E.coli/100ml GW
Other Bacteria/100ml GW
Water level SW
Figure 3.15: Sample event 3, 24.9 – 28.9.2007
A comparison of surface water turbidity with number of E. coli showed an increasing number of E.
coli with increasing turbidity (Figures 3.16 and 3.17). On the other hand, turbidity of surface water
seems to correlate with the discharge (Figures 3.18 and 3.19). Routine data for E. coli in
groundwater from the years 2000 to 2007 were compared with the discharge. These data showed
an increasing number of E. coli in groundwater with increasing discharge (Figure 3.20).
On September 10th there were 720 E. coli/100 ml ground water. The discharge was 123 m3/s. This
date was excluded in the tables.
0
2000
4000
6000
8000
10000
12000
14000
16000
0.00 1.00 2.00 3.00 4.00 5.00 6.00
Turbidity surface w ater (FNU)
E. c
oli/1
00m
l sur
face
wat
er
18.7.2007
24.09.2007
Trend line
y = 2162.3x - 73.329
Figure 3.16: Comparison of E. coli and turbidity in surface water for sample events (1) and (3)
Page 69
Results__________________________________________________________________________ 68
y = 189.16x + 2216.5
0
10000
20000
30000
40000
50000
60000
0.00 50.00 100.00 150.00 200.00 250.00 300.00
Turbidity surface w ater (FNU)
E. c
oli/1
00 m
l sur
face
wat
er
06.08.2007
Trend line
Figure 3.17: Comparison of E. coli and turbidity in surface water for sample event (2)
0.000
10.000
20.000
30.000
40.000
50.000
60.000
70.000
12:30
18:30
00:30
06:30
12:30
18:30
00:30
06:30
12:30
18:30
00:30
06:30
12:30
Dis
char
ge (
cubi
c m
eter
/sec
ond)
0.00
45.00
90.00
135.00
180.00
225.00
270.00
315.00
Tur
bidi
ty s
urfa
ce w
ater
Discharge surface waterTurbidity
Figure 3.18: Comparison of discharge and turbidity for sample event (2)
0.000
2.000
4.000
6.000
8.000
10.000
12.000
14.000
16.000
18:0
0
00:0
0
06:0
0
12:0
0
18:0
0
00:0
0
06:0
0
11:4
0
17:4
0
23:4
0
05:4
0
11:4
0
17:4
0
23:4
0
05:4
0
Dis
char
ge (
cubi
c m
eter
/sec
ond)
0.00
0.80
1.60
2.40
3.20
4.00
4.80
5.60
6.40
Tur
bidi
ty s
urfa
ce w
ater
(F
NU
)
Discharge surface water
Turbidity
Figure 3.19: Comparison of discharge and turbidity for sample event (3)
Page 70
Results__________________________________________________________________________ 69
0
10
20
30
40
50
60
0 20 40 60 80 100 120 140 160
Discharge Birs
E. c
oli/1
00 m
l gro
und
wat
er
Figure 3.20: Routine data for E. coli in groundwater compared with discharge
To assess ground water quality, one can observe the surface water to estimate the likelihood of
finding E. coli. With increasing turbidity and discharge in the surface water, the likelihood of
finding E. coli in groundwater also increases.
There were 52 floodwaters with a discharge > 30 m3/s from 2000 – 2006 (excluding 2001; no
groundwater samples were taken the whole year). Twenty-nine of these 52 floodwaters had a
discharge greater than 50 m3/s. In 2006, there were 2 floodwaters with a discharge of 191 and 161
m3/s, respectively (according to the statistics, such floodwaters occur every 2 – 5 years). On only 3
of these 29 events was the groundwater tested for E. coli. The likelihood of E. coli infiltrating in
groundwater increases during such events (Figure 3.20).
Page 71
Discussion_______________________________________________________________________ 70
4. Discussion
In this survey, the microbiological quality of surface waters bathing areas was tested. A
comparison was made between good and poor weather conditions. Two hypotheses were tested:
1) An SCP always has a great influence on the microbiological quality of surface water.
2) The quality after SCP effluent will be very poor for about 300 m. The pollution will decline with
growing distance from the effluent.
4.1. Part A: Surface water
In all tested cases, the number of E. coli/100 ml never fell below 100, hence the quality was always
classification B or worse (see table 3.10). At least one pathogen was usually detected during each
sampling event. Salmonella, EHEC and Pseudomonas were very abundant in all sample sites (see
tables 3.5 & 3.6). The other pathogens were detectable sporadically (viruses, Campylobacter) or
were absent (Shigella, Yersinia). With respect to the classification system, the quality of the Ergolz
was poorer than that of the Birs.
4.1.1. Indicator organisms:
The first hypothesis seems to be incorrect. The data showed that there can be no significant
influence (Birs). In the Ergolz, however, there was a significant influence.
These differences are probably ascribable to the different sizes of the rivers and the SCPs. The
Ergolz has a lower annual discharge than the Birs. In 2006 the mean discharge was 5.36 m3/s for
the Ergolz and 22.5 m3/s for the Birs. From 1934 to 2006, the Ergolz had a mean discharge of 3.73
m3/s with a maximal mean of 6.7 m3/s and a minimal mean of 1.59 m3/s. From 1917 to 2006, the
Birs had a mean discharge of 15.4 m3/s with a maximal mean of 28.2 m3/s and a minimal mean of
6.12 m3/s. These data indicate that the water flow through the Birs is fivefold that of the Ergolz.
The box plots on pages 48 & 49 include all data for E. coli. Splitting up data for different weather
events shows that the influence is smaller during rainy weather or the day after (see tables in
appendix IV).
Page 72
Discussion_______________________________________________________________________ 71
The assumption that surface water quality improves with growing distance from the effluent also
seems to be false (Description of sample sites is in chapter 2.1.1., page 39).
The quality in the Birs was identical from sample sites B2 to B4. The increasing density at B EI is
probably due to a small sample size (n = 7): the number of E .coli/100 ml at B EI was always in the
range of sample sites B2 and B3 within one sampling event. However, there are two outliers at
sample site B4 which show a much higher number of E .coli than all sample sites upstream, the
values being even higher than in the effluent. These two events were observed during poor weather
(6.5.2007 and 18.6.2007). Somewhere between B V and B4 there must be at least one inflow
(feeding river or mixed-water overflow) that is reducing the water quality. Since the Birs has a
discharge which dilutes the influence of the SCP directly, there may well be several inflows which
are also diluted directly. Thus the observed outliers at B4 indicate a huge amount of pollution from
an inflow.
The quality in the Ergolz improved to the level from E0 somewhere between E2 and E3 (450 m
after the effluent). After this point, the quality showed continuous deterioration.
There might be several reasons for this. There is possibly a laminar flow for the water from the
effluent, which then takes a long time to mix well with the river water. In the Rhine basin, a tracer
experiment showed a general persistence of the temporal skewness of concentration distribution
(van Mazijk & Veling 2004). Two cross-analyses in the Ergolz showed higher concentrations on
the right river bank with differences of 1700 – 3600 E. coli/100 ml at sample site E3 and 300 – 500
at sample sites E bb and E mb. The effluent is located on the right river bank. Sample sites E0 and
E2 were chosen on the right bank, all others were on the left river bank. The microbiologically
burdened water from the effluent is mixing slowly with the river water on the left side, with the
result that the E. coli concentration downstream slowly increases on the left river bank. E3 showed
approximately the same concentration as E0, suggesting that at this point, effluent was still very
poorly mixed with the river water on the left side.
However, below sample site E4 there is a waterfall which mixes the water well. Sample sites E bb
and E mb downstream of the waterfall still showed slightly increasing numbers of E. coli. This fact
weakens the assumption that a slow mix of water is the only reason for worsening quality
downstream. There are probably additional inflows which burden the quality. Such an inflow was
found in the Birs which occasionally showed very high numbers of E. coli. (89/100 ml to more
than 300 000/100 ml). Several inflows were identified in the Ergolz, but only one was tested. This
inflow had very small numbers of E. coli/100 ml. The other inflows were either not water-bearing
during good weather or were not accessible. Probably the dynamics of the waterflow and the
Page 73
Discussion_______________________________________________________________________ 72
consequential unequal water quantities in the cross-profile play a role in the unequal distribution of
the bacterial concentrations.
On two occasions, sample site B0 showed a higher number of E. coli/100 ml than B1, once during
good weather and once during bad weather. On these occasions, the number of E. coli/100 ml of all
sample sites downstream were more than 0.5 log lower. A ‘polluted wave’ was possibly collected
during sampling. These waves might have originated from a mixed-water overflow during poor
weather or from a polluted feeder river.
Rivers are more polluted during poor weather. Uncleaned sewage flows into rivers via mixed-water
overflows in drainage systems. SCPs have a limited capacity to clean additional rainwater. Much
of it overflows into the river. The SCP Ergolz 2 has the capacity to clean three times the maximal
inflow during good weather, while SCP Zwingen has the capacity to clean the 1.5 times the mean
inflow during good weather. During rainfall the flow into SCPs increases about fivefold, and
sewage flows into the rivers via mixed-water overflows. Hence the rivers are more polluted. Two
to three days after rainfall, the quality of the rivers improved again.
The difference in the number of E. coli/100 ml between sample site 0 (above the effluent) and 1
(effluent) is much higher during good weather than during poor weather (see table 3.2). Effluents
have only a small difference in the number of E. coli/100 ml during good weather versus poor
weather.
However, the standard deviations are very high for different weather types, rendering it difficult to
identify weather-specific patterns. For both good and poor weather, the system is very dynamic and
irregular. In general, the contamination is higher during poor than during good weather. However,
for specific weather types there are great differences.
Tables 3.3 and 3.4 show correlations for E. coli/100 ml surface water and discharge of the river.
However, there are occasions when there is no correlation. After rainfall of approximately 2 mm,
the water overflows via mixed-water overflows. Depending on river size, it can take longer for the
discharge to increase than for sewage to overflow via mixed-water overflows. This might affect the
correlation. Hence a comparison between E. coli/100 ml with amount of rainfall could have shown
better correlation.
Page 74
Discussion_______________________________________________________________________ 73
4.1.2. Pathogens and the influence of SCPs:
EHEC
EHEC originates from both human and animal sources, although it is usually difficult to appraise
the precise origin. EHEC is very abundant in water. For all 78 surface water samples, 65 were
positive. For each river, more than 80% of the samples were positive, at all sample sites. In the
effluents, 25 of 27 samples (> 92%) were positive. In summer detection rate rose. EHEC was even
found in samples of 1 ml, both in surface water and effluents. No association with weather could
be observed.
The abundant presence of this bacterium in surface water is a problem for groundwater quality.
One can assume that they infiltrate into ground water with same efficiency as E. coli. If
groundwater has a high turbidity, e.g. after a long period of poor weather, EHEC might enter water
catchments and reach distribution systems. Consumption of untreated or insufficiently treated
water can lead to outbreaks, such as those observed in Montbovon (Switzerland) in 2005 (NZZ
2005; La Liberté 2005), in Swaziland in 1992 (Effler et al. 2001) and in Missouri in 1990
(Swerdlof et at. 1992). For the latter two outbreaks, serotype 0157 was the causal agent of
infection.
Samples for EHEC were considered positive if one gene was detected. Each serotype has a specific
pattern of one, two or all of the three genes stx1, stx2, stx3. To detect serotypes with combined
genes (Sharma 2002), a hybridization technique is needed, which was not available for the current
study. The results show the presence or absence of EHEC, but cannot provide information about
serotypes and their pathogenicity.
Salmonella
Salmonella is largely discussed in the section ‘Water quality in the rivers’ on page 78.
64.4% of surface water samples were positive for Salmonella in the Ergolz and 32.6% in the Birs.
E1 (effluent of SCP Ergolz 2) had a high number of positive samples, influencing the river
negatively in 81.25% of samples. At B1 (effluent of SCP Zwingen), the number of positive
samples was lower, and in 60% there was no negative influence. However, in both rivers,
Salmonella was frequently present at all sample sites.
Page 75
Discussion_______________________________________________________________________ 74
Shigella, Yersinia
Shigella and Yersinia were never detected in water samples. Shigellosis and yersiniosis are very
rare in Switzerland and are usually acquired during travels to developing countries. For that reason,
the probability of detecting these germs in surface water are very small. However, according to a
staff member's statement, there was one case of shigellosis 2 years ago in which a canoeist was
infected with Shigella. This person had not travelled in the weeks prior to the infection. Hence the
inclusion of Shigella and Yersinia in this survey.
Campylobacter
Campylobacter was found in a few samples. Given that Campylobacter is the most common cause
of bacterial enteritis in industrialized countries and that it is the most commonly reported zoonosis,
high densities of Campylobacter are to be expected in surface water. A former investigation, which
evaluated an optimized method for detection of C. jejuni in surface water samples, showed very
high densities (Wiesli, 1996).
There might be several reasons for the current findings. Campylobacter can be viable, but not
culturable if present in unfavourable conditions (Rollins & Collwell, 1986), and it is possible that
the conditions may have been unfavourable during parts of the survey period.
At the beginning of survey, the volume of blood broth was too small (10 ml) and the volume of
analysed water too high (1 litre) to detect the pathogen. This was changed from the sample date
09.07.2007 onwards, after which the number of positive findings rose slightly, but still remained
low.
Pseudomonas
Pseudomonas is very abundant in surface waters. From all 67 surface water samples (Birs and
Ergolz), only two tested negative (97% positives, both negatives at E0). Up to 48 hours after poor
weather, the number of Pseudomonas/100 ml is much higher than during good weather. For
Pseudomonas, the SCPs have a negative influence on the river.
Pseudomonas contributes to non-faecal microbial pollution of waters. Bathing water standards do
not include guidelines for non-faecal pathogens, but it is these autochthonous pathogens that may
Page 76
Discussion_______________________________________________________________________ 75
flourish in surface waters with high water temperatures in summer months. In Achterhoek,
Netherlands, an outbreak of otitis media was strongly associated with swimming in lakes in 1994.
These lakes met the Dutch bathing water standards and those set by the European Commission for
faecal pollution (van Asperen, 1995). Samples of lakes were analysed and showed 1–17 CFU/100
ml (median = 2). However, samples were taken after the infections had occurred, and suggested
that the number had decreased in the interim. A review of whirlpool-associated folliculitis in the
USA reported values of 1 CFU/100 ml – 107 CFU/ml (Ratnam et al. 1985). Russin et al. (1997) set
the oral infectious dose for healthy people at 108 – 109 germs, but with much lower numbers for
immunocompromised people or patients undergoing antibiotic treatment.
The levels found in the Ergolz and Birs samples are much lower (maximum of 1200 and 681,
respectively) than those for oral dose. However, the infectious dose for otitis media is likely to be
lower than for oral uptake, since the bacteria do not have to pass through the digestive system. The
surface waters examined could be a source for an infection with Pseudomonas .
Noro- and Rotavirus
Viruses were detected sporadically in both rivers. In the Ergolz, 33.3% of surface water samples
were positive for both Norovirus and Rotavirus. The effluent was positive in 30.8% samples for
Norovirus and in 23.1% for Rotavirus.
In the Birs, surface water samples were positive in 16.7% of cases for Norovirus and in 40.4% for
Rotavirus. The effluent was positive in 42.9% of cases for Norovirus and in 50% for Rotavirus.
There was usually no negative influence from the effluents. Only SCP Zwingen showed a negative
influence for Rotavirus in 50% of all samples. All other negative influences ranged between 23–
36%.
Norovirus was found four times at sample site E0 and twice at sample site B0 during good weather,
but never during poor weather.
Rotavirus was found five times at sample site E0 and three times at sample site B0 during good
weather, and once and twice, respectively, during poor weather. Taken together, 14 samples from
E0 and B0 were positive for viruses during good (n = 11 for each river) weather and 3 samples
during poor weather (n = 3 for each river).
Rota- and Norovirus are thought to be anthroponoses, and thus one can assume that virus particles
reach surface waters only via human faecal contamination. The 14 findings at sample sites E0 and
B0 do not fit well with this hypothesis. Particles did not reach the rivers via mixed-water overflows
Page 77
Discussion_______________________________________________________________________ 76
since many samples were positive during good weather. Their origin is also unlikely to have been
game or cattle. Manuring with sewage sludge has been prohibited since 2005. Negative influences
of SCPs were analysed as being small. It seems likely, therefore, that the viruses originated from
effluents upstream, indicating that the particles are present in detectable amounts for a long
distance.
A recent study of Norovirus in Switzerland showed person-to-person contact being the most
important transmission route for community-acquired, sporadic Norovirus infection. There was no
association between the risk of viral gastroenteritis and consumption of foodstuffs or bottled
mineral water (Fretz et al. 2005). Other studies found virus particles in bottled mineral water
(Beuret et al. 2002) or showed association between an outbreak and contaminated wells (Beller et
al. 1997; Häfliger et al. 2000).
Specialists are aware of the problem with viruses in drinking-water processing. The
Umweltbundesamt Berlin has discussed possibilities about removal of viruses during drinking-
water processing (Szewzyk et al. 2006). Since virus particles seem to be present in detectable
amounts in surface water for a long distance, contamination of surface water might be a problem
for groundwater processing stations further downstream.
Gardia lamblia
In a survey from 2006 (Wicki 2006), an influence of SCPs on cysts of G. lamblia was established.
Two SCPs were chosen, one on the Birs (Reinach) and one on the Ergolz (Frenkendorf, ARA
Ergolz 2). Sample sites were chosen above and after the effluent and 40 samples were taken and
analysed. Of these, 39 (97.5%) tested positive. The median number of cysts found in the Birs was
16.5 (0–145) per 20 litres. More cysts were found in the Ergolz with a median of 32.5 cysts per 20
litres (2–261).
An increased cyst concentration was found after both treatment plants, with the highest
concentration found in the Ergolz. In the Ergolz, the difference before and after the effluent was
statistically significant. In the Birs, the difference was lower and not statistically significant.
However, these data and former studies (Regli 1999) indicate a wide distribution of G. lamblia in
Swiss waters. Given a low infectious dose of 1 to 10 cysts and an extrapolated initial concentration
of 0.2 – 53 cysts/litre, acquiring of an infection is possible. There could also be an infiltration into
groundwater, which serves as a supply for drinking water.
Page 78
Discussion_______________________________________________________________________ 77
Cryptosporidium parvum
In a survey from 1998/1999 (Ruchti 1998/1999), a pump station fed by two groundwater sources
was investigated for C. parvum. Water from the river Lützel infiltrates into the groundwater. One
kilometre above the pump station an SCP flows into the river. Close to the pump station, there are
farms with cattle. Sample sites were chosen above and downstream of the SCP.
Forty surface water samples were taken. All of them were positive, with no significant differences
in number between sample sites. After rainy events, the number of oocysts/20 litres was
significantly higher than during good weather. Four analyses were performed for SCP water. All of
them were positive. The two groundwater sources were contaminated in 46.2 and 84.6% of cases.
Thirteen drinking water samples were taken. Two of them were positive (1 oocyst and 2 oocysts in
20 litres). An additional three samples were taken during high turbidity in groundwater. One of
these samples was positive (5 oocysts in 20 litres).
Cryptosporidium oocysts are widely distributed in the Lützel. Various studies have shown similar
results to those described above for surface waters in Switzerland (Regli, 1994), Germany (Gronik
et al. 1991; Wagner-Wiening et al. 1998) and the USA (Ongerth & Stibbs, 1987).
The SCP has no influence on the number of oocysts in the river. The two positive findings in
drinking water are not surprising given that the two sources were contaminated in 46.2% and
84.6% of samples. The situation is more difficult if turbidity is present in groundwater.
In the same area, a risk analysis was performed in 1998/1999 to assess risk factors for
contamination of surface water and groundwater with C. parvum (Hardegger, 1998/1999). Both
valley sides were investigated for potential risk factors, and showed similar risk values for trickling
and flooding. Thus the identified risk differences for both sources must have been due to different
farming methods.
Cattle farming represented the greatest animal-related risk factor. Use of sewage sludge as manure
showed no risk differences. However, very small amounts were used and sewage sludge cannot be
excluded as a potential risk factor. Analysis of field factors (dung, manure, sewage sludge and
grazing time) with respect to rainfall showed higher risks during spring and autumn. There is a
potentially higher risk for oocysts in water during spring and autumn; the oocysts may remain in
the soil for several weeks before reaching groundwater.
The only observed clearly significant difference at the human level was disposal of sewage.
Page 79
Discussion_______________________________________________________________________ 78
4.1.3. Water quality in the rivers
During rainy days up to 24 hours after a rainy event, qualities ranged from C to D* (for description
of the quality classification see table 3.11, page 62). Twenty-four to 48 hours after a rainy event,
qualities ranged from B to C*. During good weather, qualities ranged from B to D*. Occasionally,
qualities changed within short time periods from B to C* or D*, even without a rainy event. During
the second half of the survey, Salmonella was detected more frequently in the Ergolz. In the Birs,
the detection rate increased only slightly. It is unclear if this increase was due to seasonality or to
poorer weather in the second survey half. However, Salmonella was also detected during good
weather. Hence their presence is not tied to weather events. In general, Salmonella are present in
both rivers frequently, with no predictable pattern.
It is difficult to predict when it is safe to use surface waters for recreational activities. Occasionally
one river had positive and negative sample sites during one sampling event. There might be several
reasons for this. A ‘contaminated or clean wave’ may have been collected during sampling.
Contaminated waves might have flowed into the rivers from effluents, mixed-water overflows or
feeding rivers. These germs could be of human or animal origin, since salmonellosis is a zoonosis.
Cattle farming is likely to have a great influence.
These results raise questions about the current inspection system (every second week if the weather
is good, no inspection during poor weather). Good results might suggest that a bathing place is
safe, but the water quality can change quickly. On the other hand, poor results may originate from
a short-term pollution event which is soon over.
According to the unequal concentration distribution described for the Ergolz, it is possible that a
bathing place which is close to an SCP, but on the opposite river bank, has a better quality than a
bathing place further downstream. Figure 5.1 shows a schematic representation of this situation.
Dark blue: contaminated water
Figure 5.1: Schematic representation of the distribution of contaminated water from the effluent in
the river
effluent
Page 80
Discussion_______________________________________________________________________ 79
Rivers with similar conditions to those in the Ergolz (low annual mean discharge, non-turbulent
flow, straight streambed) should be investigated individually, to define specific sites for bathing
and to make recommendations for their use under different circumstances.
Authorities recommend not swimming for 2 – 3 days after rainfall. The only micro-organisms for
which this recommendation is relevant are E. coli, C. parvum and P. aeruginosa. E. coli and C.
parvum are detected in higher numbers during poor weather. P. aeruginosa has the highest
concentrations during the three days following rainfall. Salmonella concentrations are not clearly
tied to weather events and differences might be due to seasonality. EHEC has no association with
weather, but there is a clear seasonality. Viruses are found frequently during good weather.
The inspection system should be reconsidered and broadened. The ‘surface water’ system is too
dynamic to be validated by spot checks. Consideration must be given to not only the weather and
SCP location, but a better understanding of the entire system is also needed. Perhaps it will never
be possible to state with certainly that one specific place will be safe on a specific day.
Nevertheless, investigations should be performed which can be used to estimate risks for specific
locations during specific time periods.
Two factors should be taken into account.
1) With the help of case-control studies, risks of acquiring infections should be performed for
different pathogens. Non-faecal microbes (e.g. Pseudomonas) and viruses should be
included. [Chronic diseases have been associated with viral infections, e.g. coxsackievirus
with myocarditis. This could be significant, given that 41% of all deaths in the elderly are
associated with diseases of the heart (Rose 1996)]. If there is an increased risk for a
pathogen, further investigations should be performed regarding its behaviour in the ‘surface
water’ system.
2) Pathogens with an increased risk must be observed with a long-term survey to define their
behaviour regarding seasonality, yearly differences, weather differences, inflow by feeding
rivers and mixed-water overflows, and for small rivers, also with regard to the influence of
SCPs. Additional influences such as cattle or game animals should not be neglected for
zoonoses.
Page 81
Discussion_______________________________________________________________________ 80
Such investigations are very complex and time-consuming, but they would be meaningful.
Investigations in specific bathing places could be carried out more rapidly. However, it should
never be forgotten that there are always short-term fluctuations (e.g. polluted waves), and
swimming in surface waters is never completely safe.
4.2. Part B: Groundwater
Former groundwater sample analyses showed that there is infiltration of E. coli into the
groundwater catchment of the pump station Gillmatten. Due to missing data in this study, however,
it was not possible to define the time span during which E. coli infiltrates into the groundwater.
Unfortunately (in the current study) the sampler was swept away by a flood on the day on which
the highest discharge ever was measured in the Birs (Figure 5.2). It then took some time before a
new sampler could be installed. During sample event 3, there was a problem with the batteries
leading to a gap in surface water results. However, E. coli were found in groundwater between 18 –
24 hours after the discharge of the river started to rise.
In figures 3.14 and 3.15, only positive groundwater samples are shown. During sample event 2
(floodwater), no groundwater samples were taken for 12 hours after the second positive sample
(Figure 3.14). It is not certain if E. coli were present in between. For future surveys, a sampler
should be installed in the well to take groundwater samples more regularly.
The Enterobacteriaceae that were found during sample event 3 grew on the same plates as E. coli.
No other analysis methods were carried out for other micro-organisms. Additional bacteria may be
detectable in groundwater by different methods.
http://oldie70.ch/Fotoalbum.htm picasaweb.google.com/.../GCNOd6JpBEQRVsUsRK9_cw
Figure 5.2: Floodwater in the Birs (8.8.2007)
Page 82
Discussion_______________________________________________________________________ 81
The parameters turbidity, UV absorption and conductance for groundwater were very constant and
E. coli was found while these parameters did not change. It is for that reason that the parameters
for surface water were primarily analysed.
By simple observation of surface water, one can estimate if E. coli is likely to be found in
groundwater (rising turbidity and discharge). There are several floodwaters every year during
which this likelihood rises. Most of the routine data were obtained during discharges lower than 30
m3/s, and there are probably no or only a few indicator organisms detectable in groundwater during
these periods. Only during 7 of 52 floodwaters (discharge > 30 m3/s) were groundwater samples
analysed. Of these, 5 tested positive. It is highly likely, therefore, that E. coli would have often
been present in groundwater during the other 45 floodwaters.
For each well influenced by river water, a critical value regarding discharge and turbidity should be
defined. This value gives the point from which E. coli are likely to be found in groundwater. If the
river exceeds this value, tests should be mandatory.
For definition of this value, the interaction ‘river-groundwater’ must be investigated (how much
water from the river is infiltrating into the catchment). The filter capacity of the aquifer must be
defined. Additional aspects should be taken into account. After a rainfall of approximately 2 mm,
the water in drains overflows via mixed-water overflows. Contamination can vary depending on
the amount and duration of rainfall. The number of E. coli is likely to decrease during a long
rainfall due to the fact that contaminants from the environment are diluted. During heavy rainfall
the dilution probably outweighs the additional contamination. A comparison of the amount of
rainfall with the number of E. coli in surface water over time would be useful for estimation of the
point with highest contamination.
Other factors that need to be considered include the influence on the river of feeding rivers, mixed-
water overflows, cattle farms and SCPs. All of them are important regarding pathogens, which can
infiltrate into groundwater.
Improved understanding of the ‘surface water’ system will assist in the control of the
‘groundwater’ system. Quality management of groundwater is important for food safety. If one
knows the quality of the groundwater (raw product) under specific circumstances (in this case
discharge and turbidity of the river), it is easier to control drinking water quality (end product).
By defining a critical value, one can react quickly to critical situations and turn off the pump until
groundwater samples are tested. If they are found to be positive, the pump should remain switched
Page 83
Discussion_______________________________________________________________________ 82
off until the contamination has decreased naturally. In this way, contamination of the end product
and the supply systems can be minimized.
4.3. Summary of the most important points
• River water qualities ranged between classification B – D*. Quality A was never detected.
• The influence of an SCP on microbiological river water quality depends on the river's
discharge.
• The surface water quality downstream of an effluent seems to depend on the discharge of
the river. Quality can decrease, possibly due to a laminar flow. Additional inflows (mixed-
water overflows, feeding rivers) also seem to play a role.
• During poor weather, contamination of rivers is higher than during good weather.
However, the river water quality is very dynamic and there are great differences for both
good and poor weather. Nevertheless, in general, river water quality improved again two to
three days after a rain event.
• For Pseudomonas and EHEC, the influence of SCPs on river water quality is largely
negative. The same applies for Salmonella in the Ergolz. For all other pathogens, there was
a negative influence in 50% or less of cases.
• River water quality is very dynamic. Sites downstream can have different qualities within
one day, or the quality of one site can change within a few days, even when the weather
conditions remain stable.
• By simple observation of surface water (discharge, turbidity) one can estimate if E. coli are
likely to be found in groundwater.
• Groundwater should be tested depending on weather events and the discharge and turbidity
of the rivers.
Page 84
Prospect_________________________________________________________________________ 83
5. Prospect
This survey provides information about the presence of E. coli and various pathogens in river
water. These data lead to the suggestion that bathing in river water could have an impact on the
bather’s health, but do not provide direct evidence for this. To investigate if bathing in river water
can lead to specific diseases, quantitative water analyses and case-control studies should be
performed in parallel. This could be important for viruses, since they are associated with chronic
diseases (e.g. coxsackievirus with myocarditis). Specific bathing places should be investigated and
recommendations published.
Further studies leading to a remodelling of the control system should be performed, as described in
the discussion.
A comparison of E. coli with the amount of rainfall instead of discharge could provide more exact
curves of contamination. This could be important for further studies with groundwater. The
definition of critical values (see discussion) could affect the control system in future, leading away
from the current spot check procedure to situation-based controlling. Further studies need to be
performed in this direction. More regular sampling of groundwater is very important. In addition,
different wells should be analysed to compare different influences such as geology and the impact
of a river.
Page 85
References_______________________________________________________________________ 84
6. References Auckenthaler A., Huggenberger P. Pathogene Mikroorganismen im Grund- und Trinkwasser. Transport - Nachweismethoden - Wassermanagement. Birkhäuser 2003 Balarjan R, Soni Raleigh V, Yuen P, Wheeler D, Machin D, Cartwright R. Health risks associated with bathing in sea water. BMJ 1991;303:1444-5. Balayan, M. S. Epidemiology of hepatitis E virus infection. J. Viral Hepat. 1997; 4:155–165. Baumgartner, A. "Norwalk-like"-Viren und Lebensmittel - eine Situationsanalyse für die Schweiz. Lebensmitteltechnologie 2001;34(12)503-509. Beller M, Ellis A, Lee S H, Drebot M A, Jenkerson S A, Funk E, Sobsey M D, Simmons O D. Monroe S S, Ando T, Noel J, Petric M, Middaugh J P, Spika J S. Outbreak of viral gastroenteritis due to a contaminated well. International consequences. JAMA 1997; Vol. 270, No7. Beuret C, Kohler D, Baumgartner A, Lüthi T M . Norwalk-Like virus sequences in mineral waters: one-year monitoring of three brands. Applied and environmental microbiology, 2002; 1925-1931. Boccia, D., A. E. Tozzi, B. Cotter, C. Rizzo, T. Russo, G. Buttinelli, A. Caprioli, M. L. Marziano, and F. M. Ruggeri. Waterborne outbreak of Norwalk-like virus gastroenteritis at a tourist resort, Italy. Emerg. Infect. Dis. 2002; 8:563–568. Burnens AP. Aktuelle Diagnostik von Verotoxin bildenden Escherichia coli. Epidemiologie und Infektionskrankheiten, Bulletin 2001; 2, 27-30. Canada Communicable Disease Report. Waterborne outbreak of gastroenteritis associated with a contaminated municipal water supply, Walkerton, Ontario, May-June 2000, Volume 26-0, 15 October 2000 Effler P, Isaäcson M, Arntzen L, Heenan R, Canter P, Barrett T, Lee L, Mambo C, Levine W, Zaidi A, Griffin P M . Factors Contributing to the Emergence of Escherichia coli O157 in Africa. Emerging infectious disease 2001; 7(5):812-819 Ferdinandy-van Vlerken M.M.A., Dirkzwager A.H . Sustainable development in the urban water cycle, OECD Documents 1996; 353-71 Foulon G, Maurin J, Quoi NN, Martin-Bouyer G . Relationship between the microbiological quality of bathing water and health effects. A preliminary survey. Revue Francaise des Sciences de L'Eau 1983;2:127-43. Fretz R, Svoboda P, Schorr D, Tanner M, Baumgartner A. Risk factors for infections with Norovirus gastrointestinal illness in Switzerland. Eur J Clin Microbiol Infect Dis 2005; 24: 256–261 Gornik V, Behringer K, Kölb B, Exner M . Erster Gardiasisausbruch im Zusammenhang mit kontaminiertem Trinkwasser in Deutschland. Bundesgesundheitsbl.-Gesundheitsforsch.-
Page 86
References_______________________________________________________________________ 85
Gesundheitsschutz. 2001;4:351-357. Greenwood D, Slack R, Peutherer J, Barer M. Medical Microbiology, 17. Edition, Churchill Livingstone 2007; 3:260-308, 343-351. 4:565-572, 545-552. Grimbichler J . B-P-15/16, 2005. Gronik V, Exner M . Nachweismethode und Vorkommen von Cryptosporidium sp.in ausgewählten Oberflächenwässern. Zbl Hyg 1991; 192: 124-133. Häfliger D, Hübner Ph, Lüthy J. Outbreak of viral gastroenteritis due to sewage-contaminated drinking water. International Journal of Food Microbiology, 2000; 54(1;2)123-126. Hardegger R. Basis für eine routinemässige Risikoanalyse der Kontaminationsgefahr von Quellwasser mit Cryptosporidium parvum. 1998/1999 Kayser HF., Bienz KA, Eckert J, Zinkernagel RM. Medizinische Mikrobiologie, 10. Auflage, Thieme 2001: Kap.4:239-360, Kap.8:430-496. Le Minor LL, Popoff MY . Desigantion of Salmonella enterica sp.nov., nom rev., as the Type and only species of the genus Salmonella. International Journal of Systematic Bacteriology 1987; 37:465-8 Lee SH, Levy DA, Craun GF, Beach MJ, Calderon RL. Surveillance for waterborne-disease outbreaks – United States 1999 – 2000. MMWR Surveill Summ. 2002 Nov 22; 51(8):1-47. Lightfood NE. A prospective study of swimming related illness at six freswater beaches in Southern Ontario (dissertation). Toronto: University of Toronto, 1989. Lodder WJ, de Roda Husman AM. Presence of Noroviruses and Other Enteric Viruses in Sewage and Surface Waters in The Netherlands. Applied and Environmental Microbiology. 2005; 71:1453-1461, No. 3. MacKenzie WR, Hoxie NG, Proctor ME, Gradus MS, Bair KA, Peterson DE, et al. A massive outbreak in Milwaukee of Cryptosporidium infection transmitted through the public water supply. N Engl J Med 1994; 331:161-167. Maurer AM, Sturchler D . A waterborne outbreak of small round structured virus, campylobacter and shigella co-infections in La Neuveville, Switzerland, 1998. Epidemiol Infect. 2000 Oct; 125(2):325-32. Ongerth JE, Stibbs HH. Identification of Cryptosporidium oocysts in river water. Int J Parasit. Applied and Environmental Microbiology, 1987; 53(4):672-676. Ratnam S, Hogan K, March S B, Butler R W. Whirlpool associated folliculitis caused by Pseudomonas aeruginosa: Report of an Outbreak Review. J Clin Microbiol. 1986 Mar;23(3):655-9 Regli W. Krankheitserreger im Trinkwasser - ein Problem der Schweiz? Schweizerische Gesellschaft für Mikrobiologie 1999;4;1-5
Page 87
References_______________________________________________________________________ 86
Regli W. Verbesserte Methode für die Isolierung von Giardia-Zysten und Cryptosporidium-Oocysten in Oberflächengewässern: Flockung mit Al2(SO4)3 und fluorescence-activated cell sorting (FACS). (DVM-thesis). University of Zurich, Switzerland (1994). Roeske W. Trinkwasserdesinfektion. 2. Auflage, Oldenbourg Industrieverlag 2003. Rollins D M, Collwell R R. Viable but nonculturable stage of campylobacter jejuni and its role in survival in the natural aquatic environment. Applied and environmental microbiology, 1986; p. 531-538. Rose J B. New risks identified for viral and protozoan waterborne disease. OECD Documents 1996; 109-117. Rose JB. Waterborne disease education and control methods. OECD Workshop Interlaken ‘98 On Molecular Technologies For Safe Drinking-Water, 1998. Ruchti S. Zur Epidemiologie von Cryptosporidium sp.: Oocysten-Dichten in Oberflächen-, Roh- und Trinkwasser im Lützeltal (BL/SO). 1998/1999 Schijven J, de Roda AM. A survey of diving behaviour and accidental water ingestion among dutch occupational and sport divers to asses the risk of infection with waterborne pathogenic micro-organisms. Environ Health Perspect. 2006 May; 114(5):712-7. Sharma V K. Detection and Quantitation of enterohaemorrhagic Escherichia coli O157, O11 and O26 in beef and bovine faeces by Real-Time PCR. Journal of Food Protection, 2002; Vol 65, No. 9, 1371-1380. Swiss food code law: Bundesamt für Gesundheit: Schweizerisches Lebensmittelbuch, Kapitel 56 ‚Mikrobiologie’. EDMZ, Bern 2004. Swiss food code law: Bundesamt für Gesundheit: Schweizerisches Lebensmittelbuch, Band V, 5. Auflage, Kapitel 56 ‚Mikrobiologie’. EDMZ, Bern 1988. Sonntag, H-G. Infektionsgefahren nehmen zu. Spektrum der Wissenschaft, Dossier, 1997; 3:110-113. Svoboda P. B-P-14, 2005. Swerdlow DL, Woodruff BA, Brady RC, Griffin PM, Tippen S, Donnell HD Jr, Geldreich E, Payne BJ, Meyer A Jr, Wells JG. A waterborne outbreak in Missouri of Escherichia coli O157:H7 associated with bloody diarrhoea and death. Ann Intern Med. 1992 Nov 15;117(10):812-9. Szewzyk R, Lopez-Pila J M, Feuerpfeil I. Entfernung von Viren bei der Trinkwasseraufbereitung - Möglichkeiten einer Risikoabschätzung. Bundesgesundheitsbl - Gesundheitsforsch - Gesundheitsschutz 2006; 49:1059-1062. Tauxe RV. Emerging foodborne disease: An evolving public health challenge. Emerging infectious diseases, 1997; Vol.3 No.4, Oct-Dec 1997, 425-434. The First European communicable disease epidemiological Report, 2007.
Page 88
References_______________________________________________________________________ 87
Tougianidou D, Botzenhart K. Molecular techniques for the detection of enteroviruses in water. Immun Infekt. 1998 Oct;21(5):122-5. van Asperen I A, de Rover C M, Schijven J F, Oetomo S B, Schellekens J F, van Leeuwen N J, Colle C, Havelaar A H, Kromhout D, Sprenger M W. Risk of otitis externa after swimming in recreational fresh water lakes containing Pseudomonas aeruginosa. BMJ 1995; 25;311(7017):1407-10. Vinjé J, Altena SA, Koopmans MPG. The incidence and genetic variability of small round-structured viruses in outbreaks of gastroenteritis in the Netherland. J Infect Dis 1997; 176:1374-8. WHO, Guidelines for drinking-water quality . 2004. 3rd Edition, Volume 1, Recommendations; 221-295. Wicki M . A new method for detection of Gardia lamblia and it's application in monitoring surface water. Aug 2006.
Page 89
Appendix___________________________________________________________________________________________________________________________ 88
Appendix Appendix I. Data of surface water samples Weather ID: 0 Weather good since more than 48 hours
1 Rainy during sampling 2 Rainy within last 24 hours before sampling 3 Rainy within last 48 hours before sampling
A: Birs
Nr Date Sample site Weather ID E Coli Salmonella Quality EHEC Pseudomonads Campylobacter ggI ggII Rotavirus 1 12-Mrz-07 B0 1 350 neg B pos - neg neg neg pos 2 12-Mrz-07 B1 1 9900 neg C pos - neg neg neg pos 3 12-Mrz-07 B2 1 650 neg B neg - neg neg neg pos 4 12-Mrz-07 B EI 1 470 neg B pos - neg neg neg pos 5 20-Mrz-07 B0 1 3900 - - pos - neg neg neg pos 6 20-Mrz-07 B1 1 51900 - - pos - neg neg neg pos 7 20-Mrz-07 B2 1 30300 - - pos - neg neg neg pos 8 20-Mrz-07 B AI 1 32800 - - pos - neg neg neg pos 9 20-Mrz-07 B EI 1 28400 - - pos - neg neg neg pos
10 27-Mrz-07 B0 0 3100 - - - - - - - - 11 27-Mrz-07 B1 0 2400 - - - - - - - - 12 27-Mrz-07 B2 0 2500 - - - - - - - - 13 27-Mrz-07 B3 0 3700 - - - - - - - - 14 29-Mrz-07 B0 0 1300 - - - - - - - - 15 29-Mrz-07 B1 0 1100 - - - - - - - - 16 29-Mrz-07 B2 0 1500 - - - - - - - - 17 29-Mrz-07 B3 0 1700 - - - - - - - - 18 29-Mrz-07 B T 0 1500 - - - - - - - - 19 03-Apr-07 B0 0 5600 neg C - 3 neg - - - 20 03-Apr-07 B1 0 400 neg B - neg neg - - -
Page 90
Appendix___________________________________________________________________________________________________________________________ 89
Nr Date Sample site Weather ID E Coli Salmonella Quality EHEC Pseudomonads Campylobacter ggI ggII Rotavirus 21 03-Apr-07 B2 0 490 - - - - - - - - 22 03-Apr-07 B3 0 290 - - - - - - - - 23 03-Apr-07 B V 0 330 - - - - - - - - 24 11-Apr-07 B0 0 190 pos C pos pos neg neg neg pos 25 11-Apr-07 B1 0 29700 neg C pos pos neg pos neg pos 26 11-Apr-07 B2 0 580 - - - - - - - - 27 11-Apr-07 B3 0 210 - - - - - - - - 28 11-Apr-07 B V 0 200 - - - - - - - - 29 16-Apr-07 B0 0 250 - - - - neg - - - 30 16-Apr-07 B1 0 56000 - - - - neg - - - 31 16-Apr-07 B2 0 1200 - - - - neg - - - 32 16-Apr-07 B3 0 350 - - - - neg - - - 33 16-Apr-07 B aw 0 770 - - - - neg - - - 34 16-Jul-07 B V 0 590 - - - - neg - - - 35 23-Apr-07 B0 0 350 pos C neg 10 neg neg neg pos 36 23-Apr-07 B1 0 7300 neg C pos 90 neg neg neg pos 37 23-Apr-07 B2 0 460 pos C pos 13 neg neg neg pos 38 23-Apr-07 B EI 0 670 - - - - - - - - 39 23-Apr-07 B3 0 250 neg B neg dense neg neg neg pos 40 23-Apr-07 B V 0 290 - - - - - - - - 41 23-Apr-07 B T 0 330 - - - - - - - - 42 23-Apr-07 B4 0 151 - - - - - - - - 43 02-Mai-07 B0 0 190 neg B pos 2 neg neg neg neg 44 02-Mai-07 B1 0 8200 neg C pos 98 neg neg neg pos 45 02-Mai-07 B2 0 8500 neg C pos 9 neg neg neg pos 46 02-Mai-07 B EI 0 1500 - - - - - - - - 47 02-Mai-07 B3 0 200 neg B neg 2 neg neg neg pos 48 02-Mai-07 B V 0 330 - - - - - - - - 49 02-Mai-07 B T 0 510 - - - - - - - - 50 02-Mai-07 B4 0 404 - - - - - - - - 51 05-Mai-07 B0 1 25000 - - - - - - - - 52 05-Mai-07 B1 1 4000 - - - - - - - - 53 05-Mai-07 B2 1 7500 - - - - - - - -
Page 91
Appendix___________________________________________________________________________________________________________________________ 90
Nr Date Sample site Weather ID E Coli Salmonella Quality EHEC Pseudomonads Campylobacter ggI ggII Rotavirus 54 05-Mai-07 B EI 1 7800 - - - - - - - - 55 05-Mai-07 B3 1 6600 - - - - - - - - 56 05-Mai-07 B V 1 6200 - - - - - - - - 57 05-Mai-07 B T 1 6800 - - - - - - - - 58 05-Mai-07 B4 1 1800 - - - - - - - - 59 06-Mai-07 B0 2 9100 - - - - - - - - 60 06-Mai-07 B1 2 7400 - - - - - - - - 61 06-Mai-07 B2 2 8200 - - - - - - - - 62 06-Mai-07 B EI 2 8200 - - - - - - - - 63 06-Mai-07 B3 2 8800 - - - - - - - - 64 06-Mai-07 B V 2 6200 - - - - - - - - 65 06-Mai-07 B T 2 7600 - - - - - - - - 66 06-Mai-07 B4 2 15700 - - - - - - - - 67 07-Mai-07 B0 3 1500 neg C neg 5 neg neg pos pos 68 07-Mai-07 B1 3 2100 neg C neg 25 neg neg pos pos 69 07-Mai-07 B2 3 8400 neg C pos 10 neg neg pos pos 70 07-Mai-07 B EI 3 8800 - - - - - - - - 71 07-Mai-07 B3 3 1100 neg C neg 7 neg neg pos pos 72 07-Mai-07 B V 3 1100 - - - - - - - - 73 07-Mai-07 B T 3 900 - - - - - - - - 74 07-Mai-07 B4 3 650 - - - - - - - - 75 14-Mai-07 B0 0 480 - - - - - - - 76 14-Mai-07 B1 0 6300 - - - - - - - - 77 14-Mai-07 B2 0 1500 - - - - - - - - 78 14-Mai-07 B3 0 560 - - - - - - - - 79 14-Mai-07 B V 0 960 - - - - - - - - 80 14-Mai-07 B T 0 760 - - - - - - - - 81 14-Mai-07 B4 0 1200 - - - - - - - - 82 21-Mai-07 B0 0 1500 neg C pos 3 neg neg neg neg 83 21-Mai-07 B1 0 5000 neg C pos 35 neg neg pos neg 84 21-Mai-07 B2 0 2900 neg C pos 19 neg neg neg neg 85 21-Mai-07 B EI 0 2700 - - - - - - - - 86 21-Mai-07 B3 0 1600 neg C pos 18 neg neg neg neg
Page 92
Appendix___________________________________________________________________________________________________________________________ 91
Nr Date Sample site Weather ID E Coli Salmonella Quality EHEC Pseudomonads Campylobacter ggI ggII Rotavirus 87 21-Mai-07 B V 0 1700 - - - - - - - - 88 21-Mai-07 B T 0 2100 - - - - - - - - 89 21-Mai-07 B4 0 4700 - - - - - - - - 90 30-Mai-07 B0 2 30000 - - - - - - - - 91 30-Mai-07 B1 2 1600 - - - - - - - - 92 30-Mai-07 B2 2 2000 - - - - - - - - 93 30-Mai-07 B3 2 1700 - - - - - - - - 94 30-Mai-07 B V 2 1700 - - - - - - - - 95 30-Mai-07 B T 2 2400 - - - - - - - - 96 30-Mai-07 B4 2 2500 - - - - - - - - 97 04-Jun-07 B0 3 810 neg B pos 6 neg neg neg neg 98 04-Jun-07 B1 3 21000 pos D pos 23 neg neg neg pos 99 04-Jun-07 B2 3 1200 neg C pos 15 neg neg neg neg
100 04-Jun-07 B3 3 850 neg D pos 2 neg neg neg neg 101 04-Jun-07 B V 3 1200 - - - - - - - - 102 04-Jun-07 B T 3 1200 - - - - - - - - 103 04-Jun-07 B4 3 950 - - - - - - - - 104 18-Jun-07 B0 2 4700 pos D pos 230 neg neg neg neg 105 18-Jun-07 B1 2 9000 pos D pos 180 neg neg neg neg 106 18-Jun-07 B2 2 7100 neg C pos 230 neg neg neg pos 107 18-Jun-07 B3 2 4900 pos D pos 38 neg neg neg neg 108 18-Jun-07 B V 2 3300 - - - - - - - - 109 18-Jun-07 B T 2 3400 - - - - - - - - 110 18-Jun-07 B4 2 14400 - - - - - - - - 111 25-Jun-07 B0 0 1400 neg C pos 6 pos neg neg neg 112 25-Jun-07 B1 0 24000 pos D pos 110 neg neg neg neg 113 25-Jun-07 B2 0 1400 neg C pos 18 neg neg neg neg 114 25-Jun-07 B3 0 1200 neg C pos 9 neg neg neg neg 115 25-Jun-07 B V 0 1500 - - - - - - - - 116 25-Jun-07 B T 0 1500 - - - - - - - - 117 25-Jun-07 B4 0 1500 - - - - - - - - 118 02-Jul-07 B0 2 2800 neg C pos 15 neg neg neg neg 119 02-Jul-07 B1 2 78000 pos D pos 170 neg neg pos neg
Page 93
Appendix___________________________________________________________________________________________________________________________ 92
Nr Date Sample site Weather ID E Coli Salmonella Quality EHEC Pseudomonads Campylobacter ggI ggII Rotavirus 120 02-Jul-07 B2 2 6000 pos D pos 62 pos neg neg neg 121 02-Jul-07 B3 2 3000 neg C pos 14 neg neg neg neg 122 02-Jul-07 B V 2 4900 - - - - - - - - 123 02-Jul-07 B T 2 6300 - - - - - - - - 124 02-Jul-07 B4 2 1700 pos D pos 12 neg neg neg neg 125 09-Jul-07 B0 1 6800 neg C pos 30 neg neg neg neg 126 09-Jul-07 B1 1 30400 pos D pos 210 neg neg neg neg 127 09-Jul-07 B2 1 7700 pos D pos 40 pos neg neg neg 128 09-Jul-07 B3 1 7000 neg C pos 72 pos neg neg neg 129 09-Jul-07 B V 1 8100 - - - - - - - - 130 09-Jul-07 B T 1 8000 - - - - - - - - 131 09-Jul-07 B4 1 10600 pos D pos 45 pos neg neg neg 132 16-Jul-07 B0 0 330 neg B - - neg - - - 133 16-Jul-07 B1 0 84000 pos D - - neg - - - 134 16-Jul-07 B2 0 1040 neg C - - pos - - - 135 16-Jul-07 B3 0 770 pos C - - neg - - - 136 16-Jul-07 B V 0 680 - - - - - - - - 137 16-Jul-07 B T 0 1200 - - - - - - - - 138 16-Jul-07 B4 0 1300 pos D - - neg - - - 139 30-Jul-07 B0 2 26600 pos D pos 600 neg neg pos neg 140 30-Jul-07 B1 2 15000 neg C pos 230 neg neg neg neg 141 30-Jul-07 B2 2 27000 pos D pos 400 neg neg pos neg 142 30-Jul-07 B3 2 18300 pos D pos 540 neg neg pos neg 143 30-Jul-07 B V 2 22600 - - - - - - - - 144 30-Jul-07 B T 2 23400 - - - - - - - - 145 30-Jul-07 B4 2 26000 neg C pos 681 pos neg pos neg 146 20-Aug-07 B0 2 5400 neg C pos 21 neg neg neg neg 147 20-Aug-07 B1 2 23000 neg C pos 50 neg pos pos neg
Page 94
Appendix___________________________________________________________________________________________________________________________ 93
B: Ergolz
Nr Date sample site Weather ID E Coli Salmonella Quality EHEC Pseudomands Campylobacter ggI ggII Rotavirus1 20-Mrz-07 E0 1 1300 neg C neg - neg neg neg pos 2 20-Mrz-07 E1 1 2110 neg C neg - neg neg neg pos 3 20-Mrz-07 E2 1 1500 neg C pos - neg neg neg pos 4 20-Mrz-07 E zw 1 1300 neg C pos - neg neg neg pos 5 20-Mrz-07 E3 1 1500 neg C pos - neg neg neg pos 6 27-Mrz-07 E0 0 2500 - - - - - - - - 7 27-Mrz-07 E1 0 15000 - - - - - - - - 8 27-Mrz-07 E2 0 3900 - - - - - - - - 9 27-Mrz-07 E3 0 1500 - - - - - - - -
10 27-Mrz-07 E nF 0 1100 - - - - - - - - 11 29-Mrz-07 E0 0 440 - - - - - - - - 12 29-Mrz-07 E1 0 15000 - - - - - - - - 13 29-Mrz-07 E2 0 2700 - - - - - - - - 14 29-Mrz-07 E4 0 620 - - - - - - - - 15 29-Mrz-07 E nF 0 700 - - - - - - - - 16 03-Apr-07 E0 0 1000 pos C - neg neg - - - 17 03-Apr-07 E1 0 33600 neg C - neg neg- - - - 18 03-Apr-07 E2 0 13000 - - - - - - - - 19 03-Apr-07 E zw 0 11500 - - - - - - - - 20 03-Apr-07 E3 0 860 - - - - - - - - 21 11-Apr-07 E0 0 1070 neg C neg pos neg pos neg neg 22 11-Apr-07 E1 0 41200 pos D pos pos neg pos neg neg 23 11-Apr-07 E2 0 18700 - - - - - - - - 24 11-Apr-07 E3 0 1100 - - - - - - - - 25 11-Apr-07 E4 0 2000 - - - - - - - - 26 11-Apr-07 E nF 0 -2000 - - - - - - - - 27 16-Apr-07 E0 0 360 neg B - - neg - - - 28 16-Apr-07 E1 0 62000 neg C - - neg - - - 29 16-Apr-07 E2 0 15400 neg C - - neg - - - 30 16-Apr-07 E zw 0 690 neg B - - neg - - - 31 16-Apr-07 E3 0 780 neg B - - neg - - -
Page 95
Appendix___________________________________________________________________________________________________________________________ 94
Nr Date sample site Weather ID E Coli Salmonella Quality EHEC Pseudomands Campylobacter ggI ggII Rotavirus 32 23-Apr-07 E0 0 280 neg B neg neg neg neg neg pos 33 23-Apr-07 E1 0 81000 pos D pos 680 neg neg neg pos 34 23-Apr-07 E2 0 35000 pos D pos 200 neg neg neg pos 35 23-Apr-07 E zw 0 2000 - - - - - - - - 36 23-Apr-07 E3 0 2700 - - - - - - - - 37 23-Apr-07 E zw2 0 4200 - - - - - - - - 38 23-Apr-07 E4 0 4300 - - - - - - - - 39 02-Mai-07 E0 0 850 pos C neg 38 neg neg neg neg 40 02-Mai-07 E1 0 28000 pos D pos 500 neg pos neg neg 41 02-Mai-07 E2 0 21000 pos D pos 90 neg pos neg neg 42 02-Mai-07 E3 0 3300 - - - - - - - - 43 02-Mai-07 E nF 0 2800 - - - - - - - - 44 02-Mai-07 E bb 0 5700 - - - - - - - - 45 02-Mai-07 E mb 0 5800 - - - - - - - - 46 05-Mai-07 E0 1 3000 - - - - - - - - 47 05-Mai-07 E1 1 61000 - - - - - - - - 48 05-Mai-07 E2 1 56000 - - - - - - - - 49 05-Mai-07 E3 1 3700 - - - - - - - - 50 05-Mai-07 E4 1 7900 - - - - - - - - 51 05-Mai-07 E bb 1 9600 - - - - - - - - 52 05-Mai-07 E mb 1 13700 - - - - - - - - 53 06-Mai-07 E0 2 6800 - - - - - - - - 54 06-Mai-07 E1 2 30500 - - - - - - - - 55 06-Mai-07 E2 2 27000 - - - - - - - - 56 06-Mai-07 E3 2 6700 - - - - - - - - 57 06-Mai-07 E4 2 6800 - - - - - - - - 58 06-Mai-07 E bb 2 6200 - - - - - - - - 59 06-Mai-07 E mb 2 9300 - - - - - - - - 60 07-Mai-07 E0 3 1600 neg C neg 20 neg neg pos pos 61 07-Mai-07 E1 3 26000 pos D pos 200 neg neg pos neg 62 07-Mai-07 E2 3 22000 pos D pos 127 neg neg pos neg 63 07-Mai-07 E3 3 1400 - - - - - - - - 64 07-Mai-07 E4 3 2100 - - - - - - - -
Page 96
Appendix___________________________________________________________________________________________________________________________ 95
Nr Date sample site Weather ID E Coli Salmonella Quality EHEC Pseudomands Campylobacter ggI ggII Rotavirus 65 07-Mai-07 E bb 3 4800 - - - - - - - - 66 07-Mai-07 E mb 3 4900 - - - - - - - - 67 14-Mai-07 E0 0 305 - - - - - - - - 68 14-Mai-07 E1 0 15000 - - - - - - - - 69 14-Mai-07 E2 0 13500 - - - - - - - - 70 14-Mai-07 E3 0 1400 - - - - - - - - 71 14-Mai-07 E4 0 2300 - - - - - - - - 72 14-Mai-07 E bb 0 2300 - - - - - - - - 73 14-Mai-07 E mb 0 2100 - - - - - - - - 74 21-Mai-07 E0 0 270 pos C neg 1 pos neg neg pos 75 21-Mai-07 E1 0 21000 pos D pos 32 neg neg neg pos 76 21-Mai-07 E2 0 14000 pos D pos 27 neg neg pos pos 77 21-Mai-07 E3 0 450 pos C pos 4 neg neg pos neg 78 21-Mai-07 E4 0 1100 - - - - - - - - 79 21-Mai-07 E mb 0 1600 - - - - - - - - 80 30-Mai-07 E0 2 1700 - - - - - - - - 81 30-Mai-07 E1 2 21000 - - - - - - - - 82 30-Mai-07 E2 2 7800 - - - - - - - - 83 30-Mai-07 E3 2 1600 - - - - - - - - 84 30-Mai-07 E4 2 2400 - - - - - - - - 85 30-Mai-07 E bb 2 2500 - - - - - - - - 86 30-Mai-07 E mb 2 2900 - - - - - - - - 87 04-Jun-07 E0 3 550 neg B neg 8 neg neg nge pos 88 04-Jun-07 E1 3 71000 pos D pos 550 neg neg neg neg 89 04-Jun-07 E2 3 12000 pos D pos 58 neg neg neg neg 90 04-Jun-07 E3 3 860 pos C pos 6 neg neg neg neg 91 04-Jun-07 E4 3 1700 - - - - - - - - 92 04-Jun-07 E bb 3 2500 - - - - - - - - 93 04-Jun-07 E mb 3 2500 - - - - - - - - 94 18-Jun-07 E0 2 2300 neg C pos 48 neg neg neg neg 95 18-Jun-07 E1 2 31000 pos D pos 750 neg neg neg neg 96 18-Jun-07 E2 2 7300 pos D pos 250 neg neg neg neg 97 18-Jun-07 E3 2 2700 pos D pos 180 meg neg neg neg
Page 97
Appendix___________________________________________________________________________________________________________________________ 96
Nr Date sample site Weather ID E Coli Salmonella Quality EHEC Pseudomands Campylobacter ggI ggII Rotavirus 98 18-Jun-07 E4 2 3200 - - - - - - - - 99 18-Jun-07 E bb 2 5000 - - - - - - - -
100 18-Jun-07 E mb 2 5600 - - - - - - - - 101 25-Jun-07 E0 0 750 neg B pos 6 neg neg neg neg 102 25-Jun-07 E1 0 24000 pos D pos 910 neg neg neg neg 103 25-Jun-07 E2 0 6400 pos D pos 360 neg neg neg neg 104 25-Jun-07 E3 0 700 neg B pos 2 neg neg neg neg 105 25-Jun-07 E4 0 1600 - - - - - - - - 106 25-Jun-07 E bb 0 2300 - - - - - - - - 107 25-Jun-07 E mb 0 1800 - - - - - - - - 108 02-Jul-07 E0 2 10700 pos D pos 70 pos neg neg neg 109 02-Jul-07 E1 2 29000 pos D pos 660 neg neg neg neg 110 02-Jul-07 E2 2 22000 pos D pos 450 neg neg neg pos 111 02-Jul-07 E3 2 29700 pos D pos 1200 neg neg neg neg 112 02-Jul-07 E4 2 30000 pos D pos 870 neg neg neg neg 113 02-Jul-07 E bb 2 27000 - - - - - - - - 114 02-Jul-07 E mb 2 26000 - - - - - - - - 115 09-Jul-07 E0 1 20200 pos D pos 48 pos neg neg neg 116 09-Jul-07 E1 1 21000 pos D pos 1000 neg pos neg neg 117 09-Jul-07 E2 1 18000 pos D pos 350 pos pos neg neg 118 09-Jul-07 E3 1 99999 pos D pos 460 neg neg neg neg 119 09-Jul-07 E4 1 20900 pos D pos 160 neg neg neg neg 120 09-Jul-07 E bb 1 13400 - - - - - - - - 121 09-Jul-07 E mb 1 12700 - - - - - - - - 122 16-Jul-07 E0 0 730 pos C - - neg - - - 123 16-Jul-07 E1 0 15200 pos D - - neg 124 16-Jul-07 E2 0 5800 neg C - - neg - - - 125 16-Jul-07 E3 0 630 pos C - - neg - - - 126 16-Jul-07 E4 0 630 pos C - - neg - - - 127 16-Jul-07 E bb 0 1600 - - - - - - - - 128 16-Jul-07 E mb 0 1300 - - - - - - - - 129 30-Jul-07 E0 2 9100 pos D pos 480 neg neg pos pos 130 30-Jul-07 E1 2 23000 pos D pos 350 neg neg neg neg
Page 98
Appendix___________________________________________________________________________________________________________________________ 97
Nr Date sample site Weather ID E Coli Salmonella Quality EHEC Pseudomands Campylobacter ggI ggII Rotavirus 131 30-Jul-07 E2 2 13000 pos D pos 560 neg neg pos neg 132 30-Jul-07 E3 2 6400 pos D pos 120 neg neg pos neg 133 30-Jul-07 E4 2 8800 pos D pos 130 neg neg pos neg 134 30-Jul-07 E bb 2 7500 - - - - - - - - 135 30-Jul-07 E mb 2 7900 - - - - - - - - 136 20-Aug-07 E0 2 1400 pos D pos 950 neg pos neg neg 137 20-Aug-07 E1 2 101000 pos D pos 300 pos neg neg neg
Page 99
Appendix___________________________________________________________________________________________________________________________ 98
Appendix II. Data of groundwater samples
Date: 18.07.2007
Surface water Groundwater
Time 1ml 10ml 100ml Result*
discharge turbidity (FNU)
UV-Absorption/m
conductance (µs/cm)
Time 1ml 10ml 100ml Result* Water level (m)
turbidity (FNU)
UV-Absorption/m
conducta(µs/cm
1 08:45 4 80 d 760 11.766 1.19 4.23 424 1 08:45 0 0 0 0 300.02 - - -
2 10:45 14 90 d 950 12.496 0.86 4.19 431 10:45 300.02 3 12:45 7 82 d 800 11.341 1.28 4.08 429 12:45 300.023
4 14:45 4 68 d 650 11.200 0.68 3.99 428 2 15:00 0 0 0 0 299.96 0.1 2.08 461
5 16:45 6 69 d 680 12.244 0.62 4.12 417 16:45 299.945
6 18:45 5 63 d 620 12.103 0.66 4.00 417 18:45 299.988
7 20:45 9 48 d 520 11.620 0.70 4.53 416 20:45 299.959
8 22:45 7 60 d 610 11.583 0.90 3.98 424 3 22:00 0 0 0 0 299.93 0.1 2.06 460
9 00:45 4 41 d 410 11.382 0.84 4.01 423 00:45 300.007
10 02:45 4 53 d 520 11.177 1.03 4.01 424 02:45 299.991
11 04:45 6 103 d 990 10.817 1.20 4.05 423 04:45 300.006
12 06:45 11 79 d 820 11.698 0.78 4.22 422 06:45 299.965
13 08:45 13 127 d 1300 11.738 1.17 4.00 422 4 08:45 0 0 0 0 299.98 0.09 1.75 452
Groundwater
* E.coli/100ml
Date: 6.-9.08.2007
Surface water
Ground water
Page 100
Appendix___________________________________________________________________________________________________________________________ 99
Time Date 1ml 10ml 100ml Result*
discharge turbidity (FNU)
UV-Absorption/m
conductance (µs/cm)
Time Date 1ml 10ml 100ml Result* Water level (m)
turbidity (FNU)
UV-Absorption/m
conductance (µs/cm)
1 12:30 6.8. 2 33 255 290 8.172 1.20 4.22 413
2 14:30 6.8. 3 34 297 300 8.116 0.90 4.10 412 1 14:00 6.8. 0 0 0 0 299.861 1.08 2.32 438
3 16:30 6.8. 2 32 212 220 8.051 0.93 4.10 411 16:30 6.8. 299.85
4 18:30 6.8. 0 27 223 250 8.296 0.91 4.10 416 2 17:00 6.8. 0 0 0 0 299.858 1.53 2.53 440 5 20:30 6.8. 1 12 127 126 8.343 0.90 4.10 412 20:30 6.8. 299.85
6* 22:30 6.8. - - - 8.210 22:30 6.8. 299.815
7* 00:30 7.8. - - - 8.343 00:30 7.8. 299.873 8* 02:30 7.8. - - - 15.291 02:30 7.8. 299.919 9* 04:30 7.8. - - - 12.124 04:30 7.8. 299.876
10* 06:30 7.8. - - - 24.180 3 07:00 7.8. 0 0 0 0 299.94 0.18 1.72 448 11* 08:30 7.8. - - - 23.096 08:30 7.8. 299.919 12* 10:30 7.8. - - - 22.814 10:30 7.8. 300.006
13* 12:30 7.8. - - - 27.670 4 12:00 7.8. 0 0 0 0 300.049 0.13 1.66 446
14 14:30 7.8. d d d 50000 41.419 268.00 9.83 371 14:30 7.8. 300.122
15 16:30 7.8. 372 d d 37000 40.317 164.00 8.73 344 5 17:00 7.8. 0 0 0 0 300.124 0.12 1.71 447
16 18:30 7.8. 324 d d 32000 35.617 130.00 11.04 327 18:30 7.8. 300.191
17 20:30 7.8. 281 d d 28000 30.452 125.00 12.93 329 20:30 7.8. 300.162
18 22:30 7.8. 248 d d 25000 28.235 123.00 15.10 340 22:30 7.8. 300.205
19 00:30 8.8. 220 d d 22000 27.295 102.00 15.47 355 00:30 8.8. 300.214
20 02:30 8.8. 176 d d 18000 25.306 68.00 14.90 371 02:30 8.8. 300.197
21 04:30 8.8. 138 d d 14000 30.114 58.00 13.20 390 04:30 8.8. 300.211
22 06:30 8.8. 209 d d 21000 32.759 55.00 11.80 391 6 07:00 8.8. 0 0 9 9 300.21 0.15 1.94 448
23 08:30 8.8. 106 d d 11000 39.083 122.00 11.10 388 08:30 8.8. 300.263
24 10:30 8.8. 175 d d 18000 43.466 58.00 10.81 399 7 10:30 8.8. 0 4 12 15 300.234 0.12 1.94 448
25 12:30 8.8. - - - 44.974 12:30 8.8. 300.324
26 14:30 8.8. - - - 39.915 14:30 8.8. 300.281
27 16:30 8.8. - - - 37.252 16:30 8.8. 300.339
28 18:30 8.8. - - - 40.235 18:30 8.8. 300.286
Page 101
Appendix___________________________________________________________________________________________________________________________ 100
29 20:30 8.8. - - - 66.361 20:30 8.8. 300.396
30 22:30 8.8. - - - 134.533 22:30 8.8. 300.66
31 00:30 9.8. - - - 219.462 00:30 9.8. 301.458
32 02:30 9.8. - - - 239.844 02:30 9.8. 302.121
33 04:30 9.8. - - - 282.694 04:30 9.8. 303.032
34 06:30 9.8. - - - 328.556 06:30 9.8. 303.623
35 08:30 9.8. - - - 344.771 08:30 9.8. 304.002
36 10:30 9.8. - - - 366.831 8 11:00 9.8. 0 1 4 5 304.236 0.16 1.88 447
37 12:30 9.8. - - - 369.934 12:30 9.8. 304.216
38 14:30 9.8. - - - 356.289 9 14:00 9.8. 0 3 20 21 304.134 0.18 1.91 449
E.coli / 100 ml water
* Sampling error, no samples 22:30-12:30
Date: 24.-28.9.2007 Surface water Groundwater
Time Date 1ml 10ml 100ml Result* discharge turbidity
(FNU) UV-
Absorption/m
Conduc Tance
(µs/cm) Time Date 1ml 10ml 100ml Result* discharge turbidity
(FNU)
UV-Absorption/
m
conductance (µs/cm)
1 18:00 24.9. 6 61 d 600 7.184 0.42 3.4 417 1 16:30 24.9. 0 0 0 0 299.852 1.4 2.2 415 2 20:00 24.9. 8 46 d 490 7.492 0.59 3.5 421 20:00 299.852
Page 102
Appendix___________________________________________________________________________________________________________________________ 101
3 22:00 24.9. 5 34 d 350 7.102 0.56 3.5 420 22:00 299.85
4 00:00 25.9. 7 59 d 600 7.415 0.63 3.6 417 00:00 299.85 5 02:00 25.9. 12 73 d 770 7.393 1.07 4.0 422 02:00 299.85 6 04:00 25.9. 12 87 d 900 7.431 1.19 3.8 425 04:00 299.852 7 06:00 25.9. 13 106 d 1080 7.215 0.86 3.7 427 06:00 299.852 8 08:00 25.9. 16 100 d 1050 7.436 0.75 3.6 427 2 07:30 25.9. 0 0 0 0 299.85 5.18 3.1 431 9 10:00 25.9. 21 170 d 1700 8.454 0.82 3.8 432 10:00 299.8
10 12:00 25.9. 33 218 d 2300 7.535 0.76 4.1 432 12:00 299.858 11 14:00 25.9. 27 237 d 2400 7.036 0.80 4.3 431 14:00 299.858 12 16:00 25.9. 27 214 d 2200 7.305 0.78 4.0 429 3 16:30 25.9. 0 0 0 0 299.847 0.5 2 418 13 18:00 25.9. - - - 7.668 18:00 299.85 14 20:00 25.9. - - - 7.168 4 19:30 25.9. 0 0 0 0 299.792 0.41 1.9 423 15 22:00 25.9. - - - 7.082 22:00 299.844
16 00:00 26.9. - - - 6.868 00:00 299.844 17 02:00 26.9. - - - 7.062 02:00 299.829 18 04:00 26.9. - - - 6.879 04:00 299.848 19 06:00 26.9. - - - 7.046 06:00 299.844 20 08:00 26.9. - - - 6.918 5 07:30 26.9. 0 0 1 1 299.795 0.21 1.8 416 14 09:40 26.9. 25 225 d 2500 7.285 1.01 4.0 425 6 10:30 26.9. 0 0 0 1 299.829 0.4 1.9 419 15 11:40 26.9. 13 123 d 1300 6.744 1.66 4.0 424 11:40 299.832 16 13:40 26.9. 16 101 d 1100 6.617 0.49 4.0 429 7 13:00 26.9. 0 0 0 0 19 299.78 1.21 2.1 420 17 15:40 26.9. 20 106 d 1200 7.179 0.87 4.4 415 8 16:00 26.9. 0 0 2 2 198 299.835 0.5 1.9 416 18 17:40 26.9. 8 116 d 1100 7.272 0.48 4.0 417 17:40 299.835 19 19:40 26.9. 15 75 d 820 6.839 0.75 3.9 416 19:40 299.821 20 21:40 26.9. 11 107 d 1100 7.190 0.32 3.7 415 21:40 299.835 21 23:40 26.9. 9 144 d 1400 7.029 0.75 3.9 423 23:40 299.809
22 01:40 27.9. 8 66 d 670 7.518 0.53 4.0 428 01:40 299.838 23 03:40 27.9. 16 166 d 1600 7.993 0.49 4.0 418 03:40 299.85 24 05:40 27.9. 27 258 d 2600 9.035 1.70 4.1 413 05:40 299.864 25 07:40 27.9. 27 239 d 2400 9.187 1.74 4.0 417 9 07:15 27.9. 0 0 0 0 299.821 0.18 1.8 412 26 09:40 27.9. 76 d d 7600 10.675 4.60 4.4 425 09:40 299.902 27 11:40 27.9. 120 d d 12000 10.993 0.53 6.1 438 11:40 299.878 28 13:40 27.9. 141 d d 14100 11.748 2.09 5.0 425 10 13:15 27.9. 0 0 0 0 299.933 0.45 2.2 415 29 15:40 27.9. 73 d d 7300 12.063 2.05 5.0 411 15:40 299.962 30 17:40 27.9. 93 d d 9300 13.083 3.10 5.3 402 11 18:00 27.9. 0 1 1 2 299.95 0.2 2.1 0.419 31 19:40 27.9. 119 d d 11900 12.476 4.71 6.0 402 19:40 299.977 32 21:40 27.9. 97 d d 9700 12.080 5.69 6.0 402 21:40 299.919 33 23:40 27.9. 88 d d 8800 13.442 4.12 5.7 407 23:40 299.977
34 01:40 28.9. 65 d d 6500 12.569 2.23 5.6 408 01:40 299.983 35 03:40 28.9. 92 d d 9200 12.016 3.80 5.5 406 03:40 299.977 36 05:40 28.9. 48 d d 4800 11.523 2.94 5.6 407 12 07:15 28.9. 0 0 0 0 299.89 0.51 1.9 416
Page 103
Appendix___________________________________________________________________________________________________________________________ 102
37 10:00 28.9. - - - 11.147 - - - 13 10:00 28.9. 0 0 0 0 299.89 0.19 2.1 410 * E.coli/100ml
Tuesday and Wednesday raining sporadically 7 13:00 26.9. 0 6 15 19 → Burkholderia cepacia, Enterobacter cloacae, * loss of energy, 8 samples missing 8 16:00 26.9. 0 28 190 198 Acinetobacter baumanii
Appendix III. Sample site diagrams A: Birs
B0
B
- --
C
C*
-C*
B
--
C
-
C
-
B
D*
CC
C
B
D*C
1000
10000
100000
log
(E.c
oli/1
00m
l wat
er)
B2
B-
---
-
-
C*
C - - C
-C -
C
C
C
D* D*
C
D*
100
1000
10000
100000
Page 104
Appendix___________________________________________________________________________________________________________________________ 103
B: Ergolz
B3
C
D*
C-C
-C
--
BB
--
- --
CC
C*
D*
1
10
100
1000
10000
100000
27.0
3.
29.0
3.
03.0
4.
11.0
4.
16.0
4.
23.0
4.
02.0
5.
05.0
5.
06.0
5.
07.0
5.
14.0
5.
21.0
5.
30.0
5.
04.0
6.
18.0
6.
25.0
6.
02.0
7.
09.0
7.
16.0
7.
30.0
7.
log
(E.c
oli/1
00m
l wat
er)
B4
C
D*
D*
D*-
-
---
--
-
--
-
1
10
100
1000
10000
100000
23.0
4.
02.0
5.
05.0
5.
06.0
5.
07.0
5.
14.0
5.
21.0
5.
30.0
5.
04.0
6.
18.0
6.
25.0
6.
02.0
7.
09.0
7.
16.0
7.
30.0
7.
log
(E.c
oli/1
00m
l)
E0
-
C
---
C
-C* C
B B
C*
C*
-
B
C
B
D*D*
C*
D*
D*
100
1000
10000
100000
log
(E.c
oli/1
00m
l)
E2
-D*-
D*--
D*D*
C--
--C
D*D* D*
D* D*
C
D*
100
1000
10000
100000
log
(E.c
oli/1
00m
l)
Page 105
Appendix___________________________________________________________________________________________________________________________ 104
Appendix IV. Sample event diagrams A: Birs
Page 106
Appendix___________________________________________________________________________________________________________________________ 105
12.03.
BB
C
B
1
10
100
1000
10000
B0 B1 B2 B EI
20.03
-
- - - -
1
10
100
1000
10000
100000
B0 B1 B2 B AI B EI
27.03.
----
1
10
100
1000
10000
B0 B1 B2 B3
29.03.
- - - - -
1
10
100
1000
10000
B0 B1 B2 B3 B T
03.04.
C
B - - -
1
10
100
1000
10000
B0 B1 B2 B3 B V
11.04.
---
C
C*
1
10
100
1000
10000
100000
B0 B1 B2 B3 B V
16.04.
----
-
-
1
10
100
1000
10000
100000
B0 B1 B2 B3 B aw B V
23.04.
C*
C
C* -B - -
-
1
10
100
1000
10000
B0 B1 B2 B EI B3 B V B T B4
02.05.
B
C C
-
B - - -
1
10
100
1000
10000
B0 B1 B2 B EI B3 B V B T B4
Page 107
Appendix___________________________________________________________________________________________________________________________ 106
05.05.
-------
-
1
10
100
1000
10000
100000
B0 B1 B2 B EI B3 B V B T B4
06.05.
--------
1
10
100
1000
10000
100000
B0 B1 B2 B EI B3 B V B T B4
07.05.
C C
C
C
-
- - -
1
10
100
1000
10000
B0 B1 B2 B EI B3 B V B T B4
14.05.
-----
-
-
1
10
100
1000
10000
B0 B1 B2 B3 B V B T B4
21.05.2007
CC C - C - -
-
1
10
100
1000
10000
B0 B1 B2 B EI B3 B V B T B4
30.05.
-
- - - - - -
1
10
100
1000
10000
100000
B0 B1 B2 B3 B V B T B4
04.06.
D*
D*
C D* - - -
1
10
100
1000
10000
100000
B0 B1 B2 B3 B V B T B4
18.06.
---D*CD*D*
1
10
100
1000
10000
100000
B0 B1 B2 B3 B V B T B4
25.06.
---CC
D*
C
1
10
100
1000
10000
100000
B0 B1 B2 B3 B V B T B4
Page 108
Appendix___________________________________________________________________________________________________________________________ 107
02.07.
C
D*
D*C - -
D*
1
10
100
1000
10000
100000
B0 B1 B2 B3 B V B T B4
09.07.
CD*
D* C - - D*
1
10
100
1000
10000
100000
B0 B1 B2 B3 B V B T B4
16.07.
B
D*
C C* - - D*
1
10
100
1000
10000
100000
B0 B1 B2 B3 B V B T B4
log
(E.c
oli/1
00m
l)
30.07.
C--D*D*CD*
1
10
100
1000
10000
100000
B0 B1 B2 B3 B V B T B4
Page 109
Appendix___________________________________________________________________________________________________________________________ 108
B: Ergolz
20.03.
CCCC C
1
10
100
1000
10000
E0 E1 E2 E zw E3
27.03.
---
--
1
10
100
1000
10000
100000
E0 E1 E2 E3 E nF
29.03.
---
-
-
1
10
100
1000
10000
100000
E0 E1 E2 E4 E nF
03.04.
---C
C*
110
1001000
10000100000
E0 E1 E2 E zw E3
11.04.
D*
C
-
- - -
1
10
100
1000
10000
100000
E0 E1 E2 E3 E4 E nF
16.04.
BB
CC
B
1
10
100
1000
10000
100000
E0 E1 E2 E zw E3
23.04.
B
D*D*
- - - -
1
10
100
1000
10000
100000
E0 E1 E2 E zw E3 E zw 2 E4
02.05.
----
D*D*
C*
1
10
100
1000
10000
100000
E0 E1 E2 E3 E nF E bb E mb
05.05.
-
- -
-- - -
1
10
100
1000
10000
100000
E0 E1 E2 E3 E4 E bb E mb
Page 110
Appendix___________________________________________________________________________________________________________________________ 109
06.05.
------
-
1
10
100
1000
10000
100000
E0 E1 E2 E3 E4 E bb E mb
07.05.
----
D*D*
C
1
10
100
1000
10000
100000
E0 E1 E2 E3 E4 E bb E mb
14.05.
---
--
-
-
1
10
100
1000
10000
100000
E0 E1 E2 E3 E4 E bb E mb
21.05.
-C*
D* D*
C*-
1
10
100
1000
10000
100000
E0 E1 E2 E3 E4 E mb
30.05.
-----
-
-
1
10
100
1000
10000
100000
E0 E1 E2 E3 E4 E bb E mb
04.06.
---C*
D*
D*
B
1
10
100
1000
10000
100000
E0 E1 E2 E3 E4 E bb E mb
Page 111
Appendix___________________________________________________________________________________________________________________________ 110
18.06.
---D*D*
D*
C
1
10
100
1000
10000
100000
E0 E1 E2 E3 E4 E bb E mb
25.06.
---B
D*D*
B
1
10
100
1000
10000
100000
E0 E1 E2 E3 E4 E bb E mb
02.07.
--D*D*D*D*D*
1
10
100
1000
10000
100000
E0 E1 E2 E3 E4 E bb E mb
09.07.
--D*D*
D*D*D*
1
10
100
1000
10000
100000
E0 E1 E2 E3 E4 E bb E mb
16.07.
--C*C*
D*D*
C*
1
10
100
1000
10000
100000
E0 E1 E2 E3 E4 E bb E mb
log
(E.c
oli/1
00m
l)
30.07.
--D*D*D*D*
D*
1
10
100
1000
10000
100000
E0 E1 E2 E3 E4 E bb E mb
Page 112
Appendix_____________________________________________________________________ 111
Appendix V. Tables ‚influence of SCPs’ Table XYZ: Influence of SCP for Salmonella at the Ergolz
Analysis results Frequency Frequency of influence Both places negative 2 (12.5%) E0 positive, E1 negative 1 (6.25%)
3x no influence of SCP (18.75%)
Both places positive 7 (43.75%) E0 negative, E1 positive 6 (37.5%)
13x negative influence of SCP (81.25%)
Table XYZ: Influence of SCP for Salmonella at the Birs
Analysis results Frequency Frequency of influence Both places negative 6 (40%) B0 positive, B1 negative 3 (20%)
9x no influence of SCP (60%)
Both places positive 1 (6.7%) B0 negative, B1 positive 5 (33.3%)
6x negative influence of SCP (40%)
Table XYZ: Influence of SCP for EHEC at the Ergolz
Analysis results Frequency Frequency of influence Both places negative 1 (7.6%) B0 positive, B1 negative 0
1x no influence of SCP (7.6%)
Both places positive 6 (46.2%) B0 negative, B1 positive 6 (46.2%)
12x negative influence of SCP (92.4%)
Table XYZ: Influence of SCP for EHEC at the Ergolz
Analysis results Frequency Frequency of influence Both places negative 1 (7.1%) E0 positive, E1 negative 0
1x no influence of SCP (7.1%)
Both places positive 12 (85.8%) E0 negative, E1 positive 1 (7.1%)
13x negative influence of SCP (92.9%)
Table XYZ: Influence of SCP for Pseudomonas at the Ergolz
Analysis results Frequency Frequency of influence Both places negative 1 (7.7%) E0 positive, E1 negative 0
1x no influence of SCP (7.7%)
Both places positive 11 (84.6%) E0 negative, E1 positive 1 (7.7%)
12x negative influence of SCP (92.3%)
Table XYZ: Influence of SCP for Pseudomonas at the Birs
Analysis results Frequency Frequency of influence Both places negative 0 E0 positive, E1 negative 1 (7.7%)
1x no influence of SCP (7.7%)
Both places positive 12 (92.3%) E0 negative, E1 positive 0
12x negative influence of SCP (92.3%)
Page 113
Appendix_____________________________________________________________________ 112
Table XYZ: Influence of SCP for Rotavirus at Ergolz
Analysis results Frequency Frequency of influence Both places negative 7 (53.8%) E0 positive, E1 negative 3 (23.1%)
10x no influence of SCP (76.9%)
Both places positive 3 (23.1%) E0 negative, E1 positive 0
3x negative influence of SCP (23.1%)
Table XYZ: Influence of SCP for Rotavirus at the Birs
Analysis results Frequency Frequency of influence Both places negative 7 (50%) B0 positive, B1 negative 0
7x no influence of SCP (50%)
Both places positive 5 (35.7%) B0 negative, B1 positive 2 (14.3%)
7x negative influence of SCP (50%)
Table XYZ: Influence of SCP for Norovirus at the Ergolz
Analysis results Frequency Frequency of influence Both places negative 7 (53.8%) E0 positive, E1 negative 2 (15.4%)
9x no influence of SCP (69.2%)
Both places positive 2 (15.4%) E0 negative, E1 positive 2 (15.4%)
4x negative influence of SCP (30.8%)
Table XYZ: Influence of SCP for Norovirus at the Birs
Analysis results Frequency Frequency of influence Both places negative 8 (57.2%) B0 positive, B1 negative 1 (7.1%)
9x no influence of SCP (64.3%)
Both places positive 1 (7.1%) B0 negative, B1 positive 4 (28.6%)
5x negative influence of SCP (35.7%)