The influence of target angular velocity on visual latency difference determined using the rotating Pulfrich effect 1 RWD Nickalls 2 Vision Research (1996); 36 , 2865–2872. http://www.nickalls.org/dick/papers/pulfrich/pulfrich1996.pdf Abstract Visual latency difference was determined directly in normal volunteers, using the rotating Pulfrich technique described by Nickalls [Vision Res., 26, 367–372 (1986)]. Subjects fixated a black vertical rod rotating clockwise on a horizontal turntable turning with constant angular velocity (16·6, 33·3 or 44·7 rpm) with a neutral density filter (OD 0·7 or 1·5) in front of the right eye. For all subjects the latency difference associated with the 1·5 OD filter was significantly greater (< 0·001) with the rod rotating at 16·6 rpm than at 33·3 rpm. The existence of an inverse relationship between latency difference and angular velocity is hypothesised. 1 Introduction The Pulfrich effect is a remarkable visual illusion, seen when a moving object is viewed binocularly with a neutral density filter in front of one eye (Pulfrich, 1922). For example, if a swinging pendulum is viewed in this way from a direction at right angles to its motion, then the pendulum bob appears to describe an elliptical orbit. Although the Pulfrich effect has been extensively analysed for a pendulum and simple harmonic motion (Lit, 1949; Weale, 1954; Trincker, 1953; Levick, Cleland & Coombs, 1972), a number of other manifestations of the Pulfrich phenomenon have also been investigated. These include the ‘rotating’ Pulfrich effect (Nickalls, 1986a,1986b); apparent bending of unevenly illuminated rods (Barlow & McNaughton, 1980); a paradoxical decrease in apparent size when the target appears to come towards the observer (Weale, 1954; Spiegler, 1983); and an apparent hyperbolic path when the target moves with constant velocity in a plane which intersects the pupillary plane of the observer (Spiegler, 1986). Pulfrich effects have also been described in association with concentric rotation (Prestrude & Baker, 1968); bouncing balls (Wilson, 1965); motion of the observer (Enright, 1970), as well as in a variety of medical conditions which affect the optic nerve 1 This minor revision (December 2008) includes the age data for each subject (unfortunately omitted in the original published version—see section 2.7), fixes typos and adds some explanatory footnotes. 2 Department of Anaesthesia, Nottingham University Hospitals, City Hospital Campus, Nottingham, UK. email: [email protected]
Transcript
The influence of target angular velocity onvisual latency difference determined using
the rotating Pulfrich effect1
RWD Nickalls 2
Vision Research (1996); 36, 2865–2872.http://www.nickalls.org/dick/papers/pulfrich/pulfrich1996.pdf
Abstract
Visual latency difference was determined directly in normal volunteers,using the rotating Pulfrich technique described by Nickalls [Vision Res., 26,367–372 (1986)]. Subjects fixated a black vertical rod rotating clockwise ona horizontal turntable turning with constant angular velocity (16·6, 33·3 or44·7 rpm) with a neutral density filter (OD 0·7 or 1·5) in front of the righteye. For all subjects the latency difference associated with the 1·5 OD filterwas significantly greater (𝑃 < 0·001) with the rod rotating at 16·6 rpmthan at 33·3 rpm. The existence of an inverse relationship between latencydifference and angular velocity is hypothesised.
1 IntroductionThe Pulfrich effect is a remarkable visual illusion, seen when a moving object isviewed binocularly with a neutral density filter in front of one eye (Pulfrich, 1922).For example, if a swinging pendulum is viewed in this way from a direction atright angles to its motion, then the pendulum bob appears to describe an ellipticalorbit.
Although the Pulfrich effect has been extensively analysed for a pendulumand simple harmonic motion (Lit, 1949; Weale, 1954; Trincker, 1953; Levick,Cleland & Coombs, 1972), a number of other manifestations of the Pulfrichphenomenon have also been investigated. These include the ‘rotating’ Pulfricheffect (Nickalls, 1986a,1986b); apparent bending of unevenly illuminated rods(Barlow & McNaughton, 1980); a paradoxical decrease in apparent size when thetarget appears to come towards the observer (Weale, 1954; Spiegler, 1983); and anapparent hyperbolic path when the target moves with constant velocity in a planewhich intersects the pupillary plane of the observer (Spiegler, 1986). Pulfricheffects have also been described in association with concentric rotation (Prestrude& Baker, 1968); bouncing balls (Wilson, 1965); motion of the observer (Enright,1970), as well as in a variety of medical conditions which affect the optic nerve
1This minor revision (December 2008) includes the age data for each subject (unfortunatelyomitted in the original published version—see section 2.7), fixes typos and adds some explanatoryfootnotes.
2Department of Anaesthesia, Nottingham University Hospitals, City Hospital Campus,Nottingham, UK. email: [email protected]
The magnitude of the Pulfrich effect has been found to be a function of theplane of motion (Spiegler, 1986); the degree of binocular intensity difference(Lythgoe, 1938; Lit, 1949); viewing distance (Lit & Hyman, 1951); target size(Spiegler, 1983); target thickness (Lit, 1960c); and target velocity (Lit, 1960a,1960b, 1964; Spiegler, 1983).
1.1 MechanismThe mechanism underlying the Pulfrich phenomenon is not clear. The classicalexplanation proposed by Fertsch (see Pulfrich, 1922), is that the phenomenonis due to a unilateral increase in visual latency resulting from the decrease inretinal image intensity due to the filter (Williams & Lit, 1983; Carney, Paradiso& Freeman, 1989). Compelling evidence in support of a temporal delay modelarises from the demonstration that a unilateral light-attenuating filter is able todelay a unilaterally time-advanced sequence of random-dot stereograms sufficientlyto restore depth perception (Julesz & White, 1969; Ross & Hogben, 1975). Asaccadic-suppression model has also been suggested (Harker, 1967) in order toexplain the apparent asymmetrical path associated with a pendulum described byTrincker (1953).
However there are difficulties associated with the classical temporal delaymodel since the Pulfrich effect can be seen even with intermittent (stroboscopic)target presentation, possibly owing to some form of interaction (e.g. lateralinhibition) between successive inputs to the eyes (Lee, 1970). It is possible thatthe filter could introduce a spatial disparity by causing fusion of non-correspondingdiscrete positions, but this is unlikely in the case where the temporal intervalbetween the motion samples is greater than the delay between the eyes (Morgan& Thompson, 1975). Furthermore, a Pulfrich-type effect can be produced withouta delay by artificially increasing the target persistence in one eye (Morgan, 1975).
1.2 Preliminary studyIn preliminary studies involving the ‘rotating’ Pulfrich effect (Nickalls, 1986a)it was noticed, contrary to expectation, that the latency difference for a givenillumination appeared to vary significantly with turntable speed. In view ofthis discrepancy, the present study was designed to investigate the influence ofturntable speed on latency difference.
2 MethodsLatency difference was determined directly using the technique described byNickalls (1986a), which makes use of a ‘rotating’ Pulfrich effect. With thistechnique, an observer with a neutral density filter in front of the right eye,binocularly fixates a horizontally clockwise rotating target from within the planeof rotation. By varying the viewing distance, the observer identifies a null-position(known as ‘transition’) at which the target appears not to rotate at all, but appearsto move only from side-to-side. The latency difference can then be calculatedfrom the viewing distance at transition (see Equation 1).
RWD Nickalls Vision Research (1996); 36, 2865–2872. 3
2.1 ApparatusThe rotating target used in the present study was a black vertical rod (1·5 mmdiameter) mounted 11·9 cm from the center of a horizontal clockwise-rotatingturntable, and was clearly visible against a white background. Rotational cuesfrom both the turntable and the ends of the rod were screened out by viewingthrough a 5 cm wide horizontal slit as described by Nickalls (1986a).
The turntable was mounted at eye-level, on a trolley which ran backwardsand forwards on a straight 3·5 m track. The observer (fixed) was positioned atone end of the track, and was able to vary the position of the trolley, and hencethe viewing distance, by turning a small hand-wheel. The subject’s head wasimmobilised using chin and forehead rests in the usual way.
The angular velocity of the turntable (Garrard SP mark 2 record player)was determined using a diffuse-scan opto-switch, and displayed continuously inrevolutions per minute (rpm; Ω) to one decimal place. The overall mean rpm(range) for each turntable speed for all observations described in this paper areas follows: 16·6 rpm (16·3–16·9); 33·3 rpm (33·0–33·9); 44·7 rpm (44·3–45·1).The maximum variation in turntable speed during a set of 10 observations (seeProcedure) was ±0·3 rpm.
2.2 IlluminationThe illumination was the same for all observations. The illumination of the boththe front screen and the background screen was from above in order to maintaina uniform luminance throughout the full range of movement of the turntableapparatus.
The luminance of the front screen and background (both white) was measuredusing a narrow angle 40A Opto-meter (Model R, United Detector TechnologyInc.) which incorporated a silicon PIN photodiode with a foot-lambert lens. Allluminance readings were made from a distance of 20 cm in front of the frontscreen; background readings were made through the viewing slit. The mean(range) luminance of both the front screen and the background screen over thefull range of viewing distance was 114 cd.m−2 (109–121; 𝑛 = 8) and 124 cd.m−2
(116–130; 𝑛 = 8) respectively.
2.3 FiltersTwo different Wrattan neutral-density filters (Kodak) were used, having opticaldensities (OD) of 0·7 and 1·5. During each experiment one of these filterswas placed in front of the right eye, using special goggles which prevented anyextraneous non-filtered light from reaching the filtered eye.
2.4 Separation of rotation centres of the eyesThe semi-separation (𝑎) of the rotation centres of the two eyes (required forEquation 1), was determined by measuring the inter-pupillary distance (IPD)when the eyes were both parallel and at right angles to the line joining the twoeyes. The IPD was measured using a corneal-reflection pupillometer (Essilor Ltd.,Bristol, UK). The IPD values presented in the Tables are the mean (rounded tothe nearest 1 mm) of five sequential measurements.
RWD Nickalls Vision Research (1996); 36, 2865–2872. 4
2.5 Transition viewing distanceThe viewing distance at ‘transition’ (𝑑T) was measured from the centre of theturntable to the line joining the centres of rotation of the two eyes. This was doneby first measuring the distance from the centre of the turntable to the front ofthe cornea. An additional 1·5 cm was then added to this value to account for thedistance between the front of the cornea and the rotation centre of the eye (Fry& Hill, 1962). For all studies the viewing distance at transition was within therange 90–270 cm.
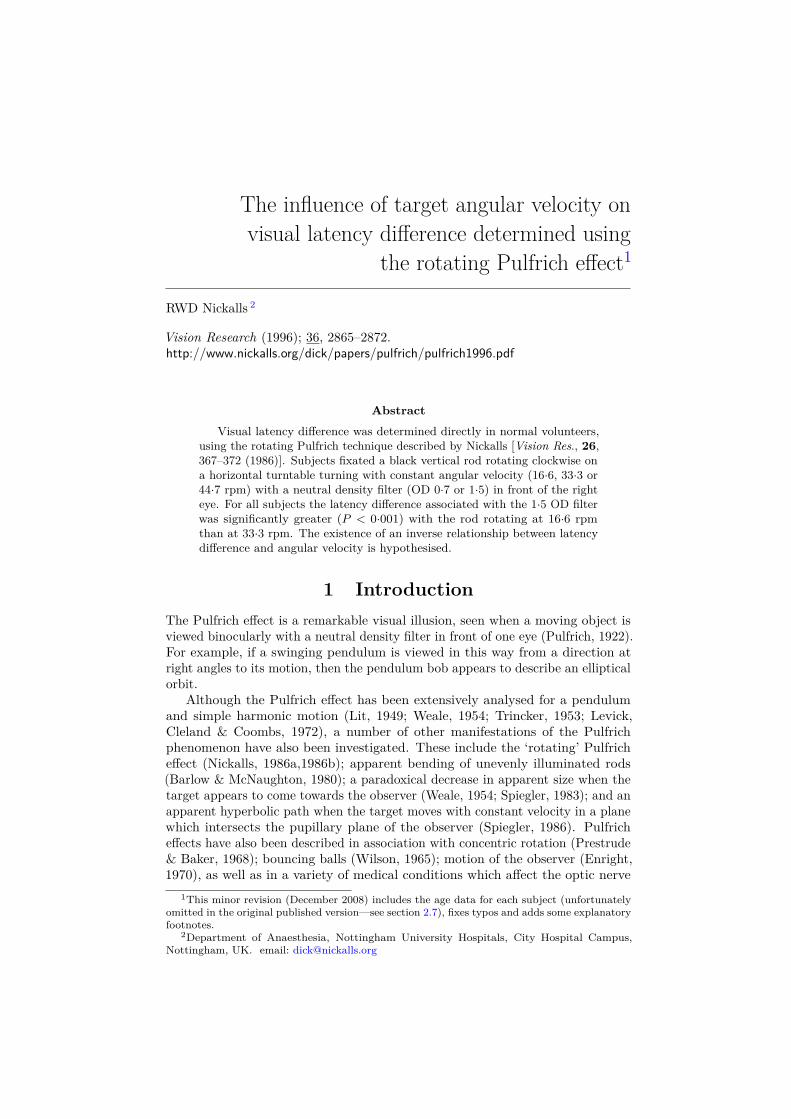
2.6 Latency differenceEach of the latency difference determinations presented in the Tables is the meanof 10 sequential measurements. The latency difference (Δ𝑡 sec) was derived fromthree parameters namely (1) the viewing distance (𝑑T cm) at which the ‘transition’null-point is perceived, (2) the value of half the separation of the rotation centersof the eyes (𝑎 cm), and (3) the angular velocity of the turntable (Ω rpm). Thelatency difference was calculated using Equation 1, in which the angular velocity(Ω) is in revolutions per minute (rpm)—see Appendix for derivation.
Δ𝑡 = (1/3Ω)tan−1(𝑎/𝑑T) (1)
300
200
100
dT cms4533
16Ω rpm
25155
∆t msec
Figure 1: Variation of latency difference (Δ𝑡) with turntable speed(Ω) and transition distance (𝑑T) as described by Equation 1 with𝑎 = 3·2 cm (𝐼𝑃𝐷 = 6·4 cm).
Equation 1 is depicted graphically in Figure 2.6. Owing to the non-linearnature of Equation 1 it follows that for a given number of observations, the mean𝑑T does not correlate accurately with the associated mean Δ𝑡. Consequently,the mean Δ𝑡 values for each subject given in the Tables are derived from theindividual Δ𝑡 values.
In addition, the format of Equation 1 is significant in that a relatively largeerror in the viewing distance at transition (𝑑T) is associated with only a verysmall error in the calculated latency difference (Δ𝑡). For example, if 𝑎 = 3·2 cm,
RWD Nickalls Vision Research (1996); 36, 2865–2872. 5
Ω = 33 rpm and 𝑑T = 120 cm, then an error of ±1 cm in 𝑑T is associated with anerror of only ±0·13 msec in Δ𝑡.
2.7 SubjectsA number of studies were performed on a total of 14 normal experienced volunteerswhose ages ranged from 22 (PO)–54 (RC) years. All subjects had normal depthperception as determined using the Wirt Fly test.
The age (yrs) of each subject was as follows3: PN (22), PO (24), MH (27),IJ (28), SM (29), SY (30), AM (32), SR (35), MK (35), RWDN (36), MC (37),NGH (40), EAN (44), RC (54).
2.8 ProcedureThe latency difference was determined for a number of combinations of turntablespeed (16·6, 33·3, 44·7 mean rpm) and filter density (OD 0·7, 1·5).
The subjects were investigated in two sessions. During one session, thefollowing combinations of filter optical density and turntable speed were used:(0·7 OD/33·3 rpm; 0·7 OD/44·7 rpm; 1·5 OD/33·3 rpm). During the other session,the following combinations were used: (1·5 OD/16·6 rpm; 1·5 OD/33·3 rpm).Note that the only combinations of filter density and turntable speed which couldbe used, were those for which the viewing distance at transition was within therange of the physical track (3·5 m) that the turntable moved on (see Nickalls1986a for details of the laboratory setup).
In 9 subjects repeat latency difference determinations were made for the1·5 OD/33·3 rpm combination (see Table 3) following a mean interval of 182 days(range: 1 day–14 months) in order to check reproducibility. A repeat determinationfor the 0·7 OD/33·3 rpm combination was made in one subject (RWDN).
The illumination was the same for all observations. Each subject was given20 mins to dark adapt to each filter (see Standing, Dodwell & Lang, 1968).
For each combination of turntable speed and filter density, the latency differencewas determined as the mean of a series of 10 sequential measurements. For eachmeasurement of latency difference, the turntable was initially positioned at eitherthe near or the far point of the track (i.e. either close to or far away from thesubject). The subject was then asked to fixate the horizontally rotating target,and at the same time to adjust the position of the turntable using the small handwheel, until the null-point (transition) was identified. During each series of 10measurements a bracketing technique was used, whereby the initial position ofthe turntable was alternately varied from the point nearest to the observer onone measurement (‘near’), to the point farthest from the observer for the next
3This data, which was unfortunately omitted from the original published paper, may besignificant since artificial pupils were not used in these experiments. However, there is goodevidence (Lit, 1960a) to suggest that under these circumstances pupillary changes alone areunlikely to be the cause of the observed variation of visual latency difference with turntableangular velocity. Lit (1960a) used artificial 2 mm pupils in a similar study observing a vertical rodmoving with constant linear velocity, and still observed comparable changes, both in magnitudeand direction. Furthermore, in view of the known slight reduction in pupil size with increasingage (Birren JE, Casperson R and Botwinick J (1950); Age changes in pupil size Journal ofGerontology; 5, 216) it is significant that the data from the present study shows that thewithin-subject differences between the calculated latency differences (Δ𝑡) associated with theturntable angular velocities used, are independent of observer age throughout the range 22–54years (RWDN, December 2008).
RWD Nickalls Vision Research (1996); 36, 2865–2872. 6
measurement (‘far’). A typical series of 10 sequential measurements is shown inTable 1.
Table 1: A typical series of 10 sequential measurements of visuallatency difference (subject SY; age 30 yrs; IPD 64 mm).
OD = 1.5Initial turntable position Ω (rpm) 𝑑T (cm) Δ𝑡 (msec)
near 33·6 117·5 15·48far 33·5 116·3 15·68
near 33·5 114·8 15·89far 33·5 110·7 16·48
near 33·4 125·6 14·57far 33·5 109·6 16·64
near 33·5 126·4 14·43far 33·4 113·7 16·09
near 33·3 118·3 15·51far 33·3 107·1 17·13n 10 10 10
mean 33·4 116·0 15·8SEM 0·03 2·01 0·27
3 ResultsEach determination of latency difference is the mean of 10 sequential measurements(see Table 1). The range of the calculated SEM for Δ𝑡 for all subjects was 0·11–1·80 msec. The data is shown in Tables 1–5 and in Figures 2–4. Paired andunpaired data were analysed using a two-tailed Student’s 𝑡-test.
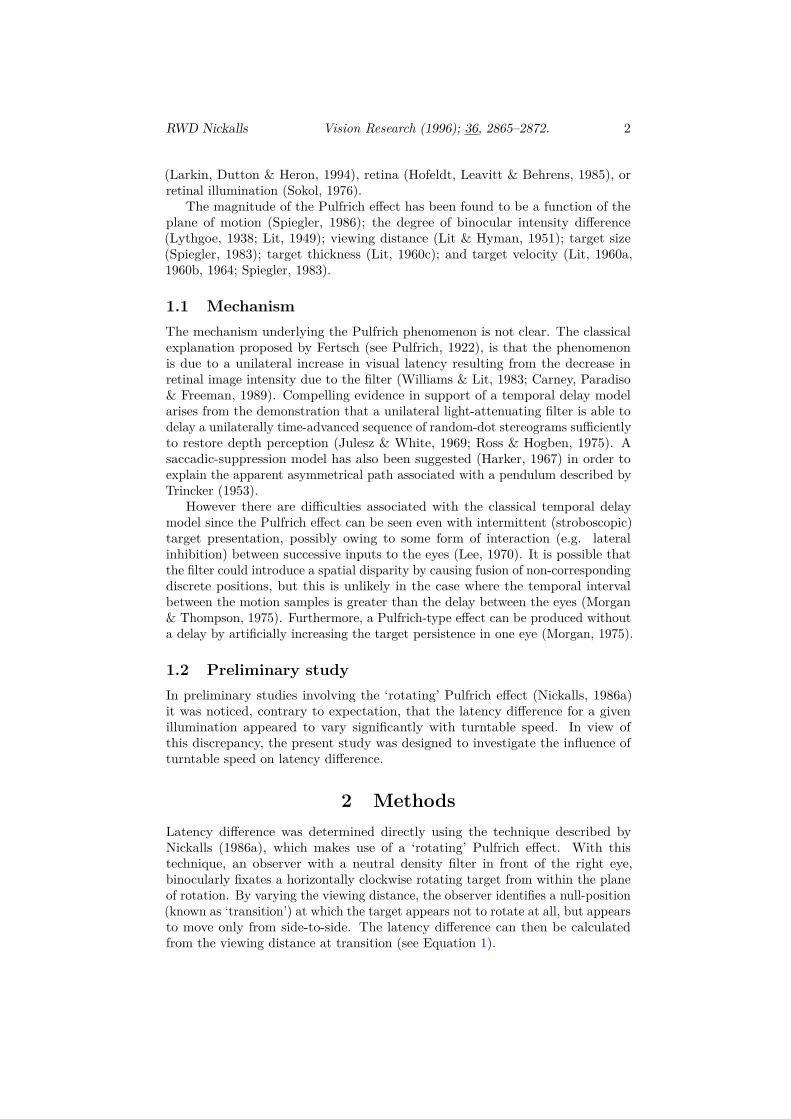
3.1 Influence of filter density on latency differenceThis data, which is presented in order to serve as a comparison with other latencydifference studies in the literature, is presented in Table 2 and Figure 2.
These results indicate that for each subject (Ω = 33·3 rpm), the latencydifference using the 1·5 OD filter was greater than that that using the 0·7 ODfilter. The mean (±SEM) within-subject difference in Δ𝑡 (6·3±0·52 msec; 𝑛 = 10)is significant (𝑃 < 0·001). In this group the mean (±SEM) latency difference usingthe 1.5 OD filter (15·0 ± 0·58 msec; 𝑛 = 10) is significantly different (𝑃 < 0·001)from that using the 0·7 OD filter (8·7 ± 0·23 msec; 𝑛 = 10).
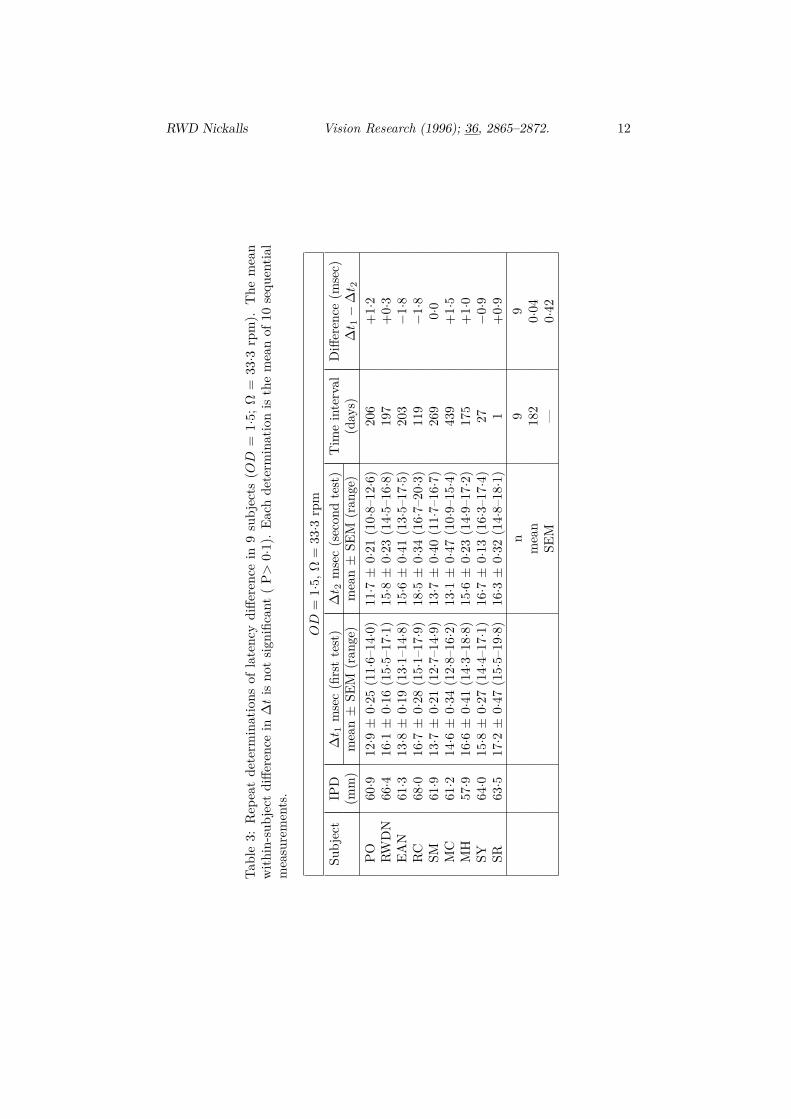
In nine subjects repeat latency difference determinations were made (seeTable 3) following a mean interval of 182 days (range: 1–439). There was nosignificant within-subject difference between the two determinations (𝑃 > 0·1);the mean (±SEM) within-subject difference in Δ𝑡 being 0·04 ± 0·42 msec (𝑛 = 9).All repeat determinations were made using the same turntable speed (33·3 rpm),neutral-density filter (1·5 OD), and illumination.
RWD Nickalls Vision Research (1996); 36, 2865–2872. 7
0
5
10
15
20
0 0.7 1.5
Latencydifference(msec)
Optical density
Figure 2: Influence of optical density on visual latency differencein 10 subjects (Ω = 33·3 rpm). For data see Table 2.
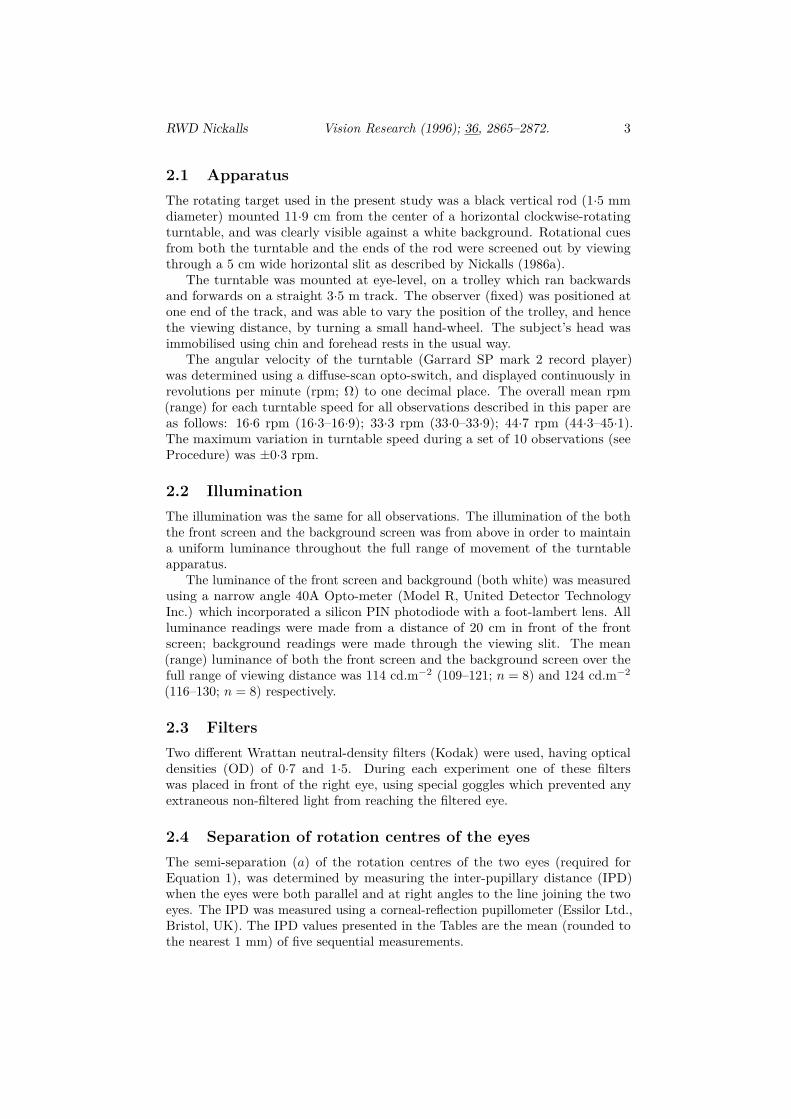
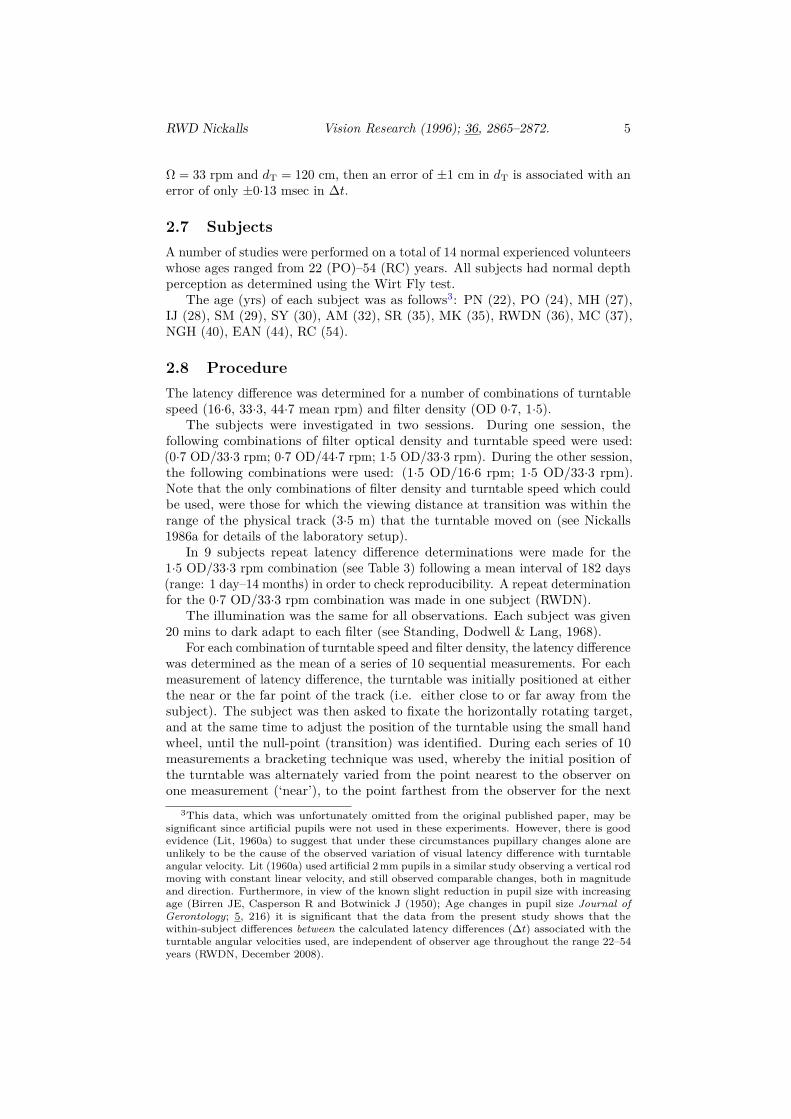
3.2 Influence of angular velocity on latency differenceThe latency difference data is presented in terms of turntable speed (Figure 3)and in terms of mean (rms) angular velocity at the eye (Figure 4).
The mean angular velocity at the eye (deg/sec) of the rotating rod wasdetermined as the root mean square (rms) angular velocity, and shown in Tables 4and 5. This was calculated from the turntable speed and the mean viewingdistance at transition, using the formula for the instantaneous angular velocitydescribed in Appendix 2.
3.2.1 0·7 OD filter
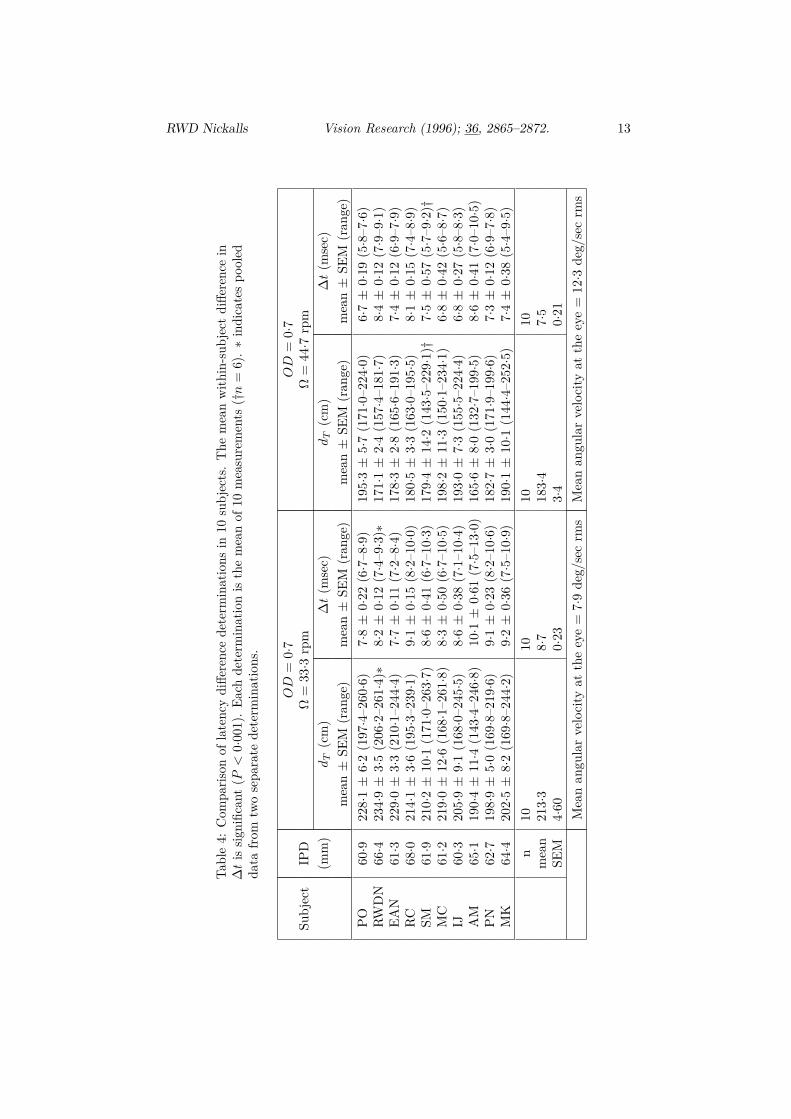
These results (see Table 4 & Figures 3 and 4) indicate that with the exceptionof one subject (RWDN), both the latency difference and the viewing distance attransition associated with the slower turntable speed (33·3 rpm), were greaterthan those associated with the faster turntable speed (44·7 rpm).
The mean (±SEM) within-subject difference in Δ𝑡 (1·2 ± 0·21 msec; 𝑛 = 10)is significant (𝑃 < 0·001). In this group, the mean (±SEM) latency differencedetermination at 33·3 rpm (8·7 ± 0·23 msec; 𝑛 = 10) is significantly different(𝑃 < 0·001) from that determined at 44·7 rpm (7·5 ± 0·21 msec; 𝑛 = 10).
3.2.2 1·5 OD filter
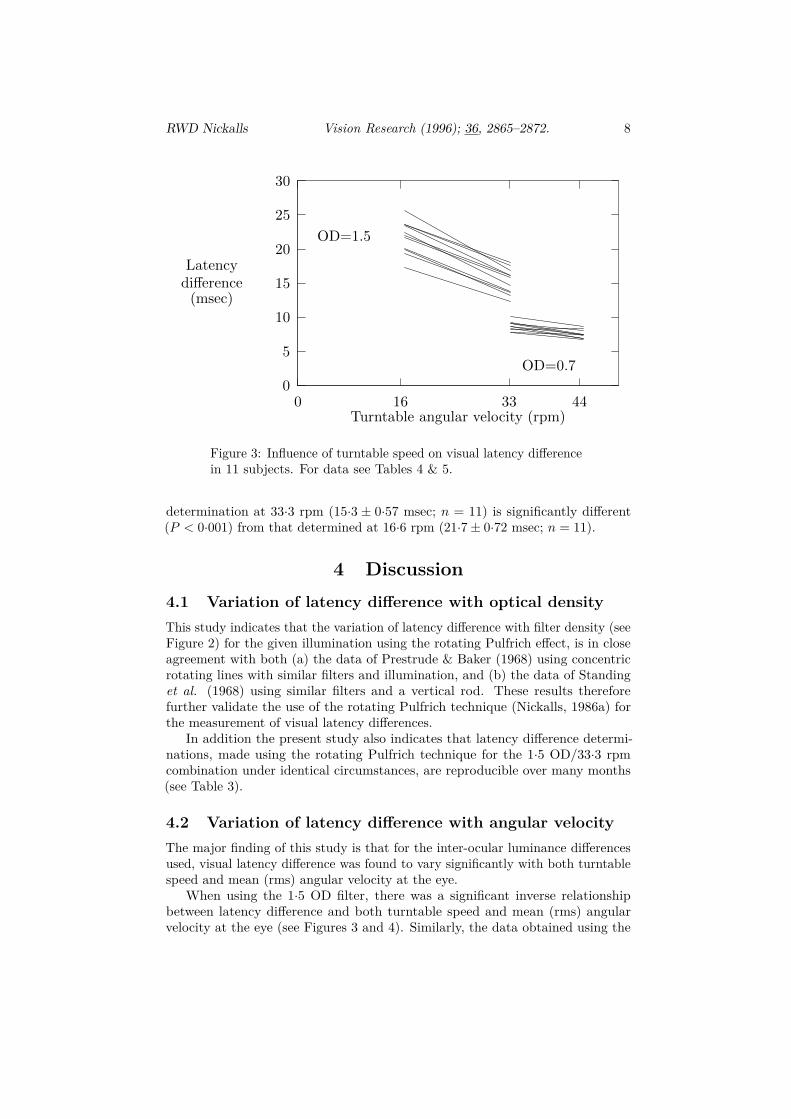
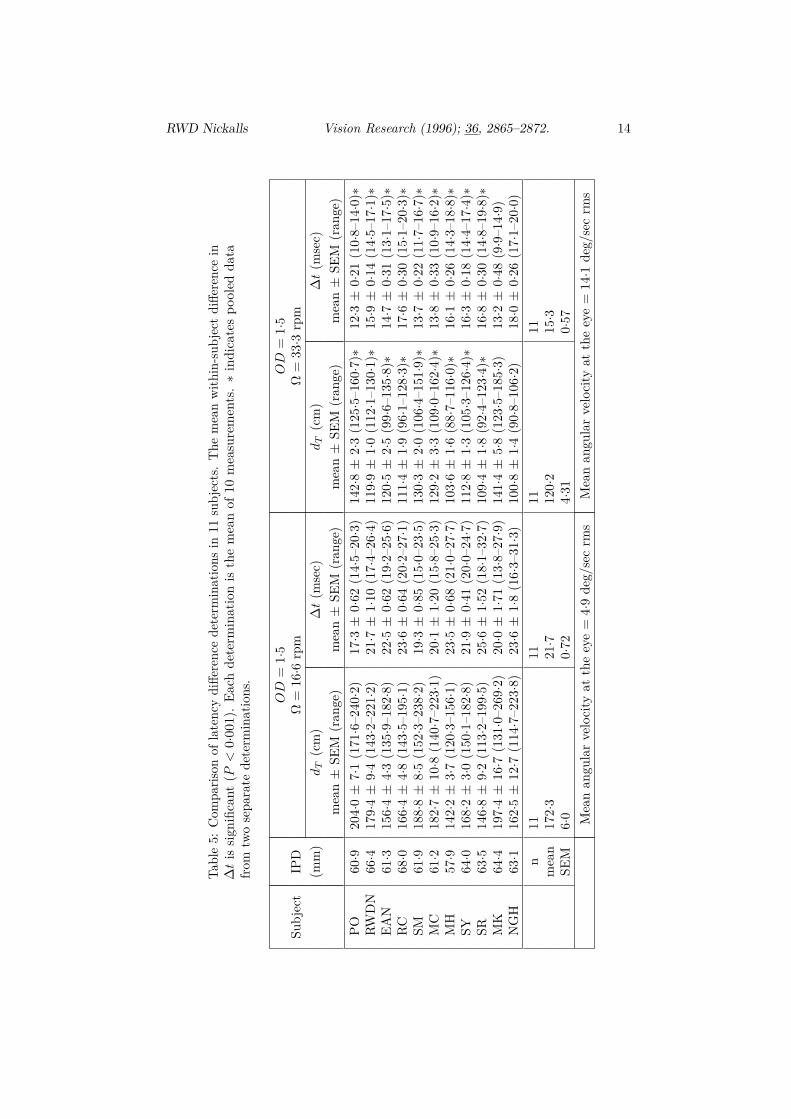
These results (see Table 5 & Figures 3 and 4) indicate that for each subject, boththe latency difference and the viewing distance at transition associated with theslower turntable speed (16·6 rpm), were greater than those associated with thefaster turntable speed (33·3 rpm).
The mean (±SEM) within-subject difference in Δ𝑡 (6·4 ± 0·35 msec; 𝑛 = 11)is significant (𝑃 < 0·001). In this group the mean (±SEM) latency difference
RWD Nickalls Vision Research (1996); 36, 2865–2872. 8
0
5
10
15
20
25
30
0 16 33 44
Latencydifference(msec)
Turntable angular velocity (rpm)
OD=1.5
OD=0.7
Figure 3: Influence of turntable speed on visual latency differencein 11 subjects. For data see Tables 4 & 5.
determination at 33·3 rpm (15·3 ± 0·57 msec; 𝑛 = 11) is significantly different(𝑃 < 0·001) from that determined at 16·6 rpm (21·7 ± 0·72 msec; 𝑛 = 11).
4 Discussion4.1 Variation of latency difference with optical densityThis study indicates that the variation of latency difference with filter density (seeFigure 2) for the given illumination using the rotating Pulfrich effect, is in closeagreement with both (a) the data of Prestrude & Baker (1968) using concentricrotating lines with similar filters and illumination, and (b) the data of Standinget al. (1968) using similar filters and a vertical rod. These results thereforefurther validate the use of the rotating Pulfrich technique (Nickalls, 1986a) forthe measurement of visual latency differences.
In addition the present study also indicates that latency difference determi-nations, made using the rotating Pulfrich technique for the 1·5 OD/33·3 rpmcombination under identical circumstances, are reproducible over many months(see Table 3).
4.2 Variation of latency difference with angular velocityThe major finding of this study is that for the inter-ocular luminance differencesused, visual latency difference was found to vary significantly with both turntablespeed and mean (rms) angular velocity at the eye.
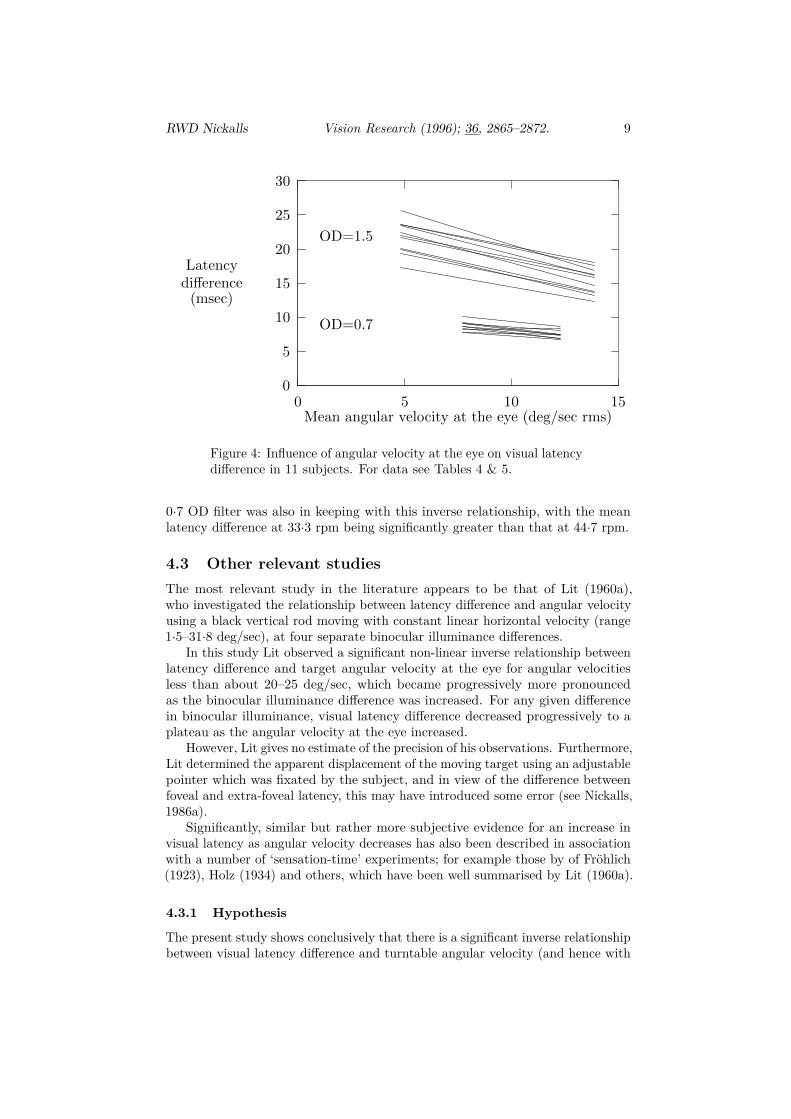
When using the 1·5 OD filter, there was a significant inverse relationshipbetween latency difference and both turntable speed and mean (rms) angularvelocity at the eye (see Figures 3 and 4). Similarly, the data obtained using the
RWD Nickalls Vision Research (1996); 36, 2865–2872. 9
0
5
10
15
20
25
30
0 5 10 15
Latencydifference(msec)
Mean angular velocity at the eye (deg/sec rms)
OD=1.5
OD=0.7
Figure 4: Influence of angular velocity at the eye on visual latencydifference in 11 subjects. For data see Tables 4 & 5.
0·7 OD filter was also in keeping with this inverse relationship, with the meanlatency difference at 33·3 rpm being significantly greater than that at 44·7 rpm.
4.3 Other relevant studiesThe most relevant study in the literature appears to be that of Lit (1960a),who investigated the relationship between latency difference and angular velocityusing a black vertical rod moving with constant linear horizontal velocity (range1·5–31·8 deg/sec), at four separate binocular illuminance differences.
In this study Lit observed a significant non-linear inverse relationship betweenlatency difference and target angular velocity at the eye for angular velocitiesless than about 20–25 deg/sec, which became progressively more pronouncedas the binocular illuminance difference was increased. For any given differencein binocular illuminance, visual latency difference decreased progressively to aplateau as the angular velocity at the eye increased.
However, Lit gives no estimate of the precision of his observations. Furthermore,Lit determined the apparent displacement of the moving target using an adjustablepointer which was fixated by the subject, and in view of the difference betweenfoveal and extra-foveal latency, this may have introduced some error (see Nickalls,1986a).
Significantly, similar but rather more subjective evidence for an increase invisual latency as angular velocity decreases has also been described in associationwith a number of ‘sensation-time’ experiments; for example those by of Frohlich(1923), Holz (1934) and others, which have been well summarised by Lit (1960a).
4.3.1 Hypothesis
The present study shows conclusively that there is a significant inverse relationshipbetween visual latency difference and turntable angular velocity (and hence with
RWD Nickalls Vision Research (1996); 36, 2865–2872. 10
0
5
10
15
20
25
30
0 16 33 44
Latencydifference(msec)
Turntable angular velocity (rpm)
OD=1.5
OD=0.7
Figure 5: Hypothetical relationship between turntable angularvelocity and visual latency difference. The bars indicate the rangeof data points given in Tables 4 and 5 and shown in Figure 3.
mean (rms) target angular velocity at the eye) within the parameter range studied.In view of these findings, and those of Lit (1960a), Frohlich (1923) and Holz(1934), the author suggests the hypothesis that for a given inter-ocular illuminancedifference there exists a continuous inverse relationship between visual latencydifference and turntable angular velocity as shown in Figure 5.
The mechanism by which velocity influences visual latency difference is notclear. However, it has recently been shown that motion produces equivalentspatial blur which is velocity dependent (Paakkonen & Morgan, 1994), and it ispossible therefore, that there may be an association between smaller blur (slowvelocity) and longer latency. Alternatively, this effect may be related to propertiesof the different motion sensor systems which process slow and fast velocities (seeHawken, Gegenfurtner & Tang, 1994).
AcknowledgementsThe author would like to thank Professor A. L. Crombie (Department of Ophthal-mology, University of Newcastle-upon-Tyne) for help and encouragement with thisstudy; Mr P. Byrne and Mr P. Oliver (Department of Medical Physics, GeneralHospital, Newcastle-upon-Tyne) for making the apparatus; and Dr K. Mitchell(Department of Medical Physics, Royal Victoria Infirmary, Newcastle-upon-Tyne)for assistance with luminance measurements.
RWD Nickalls Vision Research (1996); 36, 2865–2872. 11
Tabl
e2:
Com
paris
onof
late
ncy
diffe
renc
ede
term
inat
ions
in10
subj
ects
(Ω=
33·3
rpm
)us
ing
two
diffe
rent
neut
rald
ensit
yfil
ters
.T
hem
ean
with
in-s
ubje
ctdi
ffere
nce
inΔ𝑡
issig
nific
ant
(𝑃<
0·00
1).
Each
dete
rmin
atio
nis
the
mea
nof
10se
quen
tialm
easu
rem
ents
.*
indi
cate
spoo
led
data
from
two
sepa
rate
dete
rmin
atio
ns.
Thi
sdat
ais
show
nin
Figu
re2.
𝑂𝐷
=1·
5𝑂𝐷
=0·
7Su
bjec
tIP
DΩ
=33
·3rp
mΩ
=33
·3rp
m(m
m)
𝑑𝑇
(cm
)Δ𝑡
(mse
c)𝑑
𝑇(c
m)
Δ𝑡
(mse
c)m
ean
±SE
M(r
ange
)m
ean
±SE
M(r
ange
)m
ean
±SE
M(r
ange
)m
ean
±SE
M(r
ange
)PO
60·9
142·
8±
2·3
(125
·5–1
60·7
)*12
·3±
0·21
(10·
8–14
·0)*
228·
1±
6·2
(197
·4–2
60·6
)7·
8±
0·21
(6·7
–8·9
)RW
DN
66·4
119·
9±
1·0
(112
·1–1
30·1
)*15
·9±
0·14
(14·
5–17
·1)*
234·
9±
3·5
(206
·2–2
61·4
)*8·
2±
0·12
(7·4
–9·3
)*EA
N61
·312
0·5
±2·
5(9
9·6–
135·
8)*
14·7
±0·
31(1
3·1–
17·5
)*22
9·0
±3·
3(2
10·1
–244
·4)
7·7
±0·
11(7
·2–8
·4)
RC
68·0
111·
4±
1·9
(96·
1–12
8·3)
*17
·6±
0·30
(15·
1–20
·3)*
214·
1±
3·6
(195
·3–2
39·1
)9·
1±
0·15
(8·2
–10·
0)SM
61·9
130·
3±
2·0
(106
·4–1
51·9
)*13
·7±
0·22
(11·
7–16
·7)*
210·
2±
10·1
(171
·0–2
63·7
)8·
6±
0·41
(6·7
–10·
3)M
C61
·212
9·2
±3·
3(1
09·0
–162
·4)*
13·8
±0·
33(1
0·9–
16·2
)*21
9·0
±12
·6(1
68·1
–261
·8)
8·3
±0·
50(6
·7–1
0·5)
IJ57
·911
5·0
±2·
7(1
04·7
–134
·6)
15·2
±0·
34(1
2·9–
16·6
)20
5·9
±9·
1(1
68·0
–245
·5)
8·6
±0·
37(7
·1–1
0·4)
AM
64·0
121·
5±
4·5
(105
·5–1
53·5
)15
·6±
0·52
(12·
2–17
·7)
190·
4±
11·4
(143
·4–2
46·8
)10
·1±
0·61
(7·5
–13·
0)PN
63·5
100·
2±
1·0
(97·
1–10
7·6)
17·9
±0·
16(1
6·8–
18·5
)19
8·9
±5·
0(1
69·8
–219
·6)
9·1
±0·
23(8
·2–1
0·6)
MK
64·4
141·
4±
5·8
(123
·5–1
85·3
)13
·2±
0·48
(9·9
–14·
9)20
2·5
±8·
2(1
69·8
–244
·2)
9·2
±0·
36(7
·5–1
0·9)
n10
1010
10m
ean
123·
215
·021
3·3
8·7
SEM
4·16
0·58
4·60
0·23
RWD Nickalls Vision Research (1996); 36, 2865–2872. 12
Tabl
e3:
Rep
eat
dete
rmin
atio
nsof
late
ncy
diffe
renc
ein
9su
bjec
ts(𝑂𝐷
=1·
5;Ω
=33
·3rp
m).
The
mea
nw
ithin
-sub
ject
diffe
renc
ein
Δ𝑡
isno
tsig
nific
ant
(P>
0·1)
.E
ach
dete
rmin
atio
nis
the
mea
nof
10se
quen
tial
mea
sure
men
ts.
𝑂𝐷
=1·
5,Ω
=33
·3rp
mSu
bjec
tIP
DΔ𝑡 1
mse
c(fi
rst
test
)Δ𝑡 2
mse
c(s
econ
dte
st)
Tim
ein
terv
alD
iffer
ence
(mse
c)(m
m)
mea
n±
SEM
(ran
ge)
mea
n±
SEM
(ran
ge)
(day
s)Δ𝑡 1
−Δ𝑡 2
PO60
·912
·9±
0·25
(11·
6–14
·0)
11·7
±0·
21(1
0·8–
12·6
)20
6+
1·2
RWD
N66
·416
·1±
0·16
(15·
5–17
·1)
15·8
±0·
23(1
4·5–
16·8
)19
7+
0·3
EAN
61·3
13·8
±0·
19(1
3·1–
14·8
)15
·6±
0·41
(13·
5–17
·5)
203
−1·
8R
C68
·016
·7±
0·28
(15·
1–17
·9)
18·5
±0·
34(1
6·7–
20·3
)11
9−
1·8
SM61
·913
·7±
0·21
(12·
7–14
·9)
13·7
±0·
40(1
1·7–
16·7
)26
90·
0M
C61
·214
·6±
0·34
(12·
8–16
·2)
13·1
±0·
47(1
0·9–
15·4
)43
9+
1·5
MH
57·9
16·6
±0·
41(1
4·3–
18·8
)15
·6±
0·23
(14·
9–17
·2)
175
+1·
0SY
64·0
15·8
±0·
27(1
4·4–
17·1
)16
·7±
0·13
(16·
3–17
·4)
27−
0·9
SR63
·517
·2±
0·47
(15·
5–19
·8)
16·3
±0·
32(1
4·8–
18·1
)1
+0·
9n
99
mea
n18
20·
04SE
M—
0·42
RWD Nickalls Vision Research (1996); 36, 2865–2872. 13
Tabl
e4:
Com
paris
onof
late
ncy
diffe
renc
ede
term
inat
ions
in10
subj
ects
.T
hem
ean
with
in-s
ubje
ctdi
ffere
nce
inΔ𝑡
issig
nific
ant
(𝑃<
0·00
1).
Each
dete
rmin
atio
nis
the
mea
nof
10m
easu
rem
ents
(†𝑛
=6)
.*
indi
cate
spo
oled
data
from
two
sepa
rate
dete
rmin
atio
ns.
𝑂𝐷
=0·
7𝑂𝐷
=0·
7Su
bjec
tIP
DΩ
=33
·3rp
mΩ
=44
·7rp
m(m
m)
𝑑𝑇
(cm
)Δ𝑡
(mse
c)𝑑
𝑇(c
m)
Δ𝑡
(mse
c)m
ean
±SE
M(r
ange
)m
ean
±SE
M(r
ange
)m
ean
±SE
M(r
ange
)m
ean
±SE
M(r
ange
)PO
60·9
228·
1±
6·2
(197
·4–2
60·6
)7·
8±
0·22
(6·7
–8·9
)19
5·3
±5·
7(1
71·0
–224
·0)
6·7
±0·
19(5
·8–7
·6)
RWD
N66
·423
4·9
±3·
5(2
06·2
–261
·4)*
8·2
±0·
12(7
·4–9
·3)*
171·
1±
2·4
(157
·4–1
81·7
)8·
4±
0·12
(7·9
–9·1
)EA
N61
·322
9·0
±3·
3(2
10·1
–244
·4)
7·7
±0·
11(7
·2–8
·4)
178·
3±
2·8
(165
·6–1
91·3
)7·
4±
0·12
(6·9
–7·9
)R
C68
·021
4·1
±3·
6(1
95·3
–239
·1)
9·1
±0·
15(8
·2–1
0·0)
180·
5±
3·3
(163
·0–1
95·5
)8·
1±
0·15
(7·4
–8·9
)SM
61·9
210·
2±
10·1
(171
·0–2
63·7
)8·
6±
0·41
(6·7
–10·
3)17
9·4
±14
·2(1
43·5
–229
·1)†
7·5
±0·
57(5
·7–9
·2)†
MC
61·2
219·
0±
12·6
(168
·1–2
61·8
)8·
3±
0·50
(6·7
–10·
5)19
8·2
±11
·3(1
50·1
–234
·1)
6·8
±0·
42(5
·6–8
·7)
IJ60
·320
5·9
±9·
1(1
68·0
–245
·5)
8·6
±0·
38(7
·1–1
0·4)
193·
0±
7·3
(155
·5–2
24·4
)6·
8±
0·27
(5·8
–8·3
)A
M65
·119
0·4
±11
·4(1
43·4
–246
·8)
10·1
±0·
61(7
·5–1
3·0)
165·
6±
8·0
(132
·7–1
99·5
)8·
6±
0·41
(7·0
–10·
5)PN
62·7
198·
9±
5·0
(169
·8–2
19·6
)9·
1±
0·23
(8·2
–10·
6)18
2·7
±3·
0(1
71·9
–199
·6)
7·3
±0·
12(6
·9–7
·8)
MK
64·4
202·
5±
8·2
(169
·8–2
44·2
)9·
2±
0·36
(7·5
–10·
9)19
0·1
±10
·1(1
44·4
–252
·5)
7·4
±0·
38(5
·4–9
·5)
n10
1010
10m
ean
213·
38·
718
3·4
7·5
SEM
4·60
0·23
3·4
0·21
Mea
nan
gula
rve
loci
tyat
the
eye
=7·
9de
g/se
crm
sM
ean
angu
lar
velo
city
atth
eey
e=
12·3
deg/
sec
rms
RWD Nickalls Vision Research (1996); 36, 2865–2872. 14
Tabl
e5:
Com
paris
onof
late
ncy
diffe
renc
ede
term
inat
ions
in11
subj
ects
.T
hem
ean
with
in-s
ubje
ctdi
ffere
nce
inΔ𝑡
issig
nific
ant
(𝑃<
0·00
1).
Eac
hde
term
inat
ion
isth
em
ean
of10
mea
sure
men
ts.
*in
dica
tes
pool
edda
tafr
omtw
ose
para
tede
term
inat
ions
.
𝑂𝐷
=1·
5𝑂𝐷
=1·
5Su
bjec
tIP
DΩ
=16
·6rp
mΩ
=33
·3rp
m(m
m)
𝑑𝑇
(cm
)Δ𝑡
(mse
c)𝑑
𝑇(c
m)
Δ𝑡
(mse
c)m
ean
±SE
M(r
ange
)m
ean
±SE
M(r
ange
)m
ean
±SE
M(r
ange
)m
ean
±SE
M(r
ange
)PO
60·9
204·
0±
7·1
(171
·6–2
40·2
)17
·3±
0·62
(14·
5–20
·3)
142·
8±
2·3
(125
·5–1
60·7
)*12
·3±
0·21
(10·
8–14
·0)*
RWD
N66
·417
9·4
±9·
4(1
43·2
–221
·2)
21·7
±1·
10(1
7·4–
26·4
)11
9·9
±1·
0(1
12·1
–130
·1)*
15·9
±0·
14(1
4·5–
17·1
)*EA
N61
·315
6·4
±4·
3(1
35·9
–182
·8)
22·5
±0·
62(1
9·2–
25·6
)12
0·5
±2·
5(9
9·6–
135·
8)*
14·7
±0·
31(1
3·1–
17·5
)*R
C68
·016
6·4
±4·
8(1
43·5
–195
·1)
23·6
±0·
64(2
0·2–
27·1
)11
1·4
±1·
9(9
6·1–
128·
3)*
17·6
±0·
30(1
5·1–
20·3
)*SM
61·9
188·
8±
8·5
(152
·3–2
38·2
)19
·3±
0·85
(15·
0–23
·5)
130·
3±
2·0
(106
·4–1
51·9
)*13
·7±
0·22
(11·
7–16
·7)*
MC
61·2
182·
7±
10·8
(140
·7–2
23·1
)20
·1±
1·20
(15·
8–25
·3)
129·
2±
3·3
(109
·0–1
62·4
)*13
·8±
0·33
(10·
9–16
·2)*
MH
57·9
142·
2±
3·7
(120
·3–1
56·1
)23
·5±
0·68
(21·
0–27
·7)
103·
6±
1·6
(88·
7–11
6·0)
*16
·1±
0·26
(14·
3–18
·8)*
SY64
·016
8·2
±3·
0(1
50·1
–182
·8)
21·9
±0·
41(2
0·0–
24·7
)11
2·8
±1·
3(1
05·3
–126
·4)*
16·3
±0·
18(1
4·4–
17·4
)*SR
63·5
146·
8±
9·2
(113
·2–1
99·5
)25
·6±
1·52
(18·
1–32
·7)
109·
4±
1·8
(92·
4–12
3·4)
*16
·8±
0·30
(14·
8–19
·8)*
MK
64·4
197·
4±
16·7
(131
·0–2
69·2
)20
·0±
1·71
(13·
8–27
·9)
141·
4±
5·8
(123
·5–1
85·3
)13
·2±
0·48
(9·9
–14·
9)N
GH
63·1
162·
5±
12·7
(114
·7–2
23·8
)23
·6±
1·8
(16·
3–31
·3)
100·
8±
1·4
(90·
8–10
6·2)
18·0
±0·
26(1
7·1–
20·0
)n
1111
1111
mea
n17
2·3
21·7
120·
215
·3SE
M6·
00·
724·
310·
57M
ean
angu
lar
velo
city
atth
eey
e=
4·9
deg/
sec
rms
Mea
nan
gula
rve
loci
tyat
the
eye
=14
·1de
g/se
crm
s
RWD Nickalls Vision Research (1996); 36, 2865–2872. 15
References1. Barlow, H. B. & McNaughton, P. A. (1980). Illusory curvature caused by
retinal delay. Journal of Physiology, London, 308, 11P–12P.
2. Carney, T., Paradiso, M. A. & Freeman, R. D. (1989). A physiologicalcorrelate of the Pulfrich effect in cortical neurons of the cat. Vision Research,29, 155–165.
3. Enright, J. T. (1970). Distortions of apparent velocity: a new optical illusion.Science, 168, 464–467.
4. Frohlich, F. W. (1923). Uber die Abhangigkeit der Empfindungszeit unddes zeitlichen Verlaufes der Gesichtsempfindung von der Intensitat, Dauerund Geschwindigkeit der Belichtung. Z. Sinnesphysiol., 55, 1–46.
5. Fry, G. A. & Hill, W. W. (1962). The center of rotation of the eye. AmericanJournal of Optometry and Archives of the American Academy of Optometry,39, 581–359.
6. Harker, G. S. (1967). A saccadic suppression explanation of the Pulfrichphenomenon. Perception and Psychophysics, 2, 423–426.
7. Hawken, M. J., Gegenfurtner, K. R. & Tang, C. (1994). Contrast dependenceof colour and luminance in human vision. Nature, 367, 268–270.
8. Hofeldt, A. J., Leavitt, J. & Behrens, M. M. (1985). Pulfrich stereo-illusionphenomenon in serous sensory retinal detachment of the macula. AmericanJournal of Ophthalmology, 100, 576–580.
9. Holz, J. (1934). Der Stereoeffekt Pulfrich’s und die Empfindungszeit. Z.Biol., 95, 502–516.
10. Julesz, B. & White, B. (1969). Short term visual memory and the Pulfrichphenomenon. Nature, 222, 639–641.
11. Lee, D. N. (1970). A stroboscopic stereophenomenon. Vision Research, 10,587–593.
12. Levick, W. R., Cleland, B. G. & Coombs, J. S. (1972). On the apparentorbit of the Pulfrich pendulum. Vision Research, 12, 1381–1388.
13. Larkin, E. B., Dutton, G. N. & Heron, G. (1994). Impaired perception ofmoving objects after minor injuries to the eye and midface: the Pulfrichphenomenon. British Journal of Oral and Maxillofacial Surgery, 32, 360–362.
14. Lit, A. (1949). The magnitude of the Pulfrich stereophenomenon as afunction of binocular differences of intensity at various levels of illumination.American Journal of Psychology, 62, 159–181.
15. Lit, A. (1960a). The magnitude of the Pulfrich stereophenomenon as afunction of target velocity. Journal of Experimental Psychology: HumanPerception, 59, 165–175.
RWD Nickalls Vision Research (1996); 36, 2865–2872. 16
16. Lit, A. (1960b). Effect of target velocity in a frontal plane on binocularspatial localisation at photopic retinal illuminance levels. Journal of theOptical Society of America, 50, 970–973.
17. Lit, A. (1960c). Magnitude of the Pulfrich stereophenomenon as a functionof target thickness. Journal of the Optical Society of America, 50, 321–327.
18. Lit, A. (1964). Equidistance settings at photopic retinal illuminance levelsas a function of target velocity in a frontal plane. Journal of the OpticalSociety of America, 54, 83–88.
19. Lit, A. & Hyman, A. (1951). The magnitude of the Pulfrich stereophe-nomenon as a function of distance of observation. American Journal ofOptometry, 28, 564–580.
20. Lythgoe, R. J. (1938). Some observations on the rotating pendulum. Nature,141, 474.
21. Morgan, M. J. (1975). Stereoillusion based on visual persistence. Nature,256, 639–640.
22. Morgan, M. J. & Thompson, P. (1975). Apparent motion and the Pulfricheffect. Perception, 4, 3–18.
23. Nickalls, R. W. D. (1986a). The rotating Pulfrich effect, and a new methodof determining visual latency differences. Vision Research, 26, 367–372.http://www.nickalls.org/dick/papers/pulfrich/pulfrich1986.pdf
24. Nickalls, R. W. D. (1986b). A line and conic theorem having an interestingvisual correlate.4, The Mathematical Gazette, 70, 27–29 (jstor).http://www.nickalls.org/dick/papers/maths/lineandconic1986.pdf
25. Paakkonen, A. K. & Morgan, M. J. (1994). Effects of motion on blurdiscrimination. Journal of the Optical Society of America (A), 3, 992–1002.
26. Pulfrich, C. (1922). Die Stereoskopie im Dienste der isochromen und hete-rochromen Photometrie. Naturwissenschaften, 10, 553–564.http://pulfrich.siuc.edu/Pulfrich Pages/lit pulf/1922 Pulfrich.htm
27. Prestrude, A. M. & Baker, H. D. (1968). New method of measuring visual-perceptual latency differences. Perception and Psychophysics, 4, 152–154.
28. Ross, J. & Hogben, J. H. (1975). The Pulfrich effect and short-term memoryin stereopsis. Vision Research, 15, 1289–1290.
29. Sokol, S. (1976). The Pulfrich stereo-illusion as an index of optic nervedysfunction. Survey of Ophthalmology, 20, 432–434.
30. Spiegler, J. B. (1983). Distance, size, and velocity changes during thePulfrich effect. American Journal of Optometry and Physiological Optics,60, 902–907.
4see also: Nickalls RWD (2000). A conic theorem generalised: directed angles and applications.The Mathematical Gazette, 84 (July), 232–241 (jstor): http://www.nickalls.org/dick/papers/maths/conicthm2000.pdf.
RWD Nickalls Vision Research (1996); 36, 2865–2872. 17
31. Spiegler, J. B. (1986). Apparent path of a Pulfrich target as a function ofthe slope of its plane of motion: a theoretical note. American Journal ofOptometry and Physiological Optics, 63, 209–216.
32. Standing, L. G., Dodwell, P. C. & Lang, D. (1968). Dark adaption and thePulfrich effect. Perception and Psychophysics, 4, 118–120.
33. Trincker, D. (1953). Hell-Dunkel-Anpassung und raumliches Sehen. PflugersArch. ges. Physiol., 257, 48–69.
34. Weale, R. A. (1954). Theory of the Pulfrich effect. Ophthalmologica, 128,380–388.
35. Williams, J. M. & Lit, A. (1983). Luminance-dependent visual latencyfor the Hess effect, the Pulfrich effect, and simple reaction time. VisionResearch, 23, 171–179.
36. Wilson, G. S. (1965). An investigation of the Pulfrich effect. British Journalof Physiological Optics, 22, 208–37.
APPENDIX
Appendix 1 : Latency differenceThe following relationship for the rotating Pulfrich effect, between the latencydifference (Δ𝑡 sec), the viewing distance (𝑑T cm) at which the ‘transition’ null-point is perceived, the value of half the separation of the rotation centers of theeyes (𝑎 cm), and the angular velocity of the turntable (𝜔 deg/sec), was derivedby Nickalls (1986a).
Δ𝑡 = (2/𝜔)tan−1(𝑎/𝑑T)
However, in the present study the angular velocity of the turntable wascalibrated in revolutions per minute (Ω rpm). Since 1 rpm ≡ 6 deg/sec, then theabove equation (where 𝜔 is in deg/sec) can be modified to become Equation 1where Ω is in rpm, as follows.
Δ𝑡 = (1/3Ω)tan−1(𝑎/𝑑T).
RWD Nickalls Vision Research (1996); 36, 2865–2872. 18
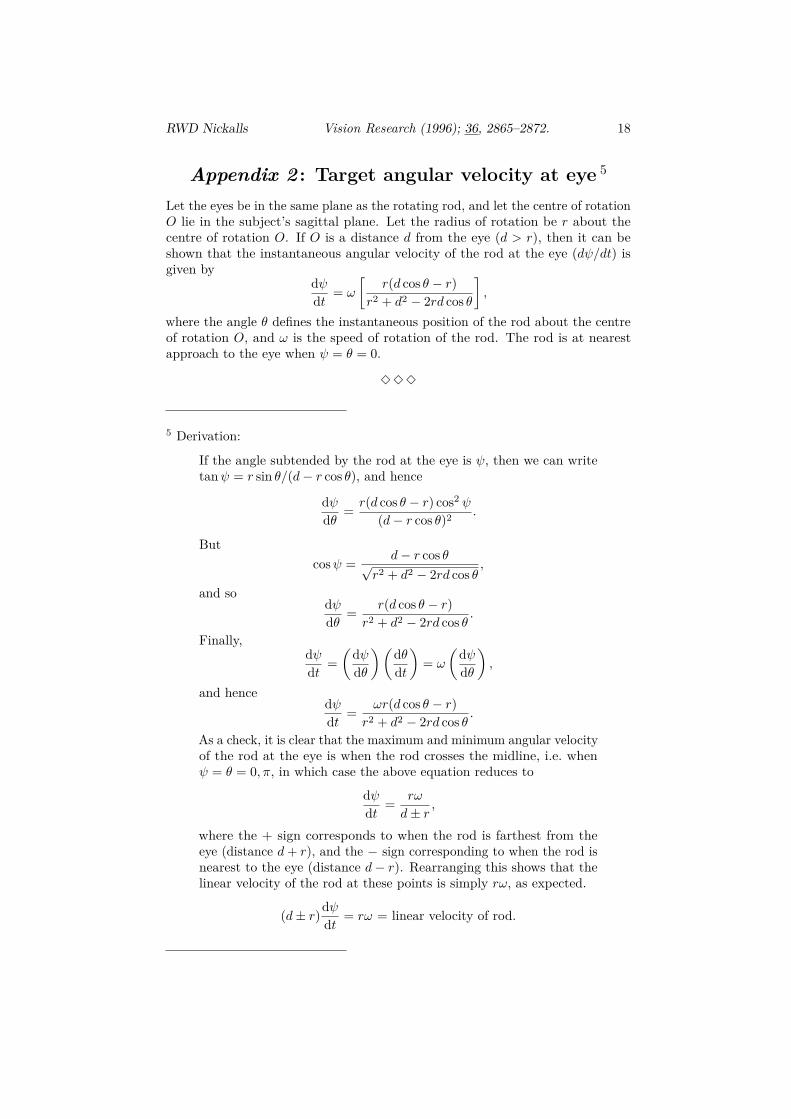
Appendix 2 : Target angular velocity at eye 5
Let the eyes be in the same plane as the rotating rod, and let the centre of rotation𝑂 lie in the subject’s sagittal plane. Let the radius of rotation be 𝑟 about thecentre of rotation 𝑂. If 𝑂 is a distance 𝑑 from the eye (𝑑 > 𝑟), then it can beshown that the instantaneous angular velocity of the rod at the eye (𝑑𝜓/𝑑𝑡) isgiven by
d𝜓d𝑡 = 𝜔
[𝑟(𝑑 cos 𝜃 − 𝑟)
𝑟2 + 𝑑2 − 2𝑟𝑑 cos 𝜃
],
where the angle 𝜃 defines the instantaneous position of the rod about the centreof rotation 𝑂, and 𝜔 is the speed of rotation of the rod. The rod is at nearestapproach to the eye when 𝜓 = 𝜃 = 0.
333
5 Derivation:
If the angle subtended by the rod at the eye is 𝜓, then we can writetan𝜓 = 𝑟 sin 𝜃/(𝑑− 𝑟 cos 𝜃), and hence
d𝜓d𝜃 = 𝑟(𝑑 cos 𝜃 − 𝑟) cos2 𝜓
(𝑑− 𝑟 cos 𝜃)2 .
Butcos𝜓 = 𝑑− 𝑟 cos 𝜃√
𝑟2 + 𝑑2 − 2𝑟𝑑 cos 𝜃,
and sod𝜓d𝜃 = 𝑟(𝑑 cos 𝜃 − 𝑟)
𝑟2 + 𝑑2 − 2𝑟𝑑 cos 𝜃 .
Finally,d𝜓d𝑡 =
(d𝜓d𝜃
) (d𝜃d𝑡
)= 𝜔
(d𝜓d𝜃
),
and henced𝜓d𝑡 = 𝜔𝑟(𝑑 cos 𝜃 − 𝑟)
𝑟2 + 𝑑2 − 2𝑟𝑑 cos 𝜃 .
As a check, it is clear that the maximum and minimum angular velocityof the rod at the eye is when the rod crosses the midline, i.e. when𝜓 = 𝜃 = 0, 𝜋, in which case the above equation reduces to
d𝜓d𝑡 = 𝑟𝜔
𝑑± 𝑟,
where the + sign corresponds to when the rod is farthest from theeye (distance 𝑑+ 𝑟), and the − sign corresponding to when the rod isnearest to the eye (distance 𝑑− 𝑟). Rearranging this shows that thelinear velocity of the rod at these points is simply 𝑟𝜔, as expected.