The Influence of Unrelated Diversification and Ownership Structure on Firm Value: Evidence from Philippine Conglomerates
Rorian Pratyaksa*, Rosanina A. Sayoc, Mika M. Koga, and Michael Dominic O. SiyDe La Salle University, Manila, [email protected]
Recent trends show that top Philippine conglomerates, with more than 91% of the Philippine Stock Exchange Index (PSEi) market capitalization, have continued to diversify into non-core industries (Santiago & Magpayo, 2007; Gutierrez & Rodriguez, 2013). We examine the effect of diversification on firm excess value, with considerations of ownership structure, particularly the supermajority status and family ownership while controlling for firm characteristics and industry sectors for 167 PSE-traded firms from 2004 to 2013. Results suggest that existence of a discount effect, where there is a 43% to 56% discount when diversifying into another industry. However, this discount can be offset by ownership structure characteristics, wherein having a supermajority status enjoys a 33% premium and being family-owned enjoys a 25% to 54% premium. We find that conglomerates can extract benefits from diversification strategies through the composition of their ownership structure.
Diversification is protection against ignorance; it makes little sense for those who know what they’re doing.
– Warren Buffett, Berkshire Hathaway
Conglomerate groups, clusters of legally distinct firms with typically common ownership and managerial relationship, are the powerful and majority entity in the Philippine corporate climate. These large business groups began to operate in their core businesses and have expanded by diversifying in other industry sectors. In recent years, several major groups in the Philippines have utilized a diversification strategy such as Aboitiz, Ayala, DM Consunji, Gokongwei, Lopez, Metro Pacific, San Miguel, Soriano, Sy, Andrew Tan, and Lucio Tan (Gutierrez & Rodriguez, 2013). Recent trends, however, show a movement towards diversification strategy as evidenced by 10 out of 11 top conglomerate groups in the Philippines shifting into non-core industry sectors (Santiago & Magpayo, 2007; Gutierrez & Rodriguez, 2013).
Corporate diversification is a strategy undertaken by a corporation to expand its business to other industries that may or may not be in line with the business proper (Berry, 1971; Kamien & Schwartz, 1975; Pitts & Hopkins, 1982). According to the financial economics literature, diversification has two forms: (1) concentric, which is expanding into businesses related to the original through vertical, horizontal, or territorial strategies; or (2) conglomerate, which is diversifying in different industry sectors with the subsidiaries being non-related to the original business (Markides & Williamson, 1994). We define conglomerates in our study as a corporation that is made up of two or more different segments, operating in unrelated industries, that fall under one corporate or holding group. In an economic perspective,
firms diversify in other industry sectors due to limited or declining growth opportunities in their current lines of business. For instance, the groups of San Miguel, Lopez, Gokongwei, Sy, and Ty started their businesses by expanding only into related segments but later on moved towards different industries to change their growth stages. On the contrary, the Ayala, Aboitiz, Metro Pacific, and Andrew Tan groups have already operated in various industry sectors (Gutierrez & Rodriguez, 2013).
The recent aggressive trend of diversification strategies sparked our interest on the benefits (or pitfalls) of corporate diversification in emerging markets such as the Philippines. These top conglomerate groups, defined as those that encompass a market capitalization of at least PHP100 billion and these corporations account for more than 91% of PSEi’s market cap, are currently and continuously seeking opportunities in optimistic industries in the Philippines such as property, infrastructure, power, banking, services, tourism, and mining (Santiago & Magpayo, 2007; Gutierrez & Rodriguez, 2013). As such, it raises the question whether how aggressively they should continue to pursue such strategies, and if they create positive value for the company and its stakeholders.
Linking the recent moves of conglomerates in the Philippines and contemporaneous financial literature, our main motivation stems from an inquiry regarding the impact of corporate diversification strategies on firm value as either an enhancing or a reducing one. Looking into the local context, we wish to address the major concern: What is the influence of unrelated diversification, or operating in another industry sector, on the excess values of firms in the Philippines? Subsequently, controlling for ownership structure, we also answer the following questions: What is the effect of supermajority status to excess value? What is the impact of being family-owned to excess value?
CONGLOMERATE, DIVERSIFICATION & FIRM VALUE PRATYAKSA. R., ET AL. 47
We conduct a fundamental analysis of the relationship of diversification, ownership structure and firm value using the excess value methodology of Philippine publicly-traded corporations, which includes both single-segment firms and conglomerates with available financial statements and ownership information for the years 2004-2013. We source our data from the Osiris database and the public disclosures, particularly the company annual reports, Top 100 Shareholders and Information Sheet, which are available online at the Philippine Stock Exchange Electronic Disclosure Generation Technology (PSE EDGE).
Our paper is significant to various stakeholders, particularly the academe, firms, investors, and regulators. First, although there are a vast number of studies regarding corporate diversification and firm valuation, the relationship between the two has not reached a consensus. We contribute to financial literature by extending the study to the Philippines, as studies on diversification-firm value relationship are scarce. Second, it directly relates to management decisions as it helps managers and company employees further evaluate the potential amount gain or loss due to diversification, and could then make the necessary adjustments in their strategy to align to their objectives. Third, this serves as a guide to potential investors, as active owners and not passive traders who plan to inject their excess funds to either parent or subsidiary companies. Finally, this is relevant to regulators and policy makers so they can better protect the market to mitigate possible value losses.
Our study is limited to the numbers of the financial statements as we do no further adjustments from the reported consolidated and segment information. Moreover, we do not cover for the type of diversification, whether related or unrelated, as well as the degree of diversification and the maturity of each of the conglomerates. We are limited to non-financial firms due to accounting classification issues when applying
the excess value methodology, and there have also been no studies that utilize financial firms in excess value studies (Berger & Ofek, 1995; Erdorf, Hartmann-Wendels, Heinrichs, & Matz, 2012). We also do not cover for the level of expertise of management as we do not capture corporate governance variables.
LITERATURE REVIEW
The corporate decision to diversify can generate positive or negative effect on its firm value. Earlier literature suggests that corporate diversification destroys firm value (Lang & Stulz, 1994; Berger & Ofek, 1995; Lins & Servaes, 1999). Since the stock prices of diversified firms are traded lower than its actual price, there is a negative effect due to diversification. This advocates the inability of firms, on the average, to exploit potential benefits relative to the costs of diversifying. On the other hand, recent studies that have emerged explain the diversification-firm value relationship to be a positive one (Villalonga, 2004; Santalo & Becerra, 2008). However, Campa and Kedia (2002) argued that there is no causal relationship that exists between the two. The observed discount effect cannot be fully attributed to diversification, as past studies failed to capture the effects of endogenous factors particular to firms such as mergers and acquisitions, ownership structure, and management decision
Further, in terms of management decision to diversify, ownership structure is controlled to better capture the relationship to firm most especially in Asian studies, since East Asian conglomerates tend to be family-based systems as separation of ownership and control is uncommon. According to Claessens, Djankov, and Lang (1999), ownership concentration is traceable to the family and is prevalent among Asian countries except in Japan. Locally, over 80% of businesses in the Philippines are run
48 VOL. 25 NO. 1DLSU BUSINESS & ECONOMICS REVIEW
by families, which posit the highest ratio in Asia (Son et al., 2013). Further, Claessens et al. (1999) reported that out of 120 publicly traded companies across Asia, 42.8% of total value of listed corporate assets are controlled by the top five families; 52.5% by the top 10; and 55.1% by the top 15. A firm is considered to be affiliated with a corporate family group when it has: (1) effective control of the family group having more than 50% ownership, and (2) the officers of the firm have a direct relationship with a corporate group (Sullivan & Unite, 2001).
Moreover, not only is ownership heavily concentrated, but they tend to have dominant control as well (Young, Peng, Ahlstrom, Bruton & Jiang, 2008). In the Philippine local setting, trends continue to reflect concentrated ownership wherein both the number of companies with one individual or family owning or controlling more than 80% of the shares was 15 firms in 2007, and was 24 in 2008 (Icamina, 2010). As for the number of companies with one shareholder owning or controlling 50.1% to 80%, it increased from 38 firms in 2007 to 45 in 2008 (Icamina, 2010). In the former case, there is a supermajority status or an unqualified two-thirds vote, which allows shareholders to approve important changes such as decisions to acquire additional segments or to invest in new business ventures.
Relatedly, Mendez, Jara, Villanueva, and Vieito (2011) found shareholder ownership concentration and family shareholding to be key influencing factors to firm value. In our study, to cover for ownership structure characteristics, we consider when there are owners controlling more than two-thirds voting rights or when owners are family and have effective control. When the interests of the owner are aligned with company objectives to maximize value, it can be expected that they will exercise the decision to diversify and it is intended to further improve the business as well as for their benefit as the owners.
METHODOLOGY
Our sample is comprised of a non-balanced panel of 167 non-financial firms for the years 2004 to 2013. We obtain firm and segment level data on various firm characteristics as well as financial and ownership information for both single-segment firms and conglomerates listed in the Philippine Stock Exchange (PSE, http://www.pse.com.ph). Our number of firms included in the sample is factored by the limitation from our primary source of data which is the Osiris database, as were only able to retrieve 167 firms, excluding financial firms. We then use the company annual reports, Top 100 Shareholders, and Information Statement retrieved online from PSE EDGE to supplement and complete our dataset.
Consistent with literature using the excess value methodology, we eliminate financial firms (i.e., commercial banks, investment companies) due to their inconsistent accounting classification with non-financial firms, in which doing so allows us to have comparable results (Berger & Ofek, 1995; Burch, Nanda, & Narayanan, 2000; Campa & Kedia, 2002; Mendez et al., 2011; Jara-Bertin, Espinosa, & Lopez-Iturriaga, 2013). Further, we utilize a non-balanced panel data to avoid the problem of survivorship bias. Instead of dropping observations (i.e., firms with missing years), we overcome this type of selection bias by including firms that have failed during the 10-year period to reduce the tendency of our results to be overoptimistic.
We classify firms whether they are single-segment or conglomerates. Single-segments are those that operate purely in one industry with one source of revenue. On the other hand, conglomerates are defined in our study as a corporation that is made up of two or more different segments that have separate sources of revenue, operating in unrelated industries, that fall under one corporate or holding group. Firms with more than one source of revenue do
CONGLOMERATE, DIVERSIFICATION & FIRM VALUE PRATYAKSA. R., ET AL. 49
not automatically become a conglomerate; to become a conglomerate, the firms must have at least two subsidiary firms which operate in different industry sectors.
To investigate the link between corporate diversification, ownership structure, and firm valuation, we introduce our model:
EXVALi,t = represents excess value of firm i at year t which is the preliminary indicator of the effect of diversification on firm value (Berger & Ofek, 1995)
DIVERi,t = is the unrelated diversification indicator dummy variable which is 1 if the firm operates in two or more non-related industry sectors, 0 otherwise; by definition, this also pertains to conglomerates
SPMAJi,t = dummy variable that controls for ownership concentration and is equal to 1 if there is a presence of supermajority or more than two-thirds ownership given by a shareholder with 67% or above ownership, 0 otherwise
FAMILi,t = dummy variable that controls for family ownership and is equal to 1 if the corporate family group has effective control (50% or above) or a direct relationship between firm’s officers and the said group , 0 otherwise; base category is purely related diversification (Sullivan & Unite, 2001)
λ’ = vector of coefficients of the control variables given by [λ1 λ2 λ3 λ4]
CNTRLi,t = vector of control variables which includes firm characteristics particularly firm size ( FSIZEi,t ), profitability ( FPRFTi,t ), and leverage ( FLVRGi,t ) [Campa & Kedia, 2002]; also includes the industry sector control ( INDUSi,t ) [Mendez et al., 2011]
FSIZEi,t FPRFTi,tFLVRGi,tINDUSi,t
EXVALi,t–1 = represents excess value of firm i at year t-1; lagged value of the dependent variable to capture the influence of past firm performance on its current firm performance (Mendez et al., 2011)
ηi = captures fixed individual effects across firms
ηt = captures fixed time effects across years
ui,t = error term to capture any measurement errors and possibly omitted variables
50 VOL. 25 NO. 1DLSU BUSINESS & ECONOMICS REVIEW
We estimate this using the Generalized Method of Moments (GMM) whereas previous studies have employed an Ordinary Least Squares (OLS) regression. Since the decision to diversify is deliberate and not random, it is not exogenous; thereby, utilizing OLS would lead to biased estimates (Greene, 2003). To remedy the situation, we employ the GMM to account for the selection bias and the endogeneity of the diversification decision.
For our dependent variable, the excess value developed by Berger and Ofek (1995) compares the total actual value of the firm to the imputed values of the corresponding business units as if it were a stand-alone firm. It is one of the most commonly used measures of diversification, and
previous literature has continued to replicate or use a variation of this method (Lins & Servaes, 1999, 2002; Graham, Lemmon, & Wolf, 2002; Mansi & Reeb, 2002; Fauver, Houston, & Naranjo, 2003; Mendez et al., 2011; Jara-Bertin et al., 2013). In contrast to Tobin’s q, using excess values provides information at the segment level and allows potential sources to be traced. Moreover, the excess value methodology of Berger & Ofek (1995) assumes that the typical single-segment firm is a valid benchmark to compare divisions of conglomerates. Subsequently, by holding this assumption true in our study, we can determine the value added (or reduced) by diversifying to firms. Prior to estimating Equation 1, we first compute the values for our dependent variable:
EXVALi,t = ln ACVALi,t
IMVALi,t
(2)
IMVALi,t = Σ ( SEGACi,t * MLTPLi,t ) (3)
Where
EXVALi,t = firm i’s excess value at year t; a positive excess value indicates a premium, while a negative one is a discount
ACVALi,t = actual value given by the common equity plus book value of debt of firm i at year t
IMVALi,t = imputed value of the sum of a firm’s segments as stand-alone firms for firm i in year t
SEGACi,t = segment i’s reported amount of the accounting item (respective level of either Assets or Sales) for year t
MLTPLi,t =
=
a multiplier defined as the median of the ratio of actual value to a particular accounting item (Assets or Sales) of single-segment firms in segment i’s industry in year t
ACVALi,t
SEGACi,t
CONGLOMERATE, DIVERSIFICATION & FIRM VALUE PRATYAKSA. R., ET AL. 51
If the excess value is positive, then it indicates a premium since the firm as a whole is more valuable than the sum of its segments; conversely, a negative excess value indicates a discount since the firm is worth less than the sum of its segments (Berger & Ofek, 1995).
The excess value is computed for two multiples, namely Assets and Sales. The rationale for including two multiples is to overcome possible issues in management disclosure policies and the quality of segment reporting that are crucial to the validity of the multiplier approach. To compute for the excess value Sales multiplier, we obtain the industry median multiple of actual value-to-sales ratio for single-segment firms in a similar industry. Note that to compute for the median, at least five single-segment firms per industry are required (Berger & Ofek, 1995). Since we obtain two multiples separately, we repeat the same computations for the other accounting item, which is the Asset multiple excess values.
As for the independent variables, the unrelated diversification indicator is given by DIVERi,t which captures the percentage difference in average excess values between single-segment firms and conglomerates in our study (Berger & Ofek, 1995). The base category is the single-segment firm. In terms of ownership structure, we control for supermajority since the Corporate Code of the Philippines (1980) requires a supermajority status for a firm to enforce major corporate acts such as: (1) amendment of the articles of incorporation; (2) increasing or decreasing the capital stock; (3) incurring, creating, or increasing bonded indebtedness; (4) merger or consolidation; (5) extending or shortening the corporate term; (6) transfer of all or substantially all of a corporation’s properties and assets; (7) investing corporate funds; (8) declaring stock dividends; and (9) entering into a management contract. We classify whether a firm has a shareholder with highly concentrated ownership that is 67% or above
which constitutes supermajority control, or it does not and is captured by the SPMAJi,t variable. On the other hand, we use the family variable to capture ownership structure since majority of Philippine businesses have family-based structures (Claessens et al., 1999; Mendez et al., 2011; Young et al., 2008; Son et al., 2013). We use the FAMILi,t variable as proxy to determine the effect of being family-owned and effectively controlled to the decision to diversify (Sullivan & Unite, 2001).
Moreover, in order to isolate the effect of diversification and ownership structure on excess value, we incorporate control variables as introduced by the literature into our model. According to previous studies, firm-specific factors that potentially affect the firm’s value include firm size, profitability, and leverage (Berger & Ofek, 1995; Campa & Kedia, 2002). As presented in Equation 1, CNTRLi,t is the vector of control variables that includes the following: Firm size (FSIZEi,t ) is proxied by the natural logarithm of Total Assets (TA); firm profitability (FPRFTi,t ) is the ratio of Earnings Before Interest and Taxes (EBIT) to Sales; and leverage (FLVRGi,t ) is the ratio of Debt to Total Assets. Using the available financial information, we find the abovementioned financial ratios as suitable proxy measurements as in Campa and Kedia (2002). The industry controls (INDUSi,t ) is a vector of dummy variables representing the six industry sectors as classified by the PSE, namely: Services, Property, Holding Firms, Financial, Industrial, and Mining and Oil.
Since a firm’s past performance inevitably affects firm value at present, empirical models include lagged values of the control variables (Campa & Kedia, 2002; Mendez et al., 2011). Instead of this, to capture the effects of endogeneity, we include EXVALi,t–1 as the lag of dependent variable to be our control variable since previous excess values of the firm affect its current excess values. Further, Erdorf et al. (2012) emphasized that the assuming the conglomerate
52 VOL. 25 NO. 1DLSU BUSINESS & ECONOMICS REVIEW
status to be exogenous yields misleading results. Since previous ownership structure and firm characteristics affect the current excess value, the lagged variable of the dependent variable can capture this relationship. We overcome the possible effects of autocorrelation by using GMM as an estimation procedure instead of OLS, as well as provide unbiased results in which using the latter would produce. Moreover, we introduce fixed effects for individual firms ( ηi ) to capture other characteristics not covered by the model, as well as fixed time effects ( ηt ) for the year to capture macroeconomic forces that impact all firms simultaneously (Mendez et al., 2011).
RESULTS AND DISCUSSION
Comparison of Single-Segment Firms and Conglomerates
This section compares ownership structure (supermajority status and family ownership), firm characteristics (size, profitability, and leverage), and industry sectors between single-segment firms and conglomerates. We examine the descriptive
statistics of our sample of 167 observations of single-segment firms and conglomerates listed in the PSE, with available financial ownership information on segment Sales and Assets, as obtained from the Osiris database and their public disclosures, for the years 2004 to 2013. In the 10-year period, some firms have shifted from operating in a single industry to adding another unrelated industry. Our sample has an approximately balanced number of observations, wherein 53.41% are single-segment firms and 46.59% are conglomerates.
In terms of ownership structure, we look into the supermajority status and family ownership. In terms of the supermajority status, most of the firms or 64.93% of our sample do not have a supermajority status or have no control of two-thirds voting rights. Of the 87 firms without supermajority status, 41 firms are single-segment and 46 are conglomerates. Following this, 59.59% of all single-segment firms and 71.23% of conglomerates in our sample do not have supermajority status. Note that in the latter tables, the discrepancy in the total number of firms (compared to the 167) is due to firms with no ownership structure observations for some years.
Table 1. Descriptive Stats - Average Number of Firms From 2004-2013
Single-Segment ConglomeratesTOTAL
# % # %Number of Firms 89 53.41 78 46.59 167
Table 2. Descriptive Stats - Average Number of Firms with Supermajority Status From 2004-2013
Single-Segment Conglomerates TOTAL# % # % # %
With Supermajority Status 28 40.41 19 28.77 47 35.07
Without Supermajority Status 41 59.59 46 71.23 87 64.93
TOTAL 69 65 134
CONGLOMERATE, DIVERSIFICATION & FIRM VALUE PRATYAKSA. R., ET AL. 53
As for family ownership, we determine whether firms have a corporate family group with effective control (50% and above) or the same group with a direct relationship to the officers of the firm. In our sample, there are approximately as much family-owned firms as there are non-family owned firms, the former comprising 48.21% and the latter being 51.79%. However, more single-segment firms are classified as non-family owned firms while more conglomerates are classified as family-owned. Majority of single-segment firms have a non-family owner, being 51 firms or 66.71%. On the other hand, 46 of conglomerates or 64.15% are owned by the family.
We examine single-segment firms and conglomerates under various ownership structures using combinations of the two factors. About half or 48.06% of our list of publicly-traded firms are non-family owned without supermajority status; 32 are single-segment firms and 29 are conglomerates. The spark of our interest comes from the 20.93% of our firms that are family-owned with supermajority status, with 16 single-segment firms and 11 conglomerates, as these characteristics have a direct impact in exercising the decision to diversify. Also, there are only a few single-segment firms and conglomerates that are owned by a family and do not have supermajority status, wherein these type of firms only comprise 12.40% of the whole sample.
Table 3. Descriptive Stats - Average Number of Family-Owned Firms From 2004-2013
Single-Segment Conglomerates TOTAL# % # % # %
Family-Owned 25 33.29 46 64.15 71 48.21
Non-Family Owned 51 66.71 25 38.54 76 51.79
TOTAL 76 71 147
Table 4. Descriptive Stats - Average Number of Firms Under Various Ownership Structures From 2004-2013
Single-Segment Conglomerates TOTAL
# % # % # %
Family-Owned With Supermajority Status 16 24.25 11 16.80 27 20.93
Family-Owned Without Supermajority Status 8 11.38 8 12.64 16 12.40
Non-Family Owned With Supermajority Status 11 16.02 15 23.52 26 19.38
Non-Family Owned Without Supermajority Status 32 48.35 29 47.04 61 48.06
TOTAL 67 63 130
54 VOL. 25 NO. 1DLSU BUSINESS & ECONOMICS REVIEW
In our sample, we classify firms according to six sectors as prescribed by PSE. Most of the firms are classified under the Industrial sector, which comprises 31.08% of our sample. In fact, 28.59% of our single-segment sample engages in the Industrial sector while it is 34.28% of the conglomerates. Following this, the industry that our sample is concentrated in is the Services at 22.97%, Property at 21.62%, Holding Firms at 12.16%, and Mining and Oil at 10.81%. There are 16 Mining and Oil firms in the sample, and all are single-segment. As for Holding Firms, there are only 19 firms classified, and most of them are conglomerates, as there are only two single-segment Holding Firms. Note that the 1.35% of our sample that is engaged in the Financial industry were only necessary to calculate for the imputed value, as the segment was necessary to compute the sum of the parts of a diversified firm, and non-inclusion of this would have led to an inaccurate excess value measure.
The size of firms is usually captured by the enormity of its assets, and we took the natural logarithm of total assets as a proxy for firm size. On the average, conglomerates have a larger size, approximately 5.5% bigger asset size, as
compared to single-segment firms. Certainly, the addition of another segment and expansion plans like forward, backward, or horizontal integration increase the size of conglomerates.
Profitability of single and multi-segment firms is computed as the ratio of EBIT to Sales. The average mean of single-segment firms is 0.92 while it is 0.71 for conglomerates. On the average, this entails that single-segment firms have higher profitability ratios than conglomerates. However, since the mean values are affected by outliers, we refer to the median values. Using the median, we find that conglomerates have higher profitability of 0.28 compared to the 0.21 for single-segment firms.
Leverage values for single-segment firms and conglomerates were obtained by dividing total debt to total assets. Further, the leverage of a firm indicates the amount of debt used to fund assets. Financing assets allow for greater potential returns on investment. Thus, acquiring debt is instrumental to enlarging, developing, and sustaining businesses. The average leverage ratio of conglomerates is 0.40 while for single-segments it is 0.23. This suggests that conglomerates, which have larger
Table 5. Descriptive Stats - Average Number of Firms per Industry Sector From 2004-2013
Single-Segment Conglomerates TOTAL
# % # % # %
Services 23 28.47 11 16.47 34 22.97
Property 16 20.05 16 23.65 32 21.62
Holding Firms 2 1.86 17 24.70 19 12.16
Financial 1 1.24 1 0.90 2 1.35
Industrial 23 28.59 23 34.28 46 31.08
Mining and Oil 16 19.80 0 0 16 10.81
TOTAL 81 68 149
CONGLOMERATE, DIVERSIFICATION & FIRM VALUE PRATYAKSA. R., ET AL. 55
average sizes than single-segment firms, not only have a greater capacity to hold debt but also acquire more debt to finance its growth.
EXAMINATION OF AVERAGE FIRM EXCESS VALUES
This section examines the descriptive statistics of average excess value measures according to diversification, ownership structure, and firm characteristics, which provides a preliminary indication of the impact of these factors on firm value. Excess value is the ratio between the actual value of the firm operated as a whole to its imputed value as the sum of its segments when operated as separate entities; a positive excess value indicates a premium or the whole being greater than its parts while a negative one
indicates a discount or the whole being less than its parts (Berger & Ofek, 1995).
The excess values of single-segment firms are not well-behaved. Theoretically, using the multiplier method which utilizes the median of single-segment firms in each industry, it should approximate the ratio of actual to imputed value of the firm to be 1 for single-segment firms; hence, it should exhibit an excess value close to 0 for the well-behaved value of single-segment firms. In our sample, single-segment firms already exhibit a negative excess value (mean of -0.69 for Assets and -0.43 for Sales multiples), wherein actual values less than their imputed values, which is an early indication of the discount effect. As for conglomerates, operating in different industry widens the gap between actual and imputed values, as mean excess values are -0.78 for Assets and -0.64 for Sales multiples. Overall, single-
Table 6. Descriptive Stats - Average Firm Characteristics From 2004-2013
Single-Segment Conglomerates
Mean Median Std. Dev. Mean Median Std. Dev.
Size 21.66 21.66 1.99 22.85 22.79 2.08
Profitability 0.92 0.21 7.77 0.71 0.28 20.91
Leverage 0.23 0.16 0.30 0.40 0.18 2.66
Table 7. Average Excess Values by Diversification From 2004-2013
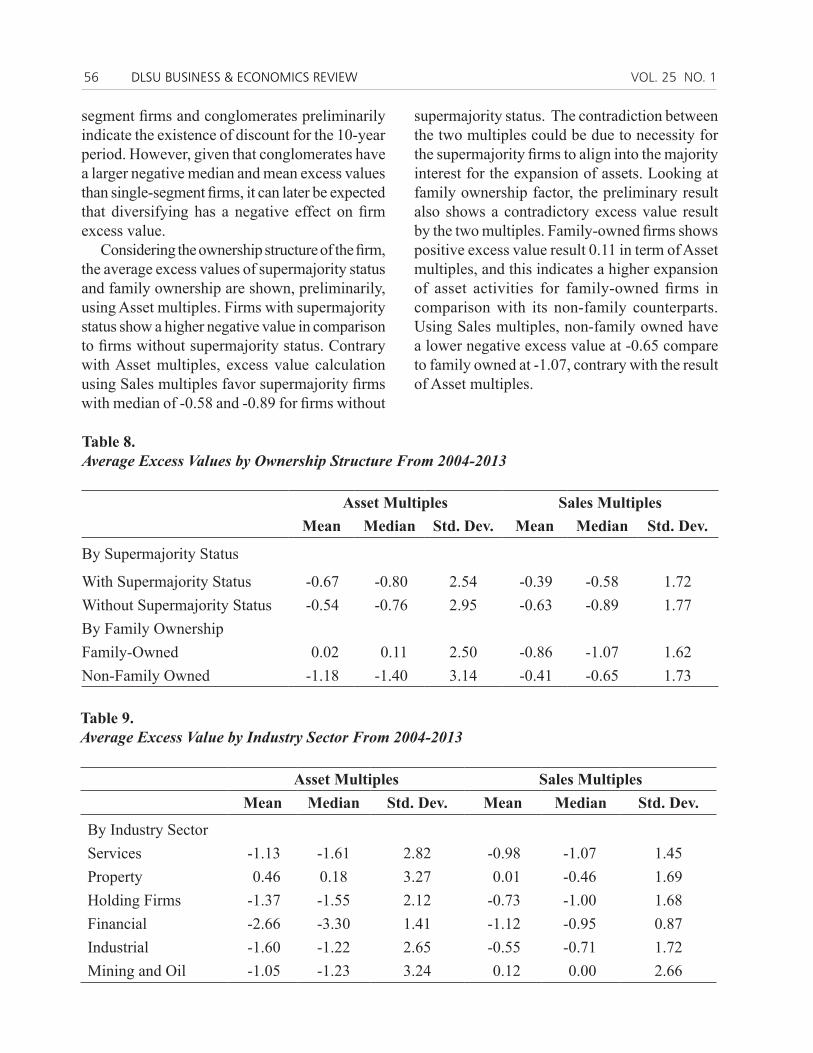
segment firms and conglomerates preliminarily indicate the existence of discount for the 10-year period. However, given that conglomerates have a larger negative median and mean excess values than single-segment firms, it can later be expected that diversifying has a negative effect on firm excess value.
Considering the ownership structure of the firm, the average excess values of supermajority status and family ownership are shown, preliminarily, using Asset multiples. Firms with supermajority status show a higher negative value in comparison to firms without supermajority status. Contrary with Asset multiples, excess value calculation using Sales multiples favor supermajority firms with median of -0.58 and -0.89 for firms without
supermajority status. The contradiction between the two multiples could be due to necessity for the supermajority firms to align into the majority interest for the expansion of assets. Looking at family ownership factor, the preliminary result also shows a contradictory excess value result by the two multiples. Family-owned firms shows positive excess value result 0.11 in term of Asset multiples, and this indicates a higher expansion of asset activities for family-owned firms in comparison with its non-family counterparts. Using Sales multiples, non-family owned have a lower negative excess value at -0.65 compare to family owned at -1.07, contrary with the result of Asset multiples.
Table 8. Average Excess Values by Ownership Structure From 2004-2013
Asset Multiples Sales MultiplesMean Median Std. Dev. Mean Median Std. Dev.
By Supermajority Status
With Supermajority Status -0.67 -0.80 2.54 -0.39 -0.58 1.72Without Supermajority Status -0.54 -0.76 2.95 -0.63 -0.89 1.77By Family OwnershipFamily-Owned 0.02 0.11 2.50 -0.86 -1.07 1.62Non-Family Owned -1.18 -1.40 3.14 -0.41 -0.65 1.73
Table 9. Average Excess Value by Industry Sector From 2004-2013
Asset Multiples Sales MultiplesMean Median Std. Dev. Mean Median Std. Dev.
CONGLOMERATE, DIVERSIFICATION & FIRM VALUE PRATYAKSA. R., ET AL. 57
In terms of the industry sector, on the average, there is a negative excess value or a discount observed for all types of industries covered in our study except for Property. On a per industry sector analysis, the Asset multiples of the Financial sector has the lowest excess value at -3.30 and by Sales multiples service sector has the lowest 10-year average at -1.07 median level. However, Property sector enjoys a positive excess value in the Philippine market during the period with 0.18 using Asset multiples. Analyzing PSE market capitalization during 2004 to 2013, this positive value could be attributed to the positive sentiment the market has for the Property industry. Hence, for firms engaging in the industry, it is rational to expand assets, as backed with positive excess value resulting when using Asset multiples.
EFFECT OF DIVERSIFICATION AND OWNERSHIP STRUCTURE ON FIRM EXCESS VALUE
Simultaneously controlling for all independent variables in our model as initially discussed above, we investigate the link between diversification and ownership structure on firm excess values. In this section, we define “value loss” to be a theoretical or book value loss pertaining to the difference between the firm operating as a whole (its actual value) and the firm operating its various unrelated segments as separate entities (its imputed value). The resulting negative difference indicates that the firm experiences a discount. On the other hand, there is a “value gain” when the difference between the actual value and imputed value is positive, or there is a premium. Moreover, we align the results of our regression to the composition of our sample as discussed in the earlier sections.
The association that exists between firm excess value and diversification is found to be negative and significant. This is captured by the coefficient of diversification which explains
the percentage difference in average excess values between single-segment firms and conglomerates. Conglomerates exhibit a higher discount compared to single-segment firms and these results are consistent across two multipliers, with a discounted value of 56% using Asset multiples and 43% using Sales multiples. There is a value loss to the firm due to diversification, defined as operating in two or more non-related industries.
Consistent with the literature, to expound on the observed discount, Berger and Ofek (1995) explained that overinvestments and cross-subsidization could be associated to value loss in diversified firms. First, in the case of overinvestment, segments that are part of diversified firms overinvest more than single-segment firms. Second, cross-subsidization activity is where diversified firms subsidize into failing segments. In line with this, Scharfstein (1998) argued internal capital markets, that capital of diversified firms, move from one segment to another with little barriers resulting to cross-subsidization, which in effect translate to value loss when subsidizing unhealthy business segments. Relatedly, this loss in value may be attributed to the preliminary finding of average excess values across all industry sectors (except for Property) being negative; so, adding another unrelated industry or operating in more sectors is likely to result to lower firm excess value. Moreover, Jara-Bertin et al. (2013) suggested that engaging in different segments require expertise; however, it is difficult to have specialized skills and resources. The necessity to manage multiple large numbers of controlled companies in different segments creates additional challenges for the generation of management, finance, information, and development.
However, the ownership structure of the firms can greatly influence the firm value from diversification. The value loss that arises from the decision to operate as a conglomerate or by diversifying can be mitigated by the
58 VOL. 25 NO. 1DLSU BUSINESS & ECONOMICS REVIEW
supermajority status and family ownership. This is suggested by our regression results wherein having the supermajority status has a significant and premium effect of 33% on excess values for Sales multiples, despite the negative and insignificant result for Asset multiples. This is consistent with our sample composition wherein we find that there are fewer conglomerates that have a supermajority status, compared to the number of single-segment firms. Having supermajority status means a single entity has two-thirds or more voting rights, the owner has full control and has more efficient decision-making (as there is no need of votes of other
shareholders) that could redistribute wealth to itself (Mendez et al., 2011).
When firms are owned by the family, there is another and greater premium effect which is 54% for Asset multiples and 25% for Sales multiples. Gomez-Meija, Makri, and Kintana (2010) suggested that family firms have the requisite experience to manage the diversification. The desire to promote socio-emotional wealth is a salient factor in the decision to diversify family firms. Thus, family-owned firms with highly concentrated risk in a single enterprise over time would tend to look to diversify more as opposed to non-family firms to reduce single industry risk
Table 10. Regression Results for Assets and Sales Multiples
Note: The *** indicates significance at 1%; ** at 5%; and * at 10%. To overcome the dummy variable trap, the Financial industry serves as the base category for industry sectors.
CONGLOMERATE, DIVERSIFICATION & FIRM VALUE PRATYAKSA. R., ET AL. 59
exposure and eliminate dependency on a single revenue source. We find this explanation to align to our preliminary excess value analysis that being family-owned has a positive average excess value compared to non-family owned firms with a negative mean excess value.
We control for three industry characteristics: firm size, profitability, and leverage. They are controlled for by using the natural logarithm of total assets, ratio of EBIT to sales, and ratio of debt to total assets. Results for firm size and leverage are consistent and significant across multipliers, wherein having a larger size and greater leverage has a premium effect on firm excess value in terms of Asset and Sales multiples. The discount effects may be a result of less optimal decision-making in terms of both Assets and Sales. This may be explained because having greater leverage and larger firm size increases the difficulty of managing operations as there is a necessity to allocate asset and capital to its optimal productive uses. Conglomerates have larger firm sizes and debt capacity compared to single-segment firms. As such, the initial descriptive statistics coincide with the findings above wherein conglomerates suffer a higher potential value loss than single-segment counterparts, the discount being attributed to asset sizes and larger debt. On the other hand, profitability has an ambiguous 0% effect on firm excess values.
Moreover, we also control for industry sectors, wherein we have varied results as some sectors contribute to decrease or increase excess values. We find that operating in the Industrial sector translates to a value loss of 35% in Asset multiples and loss of 14% in Sales multiples. As for the Services sector, there is a discount effect of 37% in the Sales multiples. Interestingly, Property can experience a premium effect of 46% and Mining and Oil at 49%, indicating there is good market perception in these industries. Aligned with all the abovementioned sectors, Holding Firms follow either the same positive or
negative effect based on the businesses they are holding, and so experience a discount of 72% for Asset multiples or a premium of 33% for Sales multiples.
CONCLUSION AND RECOMMENDATIONS
In the Phil ippine corporate set t ing, conglomerates, defined in our study as a corporation made up of two or more different segments operating in different industry sectors falling under one corporate group, serve as the financial and economic powerhouse of the country. Despite their strong presence, the strategies employed by these conglomerates raise relevant questions on whether they create value that accrue to equity holders of the firm. We study the interrelatedness of corporate diversification, ownership structure, and firm valuation in the case of the Philippines, using the excess value methodology and through a panel data regression of 167 publicly-traded firms in the Philippine Stock Exchange from 2004 to 2013. Our sample is composed of 89 single-segment firms and 78 conglomerates, and in terms of ownership structure, there are more single-segment firms with the supermajority status but there are more conglomerates that are family-owned. However, the majority of firms in the sample are a combination of non-family owned without supermajority owned.
Through the years, firms have entered different industry sectors to change their growth stages. The recent upward trend of diversification that seems to have a positive impact among Philippine firms is quite the opposite, as a discount exists. Contrary to common notion and other Asian studies that exhibit a premium, we find an average negative average excess values for both Assets and Sales multiples of single-segment firms and conglomerates. However, conglomerates suffer from larger discounts relative to single-
60 VOL. 25 NO. 1DLSU BUSINESS & ECONOMICS REVIEW
segment firms due to their massive firm sizes, and when simultaneously controlling for firm characteristics and industry sector, we find the estimate of diversification discount in the Philippines of 56% using Asset multiples and 43% using Sales multiples.
This suggests that diversifying leads to the discount effect. That is, operating in another industry sector results to a theoretical book value loss, wherein the value of the firm operated as a whole is worth less than the sum of its parts when operated as single entities. This discount can be pinpointed to the agency problem, internal capital markets, and cross-subsidization. Where no proper synergy is achieved, there is an inefficient fund allocation that can be explained due to unspecialized expertise in managing unrelated industries. Also, the loss could be sourced from the tendency that subsidization across segments is more likely to happen, where profitable business units carry a dead-weight when it subsidizes unhealthy segments.
Despite the average discount resulting from diversification, ownership structure aspects may offset this discount as having the supermajority status has a premium effect of 33% using Sales multiples, and being family-owned has a premium effect of 54% for Asset and 25% for Sales multiples. So, conglomerates can justify the decision to diversify, regardless of the discount resulting from operating in unrelated industries as well as having larger firm sizes and greater leverage that contribute to this discount; they can extract gains from their type of ownership structure. This is consistent with literature which explains when owners have control (either through effective control of the family or having supermajority status) of making major changes to the firm, and this still remains in line with the mission to create shareholder wealth. However, for conglomerates, it is relatively more difficult to attain more than two-thirds voting rights (compared to single-segment firms) since they would require more capital as they have larger sizes, which they can
get through selling equity or debt. So, this is most likely motivation for conglomerates in the Philippines to be family-owned.
Relevantly, the findings of our study serve as a decision-making guide that allows potential investors to evaluate a firm’s characteristics before diversifying. It is not to say that firms entirely should not diversify; however, if they choose to diversify, they should proceed with caution. Managers must be more vigilant in mitigating the risks of experiencing value loss after engaging in diversification. Value losses could also be due to the lack of legal protection, and as a general recommendation, internal corporate policy must be improved in such a way that agency costs are minimized. Firms should address the following issues: (1) amount of subsidization allotted for other or new segments; (2) protection of crown jewels or most valuable segments; and (3) vigilance in protecting minority shareholder interests.
Financial literature on firm valuation and corporate diversification is scarce in the Philippines. Although our paper only provides insight on the effects of ownership structure in the valuation-diversification relationship, we provide various recommendations to extend future studies in the Philippines: (1) consider the degree of diversification of conglomerates; (2) determine optimal number of segments to operate; (3) utilize alternative firm value measures and methods, such as market valuation and compare results with book valuation studies; (4) include more dummy interaction variables, for instance, between FAMILi,t x SPMAJi,t to capture family major shareholding; (5) use variables with narrower classifications or more refined variables such as quantified major shareholder percentages and dynamics of business group structures or consider industry level subsectors; (6) study the interaction between industries to determine synergies between sectors whether they complement each other; and (7) develop a model to extend the study to financial firms.
CONGLOMERATE, DIVERSIFICATION & FIRM VALUE PRATYAKSA. R., ET AL. 61
REFERENCES
Berger, P. G., & Ofek, E. (1995). Diversification’s effect on firm value. Journal of Financial Economics, 37(1), 39-65.
Berry, C. (1971). Corporate growth and diversification. Journal of Law and Economics, 14(2), 371-384.
Burch, T. R., Nanda, V., & Narayanan, M. P. (2000). Industry structure and the conglomerate “discount”: Theory and evidence (Working Paper). University of Michican Business School.
Campa, J. M., & Kedia, S. (2002). Explaining the diversification discount. The Journal of Finance, 57(4), 1731-1762.
Claessens, S., Djankov, S., & Lang, L. H. P. (1999). The separation of ownership and control in East Asian corporations. Journal of Financial Economics, 58(1-2), 81-112.
Erdorf, S., Hartmann-Wendels, T., Heinrichs, N., & Matz, M. (2012). Corporate diversification and firm value: A survey of recent literature (Cologne Graduate School Working Paper). Retrieved from: http://ssrn.com/abstract=1968977
Fauver, L., Houston, J., & Naranjo, A. (2003). Capital market development, international integration, legal systems, and the value of corporate diversification: A cross-country analysis. The Journal of Financial and Quantitative Analysis, 38(01), 135-157.
Gomez-Mejia, L. R., Makri, M., & Kintana, M. L. (2010). Diversification decisions in family-controlled firms. Journal of Management Studies, 47(2), 223-252.
Graham, J., Lemmon, M., & Wolf, J. G. (2002). Does corporate diversification destroy value? The Journal of Finance, 57(2), 695-720.
Greene, W. H. (2003). Econometric Analysis(5th Edition). New York: Prentice Hall.
Gutierrez, B. P., & Rodriguez, R. A. (2013). Diversification strategies of large business groups in the Philippines. Philippine Management Review, 20, 65-82.
Icamina, P. (2010, Jul 20). Conglomerates control top 100 listed companies. Malaya Business Insight. Retrieved from: http://www.malaya.com.ph/07202010/busi1.html
Jara-Bertin, M., Espinosa, C., & Lopez-Iturriaga, F. (2013). Diversification in emerging markets: The case of Chilean Firms (SSRN Working Paper). Place of publication: Publisher.
Kamien, M., & Schwartz, N. (1975). Market structure and innovation: A survey. Journal of Economic Literature, 13(1), 1-37.
Lang, L. H. P., & Stulz, R. M. (1994). Tobin’s q, corporate diversification, and firm performance. Journal of Political Economy, 102(6), 1248-1280.
Lins, K., & Servaes, H. (1999). International evidence on the value of corporate diversification. The Journal of Finance, 54(6), 2215-2239.
———. (2002). Is corporate diversification beneficial in emerging markets? Financial Management, 31(2), 5-31.
Mansi, S. A., & Reeb, D. M. (2002). Corporate diversification: What gets discounted? Journal of Finance, 57(5), 2167-2183.
Markides, C., & Williamson, P. (1994). Related diversification, core competence and corporate performance. Strategic Management Journal, 15, 149-165.
Mendez, C. E., Jara, M., Villanueva, C. M., & Vieito, P. (2011). Does corporate diversification create value in emerging markets? New evidence from South America (Working Paper).
Pitts, R., & Hopkins, D. (1982). Firm diversity: Conceptualization and measurement. The Academy of Management Review, 7(4), 620-629.
Santalo, J., & Becerra, M. (2008). Competition from specialized firms and the diversification-performance linkage. Journal of Finance, 63(2), 81-883.
Santiago, J., & Magpayo, K. (2007). Cross-connections: The Philippines. Union Bank of Switzerland [UBS] Investment Research.
Scharfstein, D. S. (1998). The dark side of internal capital markets II: Evidence from diversified conglomerates (NBER Working Papers 6352). University of Southern California: Harvard Business School and National Bureau of Economic Research.
Son, T. T., Shetty, V., Thi, T. D., & Nguyen, V. T. (2013). Analysis of the structure of ownership and corporate governance, issues and problems in implementation of effective corporate governance
62 VOL. 25 NO. 1DLSU BUSINESS & ECONOMICS REVIEW
practices in four countries of the ‘next eleven’ markets. Retrieved from: http://www.academia.edu/5379289/Reports_of_NEXT11_countries_Vietnam_Mexico_Turkey_Philippines_on_the_family_firms
Sullivan, M. J., & Unite, A. A. (2001). The influence of group affiliation and the underwriting process on emerging market IPOs: The case of the Philippines. Pacific-Basin Finance Journal, 9(5), 487-512.
The Corporation Code of the Philippines, Batas Pambansa Blg. 68 (1980)
Villalonga, B. (2004). Does diversification cause the diversification discount? Financial Management, 33, 5-27.
Young, M., Peng, M., Ahlstrom, D., Bruton, G., & Jiang, Y. (2008). Corporate governance in emerging economies: A review of the principal–principal perspective. Journal of Management Studies, 45, 196-220.