The Information and Monitoring Role of Capital Markets: Theory and International Evidence Solomon Tadesse * The University of South Carolina Abstract Capital markets perform two distinct functions: provision of capital and facilitation of good governance through information production and monitoring. We argue that the governance function impacts on the efficiency with which resources are utilized within the firm. Based on industry level data across thirty-eight countries, we present evidence suggesting a positive relation between market-based governance and improvements in industry efficiency. The measures of governance are also positively correlated with productivity improvements and growth in real output. The evidence underscores the role of capital markets as a conduit of socially valuable governance services as distinct from capital provision. JEL Classification: G3, G34, G14, E44, O16 Keywords: Corporate Governance, Information Aggregation, Monitoring, Economic Efficiency, Productivity, Economic Growth * Corresponding author: The Darla Moore School of Business, The University of South Carolina, Columbia, SC 29208. Tele: (803) 777-4917; Fax: (803) 777-3609. E-mail: [email protected]. I would like to thank Steve Byers, Joshua Coval, Stijn Claessens, Marc Nerlove, Gordon Phillips, Raghuram Rajan, Lemma Senbet, Jeremy Stein, Alex Triantis, and Haluk Unal for comments and helpful discussions. I also thank seminar participants at the American Finance Association, Western Finance Association, the International Monetary Fund, the Financial Management Association Meetings, Penn State University, and the University of South Carolina.
Transcript
The Information and Monitoring Role of Capital Markets: Theoryand International Evidence
Solomon Tadesse*
The University of South Carolina
Abstract
Capital markets perform two distinct functions: provision of capital and facilitation ofgood governance through information production and monitoring. We argue that thegovernance function impacts on the efficiency with which resources are utilized withinthe firm. Based on industry level data across thirty-eight countries, we present evidencesuggesting a positive relation between market-based governance and improvements inindustry efficiency. The measures of governance are also positively correlated withproductivity improvements and growth in real output. The evidence underscores the roleof capital markets as a conduit of socially valuable governance services as distinct fromcapital provision.
JEL Classification: G3, G34, G14, E44, O16
Keywords: Corporate Governance, Information Aggregation, Monitoring, EconomicEfficiency, Productivity, Economic Growth
* Corresponding author: The Darla Moore School of Business, The University of South Carolina,
Columbia, SC 29208. Tele: (803) 777-4917; Fax: (803) 777-3609. E-mail: [email protected]. Iwould like to thank Steve Byers, Joshua Coval, Stijn Claessens, Marc Nerlove, Gordon Phillips,Raghuram Rajan, Lemma Senbet, Jeremy Stein, Alex Triantis, and Haluk Unal for comments andhelpful discussions. I also thank seminar participants at the American Finance Association,Western Finance Association, the International Monetary Fund, the Financial ManagementAssociation Meetings, Penn State University, and the University of South Carolina.
ii
The Information and Monitoring Role of Capital Markets: Theoryand International Evidence
Abstract
Capital markets perform two distinct functions: provision of capital and facilitation ofgood governance through information production and monitoring. We argue that thegovernance function impacts on the efficiency with which resources are utilized withinthe firm. Based on industry level data across thirty-eight countries, we present evidencesuggesting a positive relation between market-based governance and improvements inindustry efficiency. The measures of governance are also positively correlated withproductivity improvements and growth in real output. The evidence underscores the roleof capital markets as a conduit of socially valuable governance services as distinct fromcapital provision.
1
The Information and Monitoring Role of Capital Markets: Theoryand International Evidence
Why do we observe differences in economic performance among countries; across
industries in the same economy; and across firms belonging to the same industry? What could
be the role of the financial system in explaining cross-country and cross-industry variations in
economic performance? While determinants of cross-country economic growth have been of
great interest to development economists and growth economic theory, the role of financial
markets and institutions has traditionally received very little attention. Recent finance literature
reports strong relations between indicators of financial development and economic performance
in the real sector, indicating a positive role for capital markets and institutions (see, e.g., Levine
(1998), Levine and Zervos (1998); and Rajan and Zingales (1998)). Levine and Zervos (1998),
for example, find a strong correlation between financial development, and growth in per capita
GDP and productivity. Yet, there is still a lack of clear understanding of the manner in which the
financial system impacts on economic performance.
In this study, we utilize a corporate finance framework to investigate empirically the
finance-growth link through examining possible channels through which financial market
functions could influence economic performance at industry level. We begin from a premise
that financial markets and institutions play two critical roles in an economy: allocation of risk
capital through saving mobilization and risk-pooling and sharing; and promotion of responsible
governance and control through providing outside investors a variety of mechanisms for
monitoring inside decision makers. In its allocation function, the financial system helps transfer
resources from individual savers to agents with managerial and entrepreneurial talents with
investment opportunities and provides firms and investors risk-pooling and sharing facilities. As
its governance function, it provides monitoring and information production services by which it
2
helps mitigate the various agency problems of the firm resulting in better project evaluation and
selection even in the absence of external finance need. While recognizing the twin roles of the
financial system, modern corporate finance theory emphasizes the monitoring and information
production function; in contrast, recent finance-growth literature exclusively focuses on the
capital mobilization role. Bridging the gap, we argue that the two functions systematically
impact on differential sources of growth.
We argue that a country’s financial system positively contributes to economic
performance in the real sector of the economy. Previous literature (see, e.g., Levine and Zervos
(1998)) documents that financial development is correlated with growth in productivity. Noting
that productivity growth stems from efficiency improvements and technological advancement,
we identify two channels through which the twin functions of the financial system influence
economic performance: promoting technological innovations and inducing the efficiency with
which resources are utilized. Focusing on the governance role of the financial system, we argue
and empirically examine that information production and monitoring services contribute to
improvements in the relative economic efficiency with which the firm utilizes its resources.
The paper develops an empirical model of total factor productivity growth (as a
performance measure) which isolates the contribution of production and economic efficiencies
from the pure technological change effects. It estimates the relative production and economic
efficiencies for ten manufacturing industries across thirty-eight countries. We then empirically
relate these estimates of industry performance to measures of the governance functions of the
financial system, controlling for its capital mobilization role. Our hypothesis is that measures of
the governance function should have a positive impact on industry efficiency.
3
We find that measures of the information aggregation and monitoring functions of capital
markets are indeed positively related to improvements in efficiency. Moreover, control variables
for the capital mobilization function have little role in explaining variations in industry
efficiency. The results are economically meaningful as well. An increase in our proxies for the
governance function by one standard deviation would increase the rate of efficiency growth of
the average industry by 0.18 percent per year from the actual growth rate in economic efficiency
of 0.032 percent observed over the sample period.
The correlation between our measures of governance and efficiency is robust to
alternative model specification in which we use legal and institutional variables that are deemed
to be more exogenous as instruments, indicating that the relations identified could be causal.
The empirical result is also robust to alternative definitions of the focal constructs of ‘efficiency’
and ‘governance’, and alternative specifications of latent variables as random- or fixed-effects.
The evidence underscores the role of particularly the equity market as a conduit of
socially valuable governance services as distinct from capital provision. The value of this service
is economically large. An industry operating in a country with a stock market that is one
standard deviation above the mean of the proxy for governance function would have a growth
rate of 1.05 percent per annum in real output more than that for the average industry.
Cumulating over the sample period of 15 years, real output for such industry would have been
about 17 percent higher in 1995, the end of the study period.
The study is related to the large literature which identifies the role of financial markets as
information producers and monitors of management (see, e.g., Grossman (1976), Grossman and
Stiglitz (1980), Diamond and Verrechia (1981); and Holmstrom and Tirole (1993)). Stock
markets provide incentives to gather information that gets reflected in stock prices. Prices in
4
securities markets direct capital to its best use (the “prospective” role of stock prices), and
provide managers with feedback about how investors evaluate their performance (the
“retrospective” role) (Dow and Gorton (1997)). Financial intermediaries also serve as delegated
monitors and information producers (see Diamond, 1984)).
In addition to reducing the costs of information acquisition ex ante, financial contracts,
markets and institutions may arise to minimize the information acquisition and enforcement costs
of monitoring firm managers and exerting corporate control ex post. Shleifer and Vishney (1997)
provide an extensive review of this literature. Financial contracts could be designed to mitigate
agency problems (see Barnea, Haugen and Senbet (1985)). Financial intermediaries serve as
the interests of managers with those of owners (see Jensen and Meckling (1976)), and
information in stock prices allows effective managerial incentive schemes (Holmstrom and
Tirole (1993)). Moreover, financial markets facilitate corporate control through takeovers as a
way of disciplining (Scharfstein (1988) and Stein (1988)).
Recent literature relates this ability to produce information and facilitate monitoring and
control to improved resource allocation that may have growth implications (see, Allen (1993),
Holmstrom and Tirole (1993), Dow and Gorton (1997); and Titman and Subrahamanyam
(1999)). Dow and Gorton (1997) and Titman and Subrahamanyam (1999) present models in
which information produced by the stock market improves allocational efficiency through
guiding managerial decisions. In Holmstrom and Tirole (1993), the use of information for
incentive contracts improves managerial performance and this service of the stock market is both
privately and socially beneficial.
5
The present work extends the strands of arguments presented in these papers to suggest
that the information and monitoring role of markets and institutions has a distinct contribution to
real economic performance separate from the contribution of their capital provision function. It
argues that information aggregation and monitoring enhances economic efficiency within the
firm through the mechanisms identified by the literature.
The study complements the recent empirical literature examining the link between
financial development and economic growth. Levine and Zervos (1998) presents evidence of
correlation between indicators of banking and stock market developments and per capita GDP
growth, rate of capital accumulation and productivity growth. Rajan and Zingales (1998)
examine whether industries that are more dependant on external finance grow faster in more
developed financial markets than less in less developed markets. Similarly, using firm-level
data for 30 countries, Demirguc-Kunt and Maksimovic (1998) examine whether firms with
access to more developed financial markets grow at faster rates than those with access to less
developed markets
The paper differs from these studies in a number of ways. First, Rajan and Zingales
(1998) as well as Demirguc-Kunt and Maksimovic (1998)’s argument is that financial markets
matter only for firms or industries which rely on external finance. Our argument, by contrast, is
that it matters even for firms that rely on internal finance, though the channel of influence might
be different. Through their information aggregation and monitoring functions, financial markets
improve project evaluation and selection, raising economic. Second, unlike previous studies that
focus solely on the capital mobilization role of financial markets, we emphasize the latter’s
multiple functions. We trace the channel of influence of the many functions on the various
dimensions economic performance. In particular, the governance function should have an
6
impact of improving production and economic efficiency. The difference in terms of policy
implications between our functional perspective and previous studies is stark. Our major policy
message is that a mere launching of financial markets and institutions is not sufficient for
accelerating growth; what also matters is their efficient functioning. Third, we decompose
aggregate performance into its primitive sources distinguishing between those sources which are
under the control of inside decision makers (e.g. production efficiency) and those which are more
exogenous to the firm or the industry (e.g. technological change). By relating the various
dimensions of financial development to these disparate sources of growth, we underscore the role
of financial markets in impacting managerial behavior as distinct from its role as conduit of
capital provision.
The rest of the paper is organized as follows. Section I provides the theoretical
framework and develops the hypotheses to be investigated. We describe the data and
methodology in Section II. Section III examines the empirical relations between aggregate
performance and governance while Section IV investigates the relations between sources of
growth and capital market functions. Section V summarizes the results with policy implications.
I. Theoretical framework and hypotheses development
Corporate finance theory suggests that the link between finance and investment at the
micro level is a consequence of market and contractual imperfections. In fact, financial markets
and institutions arise to mitigate problems of informational and transactional frictions. To that
end, financial markets and institutions perform various functions. They aggregate and mobilize
capital, provide risk pooling and sharing services, assess and select projects and management
through producing information, and monitor inside decision making. These diverse services
could be classified into two analytically separable functions: capital allocation and governance.
7
The allocation function involves mobilizing savings from economic units with excess capital to
individuals with managerial and entrepreneurial talents with investment opportunities, as well as
providing risk pooling and sharing opportunities. The governance function refers to the role of
financial systems in alleviating agency problems that arise among stakeholders in the firm.
The degree to which the financial system influences real economic performance depends
on how effectively it carries out both its allocation and governance functions.
A. Governance via financial systems and economic performance: Theeconomic efficiency channel
A primary function of financial markets is one of facilitating responsible governance and
control within the firm. In a world of uncertainty and incomplete contracting, problems of
imperfect information and moral hazard may prevent the first-best value-maximizing investment
behavior. Investment and operations in the firm would be prone to agency problems in which
agents engage in value destroying behavior. Markets and institutions mitigate the consequences
of imperfect information and moral hazard through information production and facilitation of
monitoring. The effectiveness with which markets perform this governance function bears on
firm’s economic efficiency in the sense that alleviation of the contractual frictions engenders
convergence of the firm’s observed economic behavior to its optimum. Economic efficiency is
broadly defined as the degree to which observed economic behavior converges to the optimal
given the constraints of the underlying technologya.
a Assuming cost minimization as behavioral goal, for example economic efficiency could be operationalized as observed totalcost compared to the optimal given the level of output and input prices.
8
A.1 Information production and economic efficiency
A vital role of markets is processing of information. Stock markets influence the
incentive of agents to acquire and disseminate information about firms (see, e.g., Grossman and
Stiglitz (1980)). Trading activity among participants produce information that are conveyed
through price signals. This information role has consequences that have efficiency implications.
First, security prices formed in markets convey valuable information about the profitability of
current investment opportunities and thereby guide managerial decision-making (see Dow and
Gorton (1997), Bresnahaan, Milgrom and Paul (1992); and Titman and Subrahmanyam (1999)).
Managers’ investment decisions may be guided by price signalsb. Second, simply that based on
the information, bad firms (and management teams) or projects do not get funding, preventing
wastage of resource.
Financial institutions also provide an information production function. A large literature
identifies the role of financial intermediaries as information processing and monitoring (see, e.g.,
Diamond (1984), and Leland and Pyle (1977)). Instead of informed traders producing
information through trading and conveying it via prices, banks hire loan officers who produce
information while evaluating projects for loan financing. Dow and Gorton (1997) show that the
same information can be produced under the two mechanisms. As in the stock market, such
information guides managerial investment decision. Moreover, bad projects and firms get
screened out. In summary, the information production function and firm economic efficiency
are linked in that markets and institutions that generate better information enable firms to make
better decisions.
b In the finance literature, it is standard to assume that the information set of management is more finely partitioned than that ofoutsiders and thus information flows from the firm to the market. The reverse flow could be argued to be plausible in moderneconomies in which consensus are hard to achieve about the optimal managerial rule due to rapid technological change,constantly changing market conditions etc. Under these conditions, stock market prices will have a valuable role of aggregatingmany diverse opinions and convey the resulting information about the optimal decision rule to management (Allen(1993)).
9
A.2 Monitoring and economic efficiency
Contractual relationships are prone to severe agency problems due to conflicts of interest
among stakeholders in the firm, including those between management and shareholders that may
result in sub-optimal managerial actions. Markets and institutions provide an important function
in controlling and monitoring such sub-optimal behavior. First, markets generate information to
evaluate the quality of past managerial decisions (Kihlstrom and Matthews (1990), and Dow and
Gorton (1997)). Second, information in stock market prices allows effective managerial
incentive schemes (Holmstrom and Tirole (1993)). Third, the threat of takeover through the
facilitation of capital markets mitigates managerial inefficiencies (Grossman and Hart (1980),
Scharfstein (1988), and Stein (1988)). Fourth, the rich menu of contracts provided in the market
allow private work-outs of financial distress, easing the transfer of control to efficient
management as well as enabling the firm to avoid costly bankruptcy (Barnea, Haugen and Senbet
(1985)). The monitoring and control function can also be accomplished through a financial
intermediary which oversees managerial actions on behalf of numerous small investors (as
delegated monitor (Diamond (1984)) for whom it may not be economical to do the monitoring
by themselves.
The extent to which markets perform their monitoring services directly impacts on the
efficiency with which firms are run in the economy as the goal of monitoring is to induce agents
to perform as close to the value maximizing first best in their investment and operational
decisions. Efficiency can be achieved via markets and institutions in a number of ways.
Managerial incentives that use information in stock market prices reduce shirking. In general, it
aligns managerial interest to that of shareholders reducing potential under or over investment vis
a vis the optimum. Through the mechanism of the market for corporate control inefficient
10
& ( , )y g A G=
& & & ,y I TFP= +
management is forced out of office. More importantly, the threat of takeover induces managerial
discipline, preventing management from actions that waste firm resources.
Hence the economic efficiency of firms should be positively impacted by how well the
supporting financial system performs its information production and monitoring (i.e.
governance) function. To sum up, an index of “betterment” of an economic unit, extensively
used in the literature, is growth rate in some measure of output. We argue that how better-off an
economic unit will be, as measured by growth in output (y), is partly determined by the
effectiveness and efficiency of the financial system in delivering governance (G) and capital
allocation functions (A),
(1)
Furthermore, growth in output (y), can be decomposed into its primitive sources, which include
growth in constituent factors of production and changes in all other conditions that bear on the
production process. The latter represents what is called growth in total factor productivity (TFP),
and it accounts for all changes in output not accounted by growth in production inputs. Thus,
(2)
I denote growth rate in inputs. Physical capital being a factor, I also includes ‘rate of capital
accumulation’. Productivity (TFP) may change due to shifts in the underlying technology or
changes in the economic efficiency of the production process. Thus, denoting T to be
technological change and E to be changes in production efficiency,
ETPFT && += (3)
11
We trace a channel through which the financial system influences economic performance
whereby the degree to which it provides governance (G) effects improvement in the relative
economic efficiency (E) with which the firm utilizes its resources. Thus, our conceptual model
is,
),( GAE Φ=& (4)
and,
0>∂Φ∂G
II. Data and measurement of proxies
Our database combines country financial development indicators, industry production
characteristics and other country economic statistics that are assembled from various sources.
We use industry-level production data for ten manufacturing industries over the period 1980 to
1995 for thirty-eight countries from the United Nations Industrial Statistics database to estimate
measures of economic performance. We have data for measures of output, inputs and
investments. The financial development indicators include stock market capitalization, total
value traded and turnover ratio obtained from Emerging Markets Fact-book (various issues)
published by the World Bank. This data, for many countries, is available on a systematic manner
since 1980, thus limiting the study period. We obtain data on the size of domestic credit and size
of the private credit sector from the International Financial Statistics (IFS) published by the
International Monetary Fund. All other country-specific variables, including the Gross Domestic
Product, per capita GDP, exchange rates, the Producer Price Index, the Wholesale Price Index
and the Consumer Price Index are from the International Financial Statistics.
12
A. Measurement of capital market functions
Ideally, we would like to have a measure of the ability of firms to raise capital to meet
their financial needs and to benefit from the related governance services provided by financial
systems. We use measures of financial system size (relative to GDP) as proxies for the capital
mobilization function and measures of financial market activity variables as proxies for the
governance function. The size variables include (1) stock market capitalization to Gross
Domestic Product ratio; (2) domestic credit to GDP; and (3) claims against the private sector
relative to GDP.
We use two broad indicators of the degree of governance services provided by a country’s
financial system. The first is a measure of a country’s stock market activity for which we use the
ratio of total value of equity traded to stock market capitalization – turnover ratio.
There are strong theoretical reasons for using this variable as a measure of the
effectiveness of the governance function. First, greater market liquidity implies more and better
information— prices reflect information about the firm and its investment prospects more
accurately. Increased market activity induces more information-acquisition, which, in turn,
increases the information content of stock prices (see Holmstrom and Tirole (1993)). The more
shares of stock actively being traded and the more liquid the market, the easier it becomes for an
informed party to make a good return on investment (Kyle (1984)). The resultant increased
information flow into the market improves the information content of stock prices. Hence, a
measure of market liquidity is an indicator of the degree of “information aggregation”.
Second, informative security prices in liquid markets facilitate the monitoringc of
management, as well as the implementation of incentive-based compensation designed to align
c Effective monitoring and control could be exercised through other mechanisms such as via intermediaries and boardeffectiveness, which may not be captured by our proxy for governance.
13
management’s interests with those of outside shareholders. Incentive contracts in the form of
managerial option and equity related compensations are useful for reducing agency costs only to
the extent that the underlying equity prices are informative of firm performance. Holmstrom and
Tirole (1993) show how liquidity via increased informativeness of security prices enhances
monitoring.
Third, greater liquidity makes it easier for active shareholders to build positions so as to
effect changes in corporate policies. Bhide (1993) argues that more liquidity implies less
monitoring, since shareholders can dispose easily of positions if they disagree with
management’s policies. On the other hand, Maug (1998) shows that the benefits to shareholders
from building positions and effecting good governance is so significant that the impact of greater
market liquidity on effective monitoring is unambiguously positive.
Finally, the effective use of the secondary equity market for corporate-control activities
requires that the market be liquid. Takeovers require a liquid capital market— a market where
bidders can access a vast amount of capital on short notice. Therefore, with liquid markets,
investors who want to acquire a firm can do so.
An alternative way to measure the degree of information flow and the ease of monitoring
is to look at the accounting standards that reflect the relative transparency of the financial
system. Accounting standards determine the amount and quality of disclosure by firms trading
in the market, impacting the degree of information flow in the capital market. The Center for
International Financial Analysis and Research (CIFAR) creates an index of disclosure quality
across countries by rating the inclusion or omission of 90 reportable financial items for a sample
of at least three firms per country. The greater the level of disclosure, the higher the information
14
flow in the markets and the consequent ease and effectiveness of monitoring. So we use this
index as an alternative proxy for governance as well.
Table 1 presents a summary of the measures of capital market functions for the thirty-
eight countries in the sample. The table shows averages of the variables over the sample period
of 1980-1995 for each country. We observe a number of patterns. First, there is a wide
variation. For example, Germany has a turnover ratio of 1.0394 vis a vis Bangladesh’s 0.0327.
Second, stock market size does not necessarily go hand in hand with stock market activity. For
example, Chile has a relatively large market capitalization ratio (0.4717) and yet is one of the
thinnest markets with turnover of 0.0661. On the other hand, Turkey has one of the smallest
markets (capitalization equals 0.0624) and is relatively busy (with turnover of 0.5041). Third, in
all measures, developed countries have much more advanced financial systems than emerging
countries. The mean values of the proxies for the sub-sample of the nineteen advanced
economies are much higher than those for the sub-sample comprising the nineteen emerging
economies. The correlation’s (not reported) between log of real per capita income and each of
the financial development indicators is significantly positive (0.621 (significant at 10%) for
private credit, 0.484 (significant at 1%) for size of credit market and 0.350(significant at 5%) for
stock market turnover).
In general, the distribution of countries along the spectrum of the financial variables is
highly skewed in favor of developed economies. For example, 32% of emerging countries and
0% of developed countries fall in the lowest quartile of market turnover ratio; and over 40% of
emerging countries and only 5% of developed economies fall in the bottom quartile of stock
market capitalization. 45% of emerging economies and 0% of developed economies belong in
15
the bottom quartile on size of the credit market. In contrast, only 9% of emerging markets and
43 % of the advanced markets fall in the top quartile of market capitalization.
B. Measurement of economic performance
An aggregate index of improvement in an economic unit, extensively used in the
literature, is the growth rate in some measure of the output of the firm. Output growth could be a
result of either growth in component factors of production or improvements in productivity.
Furthermore, productivity gains in economic activities could be caused by two different factors:
adoption of technological innovations in products and processes (measured by the rate of
technological progress), and improvements in efficiency which reflects the capacity of insider
decision-makers to improve production, given inputs and available technology.
We define efficiency as the degree to which the firm’s observed attainment converges to
its optimal behavioral goal, under conditions of technological and market constraints. We
operationalize our sense of efficiency using Farrell’s (1957) concept of technical efficiency and
Leibenstein’s (1966) X-efficiency or economic efficiency. Technical efficiency reflects the
degree to which a producer achieves the maximum attainable quantity of output for a given
bundle of inputs. The optimum is in terms of production possibilities and as such efficiency is
defined in reference to the technical relations between observed and attainable quantities.
The optimum can also be defined in terms of some behavioral goal the producer is
assumed to pursue, such as cost minimization or profit maximization. Efficiency then refers to
the degree to which that assumed objective is achieved. In the cost minimization framework, an
empirical measure of efficiency would be the ratio of the minimum attainable cost for a given
level of output to the actual cost incurred by the producer. This is what Leibenstein (1966) call
“X-efficiency”. A firm can be technically efficient by obtaining the maximum output for
16
whatever bundle of inputs it chooses to employ. It may yet be inefficient if it purchases what is
not the best bundle of inputs given the input prices and their marginal productivities in
production. This latter concept of efficiency is called “price efficiency”, or ‘allocational
efficiency’. X-efficiency (or economic efficiency) subsumes both technical and price
efficiencies d.
Improvements in firm’s productivity are not the result of efficiency gains alone. They
may arise from adoption of technological innovations in processes and products that enable the
firm to achieve higher production quantities with lower input usage or equivalently the same
level of output at lower costs. While efficiency reflects managerial actions in reference to a
behavioral goal, this source of productivity reflects both the state of the available technology and
the ability of firms to acquire new technologies in their production processes.
Empirically, we measure technical efficiency based on a stochastic production frontier,
in which efficiency is measured as the proportion of actual output to the maximally attainable
one. We measure X-efficiency (economic efficiency) based on a stochastic cost frontier as the
proportion of the minimum attainable cost to actual cost. We measure the effect of technical
progress as the shift in the production frontier over time holding input quantities at the same
level or alternatively as the downward shift in the average cost of production over time holding
constant input prices and output level.
d The governance services provided by capital markets may have impacts on the degree of price efficiency in a number of ways.First, the first best value maximizing optimum (for example, in terms of input mix) may diverge from what is optimal tomanagement either due to managerial agency problems owing to managerial discretion or due to financial agency problems suchas risk shifting. In the presence of leverage, given relative prices, management may, in the interest of shareholders, opt to aninput mix that enhances risk shifting, trading the price advantage relative to firm value maximization with the ‘risk advantage’relative to shareholder value maximization. To the extent that capital markets alleviate these agency problems through incentivecontracts (for managerial agency), and through covenants and complex securities (for financial agency), they help improve afirm’s allocational efficiency. Second, prices in capital markets may convey information about marginal productivity.
17
ln ( ) ln ( ) ( ln ( )ln ( )
) ln ( ) ( ) ( )
,
( ) ( )
y t x t t x t x t
t x t t t t
where
t t
ci j cij
tj kj jkci
jci
k
tt jt cij
cij ci
ci c i ci
= + + +
+ + + +
= + +
∑ ∑∑∑β β β β
β β µ ε
ε α η ν
01
2
2
B.1 Empirical measure of production efficiency
We assume that there exists an unobservable function, a production frontier, representing
the maximum attainable output level for a given combination of inputs. We represent these best-
practice production technologies by a translog production function of the form e,
(5)
xcij(t) and xci
k(t) are production inputs j and k used in industry i of country c during period t. The
production inputs are capital (K) and labor (L) f. The variable t, an index of time, represents the
level of technology. µci(t) is a one-sided random variable and measures the degree of
inefficiency of industry i of country c in period t. The specification is a random-effects model
in which latent country and industry effects are specified as random variables. αc and ηi are the
random unobservable country-specific and industry-specific effects respectively, and νci(t) is the
usual white noise. The distributional assumptions on the error components are:
e Our choice of this particular functional form is dictated by its flexibility reducing the chance of inferring inefficiency when infact the problem is a poor fit to the data of a more restrictive form. Moreover, there is evidence that manufacturing production isnon-homothetic and exhibits scale economies, both of which are accommodated in the translog form.f In light of the importance of production data reliability particularly for the estimation of the stochastic frontier productionfunction, we need to ensure data quality to the extent we can. This is all the more important given the survey nature of the data.In that spirit, we implement specific data-editing rules to exclude observations that appear to be unreasonable. First, we excludeall industry-years that report zero values for measures of output and principal inputs. No manufacturing industry can be assumedto be in a steady state operation without reporting positive values for such variables. Accordingly, observations with zero valuesfor output are excluded from the analysis. Similarly, industries that report zero or negative values for value-added are alsoexcluded. Second, some countries report statistics for combination of two or more industries. While one can allocate thesevalues among the constituent industries based on some arbitrary scheme, we opted, in the interest of maintaining quality, toexclude such observations. Third, in constructing the sub-sample for estimating the production frontier, we exclude thoseindustry-years for which we have zero values or combined statistics for labor cost and or employment.
18
α ση σµ σ µν σ
α
η
µ
ν
c
i
ci ci
ci
iidN
iidN
t iid halfNormal and t
t iidN
≈≈
≈ − ≤≈
( , )
( , )
( ) ( , ), , ( )
( ) ( , )
0
0
0 0
0
2
2
2
2
)(tcit
ciePRODEFF µ−=
tPRODEFF
PRODEFF cit
∂∂ln=∆
The error components are independent among each other and independent of the X
variables in Eq. (5). We estimate the model by the method of maximum likelihood to obtain
unbiased and efficient estimates of the parameters. We then impute measures of changes in
efficiency and technological progress from the parameter estimates.
The predicted estimates of the inefficiency term ( µci(t)) are obtained from the parameter
estimates of the production function. The level of production efficiency of industry i of country
c during period t is then computed using the relationship Eq. (5) as:
(6)
PRODEFF represents the ratio of actual output to the maximum attainable output if the industry
were efficient holding the technology (i.e. the production frontier) and the level of input usage
constant. Its value ranges from 0 to 1(i.e.100% efficient). Improvements in efficiency for
industry i in country c over period (t) is then given by,
(7)
B.2 Empirical measures of economic efficiency
The efficiency estimate using the production function framework measures only technical
(production) efficiency. It does not account for the possible error of the firm in choosing an
efficiency) reflects both technical and price efficiencies and its estimation involves a reference of
an objective function that reflects both the production and market behaviour of the firm.
Employing the duality between the production function and the cost function in representing the
underlying technology, we derive estimates of X-efficiency in reference to a stochastic cost
frontierg. Duality theory suggests that under certain regularity conditions h, if producers pursue
cost minimizing objective, the production function can be uniquely represented by a dual cost
function i. We represent the underlying technology by a restricted cost function. We use a
translog functional form. After imposing homogeneity and symmetry conditions, the cost
function will have the following form:
(8)
θci(t) is a one-sided random variable denoting the degree of economic inefficiency. αc and ηi are
country specific and industry specific error components. ξci(t) is the usual disturbance term with
mean zero and standard deviation σξ . The error components and the disturbance term follow the
distributional assumptions in Eq. (5) above. ln Y is the log of output and ln K is the log of
capital stock. Also note that, with imposition of homogeneity, the input price of labor becomes a
g A cost function maps cost-minimizing points where relative prices are set to equal marginal productivities. This is a result of anoptimization problem in which the firm minimizes cost (choosing input levels) subject to the technological constraintsrepresented by the production function. Thus, a production unit on the cost frontier is both technically and allocatively efficient.The deviation of actual cost from the cost frontier, holding output level and input prices constant, would naturally measure theamount of total economic inefficiency.hTo be a valid representation of the technology, a cost function should be a non-negative, non-decreasing function of output y; anon-negative, non-decreasing concave function in input prices; and twice differentiable with respect to input prices.Furthermore, a restricted (variable) cost function should be a non-positive and convex function of quasi-fixed input quantities.i While the underlying production function merely reflects technical possibilities among inputs and outputs and nothing abouteconomic behaviour, the cost function summarizes optimizing behavior and captures all information about the underlying
20
ECONEFF t ecitci( ) ( )= − θ
ttECONEFF
tECONEFF cici ∂
∂ )(ln)( =Λ
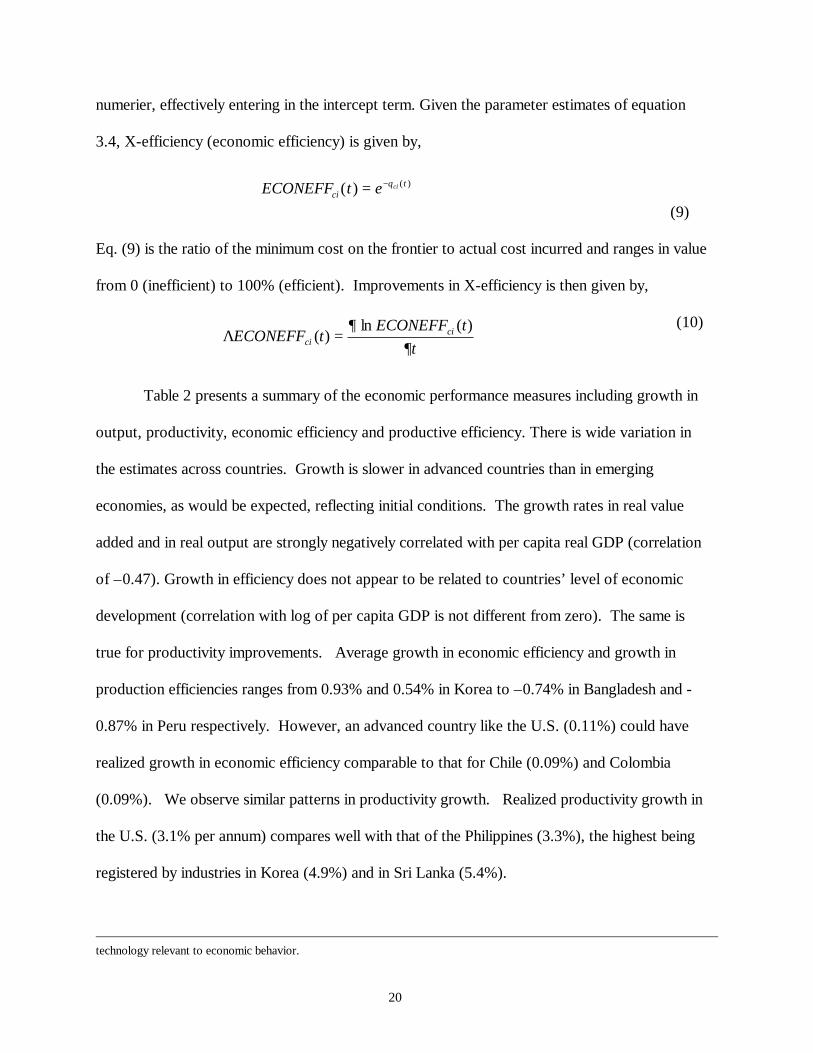
numerier, effectively entering in the intercept term. Given the parameter estimates of equation
3.4, X-efficiency (economic efficiency) is given by,
(9)
Eq. (9) is the ratio of the minimum cost on the frontier to actual cost incurred and ranges in value
from 0 (inefficient) to 100% (efficient). Improvements in X-efficiency is then given by,
(10)
Table 2 presents a summary of the economic performance measures including growth in
output, productivity, economic efficiency and productive efficiency. There is wide variation in
the estimates across countries. Growth is slower in advanced countries than in emerging
economies, as would be expected, reflecting initial conditions. The growth rates in real value
added and in real output are strongly negatively correlated with per capita real GDP (correlation
of –0.47). Growth in efficiency does not appear to be related to countries’ level of economic
development (correlation with log of per capita GDP is not different from zero). The same is
true for productivity improvements. Average growth in economic efficiency and growth in
production efficiencies ranges from 0.93% and 0.54% in Korea to –0.74% in Bangladesh and -
0.87% in Peru respectively. However, an advanced country like the U.S. (0.11%) could have
realized growth in economic efficiency comparable to that for Chile (0.09%) and Colombia
(0.09%). We observe similar patterns in productivity growth. Realized productivity growth in
the U.S. (3.1% per annum) compares well with that of the Philippines (3.3%), the highest being
registered by industries in Korea (4.9%) and in Sri Lanka (5.4%).
technology relevant to economic behavior.
21
III. Market-based governance and economic performance
Table 3 summarizes both the financial variables and the economic performance variables
for the entire sample of 3605 industry-country-years j. There are wide variations in realized
performance measures. The median industry growth rates in real value added and output are
2.6% for the entire sample. Growth in economic efficiency has a median value of 0.032%, with a
range from -21.5% to 26.8%. The median growth in production efficiency is 0.008% with a
range of –20.1% to 29.1%. The average industry contributes about 5% of the manufacturing
sectors’ total real value added or real output.
These variations in performance appear to be closely associated with variations in the
measures of capital market functions across countries. Table 4 explores the relations between the
two sets of variables further by presenting difference-of-means test of the performance measures
across sub-samples formed on the basis of rankings in finance variables. We would like to see if
variations in the performance characteristics of the sub-samples represent genuine differences in
the underlying populations or merely reflect chance variations as expected of random samplings.
From panel (a), better capital mobilization by equity markets (as measured by stock market
capitalization) is weakly related to higher economic efficiency and aggregate measures of
performance, such as growth in value added and productivity. On the other hand, more active
equity markets (as measured by turnover ratio, our proxy for governance) are strongly associated
with higher efficiency, and productivity gains as well as with higher growth in value added (see
panel (b)). Better capital mobilization by the credit sector (as measured by size of domestic
credit) is strongly related to economic efficiency and productivity growth (see panel (c)).
j The figures for the financial variables in Table 2 are different from those reported in Table 1. The mean values reported inTable 1 are cross-country averages of country means. The mean values in Table 2 are averages over the entire panel.
22
GV F Zcitk
ctk
ct citk= + +∑ β γ ε
ε α η λ ν
α ση σλ σν σ
α
η
λ
ν
cit c i t cit
c
i
t
cit
where
IID
IID
IID and
IID
= + + +
≈≈≈≈
,
( , ),
( , ),
( , ),
( , ).
0
0
0
0
2
2
2
2
A. Governance and aggregate measures of performance
We begin our analysis of the relationship between financial markets and economic
performance, by examining in detail the link between capital market functions and aggregate
measures of industry performance. This would facilitate a comparison with the extant literature.
We use growth rate in real value added, and productivity growth as measures of how well off an
industry is. Our empirical model is a four-way error component (random effects) of the
following form:
(11)
∑ ++=k citct
kct
kcit ZFPG εγβ (12)
where, GVcit and PGcit are, respectively, annual compounded growth rate of real value- added
and growth in total factor productivity of industry i in country c over period t. c=1,… ,C;
i=1,… ,Ic ; and, t=1,… ,Tci. Fct k is the kth financial function indicator variable for country c in
period t. The financial function variables include: stock market capitalization to GDP ratio,
stock market turnover ratio, domestic credit to GDP ratio, and private credit to GDP ratio. The
control variable Zcit represents the relative significance of industry i in country c during period t.
We use the share of value added (output) of the industry in the total value added (output) of the
manufacturing sector of the country. The model is a four-way error-component (random effects)
specification with the following error structure:
23
αc, ηi, λt and νcit are independent from each other and also independent of the F and Z variables
in Eqs. (11) and (12) above. αc is unobservable time and industry invariant, country specific
effects; ηi is unobservable country and time invariant, industry effects; λt represents
unobservable country and industry invariant, time effects; and, νcit is a random disturbance term
Hence, we control for country, industry and time heterogeneity, thereby avoiding the risk
of bias in our estimates k l. Moreover, we treat these latent country, industry and time effects as
random variables rather than fixed parameters. Our random-effects specification has both
theoretical and empirical appeal for the research question we are addressing. First, the random
effects specification allows us to retain as much information on our main variables of interest,
the vector of finance variables, which are industry invariant but country specific variables. A
fixed-effects specification would result in loss of valuable information on such variables through
differencing. Second, the specification allows us to model correlations among observations that
share identical characteristics. Declaring country as a random effect, for example, allows
common correlations among observations that come from the same country. Such a structure is
reasonable in that industries in the same country, despite their differences, share the effects of
common country characteristics such as those of macro economic policies of the country.
Similarly, common characteristics of the technology of an industry across countries would justify
modeling intra-industry correlations.
k The model rests on the premise that a sensible representation of relationships among variables of interest across diversecountries, industries and time-periods cannot explicitly capture all important variables. These variables could be simply toomany to be included, since some may be un-measurable and others unobservable.l Variations in economic performance including efficiency gains are not exclusively attributable to variations in capital marketfunctions, and could be a result of non-finance factors such as the degree of competition in the industry. Ideally, one wouldcontrol for sources of variations through listing each potential variable in the empirical model. However, sources of variationsare numerous, vary from country to country as well as from industry to industry, and are generally difficult to exhaustivelyincorporate in a model. We adequately control for these extra sources of variations through the random country, industry andtime effects. For example, to the extent that industry competitiveness is a country characteristic, it would be reasonably reflectedas country effect. The competitiveness or lack of it of an industry, in some cases, could be a generic industrial characteristic,
24
Conceptually, the individual and time effects are meant to be related to a large number of
non-observable random causes. This intention is consistent with the random-effects
specification. Lastly, modeling the latent variables as random allows us to make inference about
the relationships of interest that would apply to the entire population from which the sample is
drawn rather than to the particular sample, which is the case in fixed-effects models. We estimate
the model by the method of maximum likelihood (ML) under the distributional assumption of
normality for the error components and the residual. The ML estimates are consistent and
asymptotically efficient, and have a known asymptotic sampling information matrix m.
A.1 Governance and industry growth in output
Table 5 presents estimates of the empirical model regressing industry’s growth in real
value added on proxies for the governance and allocation functions of financial markets. Panel
A uses growth in real value added, and Panel B shows growth in gross output as a measure of
aggregate performance. In all models, we control for unobservable country, industry and time
effects through random-effects specification n. The results indicate a very strong relationship
between the degree to which capital markets perform their governance functions and industry
aggregate performance. The coefficient estimates of market turnover ratio (our proxy for the
governance function) is positive (0.0570) and statistically significant at 1% level. Moreover, the
contributions of these services to industries’ growth in real value added based on our estimates
which would be reflected in the industry effect. (See also footnote 16).mAlternative estimation methods that include ANOVA type, ML, restricted maximum likelihood (REML), and MinimumQuadratic Unbiased Estimation (MINQUE) vary in the way the variances of the error components are estimated. SimpleANOVA type estimates no longer apply for unbalanced panel with three error-components. We use REML, a procedure inwhich variance components are estimated based on the portion of the likelihood function that depends on the error componentsalone. In a balanced data, the REML estimators of the variance components are identical to ANOVA estimators, which haveoptimal minimum variance properties. The results do not change when we estimate the models by ML, and by MINQUEprocedures.n For robustness, we also estimate the models in this section and the sections that follow as fixed effects specifications. Theresults are qualitatively similar to the ones under the error-components specification.
25
are economically very significant. For example, using the coefficient estimates, a one standard
deviation increase in the proxy for the governance function, the market turnover ratio (0.294)
would increase the growth rate in real value added of the average industry by about 1.68% per
annum.
While stock market size is not significant, the size of the credit market (our proxy for the
allocation function of credit markets) is positive (0.0706) and statistically significant.
Furthermore, a dollar of credit that is channeled through the public sector is different from that
channeled through the private sector: the former has no significant impact on industry growth,
while the latter is positively associated with growth. A one standard deviation increase in the
size of domestic credit, would increase the growth rate in real value added of the average
industry by 2.32% per annum, the same order of magnitude as the estimates of the effect of bank
development on per capita GDP (2.52%) in Levine(1998). Note, however, that a one standard
deviation (0.329) increase is approximately the difference in size of domestic credit between
India and the United States.
Industries that account for a larger portion of the country’s manufacturing have higher
growth rates. This may be a reflection of the effects of other sources of comparative advantage
(i.e. other than financial development). Developed countries have lower growth rates in
manufacturing (the coefficient of log per capita GDP (not reported) is significantly negative)
reflecting the convergence effecto. With respect to the latent variables, overall, the country,
industry and time effects are significant in explaining variations in industry growth.
Unobservable country factors appear to be relatively more important than the others. Country,
industry and time effects account for about 10% of the total unexplained variations in industry
o The results here and in the sections to follow are not sensitive to inclusion or exclusion of these variables.
26
growth, out of which country-specific (but industry and time invariant) factors account for more
than 50%.
In Panel B of Table 5, use of real gross output does not alter the results. The governance
function proxy (market turnover ratio) is positive and significant. The sizes of domestic credit
and private credit appear with positive sign and both are statistically significant at 1%.
A.2 Governance and productivity growth
Table 6 presents the relations between productivity growth, which is an amalgam of
technical change and efficiency gains, and the governance function. Models I through V
represent each variable’s relations with productivity growth individually. Models VI through
VIII examine the marginal impact of each of the variables on productivity controlling for at
least one of the other variables. Stock market turnover ratio (the governance function proxy)
positively impacts productivity growth with a statistical significance at 1%. On the other hand,
stock market capitalization is not significantly related to growth in productivity. The measure of
the size of the domestic credit sector is positively and significantly related to growth in
productivity. Including the proxies in combination (models VI through XIII), stock market
turnover ratio carries a strong positive coefficient (significant at 1%). Thus, even after
controlling for other aspects of the financial system, increases in the information production and
monitoring function of the stock market (using market activity as a proxy), are strongly
associated with improvements in productivity.
How large is the productivity impact of capital markets? The productivity consequences
of the information and monitoring role of markets are economically significant. To illustrate,
consider Mexico which has an average turnover of 0.5394 (Table 1) and a productivity growth of
27
∆PRODEFF F Zcitk
ctk
cit citk= + + +∑β β γ ε0
∆ECONEFF F Zcitk
ctk
citk cit= + + +∑β β γ ε0
0.9% (Table 2) over the sample period. Using our estimates, if Mexico were able to increase
market activity by a mere 10% of the present level, it would increase the rate of productivity
growth of the average industry to about 0.12% per annum.
IV. Governance and economic performance: The efficiency channel
Productivity growth is an amalgam of effects of technological innovations and
improvements in efficiency. This section explores in detail the impact of capital market
functions on efficiency. Our hypothesis is that financial markets through their information
aggregation and monitoring function induce economic efficiency within the firm. We use a four-
way error components (random effects) model of the following form:
(13)
(14)
where ∆PRODEFF is improvements in technical efficiency of industry i of country c in period t;
and, ∆ECONEFF is improvements in X-efficiency (economic efficiency) of industry i of country
c in period t. c=1,… ,C; i=1,… , Ic ; and, t=1,… ,Tci. Fct k is the kth financial development
indicator variable for country c in period t. The model is a four way random-effects model with
random country, industry, time effects as specified in Eqs. (11) and (12) above.
A. Governance and efficiency
Table 7 presents estimates of our empirical model regressing growth in industry’s
economic efficiency on proxies for the governance and allocation functions of financial markets.
Models I through V, includes each proxy separately. In the models VI through XIII, we include
28
combinations of the explanatory variables so as to evaluate the marginal contributions of the
variables of interest. In all models, we control for unobservable country, industry and time
effects, treating them as random variables. In addition, we include industry’s share in total
manufacturing of the country to control for characteristics common to both country and industry,
and average real per capita GDP. The former is meant to control for comparative advantage
differences across industries vis a vis countries p. The latter would control for the familiar
convergence effect from growth literature (or control for countries’ stage of economic
development). We expect the proxies for the governance function (market turnover ratio) to
enter the model with positive sign.
The results in Table 7 indicate a very strong association between the degree to which
capital markets perform their governance functions and improvements in industry economic
efficiency. In model I, the governance proxy (market turnover ratio) enters positively
(coefficient 0.0061), and is significantly different from zero at the level of 1%. The relationship
between stock market capitalization and efficiency, while positive, lacks statistical significance,
as does the relationship between size of domestic credit and efficiency. The latter is true for
credit channeled through the private sector as well as credit channeled through the public sector.
Interestingly, the coefficient on public sector credit is negative though statistically insignificant.
Higher turnover ratio is also strongly associated with larger efficiency improvements on
p It could be that an industry’s performance (in fact, its presence or absence in a country) may reflect comparative advantages ofthe country, other than financial development, in fostering a specific type of industrial activity. These may include advantagesrelated to natural endowments, better business environment in terms of less restrictive regulations, competition, trade etc.Sources of comparative advantages are numerous, vary from country to country as well as from industry to industry, and aregenerally difficult to exhaustively incorporate in a model. Omission of such variables would be of concern only to the extent thatthey could be correlated with our financial variables for which we do not have a priori reasons to suspect so. However, asstrength to our specification, we can adequately control for these variations. First, limiting our sample to only manufacturing (forexample, avoiding mining industries) eliminates natural resource endowment as a source of comparative advantage. Second, allunobservable industry and time invariant sources of comparative advantages are captured by the random country effect. Evenwithin the manufacturing sector, a country’s comparative advantage may not benefit all industries identically, however. Ourindex of the importance of an industry in a country’s manufacturing, inter alia, is meant to capture this type of variations incomparative advantages (industry-variant comparative advantages). The inclusion of such variables is made possible because ofthe random-effects specification.
29
the margin after controlling for the other financial proxies. In model VI, we include stock market
size in addition to turnover ratio, in order to gauge the marginal value of the information and
monitoring role of stock markets after controlling for its capital provision role. The coefficient
estimate of market turnover ratio is positive (0.0057) and significant at 1% level. Stock market
capitalization is not statistically different from zero. Similarly, in Models VIII and X, we include
alternatively domestic credit and credit to the private sector – proxies for capital mobilization
provided by the credit sector - in addition to stock market turnover ratio. Again, turnover is
positive (0.0063 and 0.0062) and significant at 1%. The coefficients on the other variables fall
sharply and remain statistically insignificant.
Finally, in model XII which include domestic credit in models that contain turnover and
stock market capitalization. The governance proxy is robustly positive (0.0060, significant at
1%); and none of the other variables are marginally significant. The same result holds when we
use size of private credit as proxy for the credit sector’s capital provision role in model XIII:
turnover has a coefficient of 0.0057 and is significant. Thus, even after controlling for the
capital provision services of both stock markets and the credit sector of the economy, our proxy
for the information and monitoring function of markets adds net value to efficiency growth.
Turning to the other variables, industries that account for a larger portion of the country’s
manufacturing have higher efficiency. This may be a reflection of the effects of other sources of
comparative advantage (i.e. other than financial development) on industry efficiency. Consistent
with the descriptive data, per capita GDP has no effect on variation in efficiency. With respect
to the latent variables, the estimates of the error components indicate that time effects are more
important than country or industry specific effects in explaining efficiency.
The evidence so far is consistent with the hypothesis that the information aggregation and
30
monitoring function of markets determines the relative efficiency with which firms utilize
resources. Increases in our proxy for the information and monitoring role increases industry
efficiency after controlling for unobservable country, industry and time effects and other services
provided by the financial sector. The contributions of these services to industry economic
efficiency based on our estimates are economically very significant. For example, using the
coefficient estimates in model I, a one standard deviation increase in the proxy for the
governance function, the market turnover ratio (0.294) would increase the growth rate in
economic efficiency of the average industry by about 0.18% per annum. Accumulating over the
15 years of the sample period, the average industry would have been about 3% more efficient in
1995, the end of the study period, compared to the actual fifteen years median of 0.032 percent.
The results based on growth in production efficiency, our alternative measure of
efficiency, are presented in Table 8. In the individual regressions, turnover ratio again has a
relatively large and positive effect on production efficiency (0.004 and significant at 1%). Stock
market capitalization has no effect on production efficiency. On the other hand, the coefficients
for domestic credit and credit to private sector are positive and significant in the individual
regressions; but these results loses significance and the coefficients fall sharply once turnover is
controlled for. Again, interestingly, credit channeled through the public sector enters with
negative sign although not statistically significant. The results from model versions VI to XIII
are closely similar to the results on economic efficiency in Table 7.
B. Accounting disclosure and efficiency
An alternative way to measure the degree of information flow in a capital market is to
look at the accounting standards that determine the amount and quality of disclosure by firms
trading in the market. We have an index of accounting reporting quality for different countries
31
created by the Center for International Financial Analysis and Research. The index rates the
procedures, data on share of stock and general information about the firm) of at least three
companies in each country based on the inclusion or omission of 90 reportable items. The
sample of companies used in each country is designed to represent a cross-section of
representative industries. The index could be viewed as a measure of the degree of sophistication
and efficiency of the capital market in processing information. Also, more disclosure as
measured by the index, indicates the availability of public information that might be associated
with some of the governance functions of markets we intend to measure. Among others,
accounting information is used for market-based incentive contracts. The index ideally ranges
between 0 to 90, the higher score indicating more mandated public disclosure. For our sample
(we have the index only for 31 countries), the range goes from 24 to 83, the lowest registered by
Egypt and the highest by Sweden. The United States scores 71 on this index. More developed
countries, on average, have higher accounting standards (correlation with log per capita GDP is
0.56); yet, there are exceptions. The U.S. (score, 71), Norway (74) and Canada (74), Australia
(75), score less than that of Malaysia (78); whereas Philippines (65), Mexico (60) and Korea (62)
score as high as Italy (65), Japan (62) and Germany (62).
We use this index, instead of market turnover rat io, as our proxy for the information
production and monitoring function of capital markets. Table 9 presents the results. In Panel (a)
and Panel (b), the dependent variables are our two measures of efficiency. In model version I,
we include the index of accounting quality as a measure of the governance function. In models
II to VI, we include accounting standard with our measures of the capital mobilization (stock
market capitalization, domestic credit and credit to private sector) one at time so as to gauge the
32
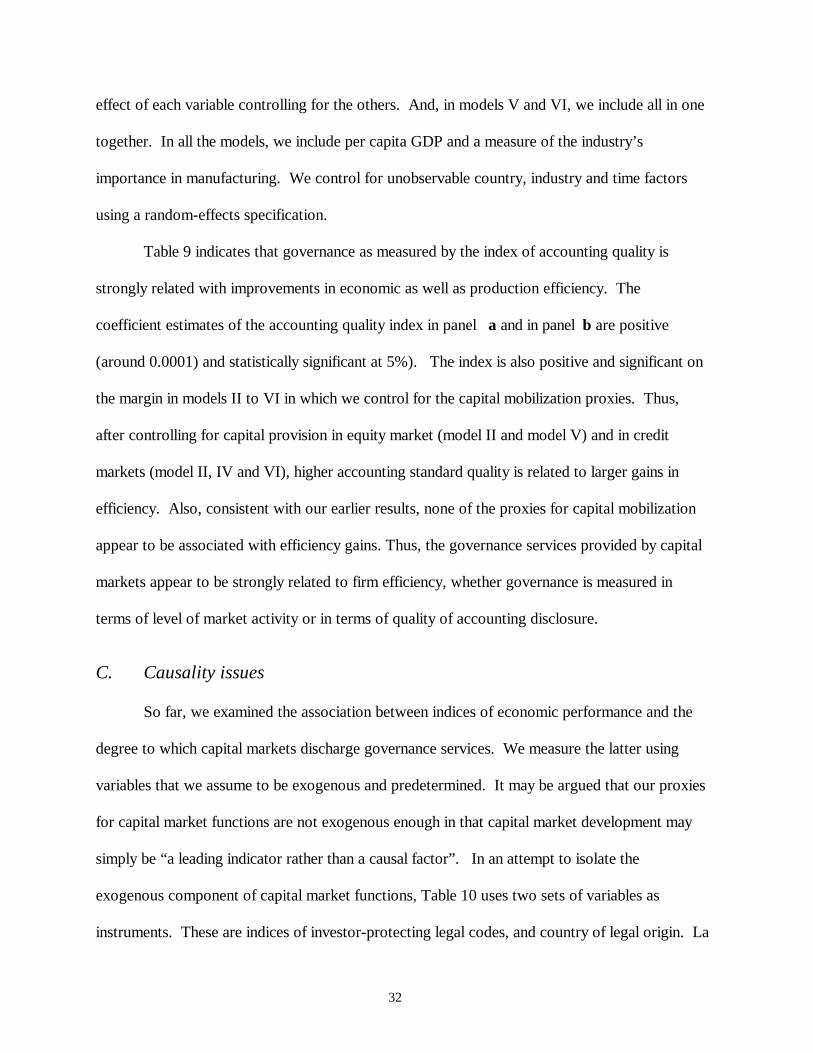
effect of each variable controlling for the others. And, in models V and VI, we include all in one
together. In all the models, we include per capita GDP and a measure of the industry’s
importance in manufacturing. We control for unobservable country, industry and time factors
using a random-effects specification.
Table 9 indicates that governance as measured by the index of accounting quality is
strongly related with improvements in economic as well as production efficiency. The
coefficient estimates of the accounting quality index in panel a and in panel b are positive
(around 0.0001) and statistically significant at 5%). The index is also positive and significant on
the margin in models II to VI in which we control for the capital mobilization proxies. Thus,
after controlling for capital provision in equity market (model II and model V) and in credit
markets (model II, IV and VI), higher accounting standard quality is related to larger gains in
efficiency. Also, consistent with our earlier results, none of the proxies for capital mobilization
appear to be associated with efficiency gains. Thus, the governance services provided by capital
markets appear to be strongly related to firm efficiency, whether governance is measured in
terms of level of market activity or in terms of quality of accounting disclosure.
C. Causality issues
So far, we examined the association between indices of economic performance and the
degree to which capital markets discharge governance services. We measure the latter using
variables that we assume to be exogenous and predetermined. It may be argued that our proxies
for capital market functions are not exogenous enough in that capital market development may
simply be “a leading indicator rather than a causal factor”. In an attempt to isolate the
exogenous component of capital market functions, Table 10 uses two sets of variables as
instruments. These are indices of investor-protecting legal codes, and country of legal origin. La
33
Porta et al (1997) argues that legal protections afforded to investors and country’s legal origin
determine financial development, and that these, in turn, are primarily determined by a country’s
colonial history. Hence, the two sets of variables would be ideal instruments for capital market
functions in that while the variables are strongly correlated with our governance proxy, they do
not directly correlate with economic performance. Levine and Zervos (1998) use these variables
as instruments for financial development.
In Model I of Table 10, the component of turnover ratio predetermined by the extent of
legal protection afforded to investors has a positive, statistically large impact on growth in
economic efficiency (Panel A), and on growth in production efficiency (Panel B). The
exogenous component of the governance proxy is robustly positively related to growth in
economic and production efficiency on the margin after controlling for stock market
capitalization, and the size of the credit sector. In Model II, the component of the governance
proxy predetermined by legal origin has a significant positive impact on growth in economic
efficiency (Panel A), and on growth in production efficiency (Panel B). Hence, the relations
between governance and efficiency identified in this study are less likely to be explained by
endogeneity.
V. Conclusion
This study examines the causal relationship between capital market functions and firms’
real economic performance focusing on the information production and monitoring role of
markets. We begin from a premise that financial markets and institutions play two critical roles
in an economy: allocation of risk capital through saving mobilization and risk-pooling and
sharing; and promotion of responsible governance and control through providing outside
investors a variety of mechanisms for monitoring inside decision makers. The paper argues that
34
the two functions systematically impact on different sources of growth. Focusing on the
governance role of the financial system, we argue and empirically show that the information
production and monitoring services contribute to improvements in the relative economic
efficiency with which the firm utilizes its resources.
Using industry level data for ten manufacturing industries across thirty-eight countries
over the period 1980-1995, we find evidence consistent with our hypotheses. We find that
measures of the governance functions of capital markets are indeed positively related to
economic efficiency. The result holds both when the variables are treated individually as well as
in models where they enter in combination. Moreover, controlling for governance, measures of
the capital mobilization function have little role in explaining variations in industry efficiency.
The evidence is robust to outlier and influential observations, alternative model specifications
and choice of variables.
The evidence underscores the role of the equity market as a conduit of socially valuable
governance services as distinct from capital provision. The value of this socially desirable
service is economically large. An industry operating in a country with a stock market that is one
standard deviation above the mean of the proxy for information and monitoring function would
have a growth rate of 1.05 percent per annum in real output more than that for the average
industry. Cumulating over the sample period of fifteen years, real output for such industry
would have been about 17 percent higher in 1995, the end of the study period.
The finding of a strong association between economic performance and the effectiveness
of financial markets suggests the importance of financial development as a policy for
accelerating economic growth. It provides evidence that financial sector policies that promote
financial market’s functional capacities lead to better real economic performance. It points out
35
the incompleteness of traditional development strategies that exclusively focus on real-sector
reforms to induce economic development.
Furthermore, through linking the multiple functions of the financial system to sources of
economic performance, the study underscores the importance of a functional perspective in
guiding financial sector policies. The study documents that the different functions of the
financial system play distinct roles in the economic growth process. In particular, the
information and monitoring function promotes economic efficiency. The depth of the financial
infrastructure of an economy has to be judged in terms of the effectiveness and efficiency with
which it delivers these multiple functions. A mere launching of financial markets and
institutions is not sufficient for accelerating growth; what also matters is their efficient
functioning.
The prevailing policy discussions of financial markets and institutions, particularly in
developing countries, have focused on their role in mobilizing savings for industrialization.
Such emphasis on the capital provision role was inevitable given the dominant economic
thinking on the subject, the McKinnon-Shaw (see, McKinnon, 1973; and Shaw, 1973) paradigm,
which views the financial system as a mere conduit of capital provision. In this study, based on a
corporate-finance paradigm, we attempt to point out the shortcoming of such a policy perspective
by providing evidence that the value of financial markets lies in their governance services that
are distinct from capital mobilization.
36
ReferencesAigner, D., Lovell, C., Schmidt, P., 1977. Formulation and estimation of stochastic frontierproduction function models. Journal of Econometrics 6, 21-37.
Allen, F., 1993. Stock markets and resource allocation. In: Mayer, C., Vives, X. (eds.), CapitalMarkets and Financial Intermediation, Cambridge University Press.
Barnea, A., Haugen, R., Senbet, L., 1985. Agency Problems and Financial Contracting,Englewood Cliffs, NJ: Prentice-Hall, Inc.
Bhide, A., 1993. The hidden cost of stock market liquidity. Journal of Financial Economics 34,31-51.
Bresnahan, T., Milgrom P. and Paul J., 1992. The real output of stock exchange. In: Griliches,Z. (ed.), Output Measurement in the Service Sectors, Chicago, IL: University of Chicago Press.
Diamond, D., 1984. Financial intermediation and delegated monitoring. Review of EconomicStudies 51, 393-414.
Diamond, D., Verrecchia, R., 1981. Information aggregation in a noisy rational expectationsmodel. Journal of Financial Economics 9, 221-35.
Demirguc-Kunt, A., Maksimovic, V., 1998. Law, finance and firm growth. Journal of Finance53, 2107-37.
Dow, J., Gorton, G., 1997. Stock market efficiency and economic efficiency: Is there aconnection? Journal of Finance 52, 1087-1129.
Farrell, M., 1957. The Measurement of productive efficiency. Journal of Royal StatisticalSociety 120, 253-82.
Grossman, S., 1976. On the efficiency of competitive stock markets where traders have diverseinformation. Journal of Finance 31, 573-85.
Grossman, S., Stiglitz, J., 1980. On the impossibility of informationally efficient markets.American Economic Review 70, 393-408.
Jensen, M., Meckling W., 1976. Theory of the firm: managerial behavior, agency costs andownership structure. Journal of Financial Economics 3, 305-360.
Kyle, A., 1984. Market structure, information, futures markets, and price formation. In: Storey,
37
G., Schmitz, A., Sarris, H. (eds), International Agricultural Trade: Advanced Readings in PriceFormation, Market Structure, and Price Instability, Boulder, Colorado: Westview.
Kihlstrom, R., Matthews S., 1990. Managerial incentives in an entrepreneurial stock-marketmodel. Journal of Financial Intermediation 1, 57-79.
La Porta, R., Lopez-de-Silanes, F., Shleifer A., Vishny R., 1997. The legal determinants ofexternal finance. Journal of Finance 52, 1131-50.
La Porta, R., Lopez-de-Silanes, F., Shleifer A., Vishny R., 1998. Law and finance. Journal ofPolitical Economy 106, 1113-55.
Liebenstein, H., 1966. Allocative efficiency vs ‘x-efficiency’. American Economic Review 56,392-415.
Leland, H., Pyle, P., 1977. Informational asymmetries, financial structure and financialintermediation . Journal of Finance 32, 371-387.
Levine, R., 1998. The legal environment, banks, and long-run economic growth. Journal ofMoney, Credit and Banking 30.
Levine, R., Zervos S., 1998. Stock markets, banks, and economic growth. American EconomicReview 88, 537-559.
Maug, E., 1998. Large shareholders as monitors: Is there a tradeoff between liquidity andcontrol. Journal of Finance 53, 65-98.
McKinnon, R., 1973. Money and Capital in Economic Development. Washington, D.C.:Brookings Institute.
Rajan, R., Zingales, L., 1998. Financial dependence and growth. American Economic Review88, 559-587.
Shaw, E., 1973. Financial Deepening in Economic Development. New York, NY: OxfordUniversity Press.
Sharfstein, D., 1988. The disciplinary role of takeovers. Review of Economic Studies 55, 185-99.
Shleifer, A., Vishny, R., 1997. A survey of corporate governance. Journal of Finance 52, 737-783.
Stein, J., 1988. Takeover threats and managerial myopia. Journal of Political Economy 96, 61-80.
Titman, S., Subrahmanyam, A., 1999. The going-public decision and the development offinancial markets. Journal of Finance 54, 1045-82.
38
Table 1: Financial Function Proxy Variables: Averages over the period 1980-1995.
Market Capitalization to GDP is total market value of publicly traded equity at end of year as reported by IFC divided by the Gross Domestic Product ofthat year. Total Value Traded to GDP is the total value of publicly traded equity during the year divided by GDP of that year. The level of domesticcredit is the sum of assets held by the monetary authority and depository institutions excluding inter-bank deposits (i.e. IFS lines 32a-32f excluding 32e)divided by GDP. The ratio of private credit to domestic credit is the proportion of claims against the private sector (IFS line 32d) to total domesticcapital. Data on equity market capitalization and total equity value traded is obtained from various issues of the Emerging Market Fact-book publishedby IFC. GDP, domestic credit, private credit and exchange rates are obtained from the International Financial Statistics (IFS) issued by the IMF.
Countries Stock MarketCapitalization/GDP
Turnover Ratio Domestic Credit/GDP PrivateCredit/Domestic Credit
Industry growth in real value added is the annual compounded growth rate in real value added for each of the tenindustries in each of the forty-three countries over the period 1980 to 1995. Gross output includes values of intermediateinputs in addition to value added. The industry’s share in total value added (output) are computed by dividing the realvalue added (gross output) of the industry by the total real value added (gross output) of the manufacturing sector in thecountry in each year. Productivity and efficiency are computed based on parameter estimates of cross-country stochasticproduction and cost frontiers on the panel of industry production and cost data. Production efficiency is a Farrell (1957)output related measure of efficiency which measures the degree to which an industry diverges from the efficientproduction frontier. Economic efficiency measures the degree to which an industry diverges from the best practice costfrontier. Market Capitalization to GDP is total market value of publicly traded equity at end of year as reported by IFCdivided by the Gross Domestic Product of that year. Market Turnover Ratio is the total value of publicly traded equityduring the year divided by Market Capitalization. The level of domestic credit is the sum of assets held by the monetaryauthority and depository institutions excluding inter-bank deposits (i.e. IFS lines 32a-32f excluding 32e) divided by GDP.Domestic credit to GDP is domestic credit divided by GDP. Private credit to GDP is claims against the private sector(IFS line 32d) divided by GDP. Data on equity market capitalization and total equity value traded is obtained from variousissues of the Emerging Market Fact-book published by IFC. GDP, domestic credit, private credit and exchange rates areobtained from the International Financial Statistics (IFS) issued by the IMF.
Variable Mean Median Std Dev Minimum Maximum No. Obs.
Industry Growth in Real Value Added 0.027 0.026 0.205 -0.976 0.960 3301Industry Growth in Real Gross Output 0.027 0.024 0.175 -0.969 0.994 3301Productivity Growth 0.015 0.016 0.180 -1.076 0.950 3272Growth in Economic Efficiency -0.0001 0.00032 0.026 -0.215 0.268 3261Growth in Production Efficiency 0.00035 0.00008 0.022 -0.201 0.291 3272Production Inefficiency 0.384 0.364 0.075 0.226 0.816 3577Economic Inefficiency 0.473 0.434 0.117 0.261 0.999 3569Industry's Share of Total Value Added 0.047 0.031 0.044 0.001 0.326 3508Industry's Share of Total Gross Output 0.049 0.028 0.054 0.001 0.339 3508Stock Market Capitalization to GDP 0.272 0.140 0.345 0.001 3.5 3203Market Turnover Ratio 0.282 0.210 0.294 0.005 2.000 3420Domestic Credit to GDP 0.668 0.640 0.329 0.078 2.300 3558Credit to Private Sector to GDP 0.476 0.440 0.279 0.021 1.760 3558Log of Per Capita Income 8.477 9.344 1.527 5.234 10.179 38
42
Table 4: Inter-Quartile Mean Differences In Industry PerformanceSample is classified into quartiles based on stock market capitalization, turnover ratio, domestic credit, credit toprivate sector and average per capita GDP respectively over the period 1980-1995. Turnover Ratio is the value oftotal shares of stock traded divided by market capitalization. Stock Market Capitalization is the ratio of the totalmarket value of publicly traded equity to GDP. Domestic Credit is the sum of assets held by the monetary authorityand depository institutions excluding inter-bank transfer divided by GDP. Credit to Private Sector equals claimsagainst the private sector divided by GDP.
K-Sample Tests Bottom 25% vs Top 25%Variables
Bottom Middle Top 25% 50% 25% Kruskal-
WallisTest
MedianTest
WilcoxonTest
T test
Panel a: Ranking by Stock MarketCapitalization
0.0237
0.0307
-0.0006
-0.0030
0.0096
0.0282
0.0257
0.001
0.0013
0.0209
0.0334
0.0303
-0.00006
0.0004
0.0141
Panel b: Ranking by Market TurnoverRatio
0.0240
0.0330
-0.0002
-0.0025
0.0073
0.0176
0.0150
0.0002
0.0001
0.0128
0.0468
0.0443
0.0013
0.0020
0.0268
Panel c: Ranking by Domestic Credit toGDP
Growth in Value Added
Growth in Gross Output
Growth in ProductionEfficiencyGrowth in EconomicEfficiency
Growth in Productivity
Growth in Value Added
Growth in Gross Output
Growth in ProductionEfficiencyGrowth in EconomicEfficiency
Growth in Productivity
Growth in Value Added
Growth in Gross Output
Growth in ProductionEfficiencyGrowth in EconomicEfficiency
Growth in Productivity
0.0268
0.0254
-0.0003
-0.0021
0.0085
0.0287
0.0287
0.0007
0.0009
0.0151
0.0315
0.0313
0.0009
0.0002
0.0256
9.46b
11.3a
4.32
10.5b
5.76
36.9a
34.8a
11.89a
24.11a
18.04a
3.34
7.20c
4.31
13.4a
8.55b
5.44
8.88b
0.67
6.04
2.73
38.9a
40.2a
6.04
16.03a
14.65a
6.86c
13.4a
7.43c
13.6a
5.11
-1.85c
-0.29
-1.05
-2.54b
-1.62
-3.48a
1.87c
-2.81a
-4.21a
-3.77a
-0.24
0.41
-1.21
-2.57a
-2.82a
-0.89
0.05
-0.43
-2.28b
-0.46
-2.28b
-1.42
-1.37
-3.17a
-2.12b
-0.41
-0.64
-1.05
-1.59
-1.67c
a Significant at 1%; b Significant at 5%; c Significant at 10%
43
Table 4 (Cont’d): Inter-Quartile Mean Differences In IndustryPerformance
Sample is classified into quartiles based on stock market capitalization, turnover ratio, domestic credit, credit toprivate sector and average per capita GDP respectively over the period 1980-1995. Turnover Ratio is the value oftotal shares of stock traded divided by market capitalization. Stock Market Capitalization is the ratio of the totalmarket value of publicly traded equity to GDP. Domestic Credit is the sum of assets held by the monetary authorityand depository institutions excluding inter-bank transfer divided by GDP. Credit to Private Sector equals claimsagainst the private sector divided by GDP.
K-Sample TestBottom 25% vs Top
25%Variables Bottom Middle Top
25% 50% 25% Kruskal-Wallis Test
MedianTest
WilcoxonTest
T test
Panel d: Ranking by Credit to PrivateCredit to GDP
0.0396
0.0376
0.0013
-0.0008
0.0166
0.0240
0.0249
0.0002
0.0004
0.0155
0.0261
0.0260
0.0003
-0.0001
0.0164
Panel e: Ranking by average per capitaGDP
Growth in Value Added
Growth in Gross Output
Growth in ProductionEfficiency
Growth in EconomicEfficiency
Growth in Productivity
Growth in Value Added
Growth in Gross Output
Growth in ProductionEfficiency
Growth in EconomicEfficiency
Growth in Productivity
0.0427
0.0416
0.0008
-0.0015
0.0086
0.0230
0.0253
0.0002
0.0002
0.0131
0.0209
0.0159
0.0002
0.0007
0.0232
37.9a
27.01a
24.7a
31.27a
19.67a
26.7a
46.76a
6.43c
10.36b
15.23a
34.56a
20.04a
30.67a
28.59a
23.4a
31.3a
51.8a
7.84c
8.68b
7.22c
2.40b
2.72a
1.14
0.11
-0.46
2.89a
4.77a
-1.04
-2.22b
-3.23a
1.19
1.19
0.80
-0.53
0.02
2.05b
2.97a
0.52
-1.40
-1.51
a Significant at 1%; b Significant at 5% ; c Significant at 10%
44
Table 5 : Aggregate Performance and Capital Market FunctionsThe parameter estimates are maximum likelihood estimates of four-way error component models containing random country, industry and time effects. Thedependent variables are the annual compound growth rate in the real value added and the annual compound growth rate in the real gross output for each of theten industries over thirty-eight countries for the period 1980-1995. Turnover Ratio is the value of total shares of stocks traded divided by market capitalization.Stock Market Capitalization is the ratio of the total market value of publicly traded equity to GDP. Domestic Credit is the sum of assets held by the monetaryauthority and depository institutions excluding inter-bank transfer divided by GDP. Credit to Private Sector equals claims against the private sector divided byGDP. The variable Interaction represents the product of the two other variables in the respective model. Industry Share in Manufacturing is calculated bydividing the real output of the industry in the country by the total real output of the manufacturing sector of the country. Coefficients of the intercept are notreported. Asymptotic standard errors are given in parenthesis.DependentVariable
Panel A
Growth in Real Value AddedPanel B
Growth in Real Gross Output
IndependentVariables
I II III IV V I II III IV V
TurnoverRatio
0.0570a
(0.015)0.0358a
(0.012)
Stock MarketCapitalization
0.0161(0.016)
0.0100(0.013)
DomesticCredit
0.0706a
(0.021)0.0854a
(0.018)
Credit to PrivateSector
0.0940a
(0.024)0.1049a
(0.021)
Credit to PublicSector
0.0089(0.033)
0.0019(0.029)
Industry’Share inManufacturing
0.6178a
(0.097)0.6008a
(0.098)0.6159a
(0.102)0.6187a
(0.102)0.611a
(0.102)0.3830a
(0.081)0.3718a
(0.080)0.4085a
(0.087)0.4106a
(0.087)0.4031a
(0.087)
Error Componentsσα
2
ση2
σλ2
σν2
0.0018a
0.0007c
0.0008b
0.0307a
0.0013a
0.0007c
0.0009b
0.0317a
0.0020a
0.0006c
0.0009b
0.0365a
0.0015a
0.0006c
0.0009b
0.0366a
0.0020a
0.0006c
0.0009b
0.0366a
0.0014a
0.0005c
0.0006b
0.0215a
0.0011a
0.0004c
0.0007b
0.0213a
0.0019a
0.0004c
0.0005b
0.0263a
0.0015a
0.0004c
0.0006b
0.0263a
0.0019a
0.0004c
0.0006b
0.0265a
a Significant at 1%; b Significant at 5%; c Significant at 10%
45
Table 6: Productivity Growth and Capital Market FunctionsThe parameter estimates are maximum likelihood estimates of four-way error component models containing random country, industry and time effects. Thedependent variable is the annual growth in total factor productivity for each of the ten industries over thirty-eight countries for the period 1980-1995. Economicefficiency is in terms of deviation of actual cost to the optimal minimum cost on a stochastic cost frontier. Turnover Ratio is the value of total shares of stockstraded divided by market capitalization. Stock Market Capitalization is the ratio of the total market value of publicly traded equity to GDP. Domestic Credit isthe sum of assets held by the monetary authority and depository institutions excluding inter-bank transfer divided by GDP. Credit to Private Sector equals claimsagainst the private sector divided by GDP. The variable Interaction represents the product of the two other variables in the respective model. Industry Share inManufacturing is calculated by dividing the real output of the industry in the country by the total real output of the manufacturing sector of the country.Coefficients of the intercept are not reported. Asymptotic standard errors are given in parenthesis.Variable I II III IV V VI VII VIII IX X XI XII XIII
TurnoverRatio
0.0389a
(0.011)0.0344a
(0.010)0.0393a
(0.014)0.0385a
(0.012)0.1073a
(0.027)0.0393a
(0.012)0.0933a
(0.025)0.0348a
(0.010)0.0335a
(0.011)
Stock MarketCapitalization
-0.0077(0.010)
-0.0087(0.009)
-0.0020(0.015)
-0.0087(0.009)
-0.0090(0.010)
DomesticCredit
0.0267b
(0.012)-0.0016(0.013)
0.0218(0.015)
-0.0093(0.011)
Credit to PrivateSector
0.0426a
(0.015)-0.0079(0.017)
0.0222(0.020)
-0.0007(0.016)
Credit to PublicSector
-0.0010(0.017)
Interaction-0.0190(0.034)
-0.079a
(0.028)-0.0934b
(0.038)Industry’s Sharein Manufacturing
0.2431a
(0.072)0.2458a
(0.073)0.2486a
(0.072)0.2619a
(0.073)0.2476a
(0.072)0.2230a
(0.071)0.2245a
(0.071)0.2539a
(0.072)0.2495a
(0.071)0.2525a
(0.072)0.2562a
(0.072)0.2281a
(0.069)0.2290a
(0.070)
Error Componentsσα
2
ση2
σλ2
σν2
0.0001<0.00010.0008b
0.0267a
0.0001<0.00010.0008b
0.0272a
<0.0001<0.00010.0009b
0.0300a
<0.0001<0.00010.0009b
0.0300a
<0.0001<0.00010.0009b
0.0300a
<0.0001<0.00010.0007b
0.0258a
<0.0001<0.00010.0007b
0.0258a
0.0001<0.00010.0008b
0.0266a
0.0001<0.00010.0008b
0.0266a
0.0001<0.00010.0008b
0.0266a
0.0001<0.00010.0008b
0.0266a
<0.0001<0.00010.0007b
0.0257a
<0.0001<0.00010.0007b
0.0257a
a Significant at 1%; b Significant at 5%; c Significant at 10%
46
Table 7: Growth in Economic Efficiency and Capital Market FunctionsThe parameter estimates are maximum likelihood estimates of four-way error component models containing random country, industry and time effects. Thedependent variable is the annual compound growth rate in economic efficiency for each of the ten industries over thirty-eight countries for the period 1980-1995.Economic efficiency is in terms of deviation of actual cost to the optimal minimum cost on a stochastic cost frontier. Turnover Ratio is the value of total shares ofstocks traded divided by market capitalization. Stock Market Capitalization is the ratio of the total market value of publicly traded equity to GDP. DomesticCredit is the sum of assets held by the monetary authority and depository institutions excluding inter-bank transfer divided by GDP. Credit to Private Sectorequals claims against the private sector divided by GDP. The variable Interaction represents the product of the two other variables in the respective model.Industry Share in Manufacturing is calculated by dividing the real output of the industry in the country by the total real output of the manufacturing sector of thecountry. Coefficients of the intercept are not reported. Asymptotic standard errors are given in parenthesis.Variable I II III IV V VI VII VIII IX X XI XII XIII
TurnoverRatio
0.0061a
(0.002)0.0057a
(0.002)0.0077a
(0.002)0.0063a
(0.002)0.0181a
(0.004)0.0062a
(0.002)0.0152a
(0.004)0.0060a
(0.002)0.0057a
(0.002)
Stock MarketCapitalization
0.0003(0.002)
-0.0002(0.002)
0.0026(0.002)
-0.0001(0.002)
-0.0001(0.002)
DomesticCredit
0.0015(0.002)
-0.0020(0.002)
0.0021(0.002)
-0.0023(0.002)
Credit to PrivateSector
0.0038(0.002)
-0.0013(0.003)
0.0038(0.003)
-0.0005(0.003)
Credit to PublicSector
-0.0019(0.003)
Interaction-0.0077(0.005)
-0.014a
(0.004)-0.0154a
(0.006)Industry’s Sharein Manufacturing
0.0236b
(0.011)0.0243b
(0.011)0.0283b
(0.011)0.0289b
(0.011)0.0283a
(0.010)0.0221b
(0.011)0.0226b
(0.011)0.0256a
(0.011)0.0251b
(0.011)0.0255b
(0.011)0.0260b
(0.011)0.0244a
(0.011)0.0245a
(0.011)
Error Componentsσα
2
ση2
σλ2
σν2
<0.001<0.001<0.001b
0.0006a
<0.001<0.001<0.001b
0.0006a
<0.001<0.001<0.001b
0.0006a
<0.001<0.001<0.001b
0.0006a
<0.001<0.001<0.001b
0.0006a
<0.001<0.001<0.001b
0.0006a
<0.001<0.001<0.001b
0.0006a
<0.001<0.001<0.001b
0.0006a
<0.001<0.001<0.001b
0.0006a
<0.001<0.001<0.001b
0.0006a
<0.001<0.001<0.001b
0.0006a
<0.001<0.001<0.001b
0.0006a
<0.001<0.001<0.001b
0.0006a
a Significant at 1%; b Significant at 5%; c Significant at 10%
47
Table 8: Growth in Production Efficiency and Capital Market FunctionsThe parameter estimates are maximum likelihood estimates of four-way error component models containing random country, industry and time effects. Thedependent variable is the annual compound growth rate in production efficiency for each of the ten industries over thirty-eight countries for the period 1980-1995. Turnover Ratio is the value of total shares of stocks traded divided by market capitalization. Stock Market Capitalization is the ratio of the total marketvalue of publicly traded equity to GDP. Domestic Credit is the sum of assets held by the monetary authority and depository institutions excluding inter-banktransfer divided by GDP. Credit to Private Sector equals claims against the private sector divided by GDP. The variable Interaction represents the product ofthe two other variables in the respective model. Industry Share in Manufacturing is calculated by dividing the real output of the industry in the country by thetotal real output of the manufacturing sector of the country. Coefficients of the intercept are not reported. Asymptotic standard errors are given in parenthesis.
Variable I II III IV V VI VII VIII IX X XI XII XIII
TurnoverRatio
0.0040a
(0.001)0.0035a
(0.001)0.0047a
(0.002)0.0040a
(0.001)0.0120a
(0.003)0.0041a
(0.001)0.0099a
(0.004)0.0036a
(0.001)0.0034a
(0.001)
Stock MarketCapitalization
0.00002(0.001)
-0.0002(0.002)
0.0014(0.002)
-0.0003(0.001)
-0.0005(0.001)
DomesticCredit
0.0028c
(0.002)-0.0007(0.002)
0.0020(0.002)
-0.0007(0.001)
Credit to PrivateSector
0.0041b
(0.002)-0.0014(0.002)
0.0018(0.003)
0.0008(0.002)
Credit to PublicSector
-0.0011(0.002)
Interaction-0.0045(0.004)
-0.009a
(0.003)-0.0098b
(0.005)Industry’s Sharein Manufacturing
0.0166b
(0.008)0.0177b
(0.008)0.0204b
(0.009)0.0215b
(0.009)0.0188b
(0.009)0.0147b
(0.008)0.0149b
(0.008)0.0180b
(0.008)0.0180b
(0.008)0.0178b
(0.008)0.0183b
(0.008)0.0162b
(0.008)0.0164b
(0.008)
Error Componentsσα
2
ση2
σλ2
σν2
<0.001c
<0.001<0.001b
0.0004a
<0.001c
<0.001<0.001b
0.0004a
<0.001c
<0.001<0.001b
0.0004a
<0.001c
<0.001<0.001b
0.0004a
<0.001c
<0.001<0.001b
0.0004a
<0.001c
<0.001<0.001b
0.0004a
<0.001c
<0.001<0.001b
0.0004a
<0.001c
<0.001<0.001b
0.0004a
<0.001c
<0.001<0.001b
0.0004a
<0.001c
<0.001<0.001b
0.0004a
<0.001c
<0.001<0.001b
0.0004a
<0.001c
<0.001<0.001b
0.0004a
<0.001c
<0.001<0.001b
0.0004a
a Significant at 1%; b Significant at 5%; c Significant at 10%
48
Table 9: Accounting Disclosure and Economic PerformanceThe parameter estimates are maximum likelihood estimates of four-way error component models containing randomcountry, industry and time effects. Accounting standard quality is an index of the quality of company financialdisclosure across countries. Stock Market Capitalization is the ratio of the total market value of publicly tradedequity to GDP. Domestic Credit is the sum of assets held by the monetary authority and depository institutionsexcluding inter-bank transfer divided by GDP. Credit to Private Sector equals claims against the private sectordivided by GDP. The variable Interaction represents the product of the two other variables in the respective model.Industry Share in Manufacturing is calculated by dividing the real output of the industry in the country by the totalreal output of the manufacturing sector of the country. Coefficients of the intercept are not reported. Asymptoticstandard errors are given in parenthesis.
Variables I II III IV V VI
Dependent Variable: Growth in Economic EfficiencyAccounting Standard Quality(x100)
0.0113b
(0.005)0.0099b
(0.005)0.0108b
(0.005)0.0113b
(0.005)0.0093c
(0.005)0.0100b
(0.005)Market Capitalization (x100) -0.0854
(0.152)-0.0727(0.160)
-0.1162(0.166)
Domestic Credit (x100) -0.0715(0.199)
-0.0755(0.183)
Credit to Private Sector (x100) -0.0031(0.249)
0.0981(0.239)
Industry Share inManufacturing (x100)
1.883c
(0.989)1.849c
(1.000)2.023b
(0.997)2.032b
(0.997)1.995b
(1.008)2.017b
(1.008)
Dependent Variable: Growth in Production EfficiencyAccounting Standard Quality(x100)
0.0086b
(0.004)0.0069b
(0.003)0.0092b
(0.004)0.0084b
(0.004)0.0079b
(0.003)0.0073b
(0.003)
Market Capitalization (x100) -0.0787(0.107)
-0.1012(0.111)
-0.1373(0.118)
Domestic Credit (x100) 0.0970(0.047)
0.0888(0.0125)
Credit to Private Sector (x100) 0.0720(0.186)
0.1844(0.169)
Industry Share inManufacturing (x100)
1.671b
(0.759)1.607b
(0.762)1.785b
(0.765)1.782b
(0.765)1.728b
(0.767)1.745b
(0.768)a Significant at 1% ; b Significant at 5%; c Significant at 10%
49
Table 10: Governance and Economic Performance: InstrumentalVariables
The parameter estimates are maximum likelihood estimates of four-way error component models containing randomcountry, industry and time effects. In Model I, the instruments are index of shareholder’s legal rights provided inthe country’s legal codes, index of legal rights protecting debt holders, judicial efficiency and an index of rule of lawfrom La Porta et al (1998). In Model II, the instruments are the origin of a country’s legal system. The legal originvariables include dummy variables for “English origin”, “French origin”, “German origin”, and “Scandinavianorigin” from La Porta et al (1998). Industry Share in Manufacturing is calculated by dividing the real output of theindustry in the country by the total real output of the manufacturing sector of the country. Coefficients of theintercept are not reported. Asymptotic standard errors are given in parenthesis.
Variables I II
Panel (a): Dependent Variable: Growth in Economic EfficiencyTurnover Ratio 0.0187a
(0.007)0.0171b
(0.009)Market Capitalization 0.0008
(0.004)-0.0030(0.004)
Domestic Credit 0.0081(0.006)
-0.0099(0.009)
Credit to Private Sector
Industry’s Share inManufacturing
0.0177c
(0.010)0.0239b
(0.010)
Panel (b): Dependent Variable: Growth in Production Efficiency
Turnover Ratio 0.0105b
(0.005)0.0149c
(0.008)Market Capitalization 0.0018
(0.003)-0.0019(0.003)
Domestic Credit 0.0079(0.005)
-0.0108(0.008)
Credit to PrivateSectorIndustry’s Share inManufacturing
0.0159b
(0.008)0.0172b
(0.008)a Significant at 1% ; b Significant at 5%; c Significant at 10%