The Institutional Factors Impact on Foreign Direct Investment (FDI) On Indian Economic Growth. Dr. R S Ch Murthy Chodisetty Faculty of Management, Sreenidhi Institute of Science and Technology, Hyderabad ABSTRACT The study covers several aspects of FDI in the country, ranging from FDI patterns and FDI drivers to FDI relations, growth and exports, taking into account several factors such as the formation of raw equities, macroeconomic stability, institutional capital and human capital. In recent years, the FDI has increased so greatly that it has surpassed all other metrics of economic transactions. Countries are bidding for the highest levels of FDI, as they are the cheapest foreign funding. The FDI rate has increased to the developed countries in the last two decades, compared to the previous trend. There may have been a surprising rise of Asia as big FDI recipients. In the 2014 industry review, the highest FDI for the service sector was found. In the fields of training, accounting, infrastructure and telecoms, most of the FDI inflows are generated. The self-employed industries authorize government investments in chemical, metallurgical, automobile, Pharmaceutical and tourism sectors. The main recipient is FDI, but FDI flows are subject to policy constraints. Despite the lack of restrictions on FDI inflows in metallurgical, chemical, automotive, pharmaceutical and tourism industries, FDI growth in those sectors was much lower than in the FDI markets for utilities and telecoms.The study focuses on the impact of institutional influences on Indian foreign direct investment. Keywords:Foreign Direct Investment, Institutional Factors, Economic Growth. JEL Codes:G1, F21, F43, O43, O47. 1. INTRODUCTION: In several countries, including India, FDI's position for economic growth has been a hot topic of debate. FDI is a key part of the world economy's global efforts. Economic and technological forces are driving growth of international production. The continuing liberalization of FDI and trade policies is also behind it. One feature of the world today is the circulation of private capital flows in developing countries, particularly since the 1990s, in the form of foreign direct investment (FDI). Since the 1980s, MNCs have emerged as major actors in the sense of globalization. In this sense, globalization gives developing countries such as India a parallel opportunity to achieve rapid economic growth through trade and investment. International trade expanded more rapidly than the FDI in the 1970s, so far the major economic activities in international cooperation were international trade. With the growth of marketing and global supply networks for Manufacturing and Distribution in the mid-1980s, FDI has therefore begun to rise rapidly, and has fundamentally changed.FDI flows include capital provided by foreign investors to enterprises in another economy directly or indirectly, with an anticipation that they will make better profit and participate in the management of the company in which they invest. In proportion to their equity portfolios, foreign investors accumulate capital in host- country companies Prachi Arora (2013) 1 . The previous Indian FDI definition differs from High Technology Letters Volume 27, Issue 1, 2021 ISSN NO : 1006-6748 http://www.gjstx-e.cn/ 226
Transcript
The Institutional Factors Impact on Foreign Direct Investment (FDI) On
Indian Economic Growth.
Dr. R S Ch Murthy Chodisetty
Faculty of Management, Sreenidhi Institute of Science and Technology, Hyderabad
ABSTRACT
The study covers several aspects of FDI in the country, ranging from FDI patterns and FDI
drivers to FDI relations, growth and exports, taking into account several factors such as the
formation of raw equities, macroeconomic stability, institutional capital and human capital.
In recent years, the FDI has increased so greatly that it has surpassed all other metrics of
economic transactions. Countries are bidding for the highest levels of FDI, as they are the
cheapest foreign funding. The FDI rate has increased to the developed countries in the last
two decades, compared to the previous trend. There may have been a surprising rise of Asia
as big FDI recipients. In the 2014 industry review, the highest FDI for the service sector was
found. In the fields of training, accounting, infrastructure and telecoms, most of the FDI
inflows are generated. The self-employed industries authorize government investments in
chemical, metallurgical, automobile, Pharmaceutical and tourism sectors. The main recipient
is FDI, but FDI flows are subject to policy constraints. Despite the lack of restrictions on
FDI inflows in metallurgical, chemical, automotive, pharmaceutical and tourism industries,
FDI growth in those sectors was much lower than in the FDI markets for utilities and
telecoms.The study focuses on the impact of institutional influences on Indian foreign direct
investment.
Keywords:Foreign Direct Investment, Institutional Factors, Economic Growth.
JEL Codes:G1, F21, F43, O43, O47.
1. INTRODUCTION:
In several countries, including India, FDI's position for economic growth has been a hot
topic of debate. FDI is a key part of the world economy's global efforts. Economic and
technological forces are driving growth of international production. The continuing
liberalization of FDI and trade policies is also behind it. One feature of the world today is
the circulation of private capital flows in developing countries, particularly since the
1990s, in the form of foreign direct investment (FDI). Since the 1980s, MNCs have
emerged as major actors in the sense of globalization. In this sense, globalization gives
developing countries such as India a parallel opportunity to achieve rapid economic
growth through trade and investment. International trade expanded more rapidly than the
FDI in the 1970s, so far the major economic activities in international cooperation were
international trade. With the growth of marketing and global supply networks for
Manufacturing and Distribution in the mid-1980s, FDI has therefore begun to rise rapidly,
and has fundamentally changed.FDI flows include capital provided by foreign investors to
enterprises in another economy directly or indirectly, with an anticipation that they will
make better profit and participate in the management of the company in which they invest.
In proportion to their equity portfolios, foreign investors accumulate capital in host-
country companies Prachi Arora (2013)1. The previous Indian FDI definition differs from
High Technology Letters
Volume 27, Issue 1, 2021
ISSN NO : 1006-6748
http://www.gjstx-e.cn/226
that of the IMF as well as the UNCTAD WIR definition; the IMF definition comprises
ECBs. FDI inflows will preferably reflect the formation of capital, the formation of new
businesses in one factory, the increase in foreign equity held in existing firms, M&As in
existing companies and others.This is the empirical definition used by many countries to
distinguish between FDI and portfolio streams. FDI was defined as the' investment to
gather a lasting interest in a company which operates in the economy other than the
investor's by the International Monetary Fund (IMF),' the object of which is that of an
investor to have an effective corporate management voice (IMF, 1977). FDI is the process
through which residents of one country (source country) are acquired by assets in order to
monitor a business in another country (host country)'s production, distribution and other
productive activities.
2. REVIEW OF LITERATURE
Samina Sabir, Anum Rafique and Kamran Abbas (2018): This study investigates
the impact of institutional quality on Foreign Direct Investment (FDI) inflows using
panel data. The empirical results confirm that institutional quality has a positive
impact on FDI in Asian of countries. These countries sample period of 1996–2017
using the system Generalized Method of Moments (GMM) for analysis. The
magnitude of the coefficients of control of corruption, government effectiveness,
political stability, regulatory quality, rule of law, and voice and accountability for FDI
inflows are greater in developed countries than in developing countries. We conclude
that institutional quality is a more important determinant of FDI in developed
countries than in developed countries.
ZuhalKurul and A. Yasemin Yalta (2017)145
: In this paper, we revisit the relation
between institutional factors and foreign direct investment (FDI) inflows in
developing countries by employing a dynamic panel methodology, which enables us
to deal with the persistency of FDI flows and endogeneity issues. We also contribute
to the literature by using various measures of institutions to identify which aspects of
institutional quality affect FDI in the developing world. Our empirical findings based
on 113 developing countries over the period 2002–2012 show evidence that some
institutional factors matter more than others in attracting more FDI flows. We also
found that the financial crisis in 2008 and 2009 had a negative impact on FDI flows.
Viral Upendrabhai Pandya (2017)146
: This paper examines foreign direct
investment (FDI) inflows and its impact on economic growth in Australia. FDI
inflows are considered to be a vital source of economic growth or development for
any economy and it plays big role in growth in gross domestic product (GDP),
improvement in infrastructure, employment creation, export and trade performance.
This paper examines the relationship between FDI and economic growth of Australia
through regression analysis between FDI and different measures of economic growth.
Pradip Baija1(2017)144
: - The research paper titled, “FDI Inflows Road to India’s
Rapid Development”, recorded the Market Survey and the findings of survey
conducted by the federation of Indian chamber of commerce and industry
(FICCI),that 70 per cent of foreign investors surveyed were making profits from
their Indian operations. The survey noted that as manufacturing foreign investors
High Technology Letters
Volume 27, Issue 1, 2021
ISSN NO : 1006-6748
http://www.gjstx-e.cn/227
were mostly dissatisfied with the infrastructure situation of the country, 42 per cent
rating the quality of parts and power facilities and 54 per cent of the companies rating
the condition of roads and highways.
Rao and Singh(2017)143
: - The study pointed out that "the regional concentration of
FDI is less of a concern if labor mobility is sufficient to ensure that workers can go
where new jobs are created." However, Top level points out that Indian labor mobility
is relatively low, "less than 0.5 percent of the population in rural and 4 percent of the
population in urban areas moved for reasons of economic consideration (or
employment).
3. Statement of the Problem:
In recent years emerging countries are attracting significant FDI inflows. The economic,
social development appear to the growing economies considerable making effects to
attract FDIs by focusing prospective sectors, institutional settings, policy changes.
Regulatory liberalization, investor guarantees, incentives and concessions etc.… but India
lagging behind in attracting the sizable amount of FDI. Over the past decade china doubled
its FDI and India over all FDI inflows show a significant growth trend. Despite the
dynamism of the country with enormous potential and increasing importance for FDI but
being the amount world’s top fastest growing countries (BRICS) failed to achieve the
expected FDI inflows compound with other sizable economic oriented countries. Indian
FDI Flows are growing year on year its observes the data from 2000 to till date. But the
Indian FDI growth is not as per the growth of global FDI growth. Many research scholars
have done research in this area but institutional factors role has not been studied, in the
progressive of FDI flows sector wise. All the sectors are not able to attract FDI flows
strongly due to bottlenecks in the form of Indian economic factors influence along with the
institutional factors.
4. Objectives of the Study:
1. To examine the institutional factors impact on Foreign Direct investment (FDI) flows in
to India.
5. Hypotheses of the Study:
H0: There is no institutional factors impact on Foreign Direct investment flows in to India.
H1: There isinstitutional factors impact on Foreign Direct investment flows in to India
6. Research Methodology:
6.1. Sources of Data:The secondary data were obtained from the annual reports of the ten public
sector banks. Additional data for analysis and verification were sourced from ww.moneycontrol.com.
The data were subjected to certain fundamental mathematical operations such as computing the ratios,
before being used for the analysis.
6.2. Period of the Study:
The study period is 15 years, between 2004 and 2018. Therefore, the trend in Indian FDI
influences for the period 2004 to 2018 is very necessary to look back and evaluate its
High Technology Letters
Volume 27, Issue 1, 2021
ISSN NO : 1006-6748
http://www.gjstx-e.cn/228
potential factors that determine FDI attraction and thus provide a clear picture of India's
competitive status in FDI attraction.
6.3. Tools used in the Study:
Unit Root Test: The study has applied the unit root test for the stationary of the time
series data to remove the seasonality effect. The following are the statistical tests were
applied.
• Augmented Dicky Fuller test
• Phillip-perron test
ARDL: The Auto regressive distributed log methodology has been applied to know the
association between the independent variables and the dependent variable. The study
has considered the institutional factors (independent variables) association with the
Indian FDI (dependent Variable.
Ordinary least Square: The ordinary least square method has been applied to know
the selected economic factors influence on the dependent variable (FDI).
7.LIMITATIONS OF THE STUDY:
The present research focused only on secondary data and the required data from reputed
sources were not consistent and therefore the results based on the statistical analysis
may not be correct. For example, analyzing the significance of possible determinants of
FDI at national level is a highly complex task. And it was difficult to use the raw data
for business environmental considerations such as business regulations, government
efficiency, technological readiness, etc.,
Data from different sources such as FDI inflows from RBIs in India, which do not
exactly match UNCTAD FDI data, and similarly for IMF, world economic
perspectives, and UNCTAD economic indicators, also differed.
8. SCOPE FOR FURTHER RESEARCH:
The study has been emphasized on the foreign direct investments of India. The study
mainly focused on the Indian economic growth with contribution of sectoral investments.
The study has considered the FDI investments from the 2004 to 2015. The study made an
attempt to examine the sectors, economic factors and institutional dimensions were
considered in the study. The sectors were selected based on the higher FDI flows from the
period of 2004 onwards continuously.
In the study the following Institutional indicators included
• Control of Corruption
• Government Effectiveness
• Political Stability
• Rule of Law
• Regulatory Quality
• Voice and Accountability
High Technology Letters
Volume 27, Issue 1, 2021
ISSN NO : 1006-6748
http://www.gjstx-e.cn/229
9. DATA ANALYSIS:
In the study IConsider Five types of Institutional Indicators from the Government website
for the analysis. The Factors are given below.
Control of Corruption
Government Effectiveness
Political Right Index
Regulatory Quality
Rule of Law
Voice &Accountability
Table – 1.0
Unit Root test with Augmented Dickey Fuller
Institutional Indicators Level 1st Difference 2
nd Difference
Control of Corruption 0.0013* - -
Government Effectiveness 0.0000* - -
Political Right Index 0.0000* - -
Regulatory Quality 0.0030* - -
Rule of Law 0.0682 0.0000* -
Voice &Accountability 0.0010* - -
*Significant at 5% level
Source: compiled on secondary data through E-views
The table stated the unit root test result under the Augmented Dickey Fuller test for the
institutional indicators of FDI are observed significant at the 5% level. The Control of
corruption, government effectiveness, political right index, regulatory quality and voice &
accountability are found to be significant at normal level and they are stationary. The rule of
law is observed to be non-significant at normal level but it is observed to be stationary in 1st
difference.
In this study following Institutions indicators include are Control of Corruption, Government
Effectiveness, Political Stability, Regulatory Quality, Rule of Law, and Voice and
Accountability. The unbundling of institutions allow us to examine which of these different
dimensions matter for FDI flows in developing countries.
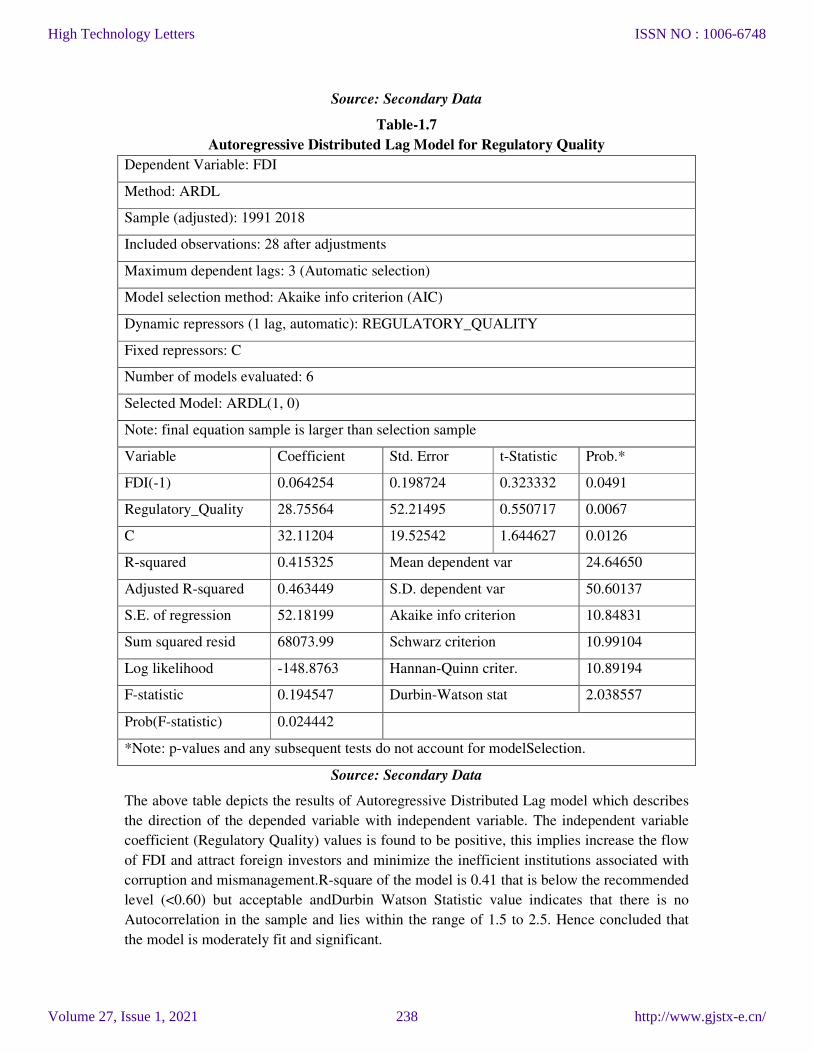
1. Control of Corruption:
High Technology Letters
Volume 27, Issue 1, 2021
ISSN NO : 1006-6748
http://www.gjstx-e.cn/230
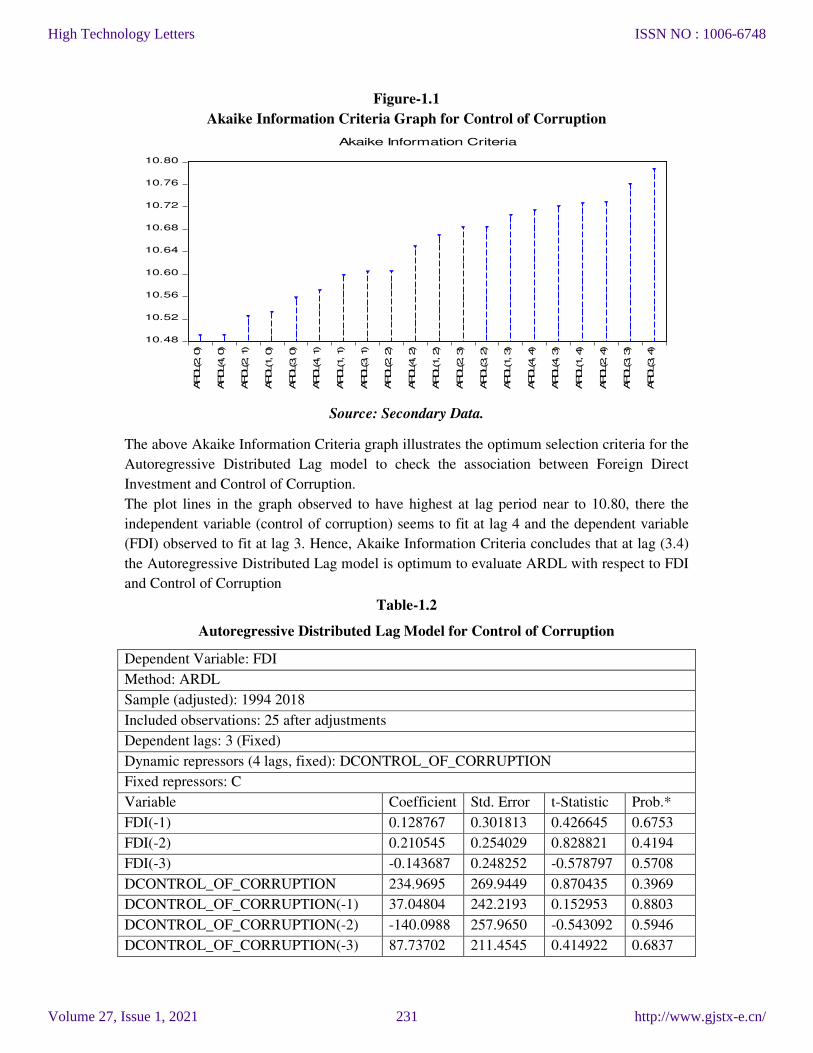
Figure-1.1
Akaike Information Criteria Graph for Control of Corruption
10.48
10.52
10.56
10.60
10.64
10.68
10.72
10.76
10.80
ARDL(2, 0)
ARDL(4, 0)
ARDL(2, 1)
ARDL(1, 0)
ARDL(3, 0)
ARDL(4, 1)
ARDL(1, 1)
ARDL(3, 1)
ARDL(2, 2)
ARDL(4, 2)
ARDL(1, 2)
ARDL(2, 3)
ARDL(3, 2)
ARDL(1, 3)
ARDL(4, 4)
ARDL(4, 3)
ARDL(1, 4)
ARDL(2, 4)
ARDL(3, 3)
ARDL(3, 4)
Akaike Information Criteria
Source: Secondary Data.
The above Akaike Information Criteria graph illustrates the optimum selection criteria for the
Autoregressive Distributed Lag model to check the association between Foreign Direct
Investment and Control of Corruption.
The plot lines in the graph observed to have highest at lag period near to 10.80, there the
independent variable (control of corruption) seems to fit at lag 4 and the dependent variable
(FDI) observed to fit at lag 3. Hence, Akaike Information Criteria concludes that at lag (3.4)
the Autoregressive Distributed Lag model is optimum to evaluate ARDL with respect to FDI
and Control of Corruption
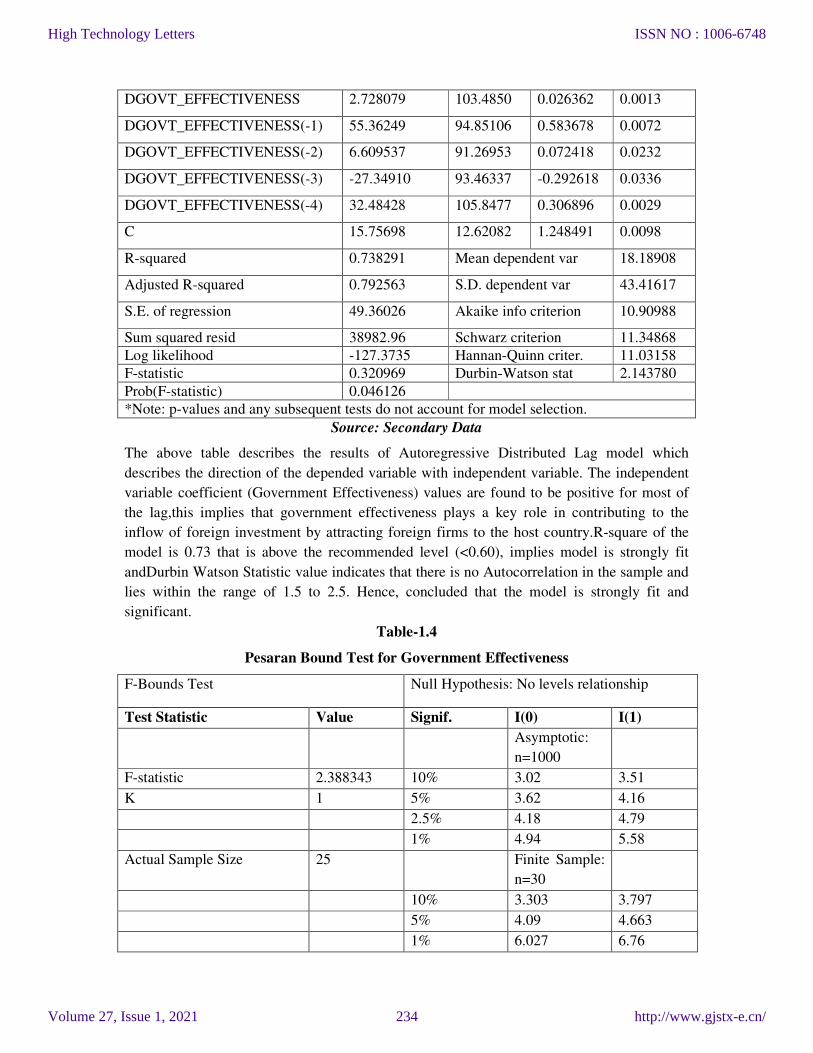
Table-1.2
Autoregressive Distributed Lag Model for Control of Corruption