Submitted in Partial Fulfillment of the Requirements for the Degree of
Doctor of Philosophy
August 2003
ii
The thesis of Charles Xiaoxue Wang has been reviewed and approved* by the following:
Francis M. Dwyer Professor of Education Thesis Adviser Chair of Committee Barbara L. Grabowski Associate Professor of Education Edgar P. Yoder Professor of Agricultural and Extension Education Kyle L. Peck Professor of Education Head of the Department of Adult Education, Instructional Systems, and Workforce Education and Development
* Signatures are on file in the Graduate School.
ii
iii
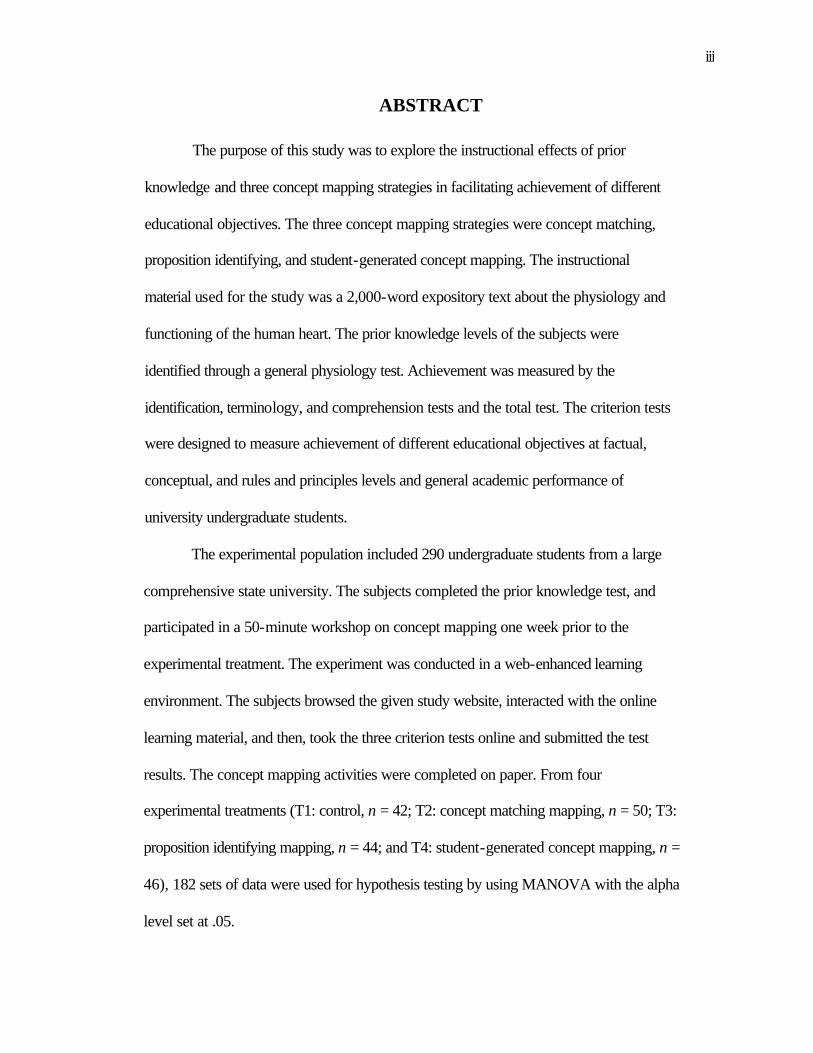
ABSTRACT
The purpose of this study was to explore the instructional effects of prior
knowledge and three concept mapping strategies in facilitating achievement of different
educational objectives. The three concept mapping strategies were concept matching,
proposition identifying, and student-generated concept mapping. The instructional
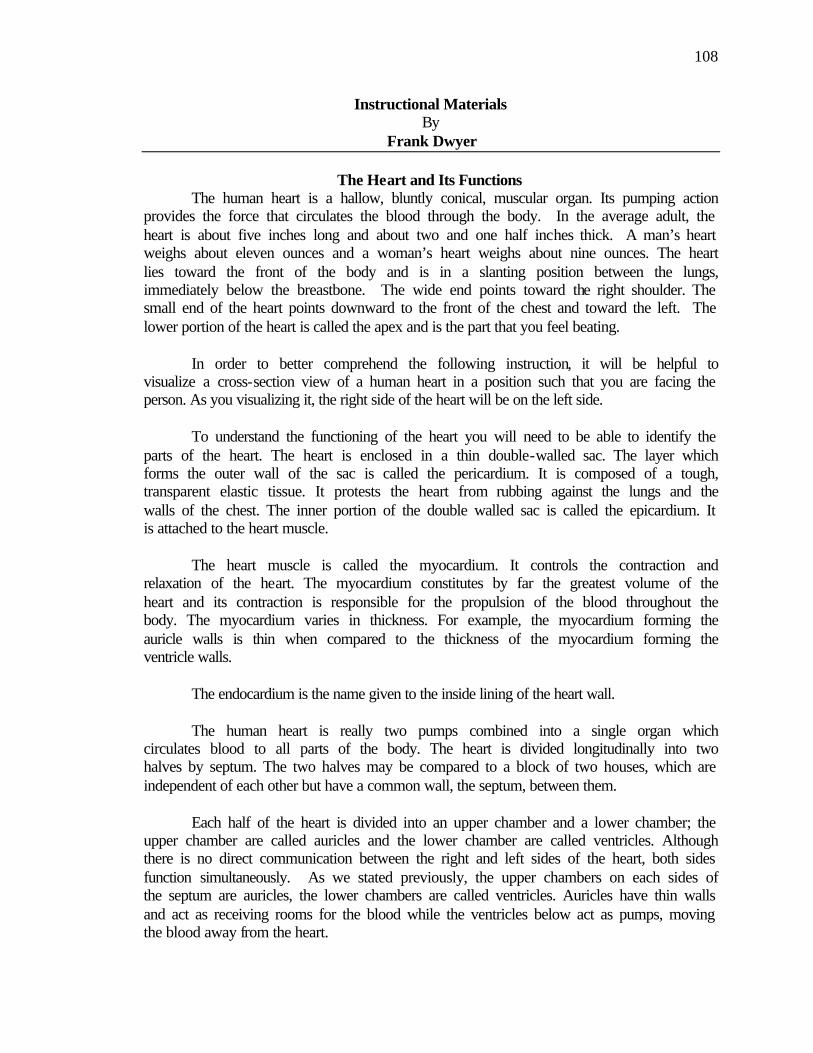
material used for the study was a 2,000-word expository text about the physiology and
functioning of the human heart. The prior knowledge levels of the subjects were
identified through a general physiology test. Achievement was measured by the
identification, terminology, and comprehension tests and the total test. The criterion tests
were designed to measure achievement of different educational objectives at factual,
conceptual, and rules and principles levels and general academic performance of
university undergraduate students.
The experimental population included 290 undergraduate students from a large
comprehensive state university. The subjects completed the prior knowledge test, and
participated in a 50-minute workshop on concept mapping one week prior to the
experimental treatment. The experiment was conducted in a web-enhanced learning
environment. The subjects browsed the given study website, interacted with the online
learning material, and then, took the three criterion tests online and submitted the test
results. The concept mapping activities were completed on paper. From four
experimental treatments (T1: control, n = 42; T2: concept matching mapping, n = 50; T3:
proposition identifying mapping, n = 44; and T4: student-generated concept mapping, n =
46), 182 sets of data were used for hypothesis testing by using MANOVA with the alpha
level set at .05.
iv
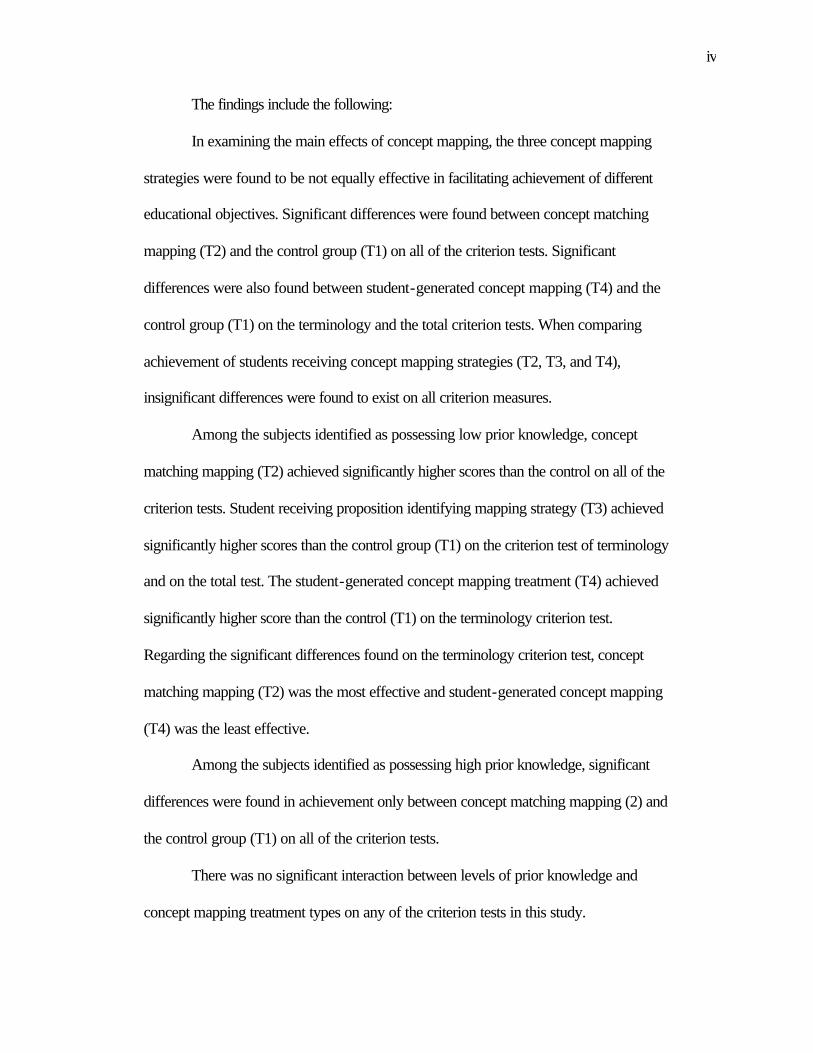
The findings include the following:
In examining the main effects of concept mapping, the three concept mapping
strategies were found to be not equally effective in facilitating achievement of different
educational objectives. Significant differences were found between concept matching
mapping (T2) and the control group (T1) on all of the criterion tests. Significant
differences were also found between student-generated concept mapping (T4) and the
control group (T1) on the terminology and the total criterion tests. When comparing
achievement of students receiving concept mapping strategies (T2, T3, and T4),
insignificant differences were found to exist on all criterion measures.
Among the subjects identified as possessing low prior knowledge, concept
matching mapping (T2) achieved significantly higher scores than the control on all of the
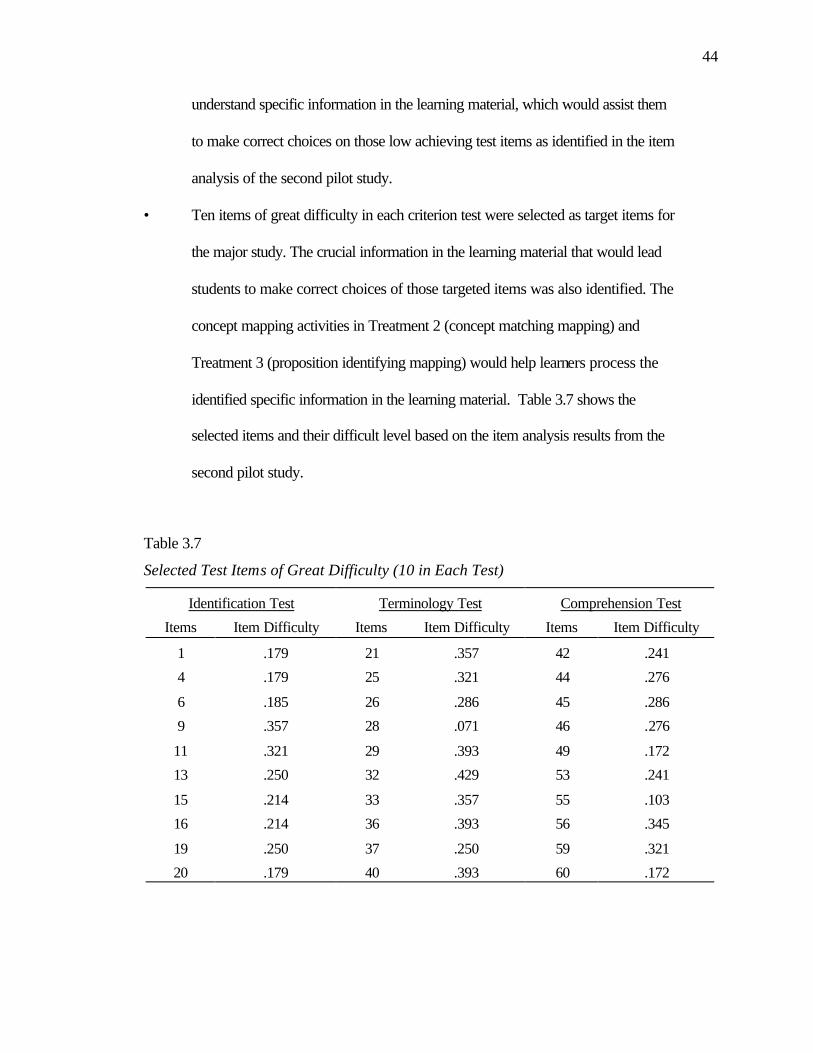
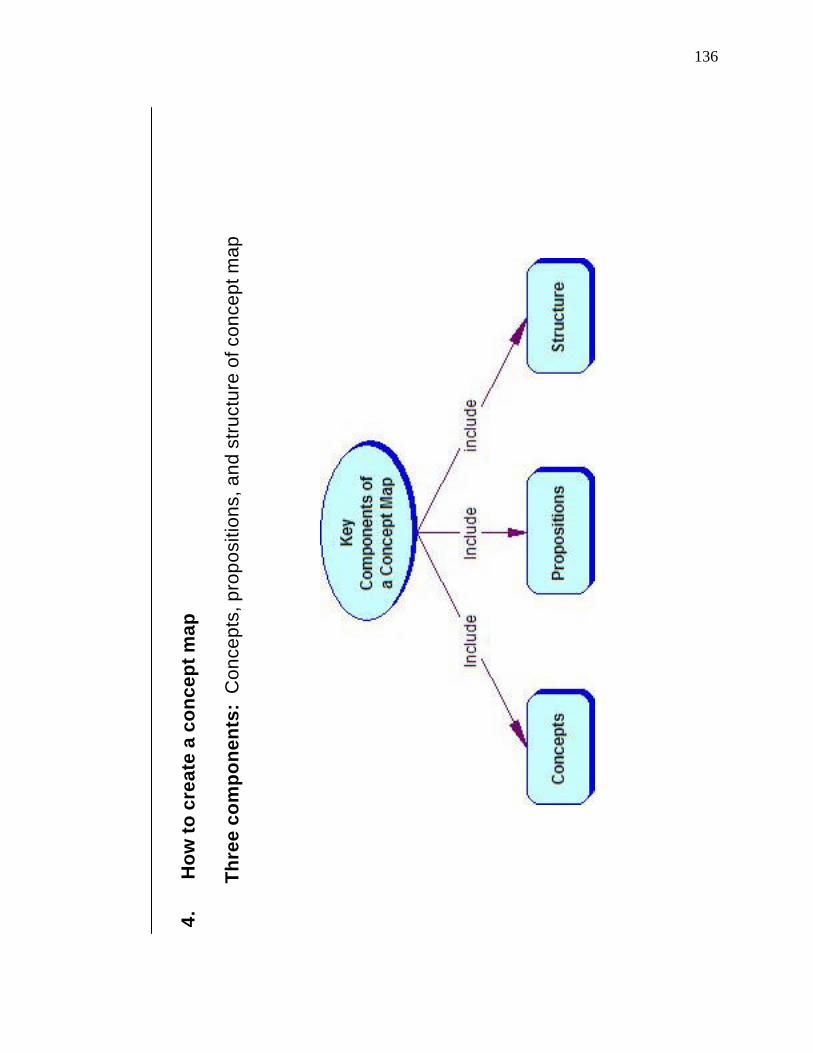
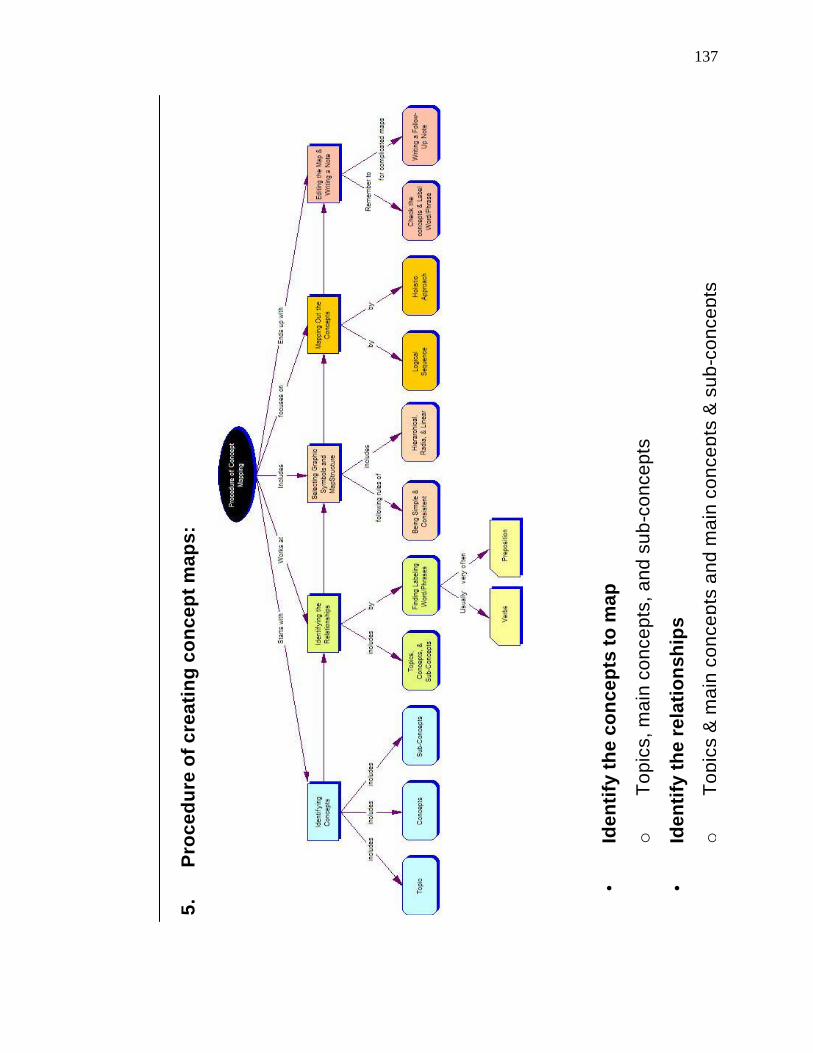
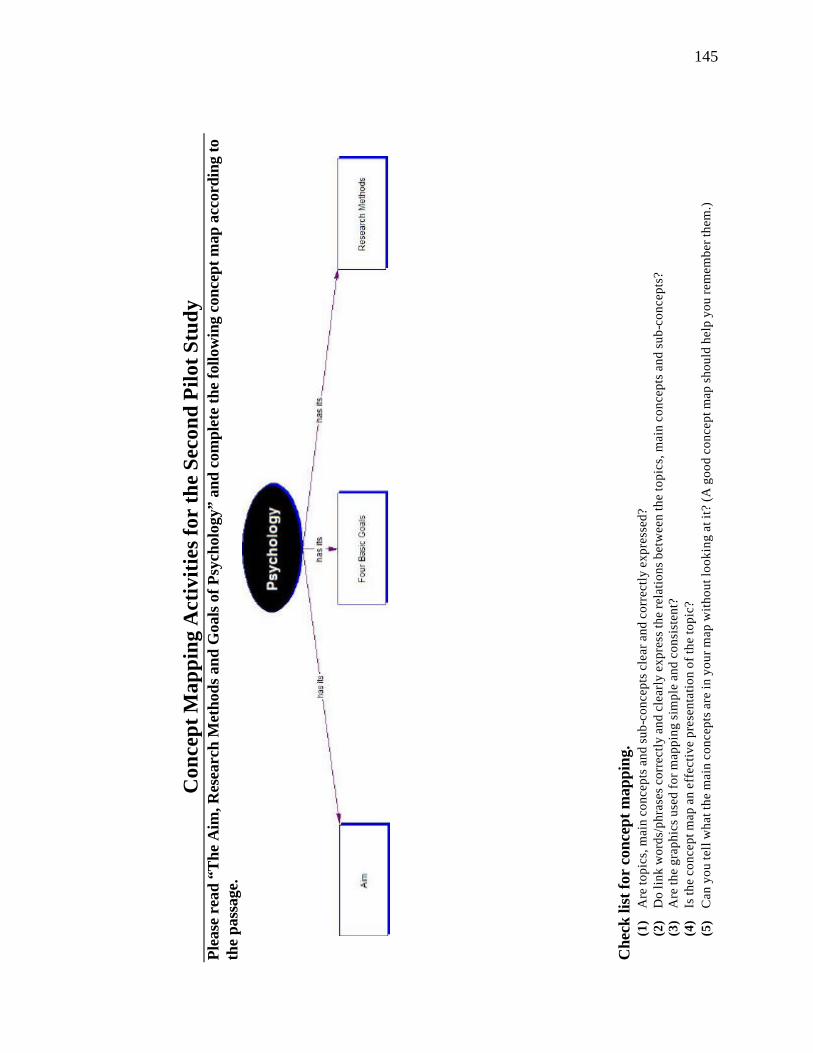
Appendix B.1: Concept Map Workshop Material for the First Pilot Study ....... 126
Appendix B.2: Concept Map Workshop Material for the Second Pilot Study... 133
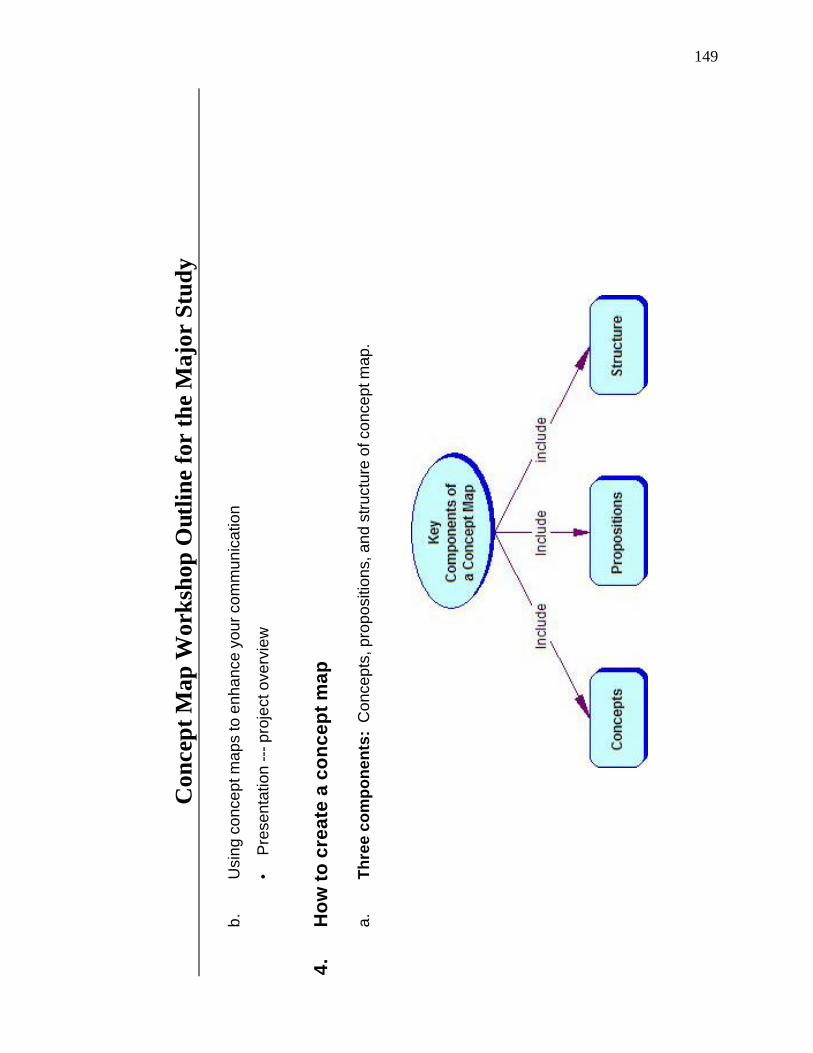
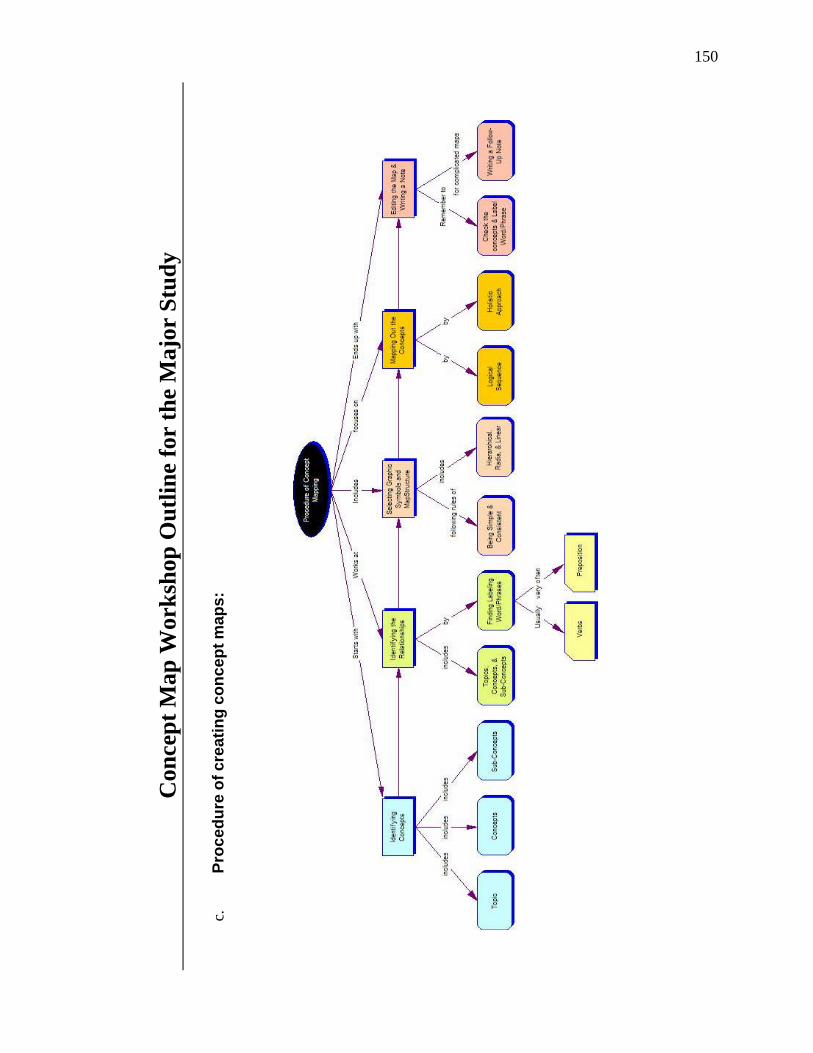
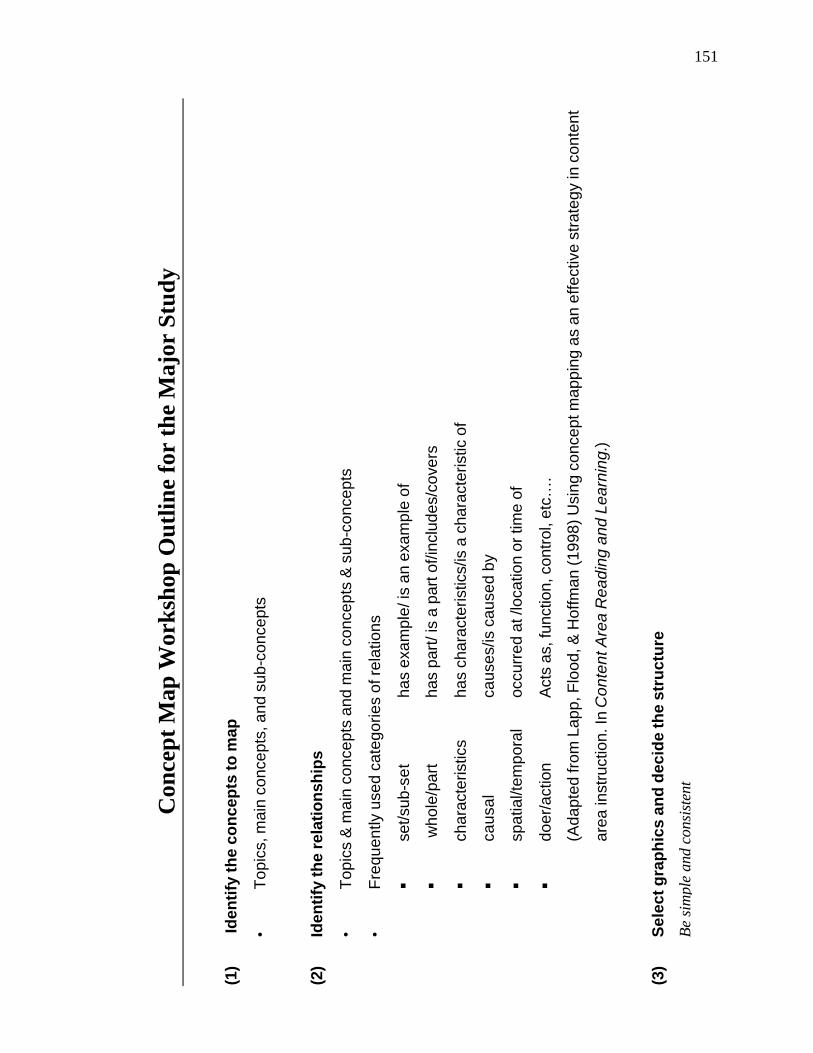
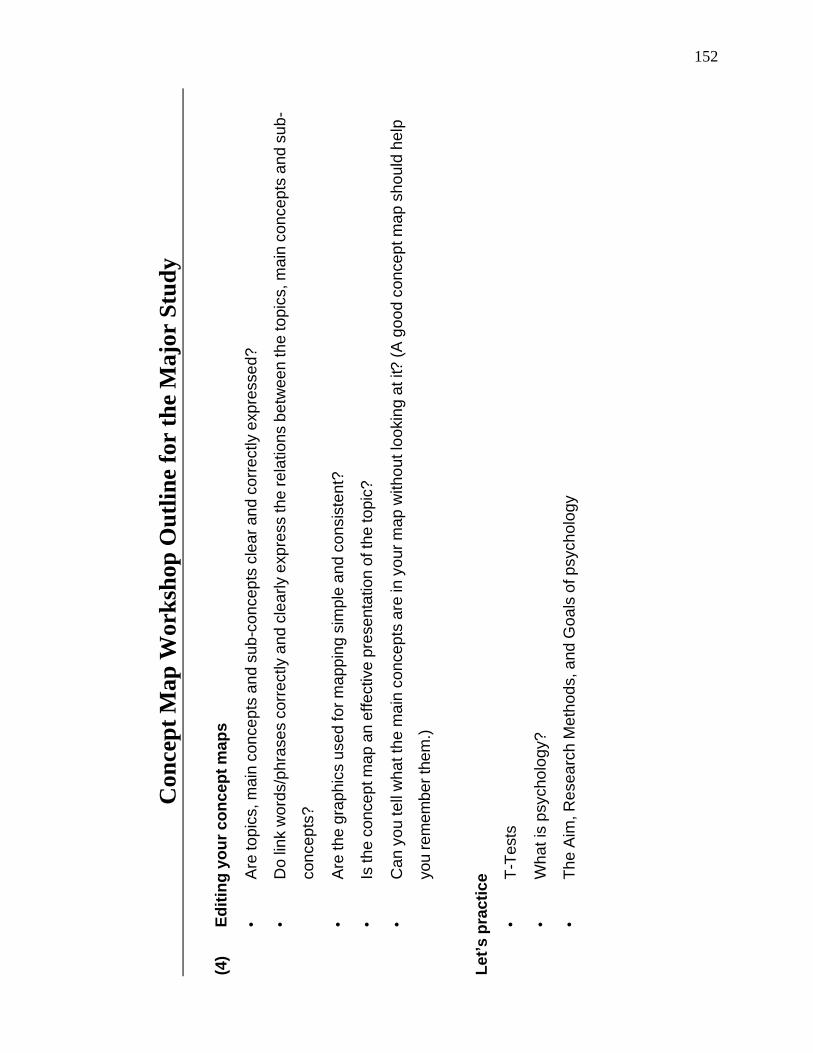
Appendix B.3: Concept Map Workshop Material for the Major Study ............. 146
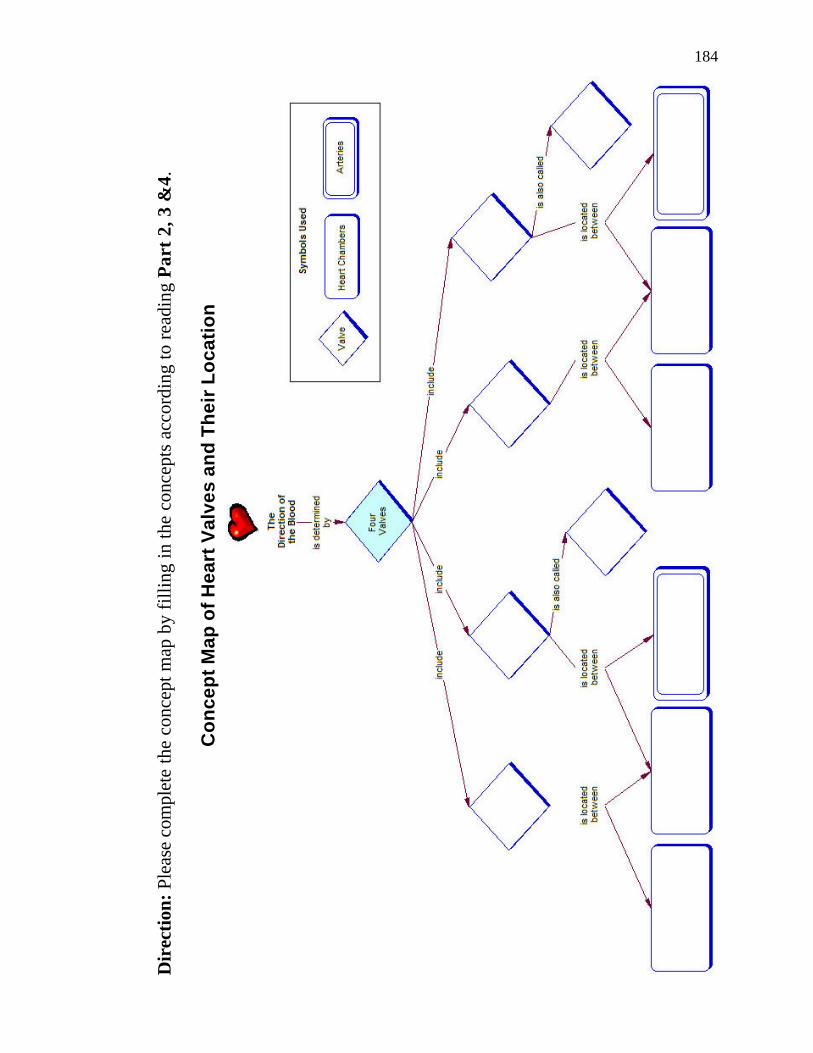
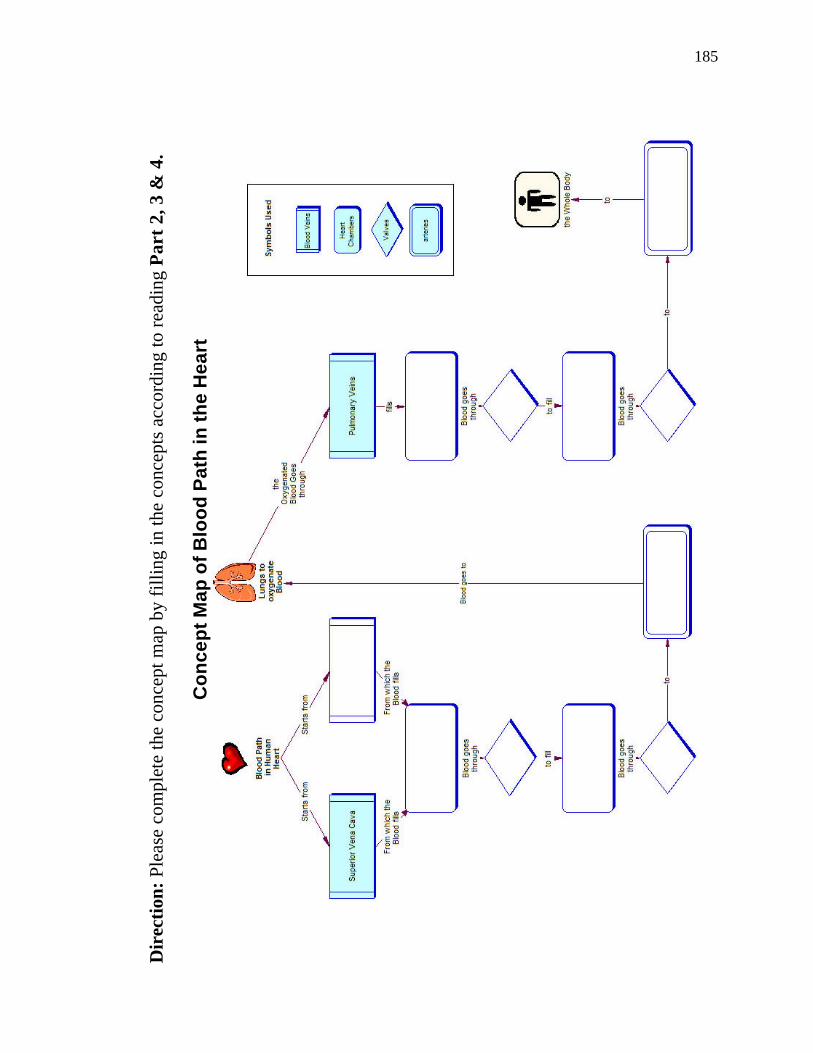
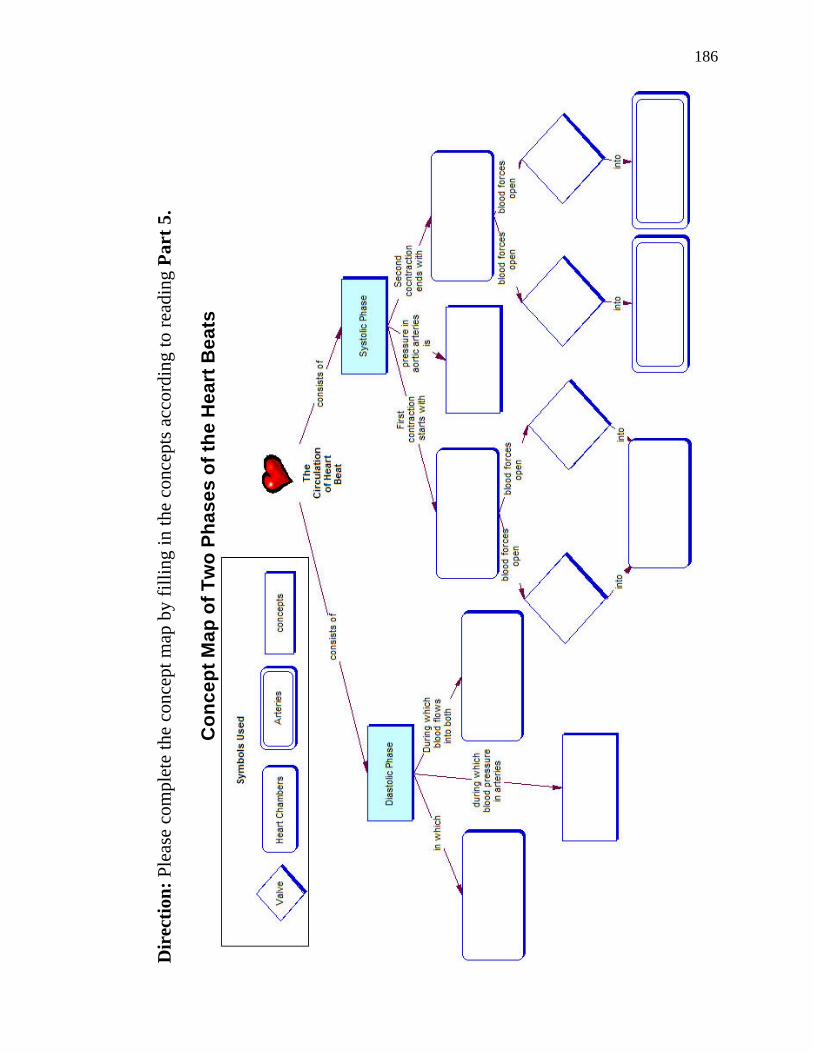
APPENDIX C: DIRECTIONS AND TREATMENTS ........................................................... 159
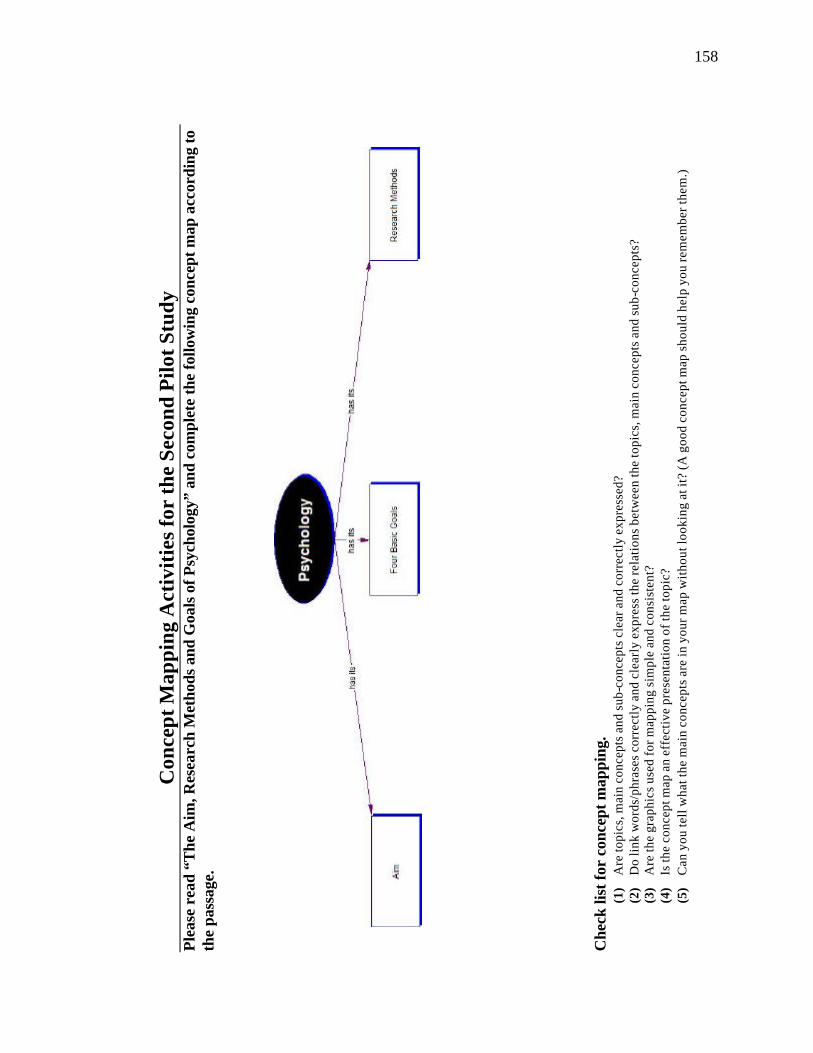
Appendix C.1: Directions and Treatment for the First Pilot Study .................... 160
Appendix C.2: Directions and Treatment for the Second Pilot Study................ 177
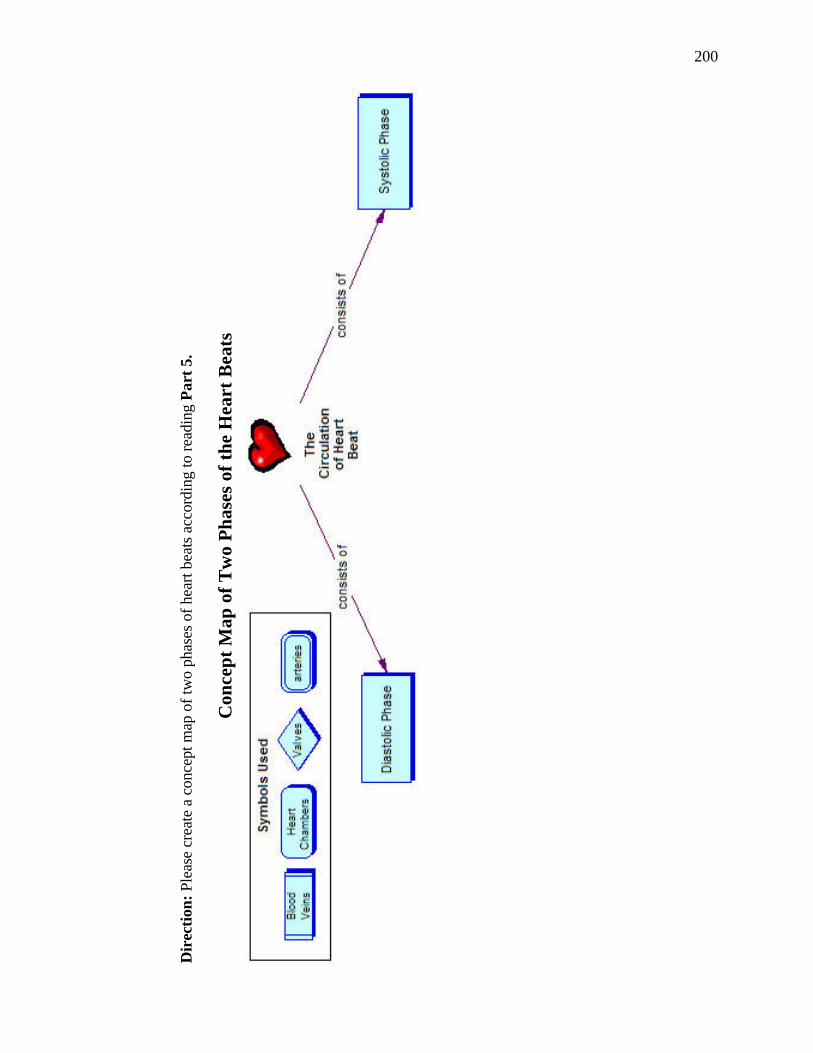
Appendix C.3: Directions and Treatments for the Major Study......................... 201
viii
LIST OF TABLES
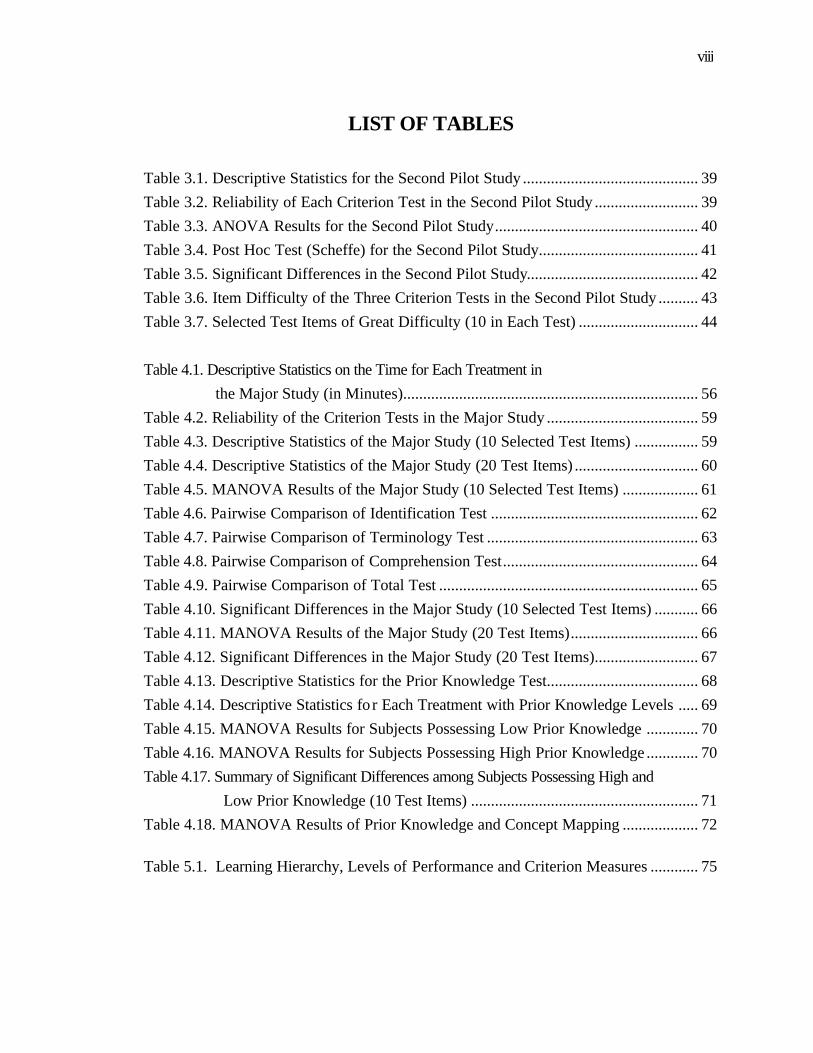
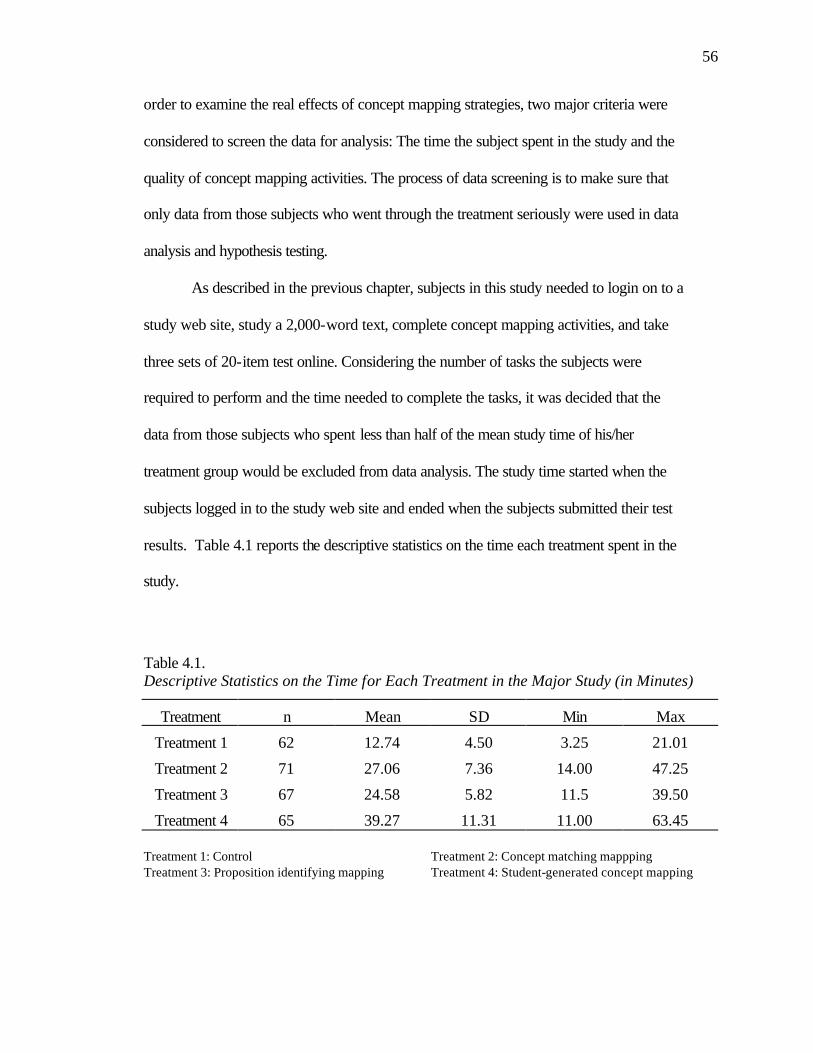
Table 3.1. Descriptive Statistics for the Second Pilot Study ............................................ 39 Table 3.2. Reliability of Each Criterion Test in the Second Pilot Study .......................... 39 Table 3.3. ANOVA Results for the Second Pilot Study................................................... 40 Table 3.4. Post Hoc Test (Scheffe) for the Second Pilot Study........................................ 41 Table 3.5. Significant Differences in the Second Pilot Study........................................... 42 Table 3.6. Item Difficulty of the Three Criterion Tests in the Second Pilot Study .......... 43 Table 3.7. Selected Test Items of Great Difficulty (10 in Each Test) .............................. 44 Table 4.1. Descriptive Statistics on the Time for Each Treatment in
the Major Study (in Minutes).......................................................................... 56 Table 4.2. Reliability of the Criterion Tests in the Major Study ...................................... 59 Table 4.3. Descriptive Statistics of the Major Study (10 Selected Test Items) ................ 59 Table 4.4. Descriptive Statistics of the Major Study (20 Test Items) ............................... 60 Table 4.5. MANOVA Results of the Major Study (10 Selected Test Items) ................... 61 Table 4.6. Pairwise Comparison of Identification Test .................................................... 62 Table 4.7. Pairwise Comparison of Terminology Test ..................................................... 63 Table 4.8. Pairwise Comparison of Comprehension Test................................................. 64 Table 4.9. Pairwise Comparison of Total Test ................................................................. 65 Table 4.10. Significant Differences in the Major Study (10 Selected Test Items) ........... 66 Table 4.11. MANOVA Results of the Major Study (20 Test Items)................................ 66 Table 4.12. Significant Differences in the Major Study (20 Test Items).......................... 67 Table 4.13. Descriptive Statistics for the Prior Knowledge Test...................................... 68 Table 4.14. Descriptive Statistics fo r Each Treatment with Prior Knowledge Levels ..... 69 Table 4.15. MANOVA Results for Subjects Possessing Low Prior Knowledge ............. 70 Table 4.16. MANOVA Results for Subjects Possessing High Prior Knowledge ............. 70 Table 4.17. Summary of Significant Differences among Subjects Possessing High and
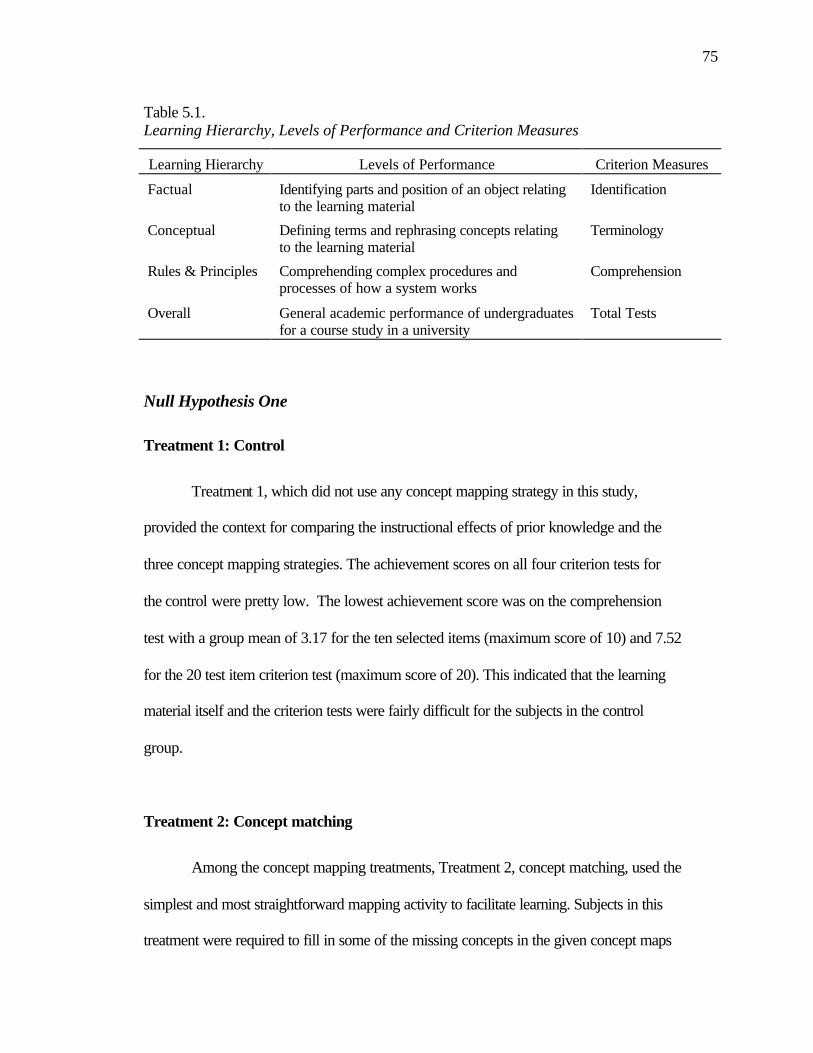
Low Prior Knowledge (10 Test Items) ......................................................... 71 Table 4.18. MANOVA Results of Prior Knowledge and Concept Mapping ................... 72 Table 5.1. Learning Hierarchy, Levels of Performance and Criterion Measures ............ 75
ix
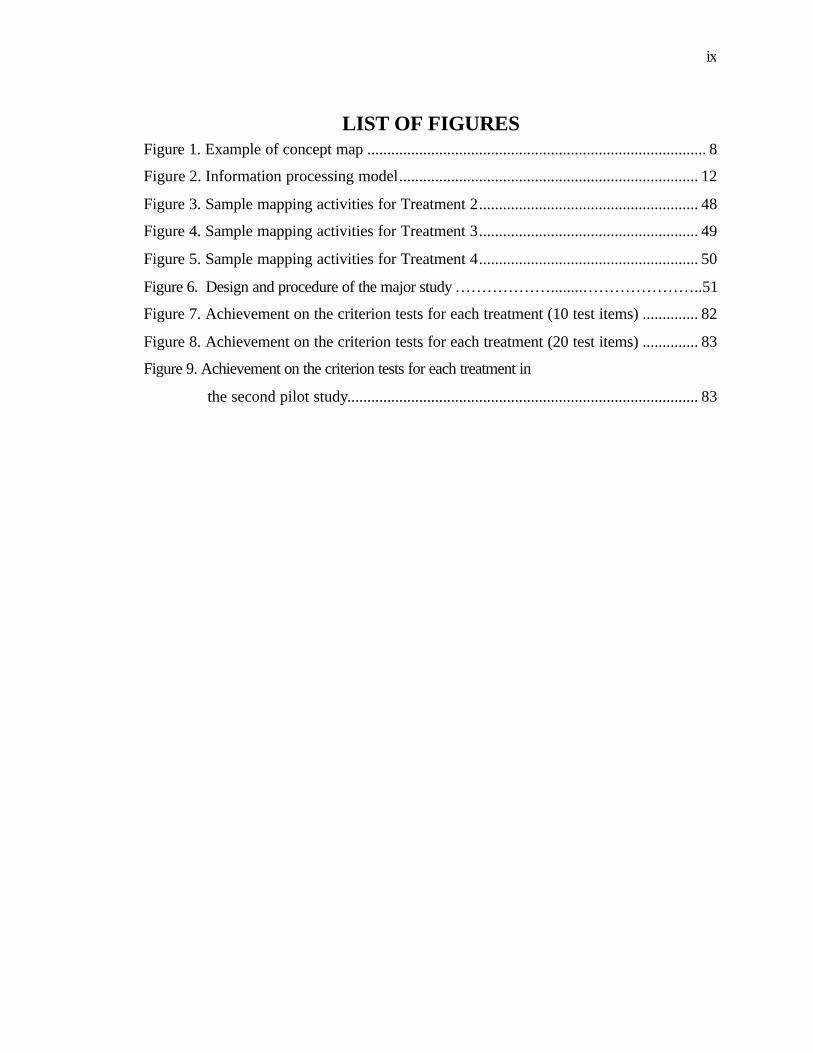
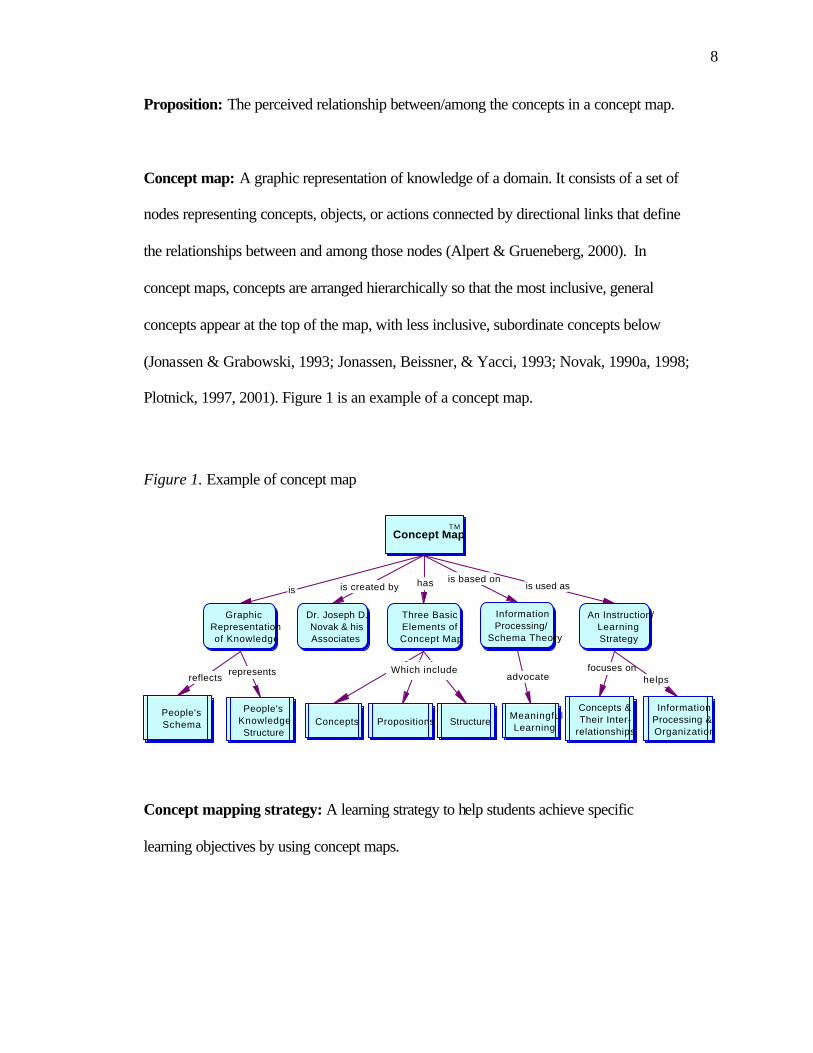
LIST OF FIGURES Figure 1. Example of concept map ..................................................................................... 8
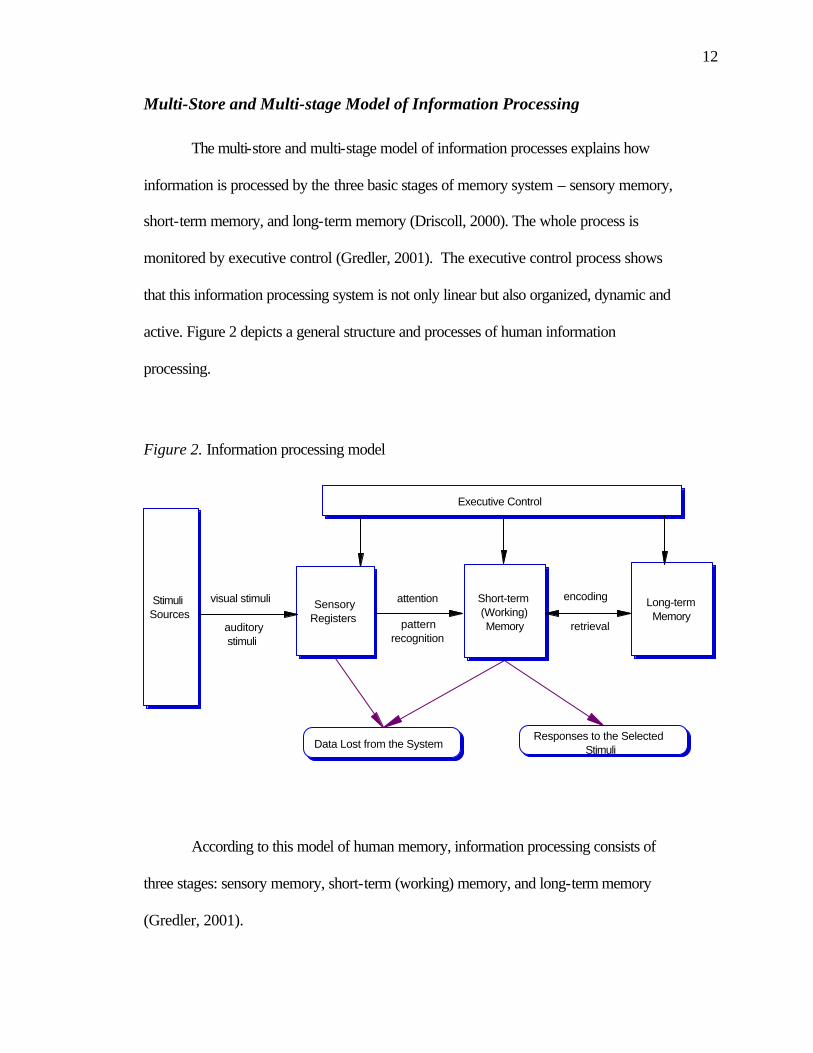
Figure 2. Information processing model........................................................................... 12
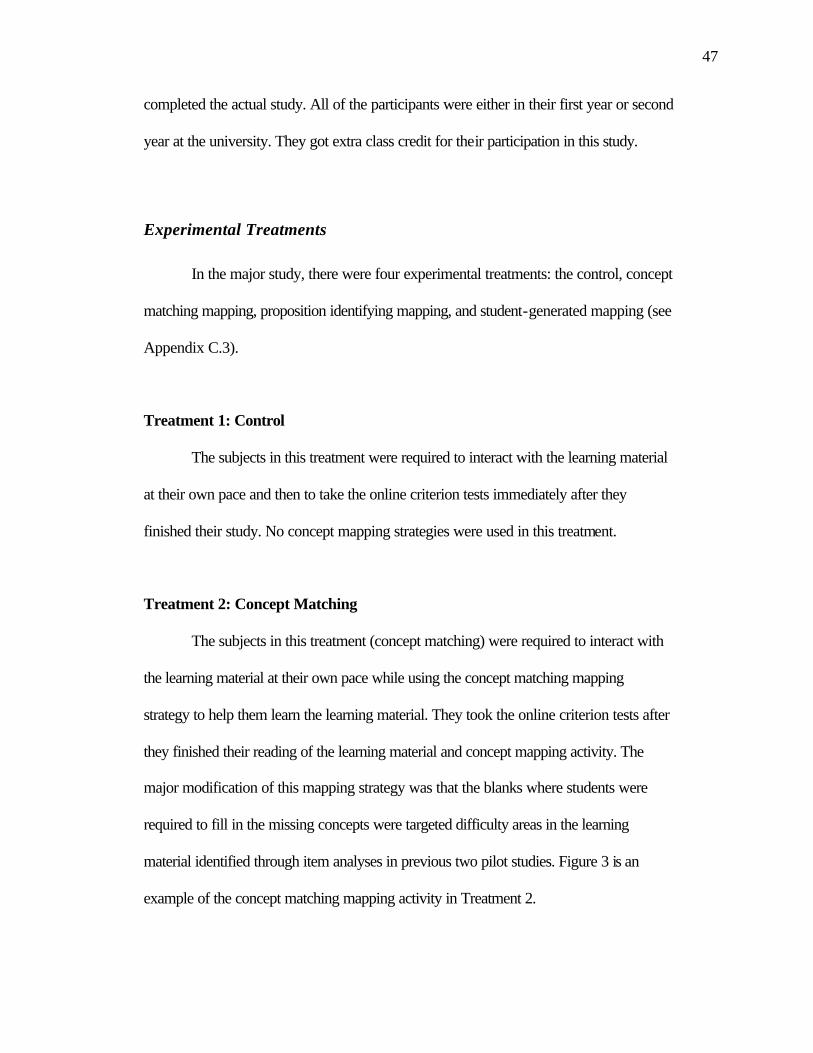
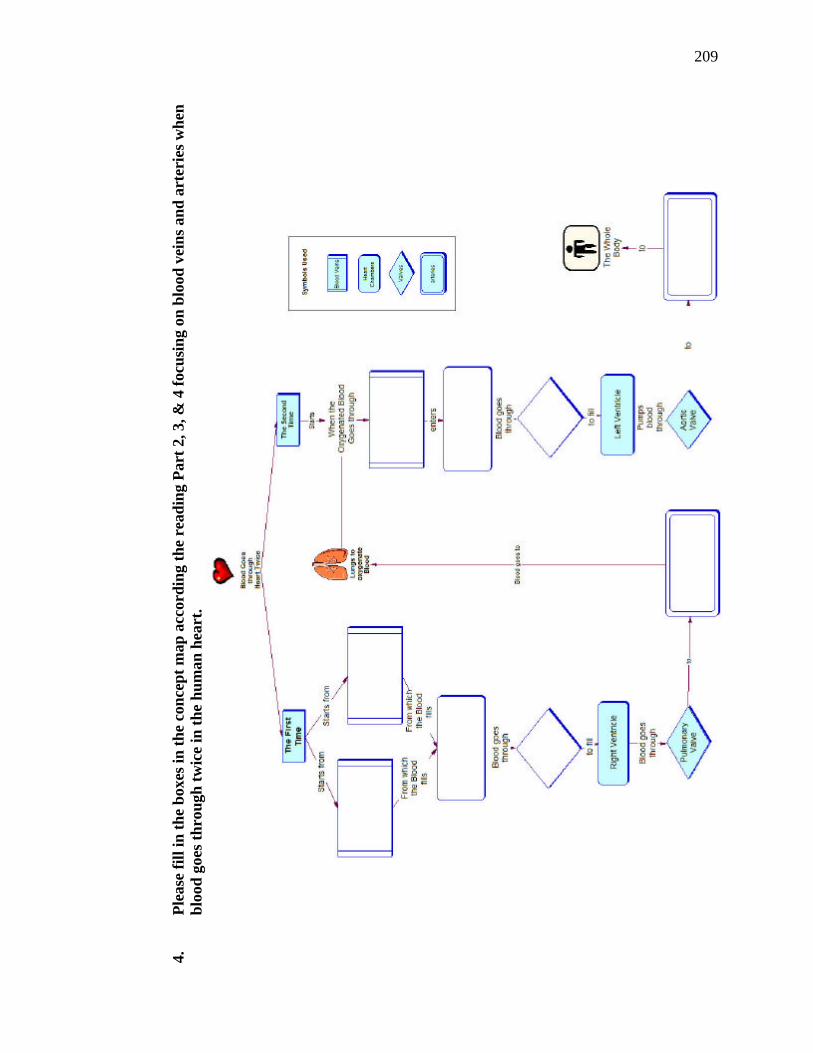
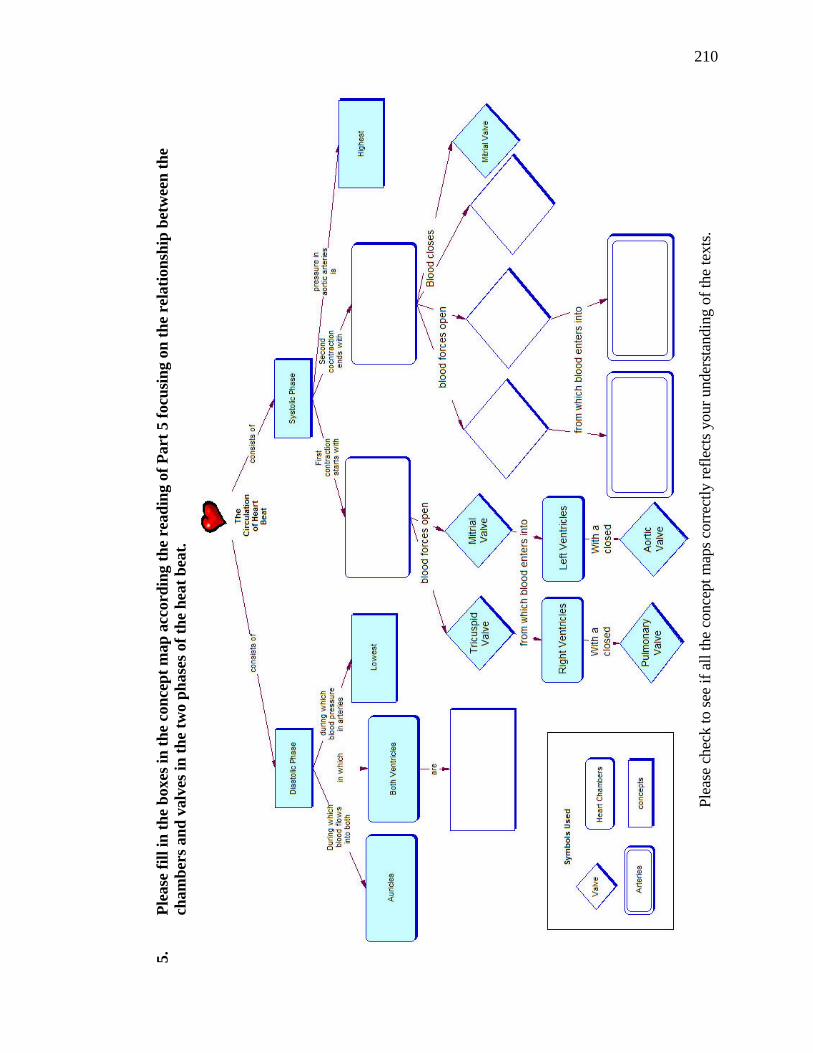
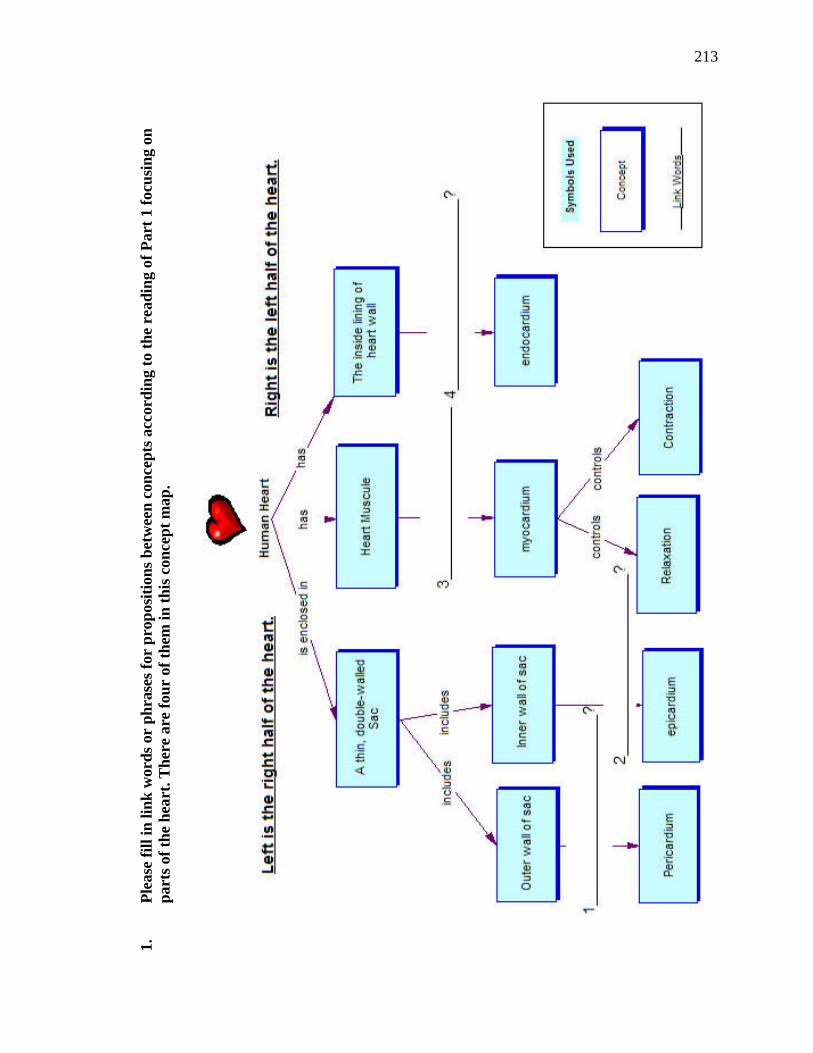
Figure 3. Sample mapping activities for Treatment 2....................................................... 48
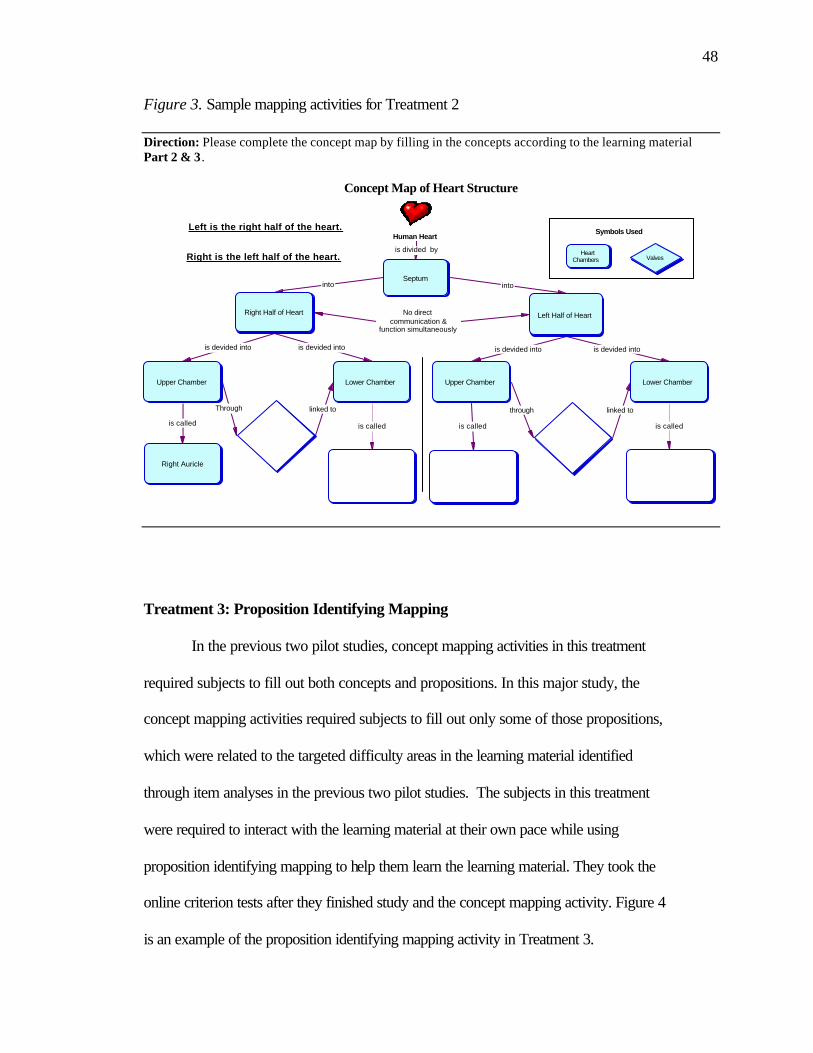
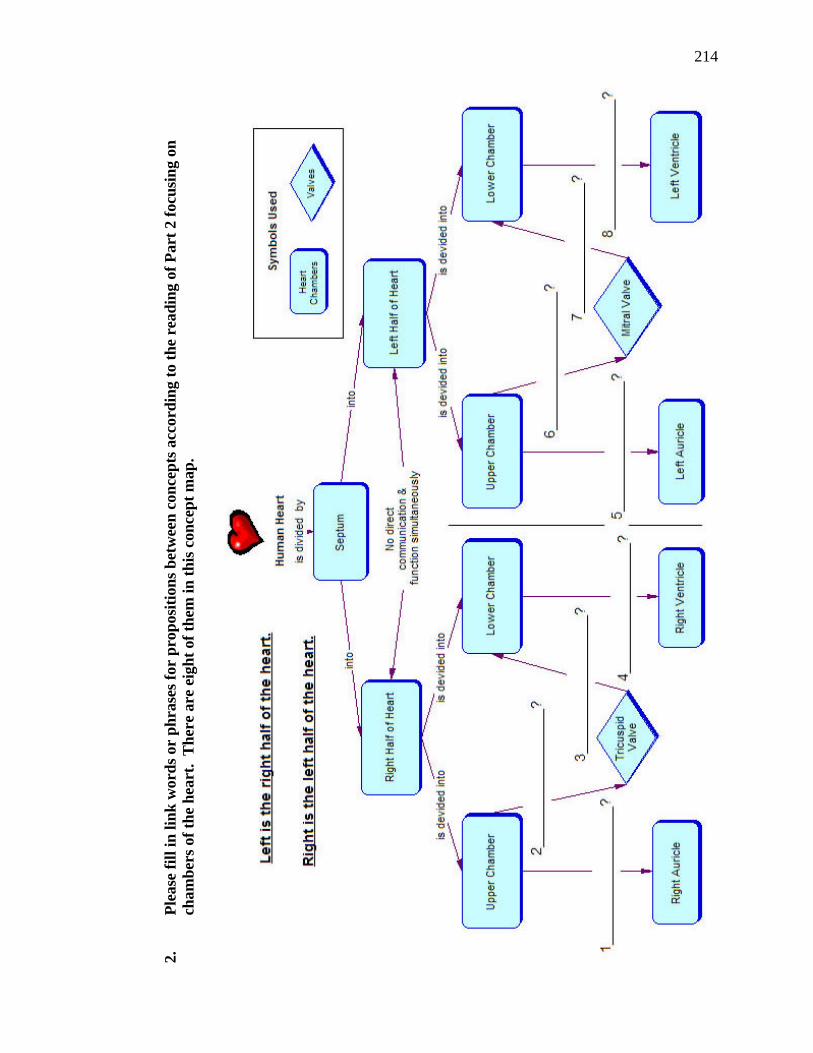
Figure 4. Sample mapping activities for Treatment 3....................................................... 49
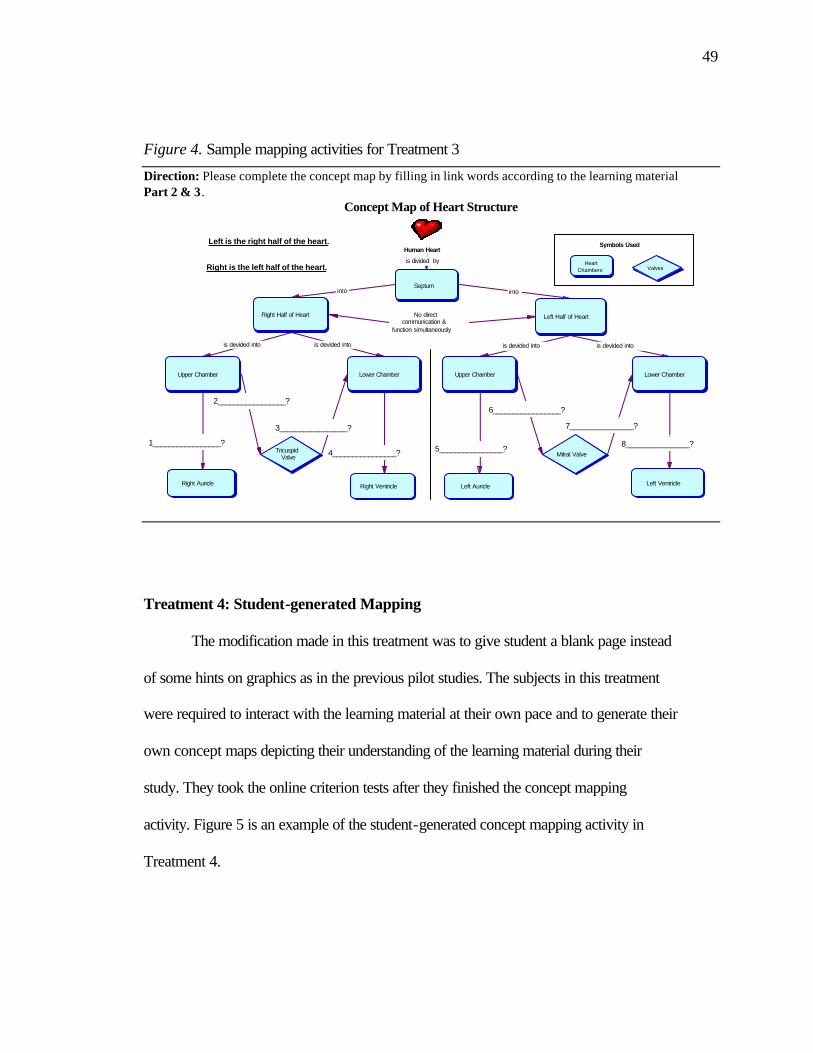
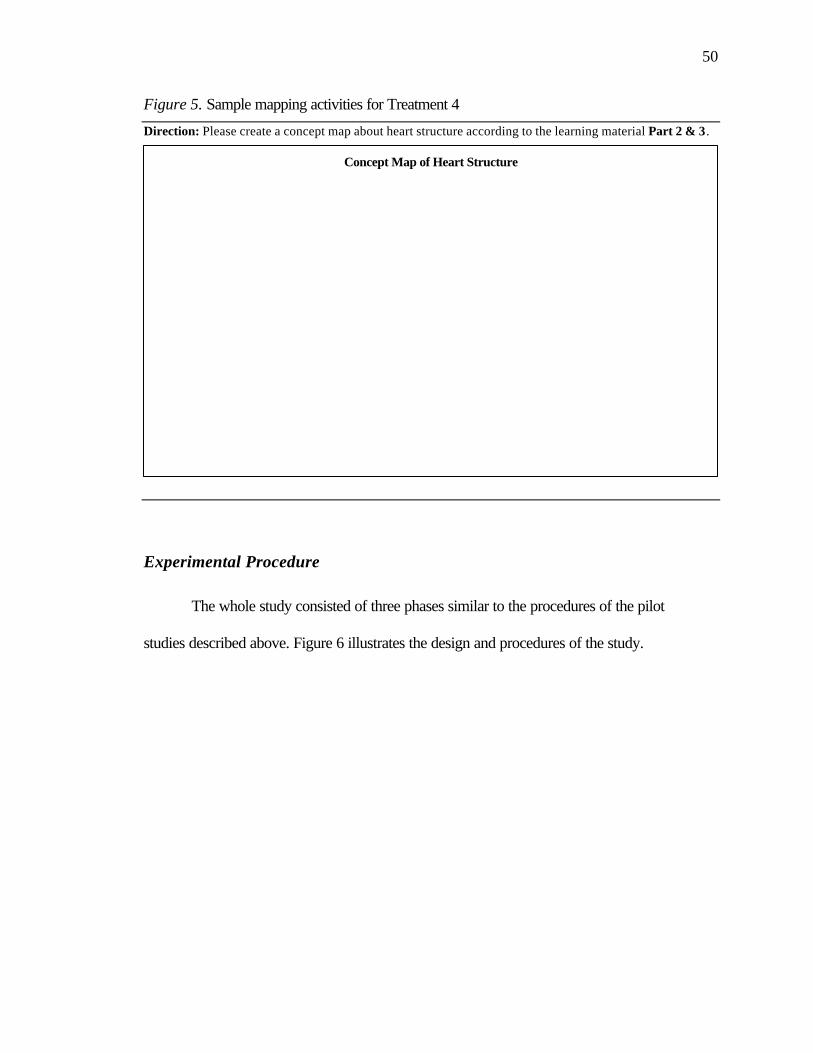
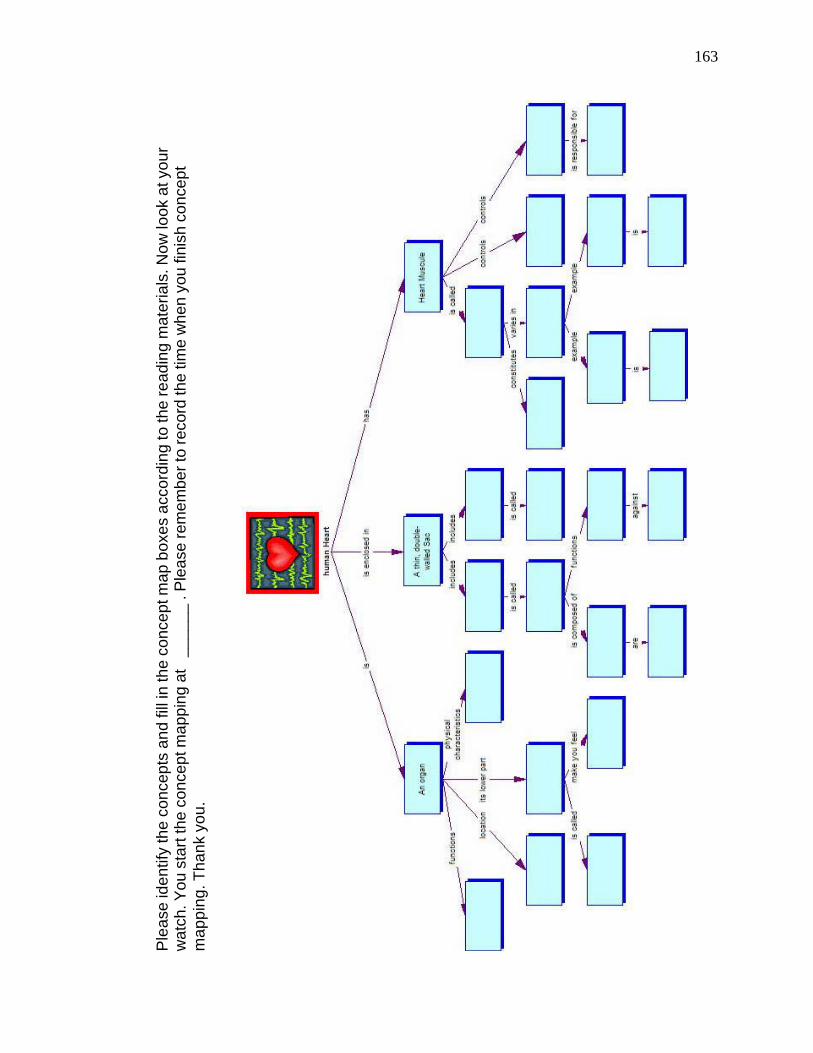
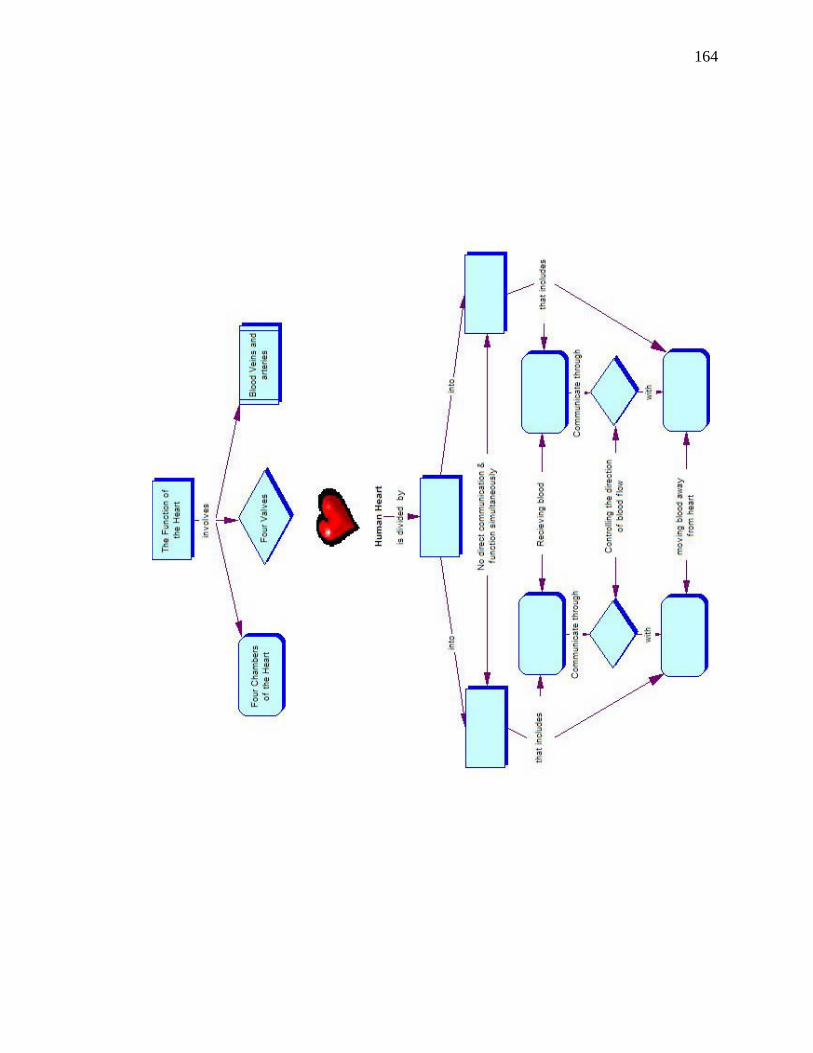
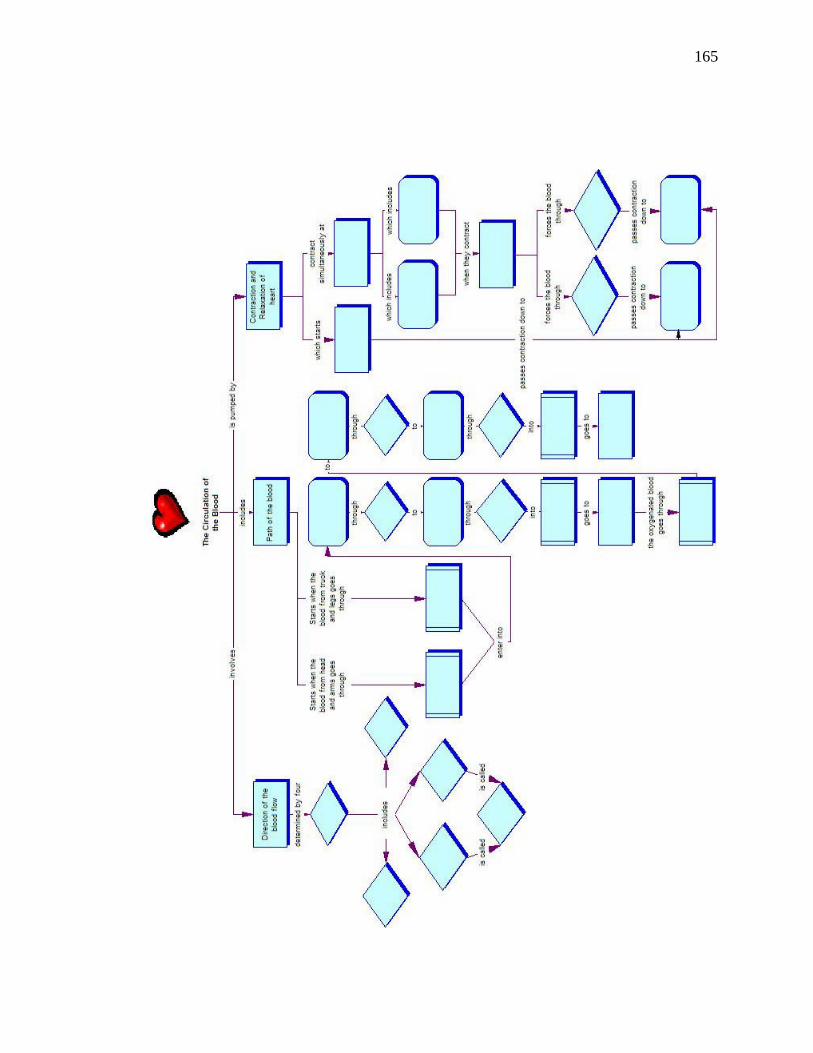
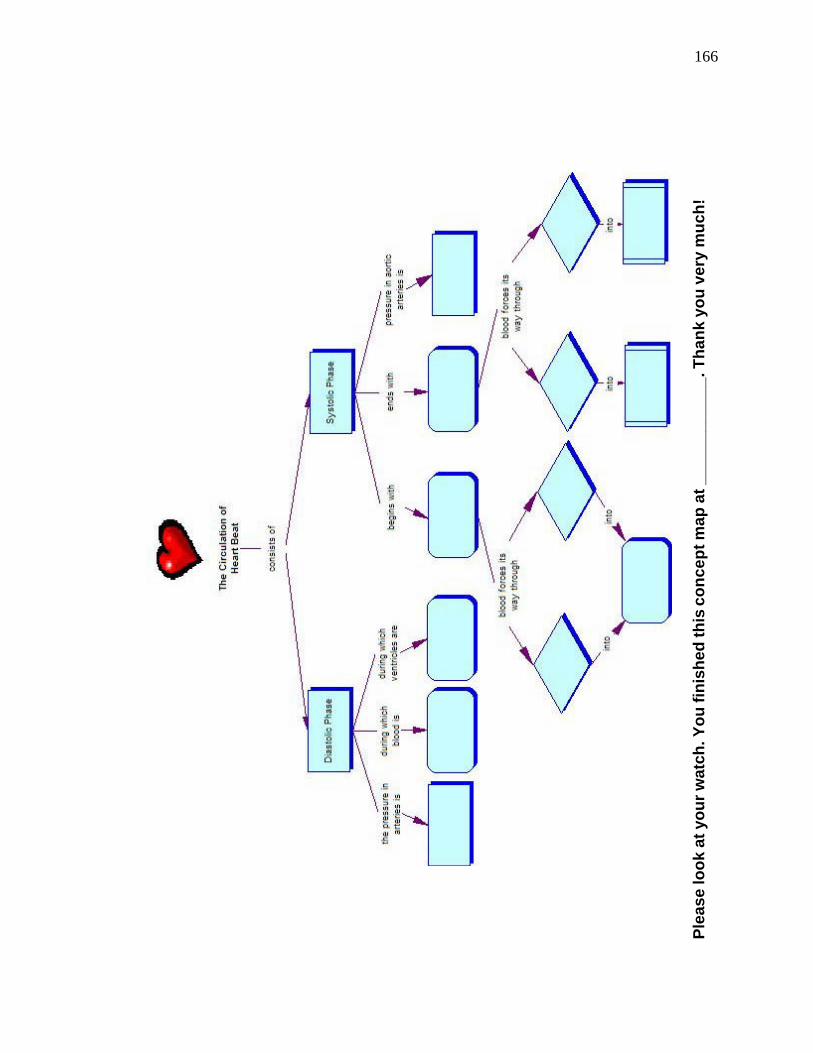
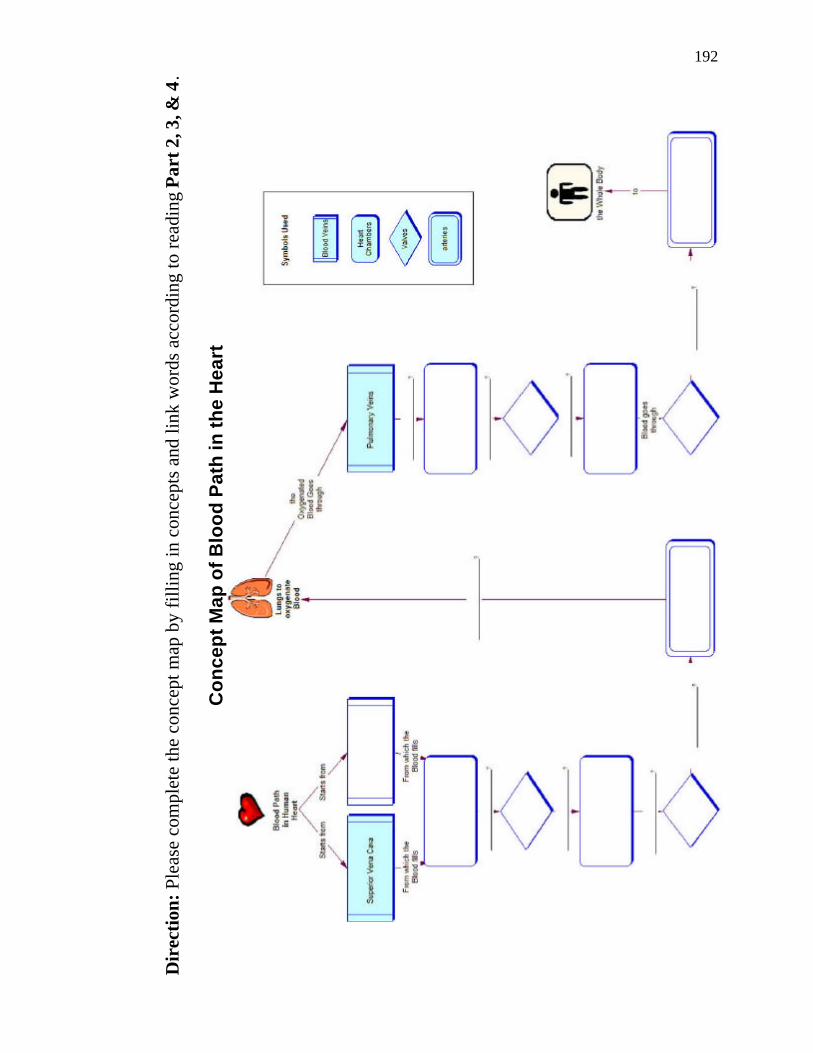
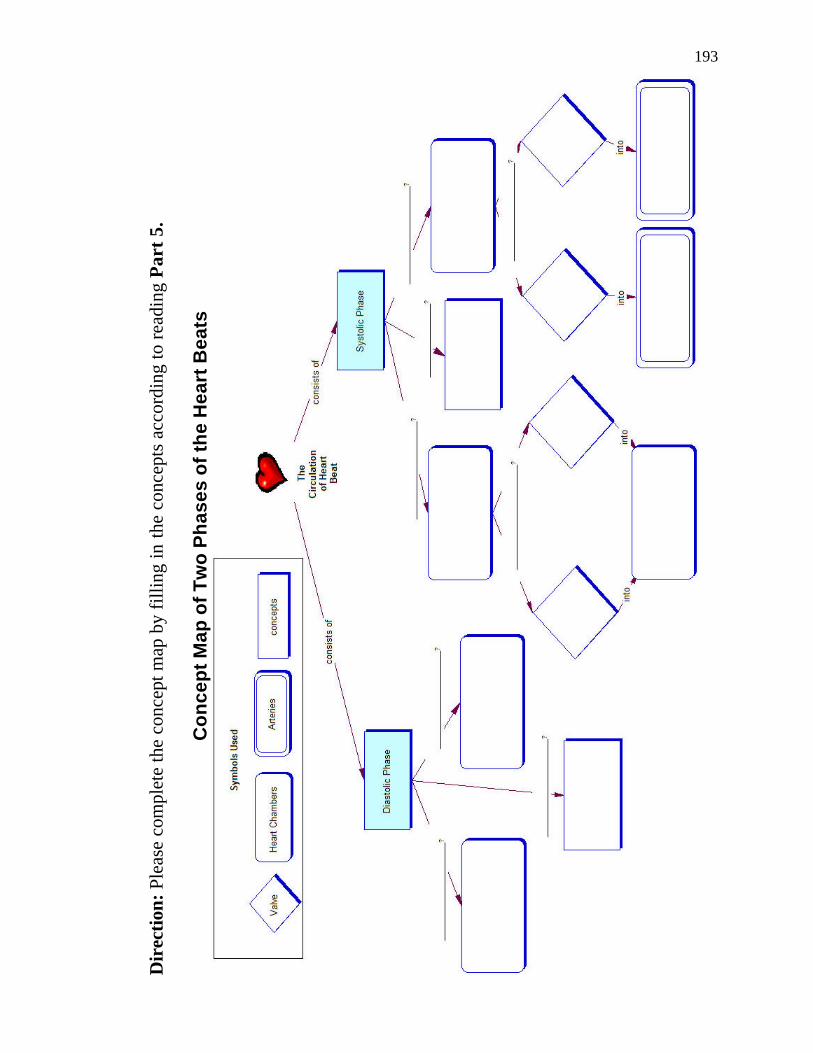
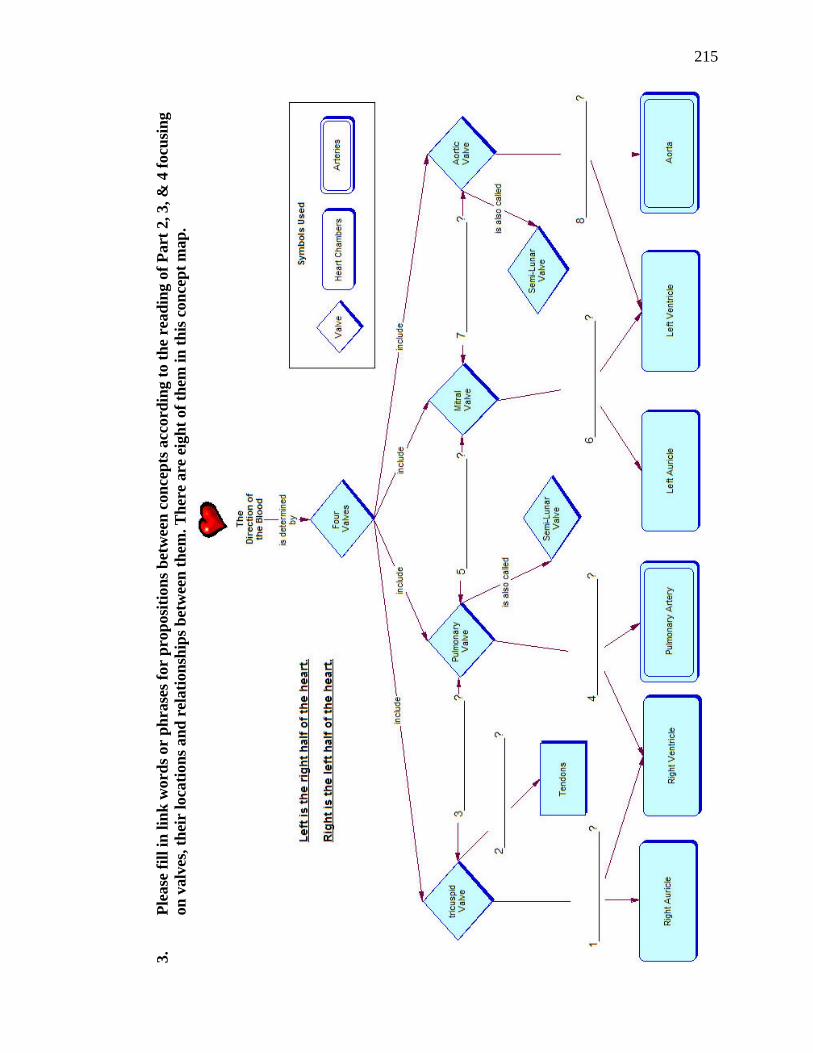
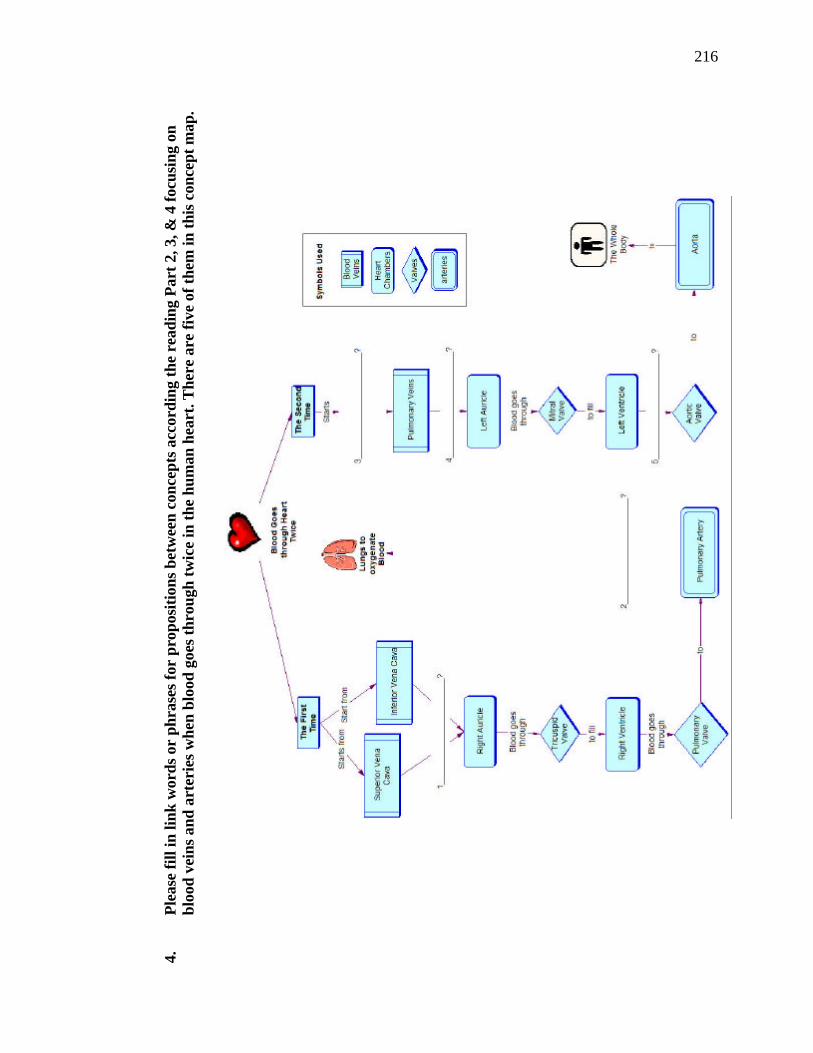
Figure 5. Sample mapping activities for Treatment 4....................................................... 50
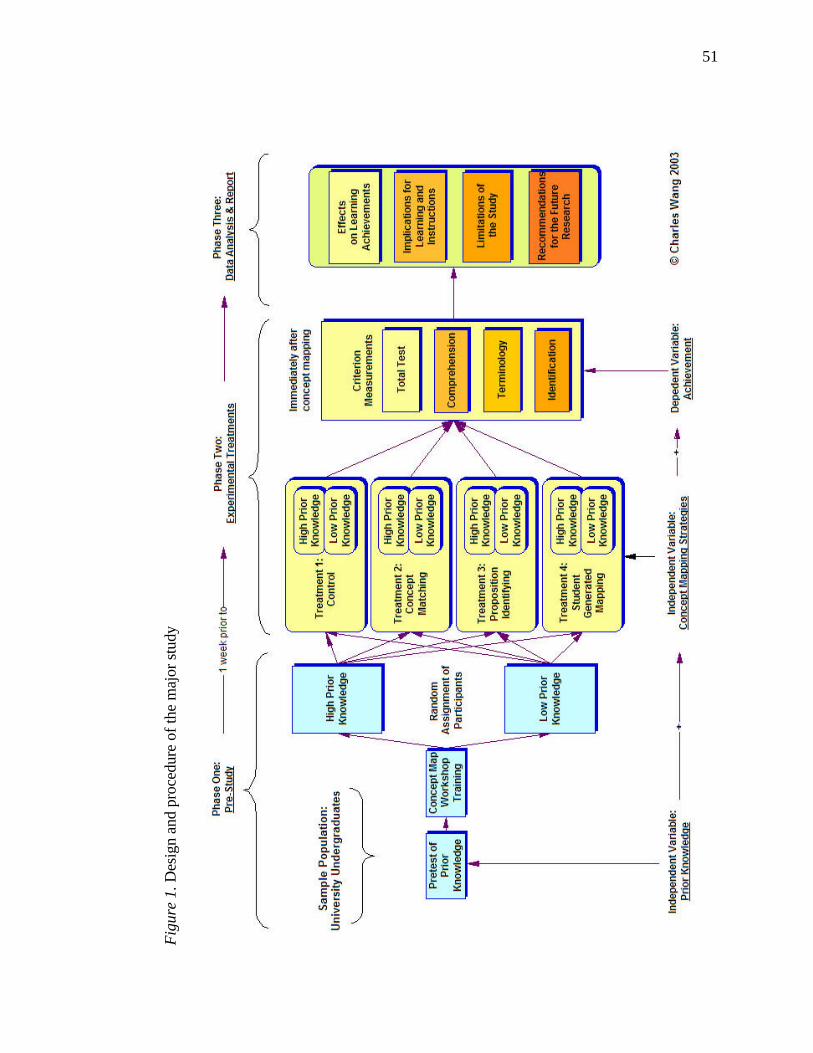
Figure 6. Design and procedure of the major study ………………........…………………..51
Figure 7. Achievement on the criterion tests for each treatment (10 test items) .............. 82
Figure 8. Achievement on the criterion tests for each treatment (20 test items) .............. 83
Figure 9. Achievement on the criterion tests for each treatment in
the second pilot study........................................................................................ 83
x
ACKNOWLEDGMENTS
I would like to express my heartfelt thanks to Dr. Frank Dwyer, my advisor, thesis chair, and my mentor, for his enlightening instruction, quality guidance, standby support and endless care during my dissertation research and throughout my academic study at Penn State. He has taught me through his deeds not only the knowledge and skills needed in instructional systems but also a strong sense of duty and responsibility of an educator. His instruction and advice will guide me for the rest of my life both as a learner and as an educator! I would like to thank sincerely my dissertation committee member and my former advisor, Dr. Barbara Grabowski, for her enlightening instruction, insightful advice, and sharp critique with detailed and valuable feedbacks on my course work and dissertation research! Being skeptical and analytical, being accurate and specific, and being innovative, imaginative and persistent in research has deeply rooted in my mind and I truly thank her for that! I would thank sincerely Dr. Kyle Peck, my committee member, for his precious advice on my research to make it significantly different. I truly appreciate his effort to make his time always available to me. His vision of educational technology in education reform, his enthusiasm in educational technology research, and his informative instruction has always been my source of encouragement and inspiration! I would thank sincerely Dr. Edgar Yoder, my committee member and course professor in statistics, for his instruction and guidance both in and outside statistics. I cannot imagine the completion of this dissertation without him. Moreover, he, like my other committee members, has come to show me how an educator can positively and significantly impact the life of others. I thank him truly for going extra miles to help me! My sincere gratitude goes to Dr. William Harkness and Dr. Rayne Sperling for their critical and priceless support, which has laid a corner stone in my dissertation study. I can never thank them enough for providing help when I was in despair. Special thanks go to Dr. Catherine Augustine and Nancy Crowder. Throughout my study at Penn State, they have alwasys been there when I need their help. I thank them sincerely for being thoughtful, cheerful and helpful. Their care and support are treasures in my memory! I would also thank my colleagues in the Instructional Systems Program for their invaluable help in my study, especially Wei-Fan Chen, JiSook Chung, Valerie Dudley, Joel Galbraith, Noela Haughton, Wenyi Ho, Daisy Wen-Lan Hsieh, Michelle Meng-Feng Hsieh, Heeyoung Kim, Younghoon Kim, Dong Li, Ying-Hsiu Liu, Jing Mao, Karleen Mason, Melisande McCrae, Steven McGriff, John Nworie, Beth Rajan Sockman, Hae-Deok
xi
Song, Jeff Swain, Shao-Wei Wu, Ying Xie, and Julie Li Zhu. I would also like to thank Huifen Lin and Feng-Feng Ke for reviewing my dissertation and providing valuable feedback for revision. I would like to thank my friends Peter and Sara Pfaffenroth, and Elaine Jackal in New Jersey for their care and support. Their warm hearts made me feel secure in those days of uncertainty. I thank them for their friendship and for being there for me! I would also like to thank my professors at the Georgia Southern University, Dr. T. C. Chen, Dr. Michael Richardson, Dr. Ron Davison, Dr. Kenneth Clark and Dr. Randy Carlson for their support in my effort to pursue the Ph.D. in instructional systems. I would especially like to thank Dr. Kenneth Clark for leading me into this wonderful field of learning! My colleagues and friends in China have always been so close to me during my study in the United States! I want to thank all of them, especially my mentors, Shuhuai Zhang, Qishu He, and my firends at Intensive Language Training Center of Sichuan University, for their endless care and constant support in my pursuit of the Ph.D. degree. This dissertation is a tribute to my parents, Xueqing Wang (Father) and Qinghua Li (Mother). Their tremendous love has sustained me in my effort to obtain the Ph.D. degree. I thank them for educating me and inspiring me in pursuing of knowledge and professional development! I thank my Father for showing me how to be positive, determined and persistent when encountering difficulty in work. I thank my Mother for teaching me how to be patient, understanding and considerate for others in life. Special affectionate thanks go to my brother, Xixue Wang, and my sister Xiaohua Wang for being so supportive and understanding. I can never thank them enough for taking up my responsibility at home and fulfilling it unconditionally. In spite of being extremely busy in their own work, both of them have spent a great deal of time and energy to take care of my parents during my study in the United States. They are my source of comfort while I am away from home! Last but not the least, my affectionate thanks go to my wife, Rong Xie, for accompanying me through the journey, and sharing my stresses and frustrations. I thank her for her understanding, patience, and support, and I thank her for her love and sacrifice! I am truly blessed with so many wonderful people in my life. They have helped me and encouraged me in my pursuit of the degree. They are too many to mention in this limited space. May God bless all of them!
1
Chapter 1
INTRODUCTION
Learning is a fascinating phenomenon that has been the target of study for many
centuries. People study it from various perspectives and their endeavors have resulted in
different theories about learning. Despite all of the differences, these learning theories
share the same goal -- to better our understanding of what learning is, how the learning
takes place, and, ultimately, how the learning can be enhanced and improved. This
dissertation reflects my efforts to explore this fascinating phenomenon of learning. It is
about the instructional effects of prior knowledge and three concept mapping strategies in
facilitating achievement of different educational objectives.
Statement of Problem
Cognitive learning theory contends that learning is a potential change resulting
from information processing (Walker, 1996). Information processing is the theoretical
framework for describing the mental events that occur in humans as information in the
form of stimulus is received, processed, and either stored for later use or lost (R. Gagne,
1985). How the information is processed during learning influences information retrieval
and recall and, consequently, the ability of the learner to apply the information in his/her
later use.
Ausubel (1968) proposed assimilation theory and advocated meaningful learning.
Meaningful learning is a process in which learners purposefully relate the perceived new
2
information to an existing relevant aspect of their knowledge structures. Meaningful
learning, according to Ausubel (1968), occurs when a learner consciously links new
knowledge to what the learner already knows and makes that piece of information
“meaningful” to himself.
What a learner already knows prior to instruction is sometimes defined as prior
knowledge. Jonassen and Grabowski (1993) defined prior knowledge as the ability,
knowledge, and skills possessed by the learner before instruction. This prior knowledge is
stored in existing mental models or schemata and used in the interpretation and
assimilation of new knowledge (Anderson, 1984; Driver, 1988).
During learning, various learning strategies can be applied to assist information
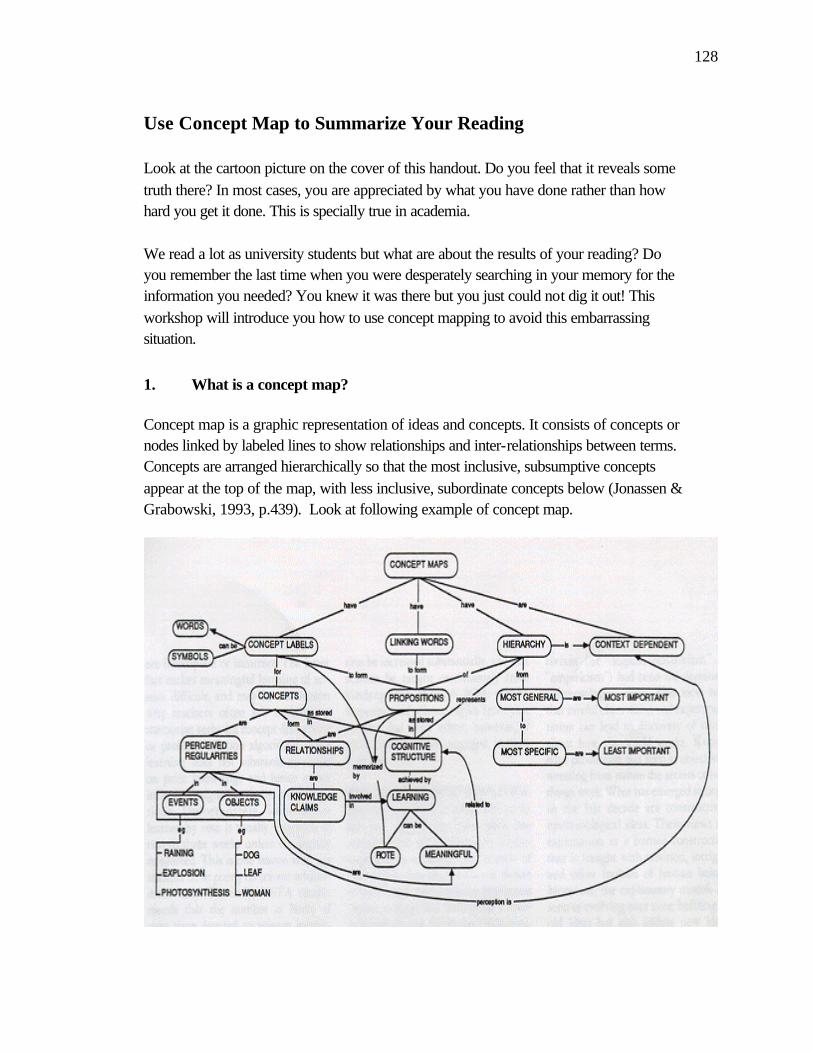
processing. Concept mapping is one of them. “A concept map is a schematic device for
representing a set of concept meanings embedded in a framework of propositions”
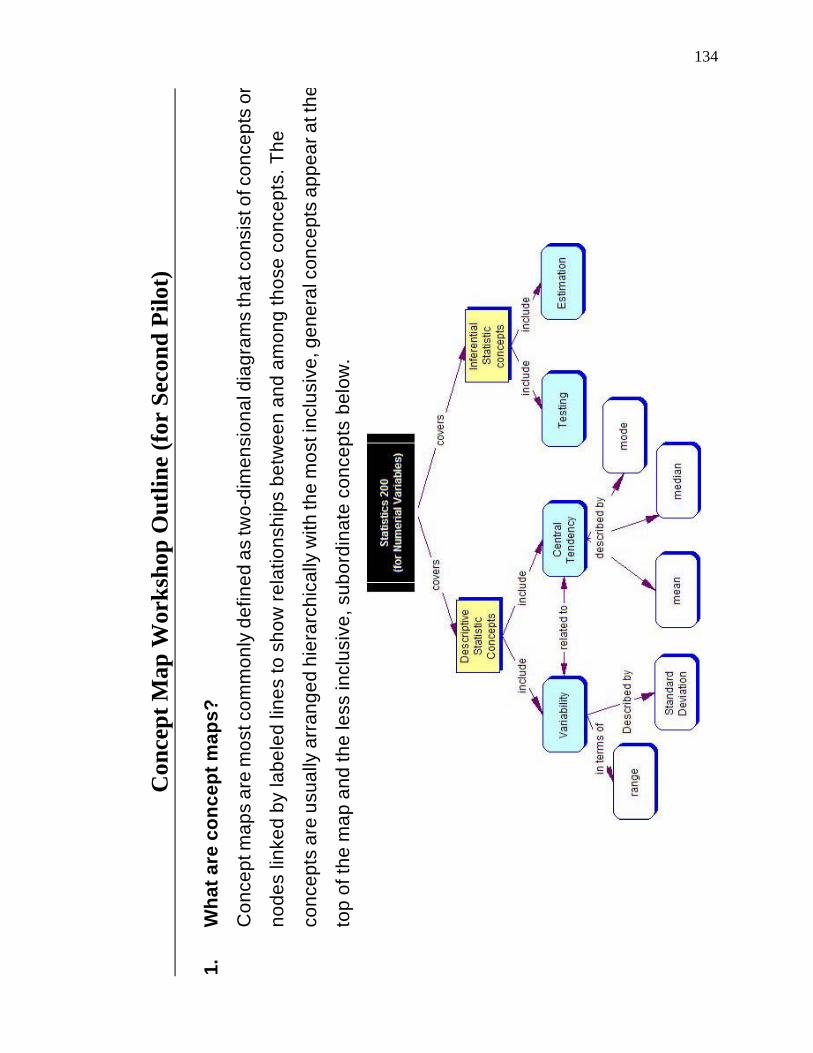
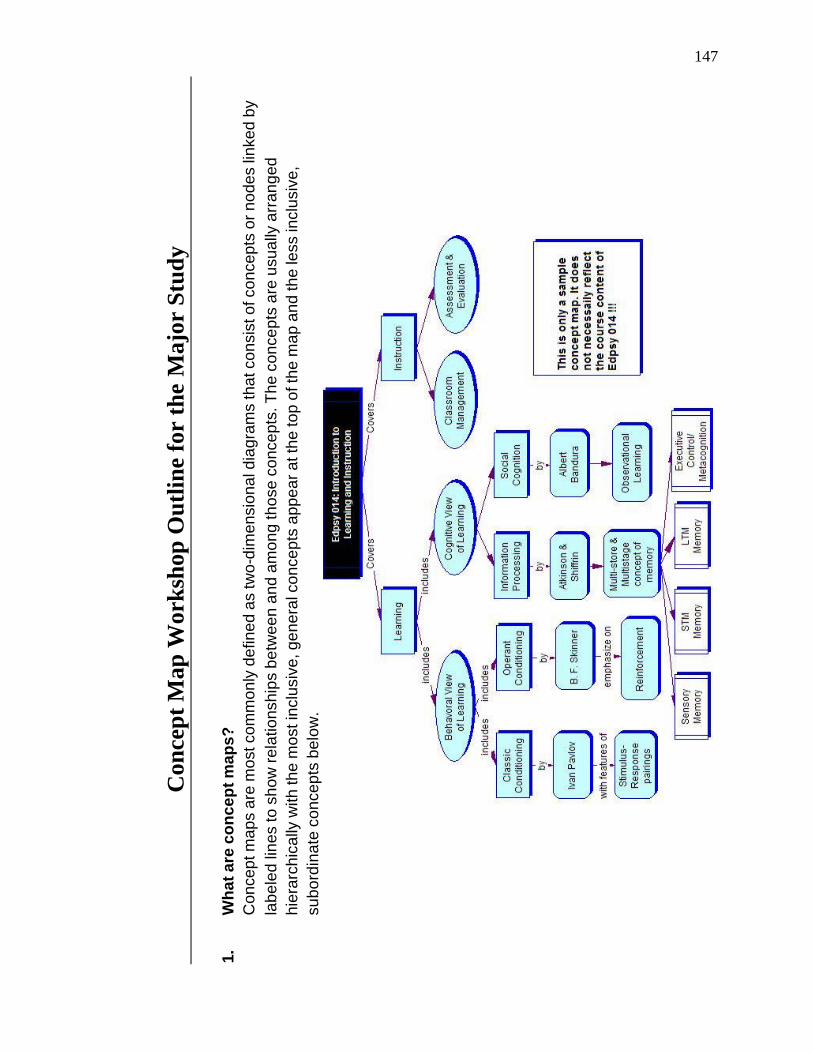
(Novak & Gowin, 1984, 15). Concept maps are most commonly defined as graphic
representations of knowledge of a domain. A concept map consists of a set of nodes
representing concepts, objects, or actions connected by directional links that define the
relationships between and among those nodes (Alpert & Grueneberg, 2000). In concept
maps, concepts are arranged hierarchically so that the most inclusive, general concepts
appear at the top of the map, with less inclusive, subordinate concepts below (Jonassen &
T 1: Control T 2: Concept matching mapping T 3: Proposition identifying mapping T 4: Student-generated concept mapping X = No significances found between this group and the other groups. Alpha =.05.
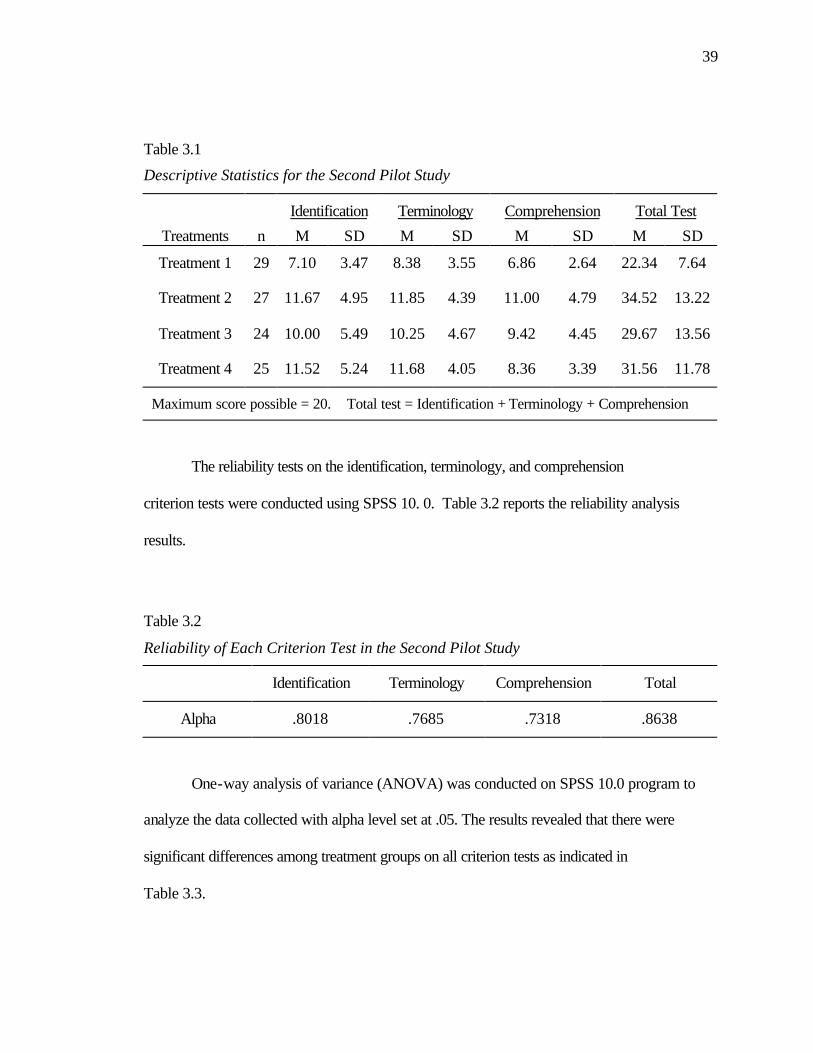
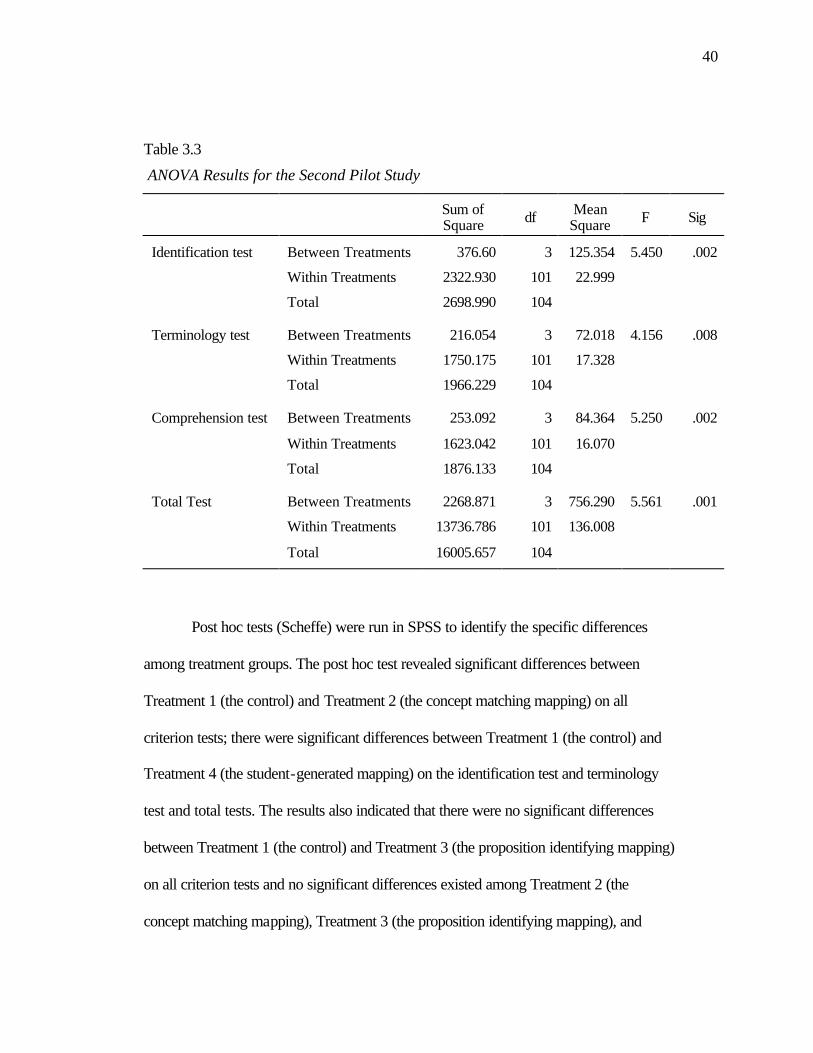
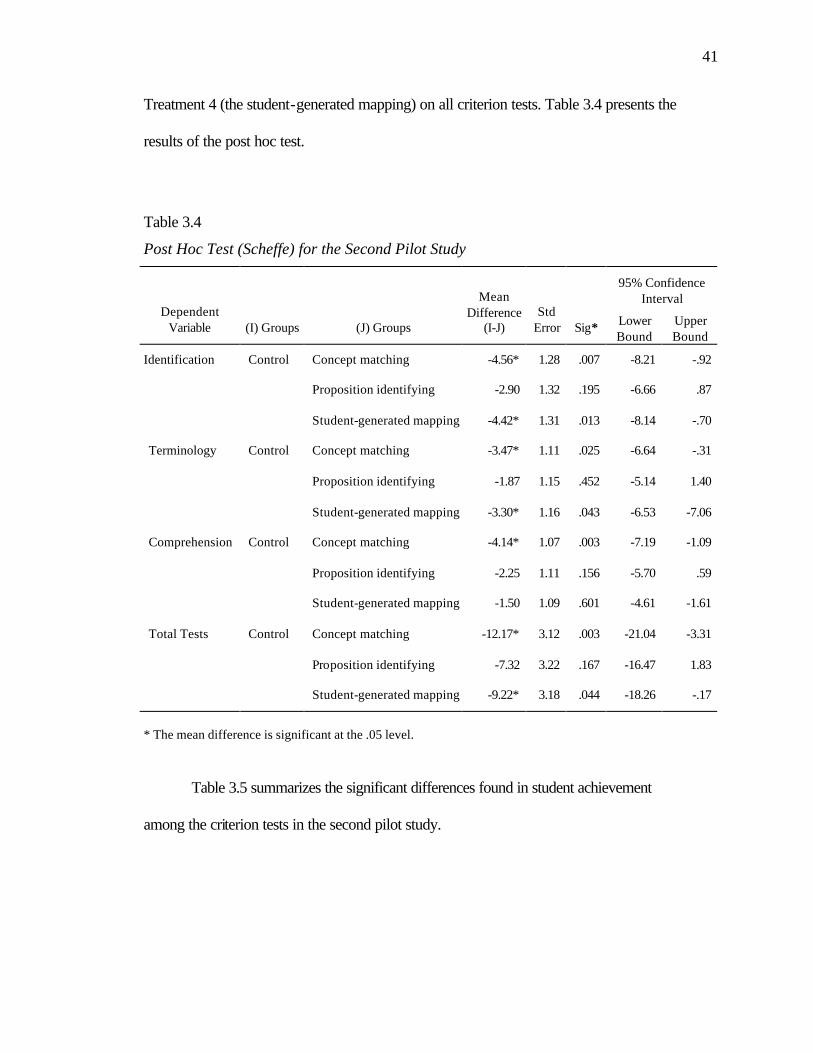
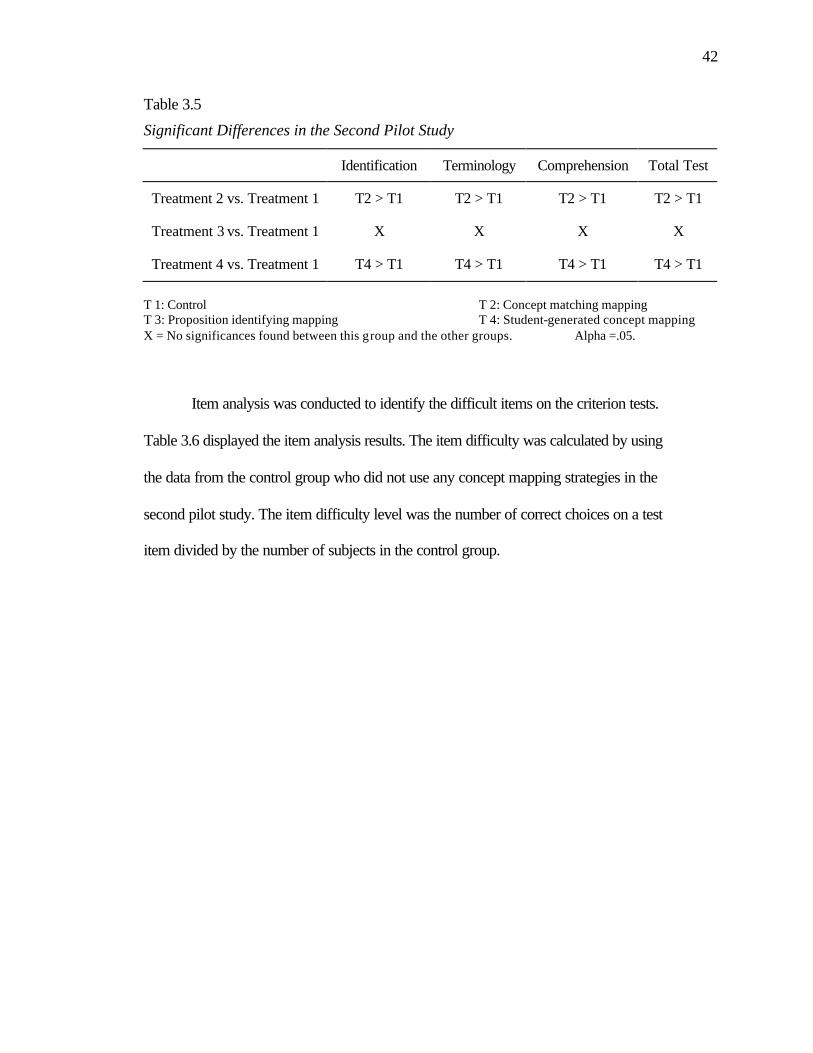
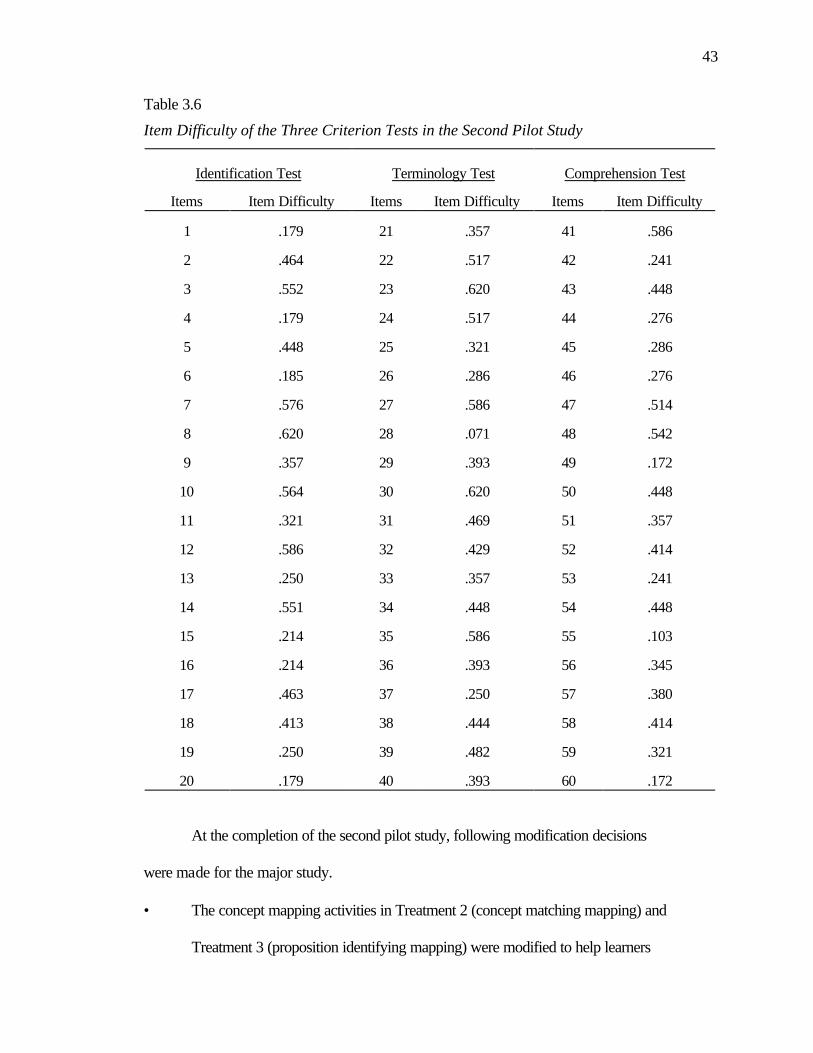
Item analysis was conducted to identify the difficult items on the criterion tests.
Table 3.6 displayed the item analysis results. The item difficulty was calculated by using
the data from the control group who did not use any concept mapping strategies in the
second pilot study. The item difficulty level was the number of correct choices on a test
item divided by the number of subjects in the control group.
43
Table 3.6
Item Difficulty of the Three Criterion Tests in the Second Pilot Study
Identification Test Terminology Test Comprehension Test
T 4 46 22.46 3.99 4.57 2.41 5.15 2.75 4.15 1.72 13.87 6.02 T 1: Control T 2: Concept matching mapping T 3: Proposition identifying mapping T 4: Student-generated concept mapping * The maximum score for the Test of Prior knowledge is 36. * The maximum score for each dependent criterion test is 10 and the maximum score for total test is 30.
60
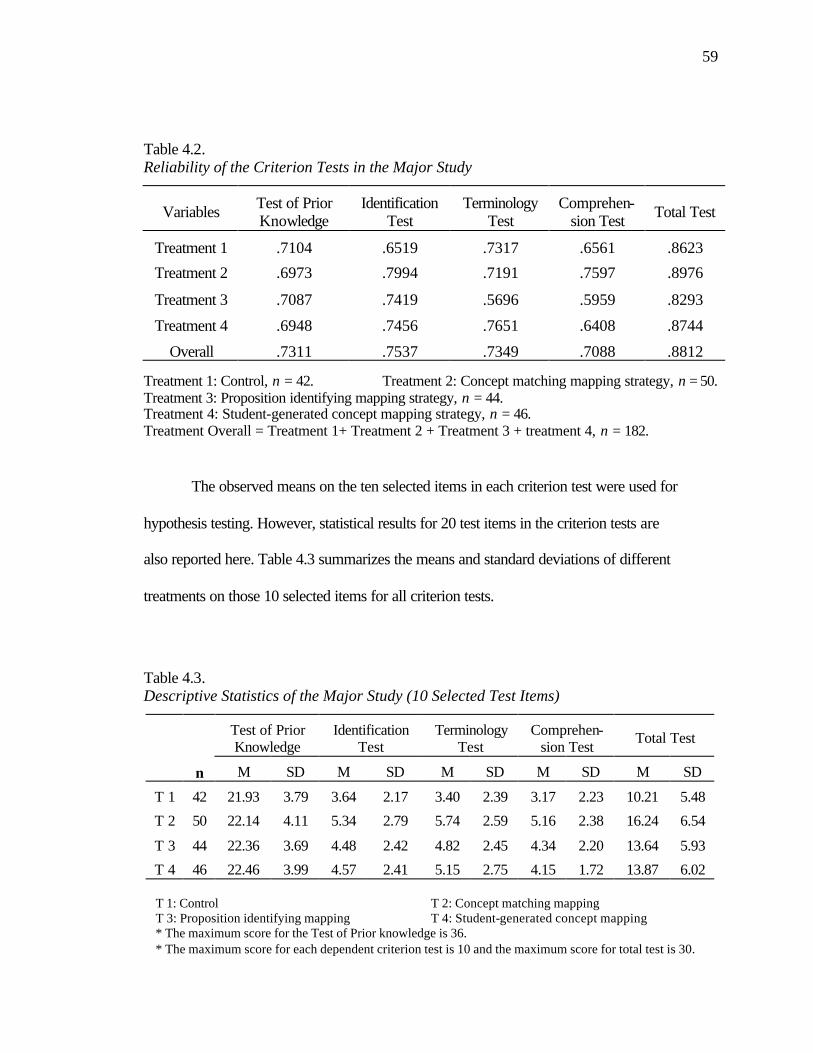
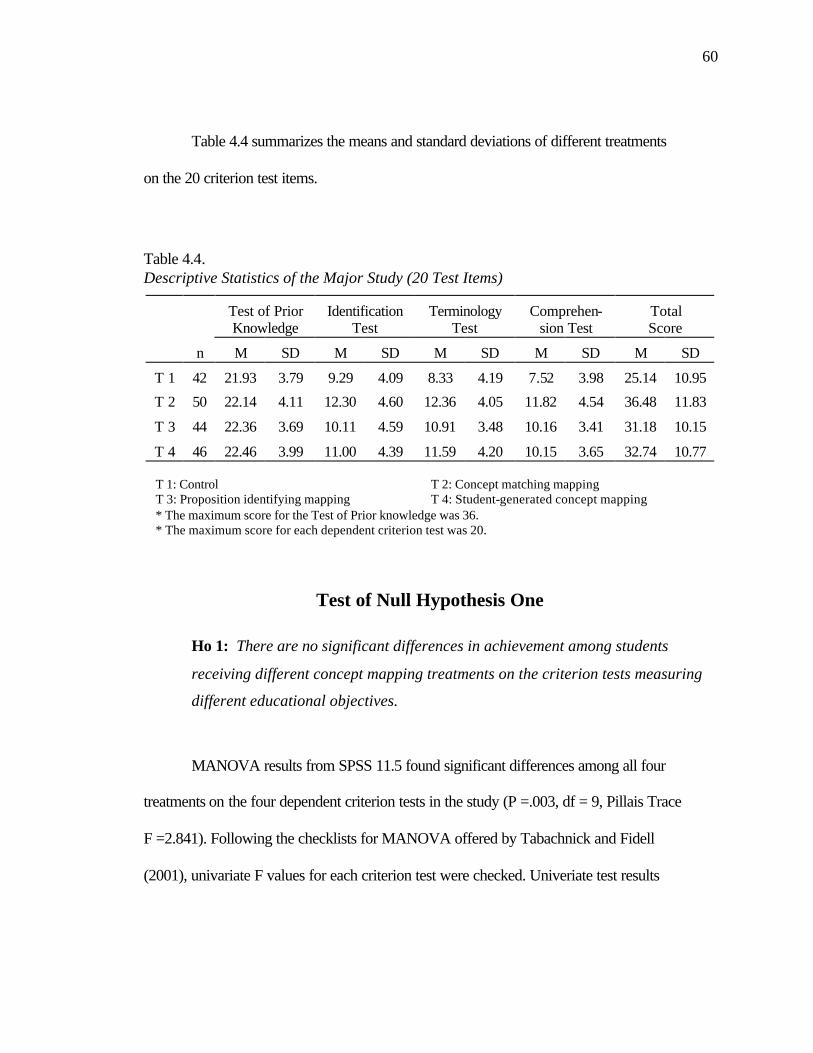
Table 4.4 summarizes the means and standard deviations of different treatments
on the 20 criterion test items.
Table 4.4. Descriptive Statistics of the Major Study (20 Test Items)
T 4 46 22.46 3.99 11.00 4.39 11.59 4.20 10.15 3.65 32.74 10.77 T 1: Control T 2: Concept matching mapping T 3: Proposition identifying mapping T 4: Student-generated concept mapping * The maximum score for the Test of Prior knowledge was 36. * The maximum score for each dependent criterion test was 20.
Test of Null Hypothesis One
Ho 1: There are no significant differences in achievement among students
receiving different concept mapping treatments on the criterion tests measuring
different educational objectives.
MANOVA results from SPSS 11.5 found significant differences among all four
treatments on the four dependent criterion tests in the study (P =.003, df = 9, Pillais Trace
F =2.841). Following the checklists for MANOVA offered by Tabachnick and Fidell
(2001), univariate F values for each criterion test were checked. Univeriate test results
61
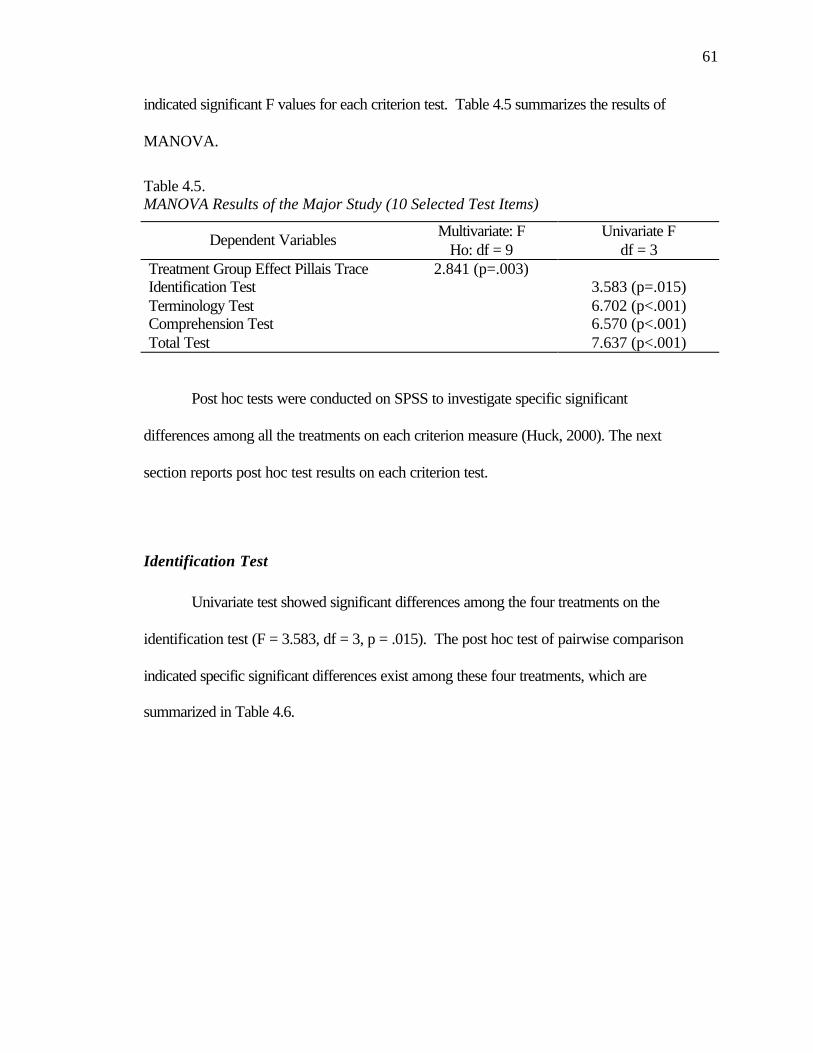
indicated significant F values for each criterion test. Table 4.5 summarizes the results of
MANOVA.
Table 4.5. MANOVA Results of the Major Study (10 Selected Test Items)
Dependent Variables Multivariate: F Ho: df = 9
Univariate F df = 3
Treatment Group Effect Pillais Trace 2.841 (p=.003) Identification Test 3.583 (p=.015) Terminology Test 6.702 (p<.001) Comprehension Test 6.570 (p<.001) Total Test 7.637 (p<.001)
Post hoc tests were conducted on SPSS to investigate specific significant
differences among all the treatments on each criterion measure (Huck, 2000). The next
section reports post hoc test results on each criterion test.
Identification Test
Univariate test showed significant differences among the four treatments on the
identification test (F = 3.583, df = 3, p = .015). The post hoc test of pairwise comparison
indicated specific significant differences exist among these four treatments, which are
summarized in Table 4.6.
62
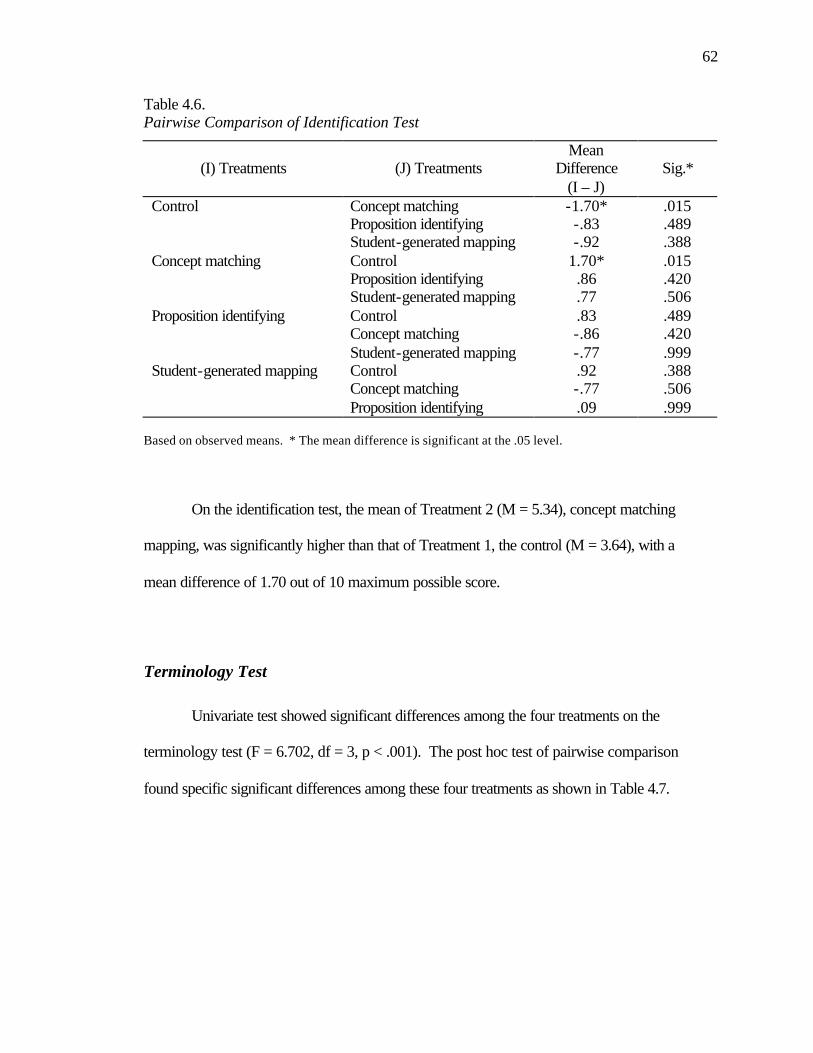
Table 4.6. Pairwise Comparison of Identification Test
(I) Treatments
(J) Treatments
Mean Difference
(I – J) Sig.*
Control Concept matching Proposition identifying Student-generated mapping
-1.70* -.83 -.92
.015
.489
.388 Concept matching Control
Proposition identifying Student-generated mapping
1.70* .86 .77
.015
.420
.506 Proposition identifying Control
Concept matching Student-generated mapping
.83 -.86 -.77
.489
.420
.999 Student-generated mapping Control
Concept matching Proposition identifying
.92 -.77 .09
.388
.506
.999 Based on observed means. * The mean difference is significant at the .05 level.
On the identification test, the mean of Treatment 2 (M = 5.34), concept matching
mapping, was significantly higher than that of Treatment 1, the control (M = 3.64), with a
mean difference of 1.70 out of 10 maximum possible score.
Terminology Test
Univariate test showed significant differences among the four treatments on the
terminology test (F = 6.702, df = 3, p < .001). The post hoc test of pairwise comparison
found specific significant differences among these four treatments as shown in Table 4.7.
63
Table 4.7. Pairwise Comparison of Terminology Test
(I) Treatments
(J) Treatment
Mean Difference
(I – J) Sig.*
Control Concept matching Proposition identifying Student-generated mapping
-2.34* -.1.41 -1.75*
.000
.091
.019 Concept matching Control
Proposition identifying Student-generated mapping
2.34* .92 .59
.000
.388
.738 Proposition identifying Control
Concept matching Student-generated mapping
1.41 -.92 -.33
.091
.388
.943 Student-generated mapping Control
Concept matching Proposition identifying
1.75* -.59 .33
.019
.783
.943 Based on observed means * The mean difference is significant at the .05 level.
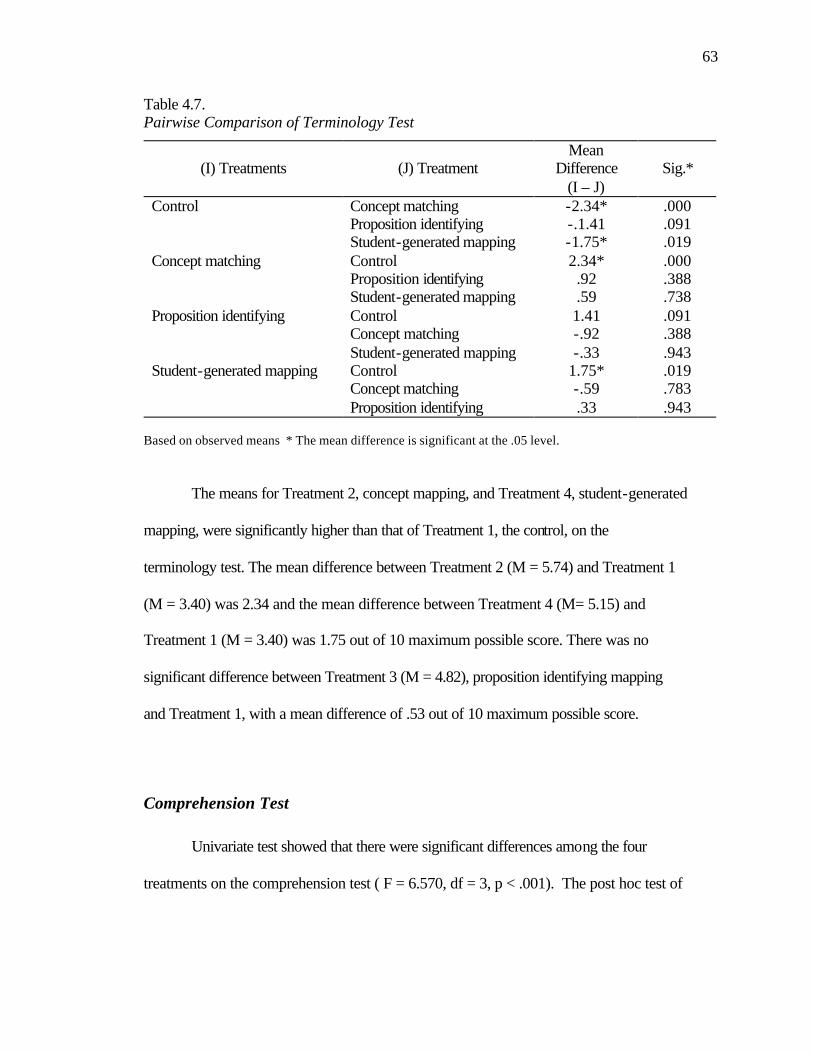
The means for Treatment 2, concept mapping, and Treatment 4, student-generated
mapping, were significantly higher than that of Treatment 1, the control, on the
terminology test. The mean difference between Treatment 2 (M = 5.74) and Treatment 1
(M = 3.40) was 2.34 and the mean difference between Treatment 4 (M= 5.15) and
Treatment 1 (M = 3.40) was 1.75 out of 10 maximum possible score. There was no
and Treatment 1, with a mean difference of .53 out of 10 maximum possible score.
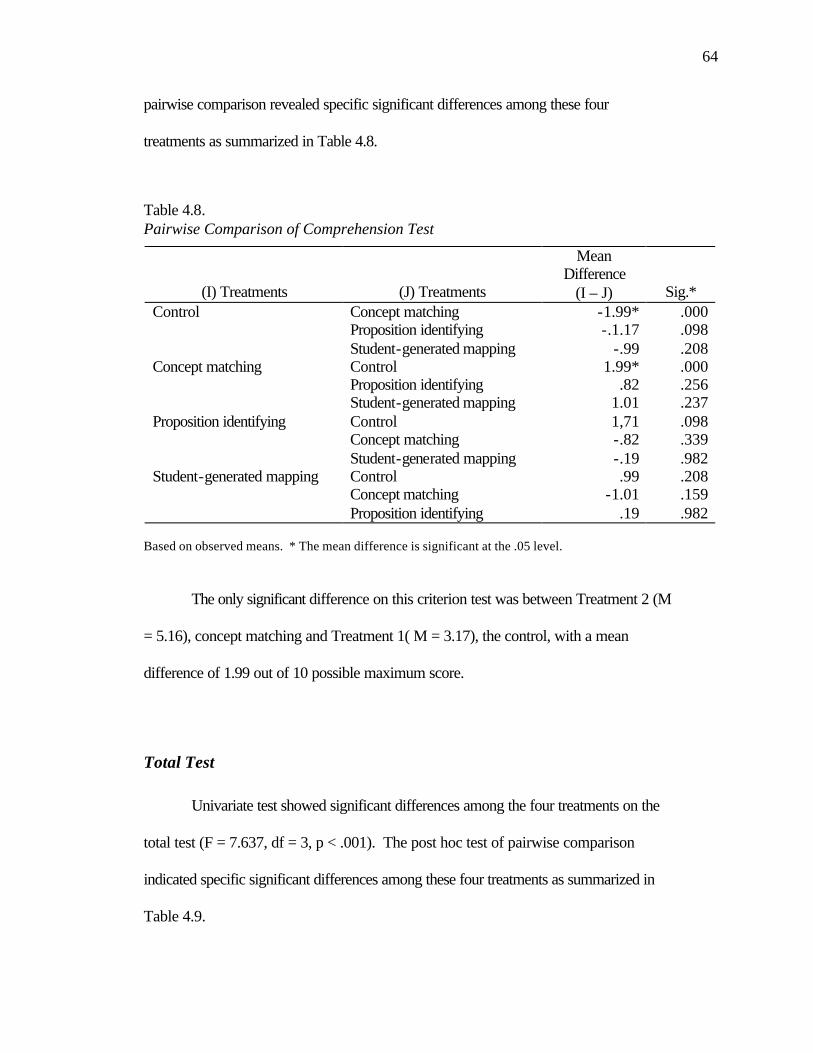
Comprehension Test
Univariate test showed that there were significant differences among the four
treatments on the comprehension test ( F = 6.570, df = 3, p < .001). The post hoc test of
64
pairwise comparison revealed specific significant differences among these four
treatments as summarized in Table 4.8.
Table 4.8. Pairwise Comparison of Comprehension Test
(I) Treatments
(J) Treatments
Mean Difference
(I – J) Sig.* Control Concept matching
Proposition identifying Student-generated mapping
-1.99* -.1.17
-.99
.000
.098
.208 Concept matching Control
Proposition identifying Student-generated mapping
1.99* .82
1.01
.000
.256
.237 Proposition identifying Control
Concept matching Student-generated mapping
1,71 -.82 -.19
.098
.339
.982 Student-generated mapping Control
Concept matching Proposition identifying
.99 -1.01
.19
.208
.159
.982 Based on observed means. * The mean difference is significant at the .05 level.
The only significant difference on this criterion test was between Treatment 2 (M
= 5.16), concept matching and Treatment 1( M = 3.17), the control, with a mean
difference of 1.99 out of 10 possible maximum score.
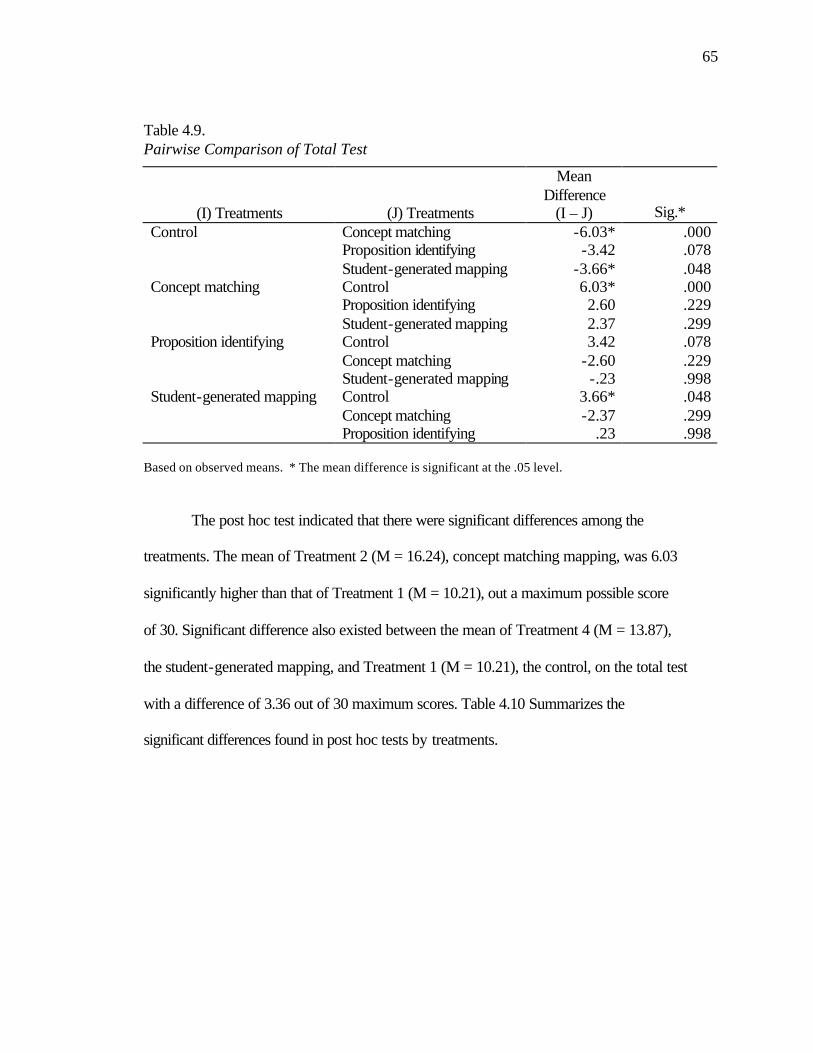
Total Test
Univariate test showed significant differences among the four treatments on the
total test (F = 7.637, df = 3, p < .001). The post hoc test of pairwise comparison
indicated specific significant differences among these four treatments as summarized in
Table 4.9.
65
Table 4.9. Pairwise Comparison of Total Test
(I) Treatments
(J) Treatments
Mean Difference
(I – J) Sig.* Control Concept matching
Proposition identifying Student-generated mapping
-6.03* -3.42 -3.66*
.000
.078
.048 Concept matching Control
Proposition identifying Student-generated mapping
6.03* 2.60 2.37
.000
.229
.299 Proposition identifying Control
Concept matching Student-generated mapping
3.42 -2.60 -.23
.078
.229
.998 Student-generated mapping Control
Concept matching Proposition identifying
3.66* -2.37
.23
.048
.299
.998 Based on observed means. * The mean difference is significant at the .05 level.
The post hoc test indicated that there were significant differences among the
treatments. The mean of Treatment 2 (M = 16.24), concept matching mapping, was 6.03
significantly higher than that of Treatment 1 (M = 10.21), out a maximum possible score
of 30. Significant difference also existed between the mean of Treatment 4 (M = 13.87),
the student-generated mapping, and Treatment 1 (M = 10.21), the control, on the total test
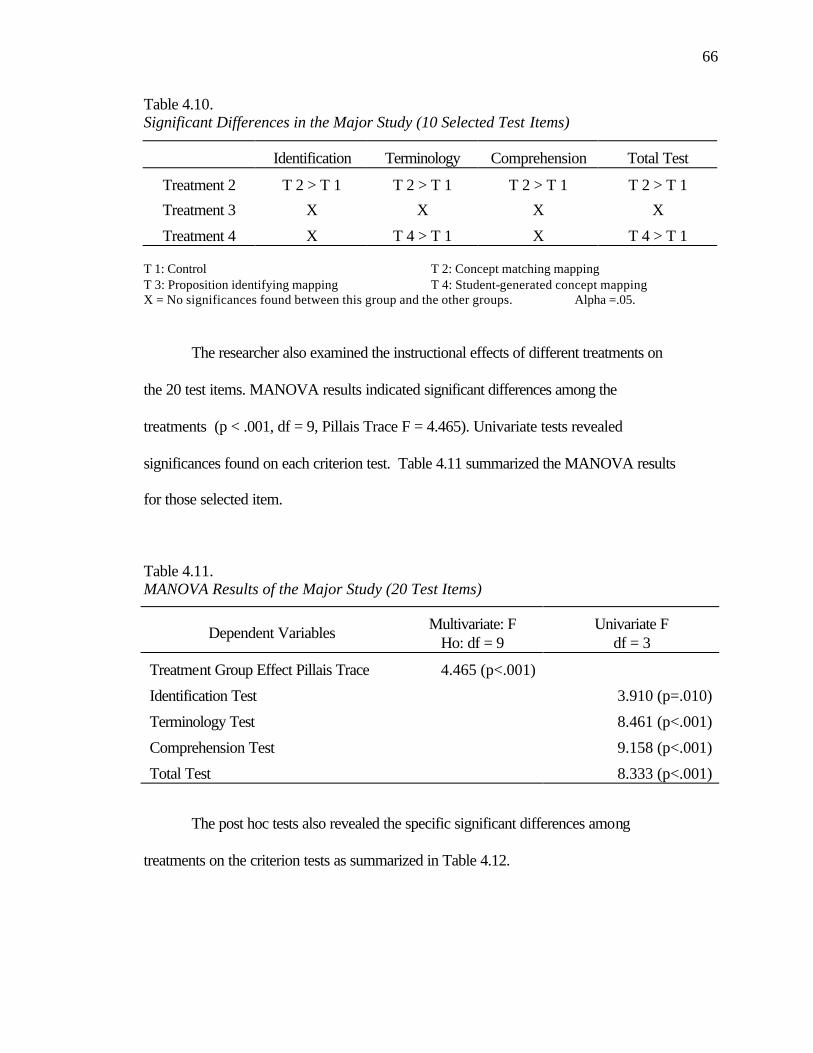
with a difference of 3.36 out of 30 maximum scores. Table 4.10 Summarizes the
significant differences found in post hoc tests by treatments.
66
Table 4.10. Significant Differences in the Major Study (10 Selected Test Items)
Identification Terminology Comprehension Total Test
Treatment 2 T 2 > T 1 T 2 > T 1 T 2 > T 1 T 2 > T 1
Treatment 3 X X X X
Treatment 4 X T 4 > T 1 X T 4 > T 1 T 1: Control T 2: Concept matching mapping T 3: Proposition identifying mapping T 4: Student-generated concept mapping X = No significances found between this group and the other groups. Alpha =.05.
The researcher also examined the instructional effects of different treatments on
the 20 test items. MANOVA results indicated significant differences among the
significances found on each criterion test. Table 4.11 summarized the MANOVA results
for those selected item.
Table 4.11. MANOVA Results of the Major Study (20 Test Items)
Dependent Variables Multivariate: F Ho: df = 9
Univariate F df = 3
Treatment Group Effect Pillais Trace 4.465 (p<.001)
Identification Test 3.910 (p=.010)
Terminology Test 8.461 (p<.001)
Comprehension Test 9.158 (p<.001)
Total Test 8.333 (p<.001)
The post hoc tests also revealed the specific significant differences among
treatments on the criterion tests as summarized in Table 4.12.
67
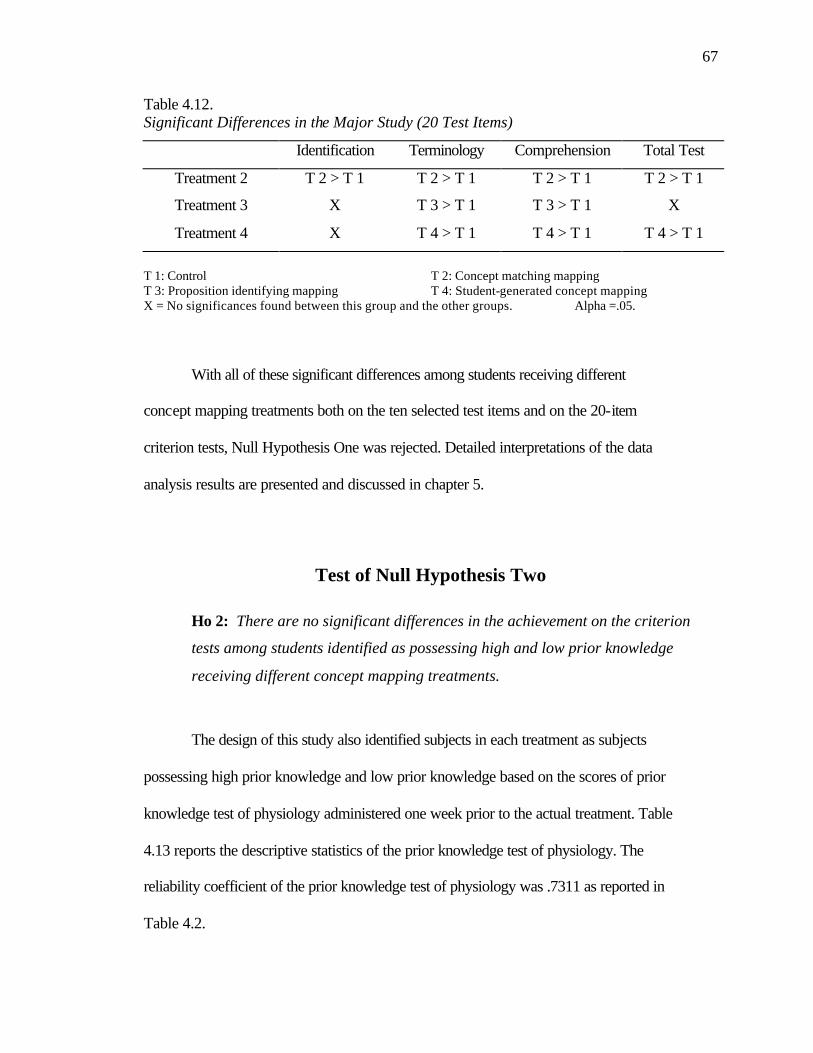
Table 4.12. Significant Differences in the Major Study (20 Test Items)
Identification Terminology Comprehension Total Test
Treatment 2 T 2 > T 1 T 2 > T 1 T 2 > T 1 T 2 > T 1
Treatment 3 X T 3 > T 1 T 3 > T 1 X
Treatment 4 X T 4 > T 1 T 4 > T 1 T 4 > T 1
T 1: Control T 2: Concept matching mapping T 3: Proposition identifying mapping T 4: Student-generated concept mapping X = No significances found between this group and the other groups. Alpha =.05.
With all of these significant differences among students receiving different
concept mapping treatments both on the ten selected test items and on the 20-item
criterion tests, Null Hypothesis One was rejected. Detailed interpretations of the data
analysis results are presented and discussed in chapter 5.
Test of Null Hypothesis Two
Ho 2: There are no significant differences in the achievement on the criterion
tests among students identified as possessing high and low prior knowledge
receiving different concept mapping treatments.
The design of this study also identified subjects in each treatment as subjects
possessing high prior knowledge and low prior knowledge based on the scores of prior
knowledge test of physiology administered one week prior to the actual treatment. Table
4.13 reports the descriptive statistics of the prior knowledge test of physiology. The
reliability coefficient of the prior knowledge test of physiology was .7311 as reported in
Table 4.2.
68
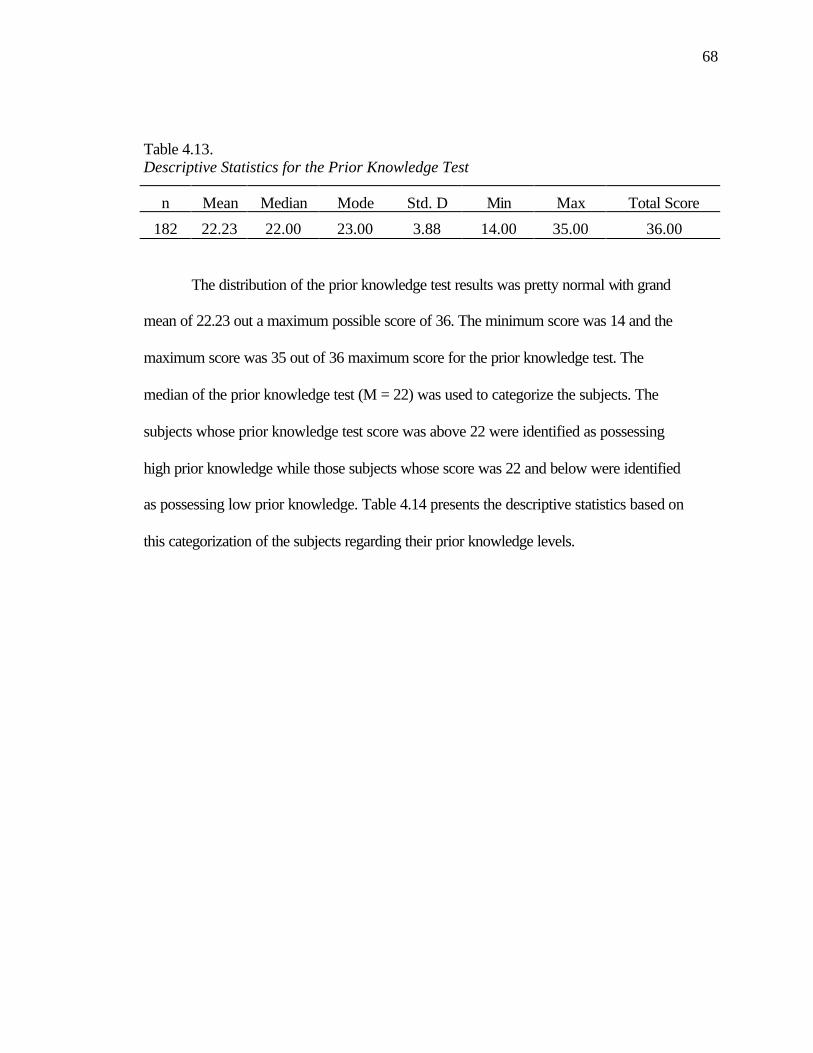
Table 4.13. Descriptive Statistics for the Prior Knowledge Test
n Mean Median Mode Std. D Min Max Total Score
182 22.23 22.00 23.00 3.88 14.00 35.00 36.00
The distribution of the prior knowledge test results was pretty normal with grand
mean of 22.23 out a maximum possible score of 36. The minimum score was 14 and the
maximum score was 35 out of 36 maximum score for the prior knowledge test. The
median of the prior knowledge test (M = 22) was used to categorize the subjects. The
subjects whose prior knowledge test score was above 22 were identified as possessing
high prior knowledge while those subjects whose score was 22 and below were identified
as possessing low prior knowledge. Table 4.14 presents the descriptive statistics based on
this categorization of the subjects regarding their prior knowledge levels.
69
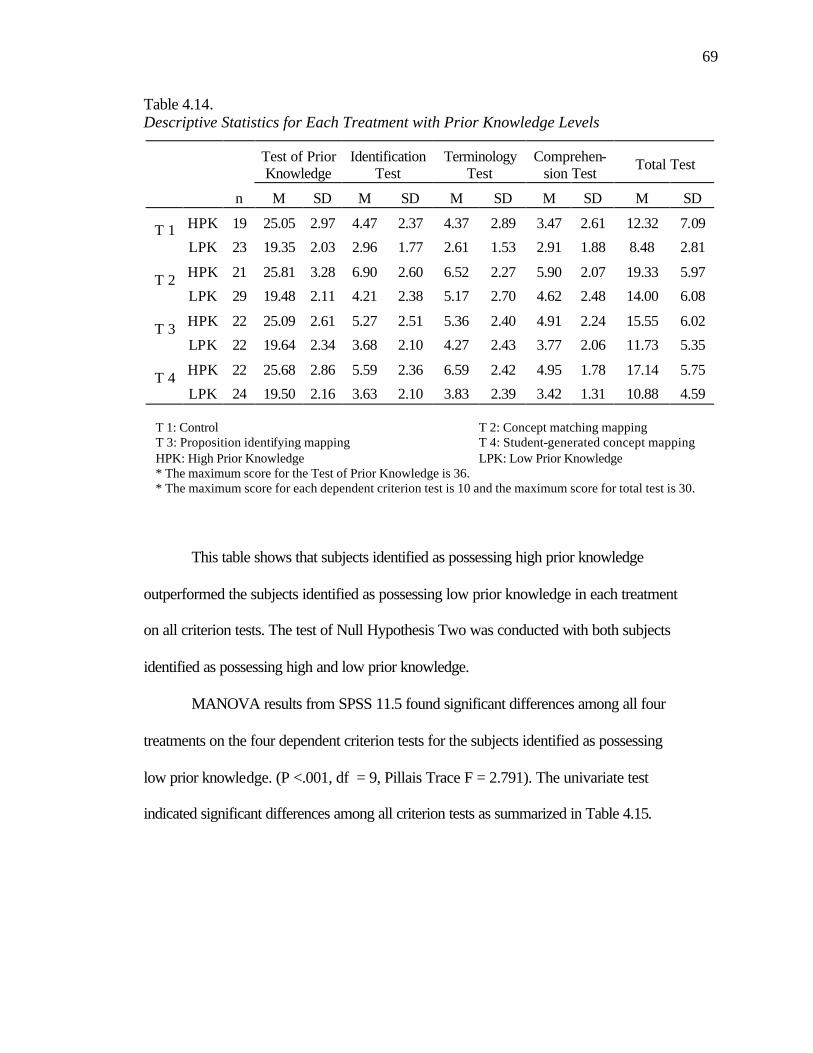
Table 4.14. Descriptive Statistics for Each Treatment with Prior Knowledge Levels
T 1: Control T 2: Concept matching mapping T 3: Proposition identifying mapping T 4: Student-generated concept mapping HPK: High Prior Knowledge LPK: Low Prior Knowledge * The maximum score for the Test of Prior Knowledge is 36. * The maximum score for each dependent criterion test is 10 and the maximum score for total test is 30.
This table shows that subjects identified as possessing high prior knowledge
outperformed the subjects identified as possessing low prior knowledge in each treatment
on all criterion tests. The test of Null Hypothesis Two was conducted with both subjects
identified as possessing high and low prior knowledge.
MANOVA results from SPSS 11.5 found significant differences among all four
treatments on the four dependent criterion tests for the subjects identified as possessing
low prior knowledge. (P <.001, df = 9, Pillais Trace F = 2.791). The univariate test
indicated significant differences among all criterion tests as summarized in Table 4.15.
70
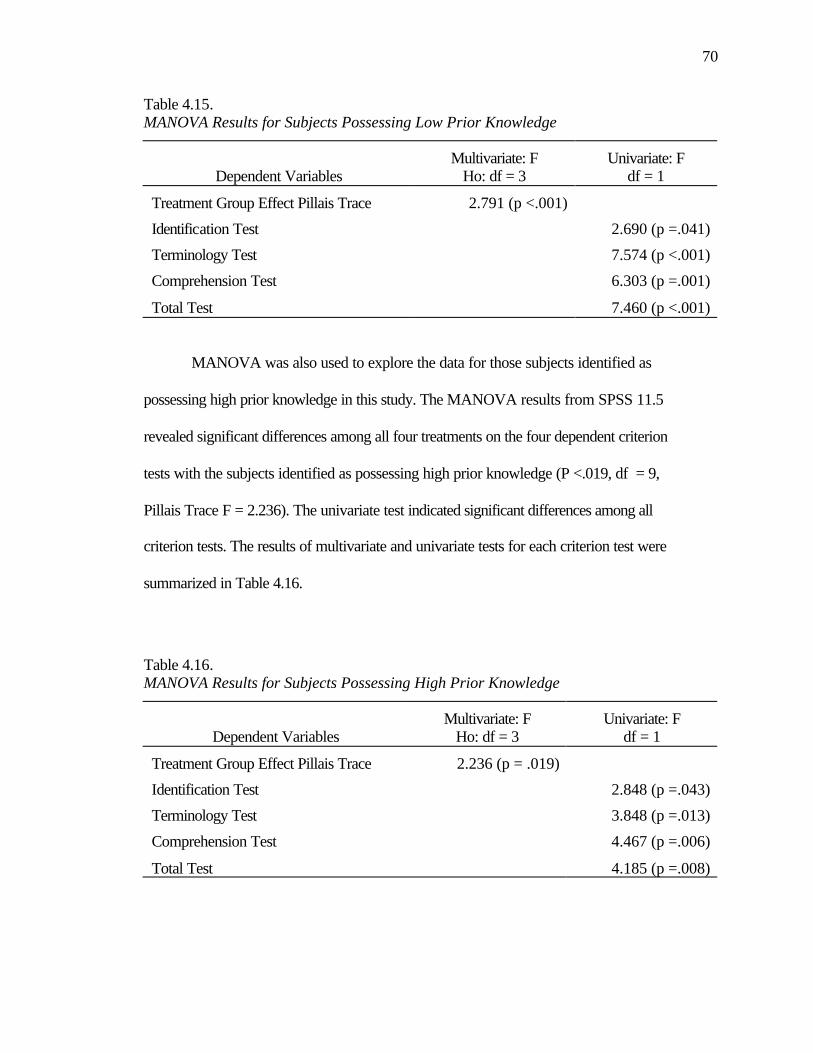
Table 4.15. MANOVA Results for Subjects Possessing Low Prior Knowledge
Dependent Variables Multivariate: F
Ho: df = 3 Univariate: F
df = 1
Treatment Group Effect Pillais Trace 2.791 (p <.001)
Identification Test 2.690 (p =.041)
Terminology Test 7.574 (p <.001)
Comprehension Test 6.303 (p =.001)
Total Test 7.460 (p <.001)
MANOVA was also used to explore the data for those subjects identified as
possessing high prior knowledge in this study. The MANOVA results from SPSS 11.5
revealed significant differences among all four treatments on the four dependent criterion
tests with the subjects identified as possessing high prior knowledge (P <.019, df = 9,
Pillais Trace F = 2.236). The univariate test indicated significant differences among all
criterion tests. The results of multivariate and univariate tests for each criterion test were
summarized in Table 4.16.
Table 4.16. MANOVA Results for Subjects Possessing High Prior Knowledge
Dependent Variables Multivariate: F
Ho: df = 3 Univariate: F
df = 1
Treatment Group Effect Pillais Trace 2.236 (p = .019)
Identification Test 2.848 (p =.043)
Terminology Test 3.848 (p =.013)
Comprehension Test 4.467 (p =.006)
Total Test 4.185 (p =.008)
71
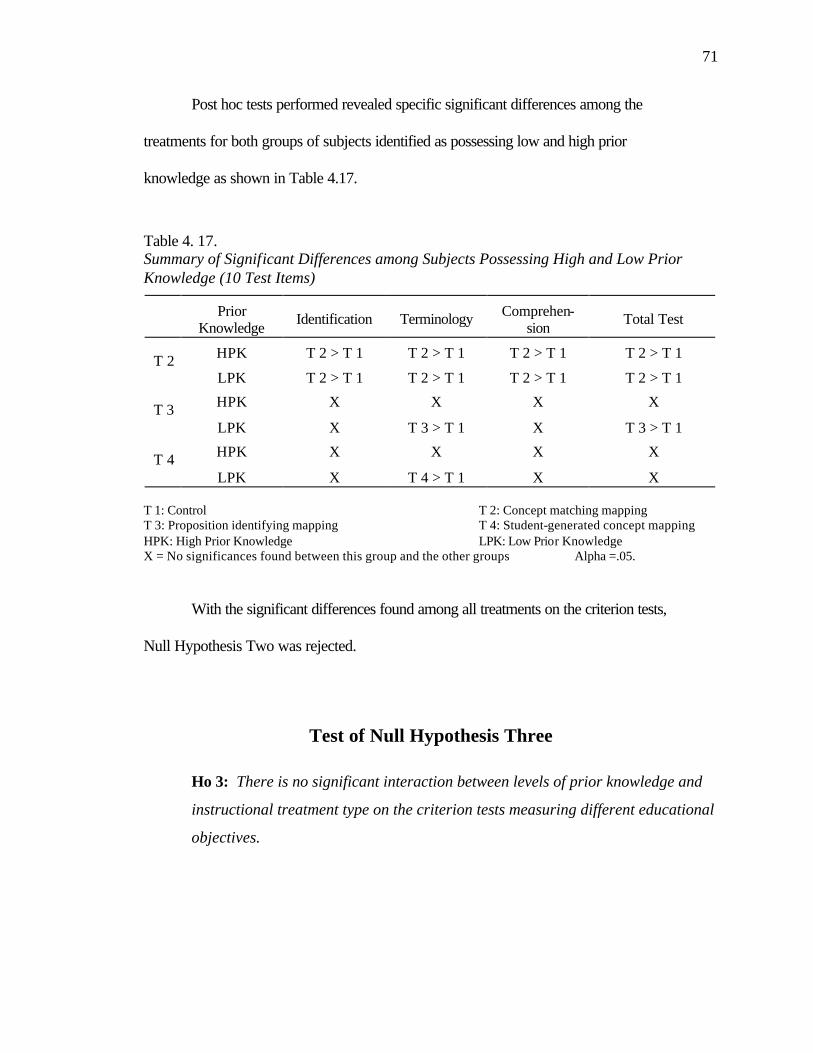
Post hoc tests performed revealed specific significant differences among the
treatments for both groups of subjects identified as possessing low and high prior
knowledge as shown in Table 4.17.
Table 4. 17. Summary of Significant Differences among Subjects Possessing High and Low Prior Knowledge (10 Test Items)
HPK T 2 > T 1 T 2 > T 1 T 2 > T 1 T 2 > T 1 T 2 LPK T 2 > T 1 T 2 > T 1 T 2 > T 1 T 2 > T 1 HPK X X X X T 3 LPK X T 3 > T 1 X T 3 > T 1
HPK X X X X T 4 LPK X T 4 > T 1 X X
T 1: Control T 2: Concept matching mapping T 3: Proposition identifying mapping T 4: Student-generated concept mapping HPK: High Prior Knowledge LPK: Low Prior Knowledge X = No significances found between this group and the other groups Alpha =.05.
With the significant differences found among all treatments on the criterion tests,
Null Hypothesis Two was rejected.
Test of Null Hypothesis Three
Ho 3: There is no significant interaction between levels of prior knowledge and
instructional treatment type on the criterion tests measuring different educational
objectives.
72
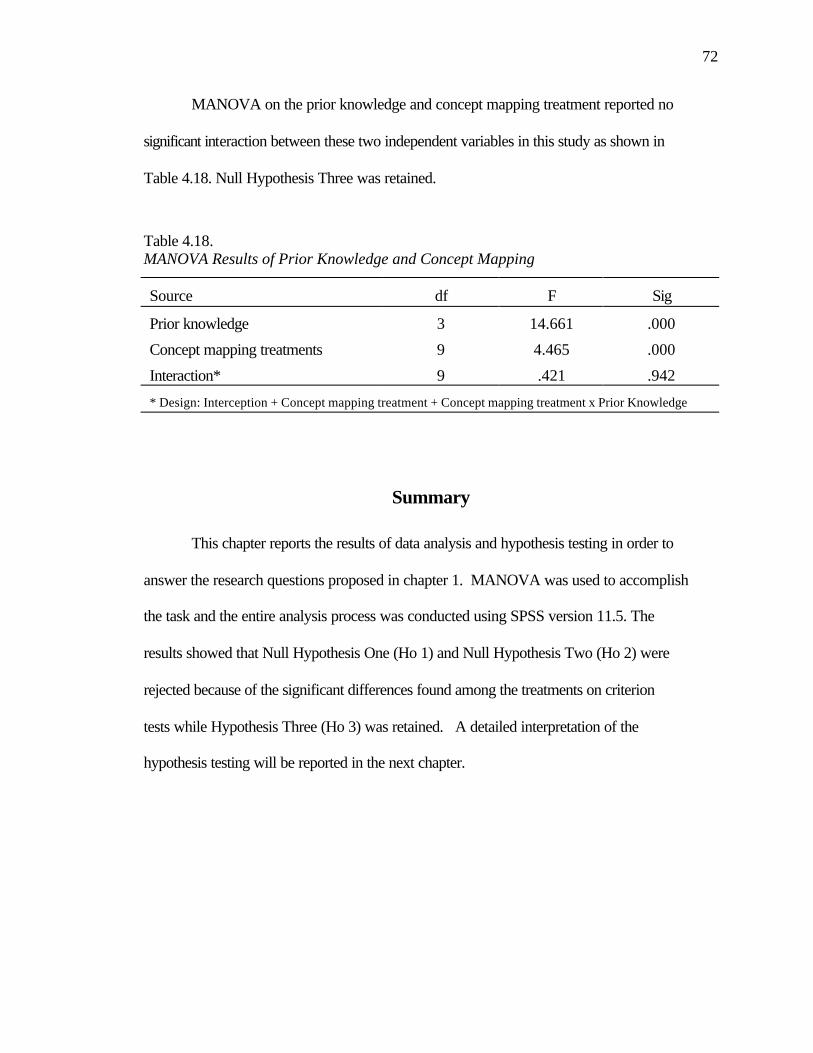
MANOVA on the prior knowledge and concept mapping treatment reported no
significant interaction between these two independent variables in this study as shown in
Table 4.18. Null Hypothesis Three was retained.
Table 4.18. MANOVA Results of Prior Knowledge and Concept Mapping
differences on achievement between the concept mapping and the control. However,
significant differences were found between Treatment 3 and Treatment 1 on 20 test items
on the terminology and comprehension tests.
The proposition identifying mapping strategy, which was designed to instigate
interaction between learners and learning material by focusing their attention on the
relationships -- propositions -- among those key concepts in the learning material, was
not effective in facilitating learning of factual information. One possible reason for this
result might be the selective characteristics of information processing. If information is
not meaningfully attended during information processing in the working memory, it is
soon lost from the system (Driscoll, 2000; Gagne et al. 1992; Gredler, 2001). Since
proposition identifying mapping oriented the subjects’ attention during information
processing on those missing propositions between concepts in the given concept maps,
the subjects might fail to see the factual information of those key concepts although they
were presented in the given maps. Their minds were busy working at the conceptual level
to figure out what relationships among those selected concepts were in a given map. This
79
result of proposition identifying mapping provides evidence that different learning
strategies would instigate different levels of information processing and result in different
levels of achievement.
However, on the criterion tests of terminology, and comprehension (20 test
items), proposition identifying mapping does affect learning and makes a significant
difference when comparing achievement scores with those of the control group. This is in
accordance with reports of those researchers (Chularut, 2001; Jegede et al. 1990;
Okebukola 1990; Pankratius, 1990; Wachter, 1993) who found significant differences in
achievement between concept mapping and the control. By focusing learners’ attention
on the relationships among those key concepts in the learning material, proposition
identifying mapping is effective in facilitating learning at the conceptual level and
consequently learning at the rules and principles level. Proposition identifying mapping
forces the subjects to explicitly identify the relationships among those key concepts in
their learning material. This procedure demands that the subjects process the specific
information at a deeper level and consequently results in better comprehension of the
contents of their learning material compared with the subjects in the control. As Chularut
(2001) put it, the procedure of mapping demands that the students have a good
understanding of the attributes of concepts and interrelationships (propositions) of
concepts. This result for proposition identifying mapping on achievement once again
provides evidence that well-understood concepts support application of the rules and
principles (Dwyer, 1978).
80
Treatment 4: Student-generated mapping
Student-generated concept mapping was designed to facilitate learning at the rules
and principles level. It was projected that the student-generated concept mapping would
instigate meaningful interaction with the learning material and facilitate achievement on
the comprehension test. However, since generating concept maps requires students to
identify and select key concepts to map, and clarify the relationships (propositions)
among those selected key concepts, and eventually to reorganize those concepts and
propositions to represent their understanding of the learning material, it was also
predicted that student-generated mapping would facilitate learning at factual and
conceptual levels as measured by the identification test and terminology test,
respectively. Data analysis results found only significant differences between Treatment
4 and Treatment 1, Control, on the criterion test of terminology and the total test (10
selected test items), and on the criterion tests of terminology, comprehension, and total
test (20 test items).
There was no significant difference between Treatment 4, the student-generated
concept mapping and Treatment 1, the control, in achievement as measured by the
identification test. One explanation for this result could be that student-generated
concept mapping is very demanding, requiring the subjects to identify all of the important
concepts and propositions among the concepts in their learning material and then
determine the structure of the concept map according to their understanding of the
contents and map it out explicitly. This process requires the subjects to think in multiple
directions and to switch back and forth between different levels of abstractions
(Okebukola, 1990). Therefore during this process of mapping, the factual information is
81
certainly not the focus of the subjects while they are busy sorting out the propositions
among the concepts and constructing a concept map to represent their understanding of
the content. Consequently, it did not make significant differences in achievement at the
factual level as measured by the criterion test of identification when compared with the
control.
However, the student-generated concept mapping was effective in facilitating
achievement at the conceptual level according to the test of terminology on the ten
selected test items. As a result, it made a significant difference in the general academic
achievement as measured by the total test when compared with the control. On the
criterion tests of 20 test items, the student-generated concept mapping also made
significant differences on achievement as measured by the terminology, comprehension
and total tests when compared with the control. The results of student-generated mapping
are supported by the findings from those researchers (Chularut, 2001, Jegede et al. 1990,
Okebukola, 1990; Pankratius, 1990, Wachter, 1993) who report significant differences in
achievement between concept mapping and the control.
A possible explanation could be that the student-generated concept mapping helps
the students interact with the learning material by not only identifying the key concepts
and propositions but also explicitly recognizing the meaningful and internal structure of
the content that holds it as a complete unit in the learning material. This meaningful
interaction instigated by the student-generated concept mapping and the efforts to explore
the internal structure and completeness of the information being processed during the
mapping process enhance learning at both conceptual level and rules and principles level.
Pankratius (1990) suggested that mapping is most effective when students create their
82
own maps throughout this learning process and that the degree of involvement in
constructing concept mapping is clearly the major factor in students’ achievement.
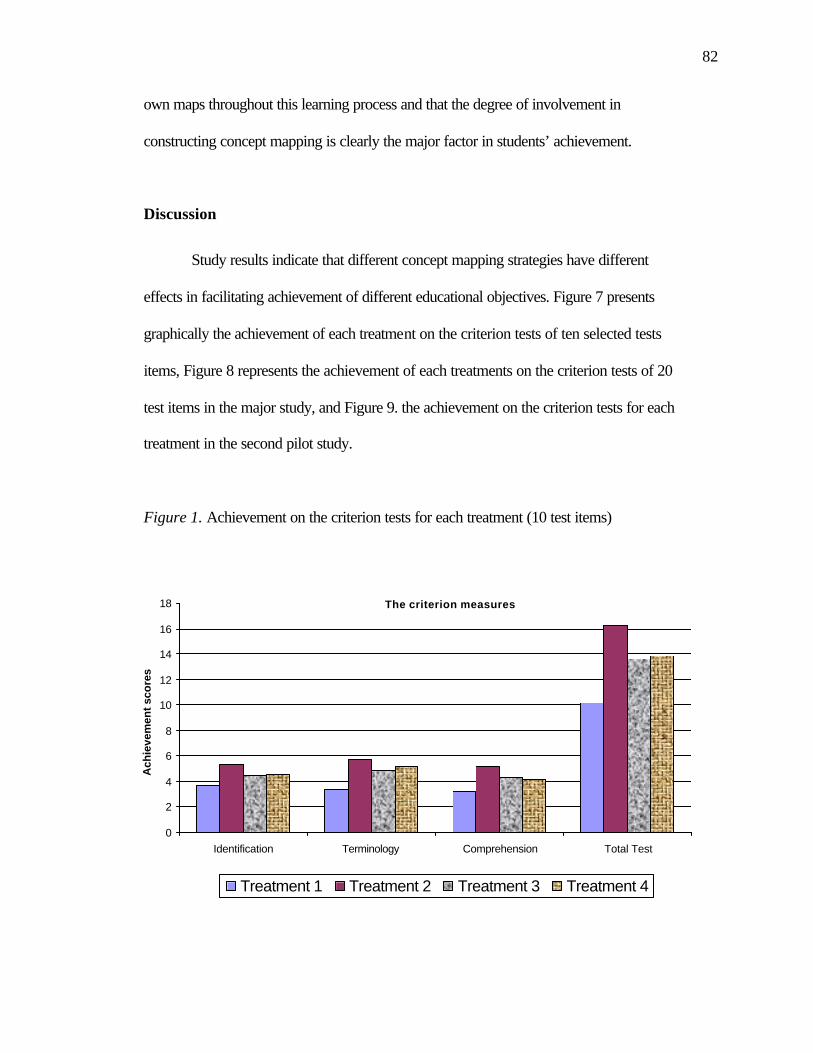
Discussion
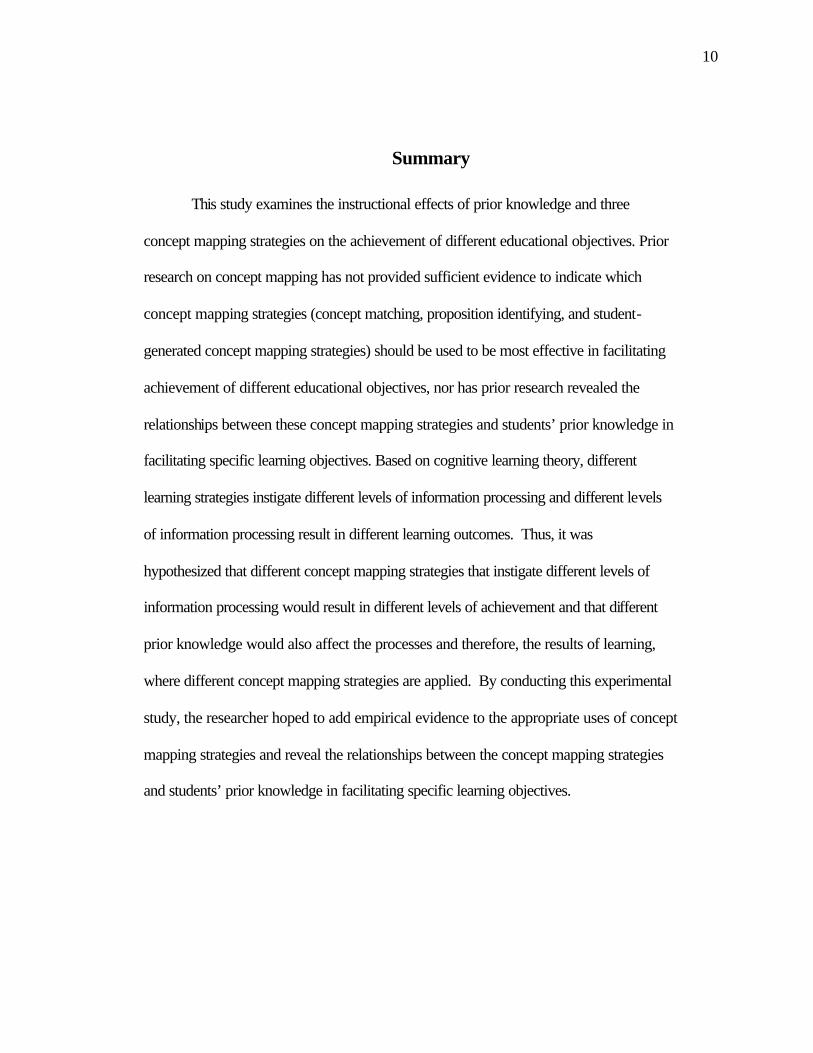
Study results indicate that different concept mapping strategies have different
effects in facilitating achievement of different educational objectives. Figure 7 presents
graphically the achievement of each treatment on the criterion tests of ten selected tests
items, Figure 8 represents the achievement of each treatments on the criterion tests of 20
test items in the major study, and Figure 9. the achievement on the criterion tests for each
treatment in the second pilot study.
Figure 1. Achievement on the criterion tests for each treatment (10 test items)
0
2
4
6
8
10
12
14
16
18
Identification Terminology Comprehension Total Test
The criterion measures
Ach
ieve
men
t sc
ore
s
Treatment 1 Treatment 2 Treatment 3 Treatment 4
83
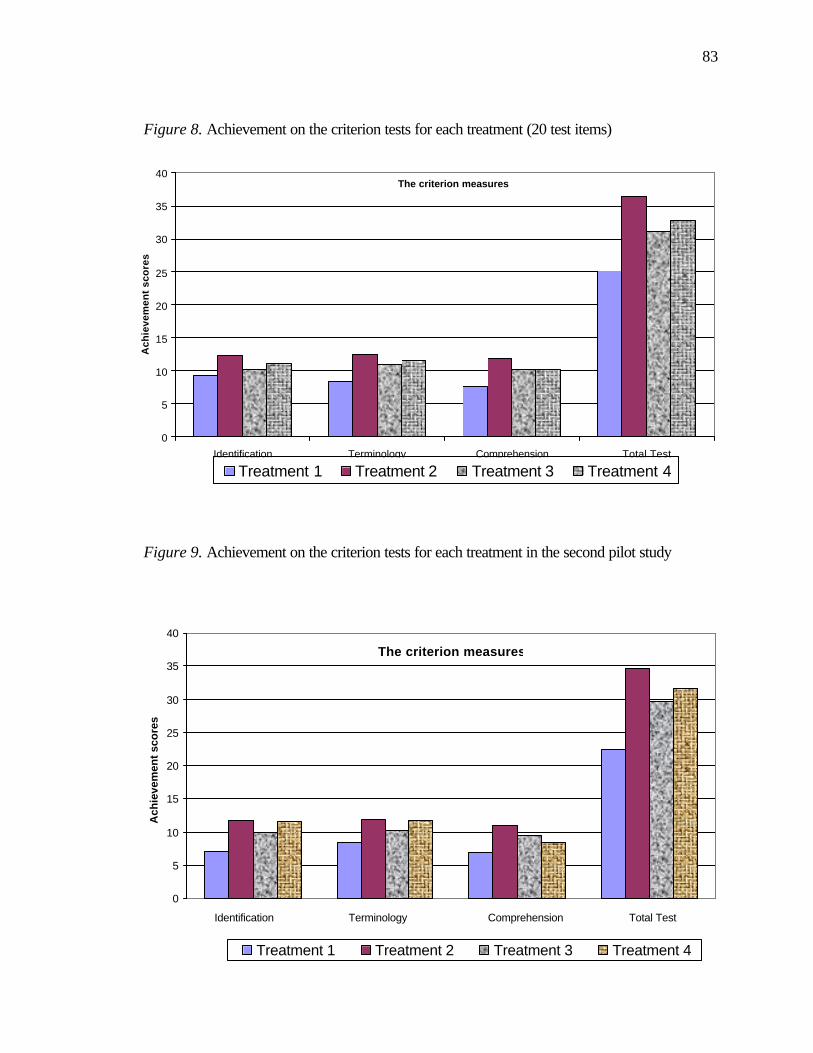
Figure 8. Achievement on the criterion tests for each treatment (20 test items)
Figure 9. Achievement on the criterion tests for each treatment in the second pilot study
0
5
10
15
20
25
30
35
40
Identification Terminology Comprehension Total Test
The criterion measures
Ach
ieve
men
t sc
ore
s
Treatment 1 Treatment 2 Treatment 3 Treatment 4
0
5
10
15
20
25
30
35
40
Identification Terminology Comprehension Total Test
Ach
ieve
men
t sc
ore
s
Treatment 1 Treatment 2 Treatment 3 Treatment 4
The criterion measures
84
It must be mentioned at this point that the experimental effects of concept
mapping strategies in the major study on achievement as measured by the criterion tests
were very similar to those of the second pilot study described in chapter 3. The similarity
in the experimental effects indicated the consistency of concept mapping strategies in
facilitating learning. Figure 9, which presents graphically the achievement of each
treatment on the criterion tests in the second pilot study, is almost the same as Figure 8.
In this study, insignificances were also interesting results of data analysis. Many
factors might have contributed to the insignificant results among the three concept
mapping strategies. For Treatment 3, proposition identifying mapping, one of the possible
factors might be that the treatment was difficult and confusing to some of the subjects.
Concepts, according to Novak (1998), are perceived regularity in events or objects, or
records of events or objects designated by labeling words. The perceived regularity is
defined by the attributes of the concepts, which are framed by the propositions among
those concepts. This explains why Novak and Gowin (1994) maintain that concept
mapping facilitates meaningful learning by illustrating the connectedness between and
among individual concepts and concept mapping can serve as a learning tool to help
learners organize their cognitive frameworks into more powerful integrated patterns with
those labeled propositions. Pankratius (1990) stated that students benefit most from maps
that reveal the connections between concepts using labeled word. Proposition identifying
mapping, removing those critical propositions in the given concept maps, might easily
confuse the subjects.
Concepts without propositions are not well defined and are ambiguous. Different
people might perceive these concepts without propositions in their own ways according
85
to their understanding of the learning material as they are required to identify the
propositions among these concepts. In proposition identifying mapping, the subjects
might perceive those given concepts very differently from what a map provider expected
them to see. According to Stewart (1979), there could be “… numerous valid
propositions that could be generated to link two nodes” (p. 400). The ambiguity in given
maps with deleted propositions as those in Treatment 3 could easily confuse the subjects
and cause negative effect on learning. This assumption is consistent with that of Jo
(2001) who found the negative results in achievement with the instructor-provided
concept map treatment when compared with the control. So, in devising proposition
identifying concept mapping, it is advisable to be extra cautious when removing some of
the propositions from the concept maps.
Additionally, the fact that subjects were not familiar with proposition identifying
mapping and student-generated mapping might be another explanation for those
insignificant differences among the three concept mapping treatments. Student-generated
mapping as stated above is a very demanding metacognitive strategy that takes a
relatively long time, and requires sustained efforts and fairly good concept mapping skill,
if it is meant to be effectively used in facilitating learning. If subjects were struggling
with frustration to map out the complex maps for the learning material, they could not
deeply or meaningfully process the information as they shifted their focus onto the
construction of the concept map. Both the concept maps generated by the subjects and the
observations made in this study indicated the lack of concept mapping skills among the
subjects. As a result, the student-generated concept mapping may have failed to facilitate
achievement significantly in this study.
86
Schau and Mattern (1997) argued that asking students to draw a totally user-
generated map imposes a high cognitive demand to extract meaningful representations of
their knowledge. “This demand may have caused the students to focus more heavily on
the map than on actually understanding the material and establishing mental connections”
(Taricani, 2002, 97). Snead (2000) asserted that a lack of familiarity with the concept
mapping strategy and inadequate preparation for the use of the concept mapping strategy
is likely a factor for the insignificant differences. The subjects in this study, who received
only a 50-minute workshop training on concept mapping prior to the study, were
certainly not sufficiently prepared with the concept mapping strategies. Successful use of
concept mapping requires practice and a willingness of people to be open to a great deal
of trial and error and ambiguity (Novak, 1990a). Concept mapping is most effective when
accompanied with comprehensive training, instructor guidance, and long-term practice
(Roop, 2002).
To sum up, the three concept mapping strategies are not equally effective in
facilitating achievement of different educational objectives. Extra considerations should
be given to learners’ mapping ability before deciding which type of concept mapping
would be used in order to achieve maximum effects on learning.
Null Hypothesis Two
Ho 2: There are no significant differences in achievement among students
identified as possessing high and low prior knowledge receiving different concept
mapping treatments on the criterion tests measuring different educational
objectives.
87
Hypothesis testing found significant differences among students identified as
possessing high and low prior knowledge receiving different concept mapping treatments
on the criterion tests measuring different educational objectives and this null hypothesis
was rejected.
The main effects of concept mapping in this study were as anticipated: Higher
achievement scores for high prior knowledge subjects across all treatments on all
criterion tests. The main effects of prior knowledge in this study are consistent with the
reports of other researchers (Dwyer & Dwyer, 1990; Elliott, 1993) who maintain that
prior knowledge plays a significant part in how learners interact with the learning
material and perform on various learning tasks measured by different criterion tests.
Driscoll (2000) emphasized the same point, stating that the prior knowledge that learners
bring to the learning environment dictates to a large extent what they will take away from
it in terms of new knowledge, concepts added to their cognitive structure, or details
elaborating schemata.
However, by examining the significant differences among subjects identified as
possessing high prior knowledge, it can be said that concept mapping strategies were not
as effective as expected by the researcher. Out of the three concept mapping strategies,
only concept matching mapping was uniformly more effective than the control and can
significantly facilitate learning achievement at the conceptual, rules and principles levels
and aid subjects in general academic performance. The other two concept mapping
strategies could not make significant differences in facilitating achievement as measured
by the criterion tests.
88
This finding agrees with reports from other researchers (Davey & Kapinus, 1985;
Elliott, 1993; Pintrich et al., 1986), who found in their studies that learners with high
prior knowledge of the subject matter performed well following instruction that was
incomplete and less structured, allowing the individual to use self-selected or
metacognitive learning strategies. Students with limited prior knowledge benefited most
from more detailed and structured learning material. In this study, subjects were not
given the freedom of choosing their own learning strategies but were required to use
different concept mapping strategies. For those high prior knowledge subjects, forcing
them to use unfamiliar learning strategies impedes their learning.
For those subjects identified as possessing low prior knowledge, concept mapping
strategies were generally effective in facilitating learning. Concept matching made
significant differences at all levels of learning when compared with the control. Also, all
three concept mapping strategies made significant differences on learning at conceptual
level as measured by the criterion test of terminology when compared with the control.
These results showed that for subjects identified as possessing low prior knowledge,
concept matching may have provided them with added cueing or have aided them in
processing information from the learning material, which resulted in better achievement
as measured by the criterion tests when compared to the control group.
However, it also should be mentioned that the student-generated concept mapping
was least effective for the subjects with low prior knowledge. Subjects with low prior
knowledge had double barriers in using this mapping strategy: comprehending their
learning material without much prior knowledge and generating with frustration concept
maps to represent their limited understanding of the learning material. When using the
89
student-generated concept mapping strategy with low prior knowledge students, these
double barriers must be carefully considered. The significant and insignificant differences
found in this study with subjects identified as possessing low and high prior knowledge
shed light on which type of concept mapping strategies is the most effective in facilitating
achievement of specific educational objectives.
Null Hypothesis Three
Ho 3: There is no significant interaction between levels of prior knowledge and
instructional treatment type on the criterion tests measuring different educational
objectives.
Study results showed no significant interactions in four levels of criterion testing
between student prior knowledge and concept mapping treatments. Therefore, null
hypothesis 3 was retained. The relationship between prior knowledge and the three
concept mapping treatments used in this study operated independently of each other. As a
result, findings about prior knowledge and three concept mapping strategies in facilitating
achievement of different educational objectives discussed above were due to the
experimental effects rather than the interactions of the two independent variables in this
study.
90
Summary of the Findings
The following conclusions may be drawn about prior knowledge and the three
concept mapping strategies in facilitating achievement of different educational objectives
from its findings.
• The three concept mapping strategies (concept matching mapping, proposition
identifying mapping, and student-generated mapping) were not equally effective
in facilitating achievement of different educational objectives as measured by the
criterion tests when compared with the control.
• Concept matching mapping strategy (Treatment 2), the simplest and most
straightforward mapping strategy, was the most effective among the three
mapping strategies not only in facilitating learning at factual level but also at the
higher levels of CONCEPT, and rules and principles. The significant differences
in achievement were found between the concept matching and the control on all
criterion tests.
• Proposition identifying mapping strategy (Treatment 3) was not significantly
different in facilitating achievement of different educational objectives as
measured by the criterion tests when compared with the other three treatments
(Treatment 1, Treatment 2, and Treatment 4).
• The student-generated concept mapping strategy (Treatment 4) was the most
demanding both in terms of the cognitive load and the time needed to complete
the treatment. Significant differences were found in achievement at the
CONCEPT level and in the general academic performance between the student-
91
generated concept mapping and the control (Treatment 1) as measured by the
criterion test of terminology and the total test.
• In spite of all the significant differences found, the achievement scores in all
concept mapping treatments were not as satisfactory as expected. This indicated
that concept mapping strategies alone in learning might not be effective enough to
bring about the expected learning outcomes.
• Subjects identified as possessing high prior knowledge significantly outperformed
subjects identified as possessing low prior knowledge in all concept mapping
treatments on all the criterion tests.
• Among the subjects identified as possessing low prior knowledge, concept
matching mapping (Treatment 2) achieved significantly higher scores than the
control (Treatment 1) on all criterion tests. Proposition identifying mapping
(Treatment 3) achieved significantly higher scores than the control (Treatment 1)
on the criterion test of terminology and on the total test. Student-generated
concept mapping (Treatment 4) achieved significantly higher score than the
control (Treatment 1) on the criterion test of terminology. Regarding the
significant differences found on the criterion test of terminology, concept
matching mapping was the most effective and student-generated concept mapping
was the least effective.
• Among the subjects identified as possessing high prior knowledge, the significant
differences were only found in achievement as measured by the criterion tests of
terminology, comprehension and the total test between the concept matching
(Treatment 2) and the control (Treatment 1).
92
• There are no significant interactions between prior knowledge and concept
mapping treatments in this study.
Instructional Implications
From instructional perspective, the above findings reveal that concept mapping
strategies are not equally effective in facilitating learning at different levels. The effective
use of concept mapping strategies should be the one that would facilitate learning at the
desired level of learning hierarchy and help learners achieve the intended educational
objectives. In selecting or devising concept mapping strategies for instructional purposes,
the learning objectives and intended learning outcomes should be considered prior to the
types of concept mapping strategies to be used to achieve them.
Concept mapping can take various forms. Some simple and straightforward
concept mapping activities like concept matching could be as effective as those
complicated ones like the student-generated concept mapping. However, the time spent in
completing the different concept mapping activities is very different. By appropriately
applying different concept mapping strategies in instructions according to particular
educational objectives, not only effectiveness but also efficiency of learning can be
greatly enhanced.
Concept mapping can be very demanding depending on what type of concept
mapping strategies is being used and who are using it. Complicated concept mapping
strategy like the student-generated one can be very difficult for the students with low
prior knowledge. Those students with low prior knowledge usually have double barriers
in using the student-generated concept mapping strategy: low prior knowledge in
93
comprehending the learning material and difficulties in mapping out their understanding
of the learning material. It is advisable to use additional learning strategies like rehearsal,
elaborative, and organizing strategies and to provide more cueing in processing the
learning material while the students with low prior knowledge of a learning domain are
engaged in generating their own concept maps. Alternatively, instructors can provide
more training on concept mapping prior to the use of the student-generated concept
mapping to make sure that those students with low prior knowledge would not be
frustrated with the learning strategy itself or provide more detailed guidance when the
students with low prior knowledge are generating their own concept maps.
Limitations
Some of important limitations identified in this study include the following.
Limited time on training and practicing concept mapping might have reduced the
effectiveness of experimental treatment in the study. Concept mapping is a very
demanding learning strategy that requires sustained efforts and good mapping skill in
order to use it effectively. Subjects in this study were not well prepared in using concept
mapping strategies. A 50-minutes training workshop on concept mapping was not enough
to turn a naïve concept mapper into a skillful user of concept mapping strategies.
Novak (1995) pointed out that successful use of concept mapping requires
practice and a great deal of trial and error. Concept mapping is most effective when
accompanied by comprehensive training, instructor guidance, and long-term practice
(Roop, 2002). Smith and Dwyer (1995) also discussed the fact that their subjects might
not have enough time to master the concept mapping strategies. Spaulding (1989) and
94
Roshan (1997) suggested providing more practice time on concept mapping strategies
prior to the study and claimed that the sufficient practice could increase the students’
performance. This study might have produced different results if more time were spent on
preparing the subjects for concept mapping.
The study was quantitative in nature. This depicts only one side of the coin
through quantitative analysis of the data collected. How these data were produced
remained untouched. For instance, why proposition identifying mapping was confusing
and misleading to some of the subjects remains unanswered.
The workload for subjects in the student-generated concept mapping was too
much for most of the subjects. Obvious impatience, which led to many poor quality
concept maps, was observed during the treatment.
Recommendations for Future Research
According to the limitations identified in this study, the following
recommendations are made for future research on concept mapping strategies.
• Future research should focus on exploring the types of concept mapping strategies
that would facilitate learning at higher levels of the learning hierarchy.
Specifically, the types of concept mapping strategies that facilitate achievement at
CONCEPT, rules and principles, problem solving levels by analyzing and
synthesizing the problem situations, and evaluating alternative problem solutions
should be explored.
• Future studies about concept mapping strategies could include the evaluation of
the concept maps, and conducting a post-study survey and interviews to produce a
95
fuller, better and more accurate picture of different concept mapping strategies in
facilitating learning achievement. It is believed that the information on the
mapping activities would shed light on the real causes of learning outcomes
affected by mapping strategies, which would be very valuable for the actual
application of concept mapping.
• Future exploration of the concept mapping strategies should be done in
combination with other learning strategies to produce a realistic picture of concept
mapping strategies in facilitating learning. In many situations, learners use more
than one learning strategy to address their learning needs or learning problems.
Conducting concept mapping strategy studies together with other learning
strategies like note-taking, summarizing, and questioning would produce more
practical information on concept mapping.
• The achievement tests in this study immediately followed the instruction. It would
be more useful to see the delayed instructional effects of different concept
mapping strategies. This would provide a new dimension of information on
concept mapping in facilitating achievement of different educational objectives.
• Concept mapping is a very demanding learning strategy that requires sustained
efforts and good mapping skills in order to use it effectively. Providing more
training time and more practice opportunities to the subjects before conducting
the study is crucial.
• Course-related content should be used to improve student motivation in concept
mapping and reveal the actual instructional effects of concept mapping in
facilitating different course-related learning objectives.
96
References
Alexander, P. (1996). The past, present, and future of knowledge research: A reexamination of the role of knowledge in learning and instruction. Educational Psychologist, 31(2), 89–92.
Alpert, S. R., & Grueneberg, K. (2000). Concept mapping with multimedia on the web.
Journal of Educational Media and Hypermedia, 9(4), 313–330. Anderson, R. C. (1984). Some reflections on the acquisition of knowledge. Educational
Researcher, 13(9), 5–10. Atkinson, R. L., & Shiffrin, R. M. (1968). Human memory: A proposed systems and its
control processes. In K. W. Spence & J. T. Spence (Eds.), The psychology of learning and motivation: Advances in research and theory, Vol. 2. New York: Academic.
Atkinson, R. L., & Shiffrin, R. M. (1971). The control of short-term memory. Scientific
American, 225, 82–90. Ausubel, D. P. (1963). The psychology of meaningful verbal learning : An introduction to
school learning. New York: Grune & Stratton. Ausubel, D. P. (1968). Educational psychology : A cognitive view. New York: Holt,
Rinhart and Winston, Inc. Ausubel, D. P., Novak, J. D., & Hanesian, H. (1968). Educational psychology : A
Cognitive view (2nd ed.). New York: Werbel and Peck. Beissner, K. L., Jonassen, D. H. & Grabowski, B. L. (1994). Using and selecting graphic
techniques to acquire structural knowledge. Performance Improvement Quarterly, 7(4), 28-38.
Bernard, R. M. (1990). Effects of processing instructions on the usefulness of a graphic
organizer and structural cueing in text. Instructional Science, 19, 207–217. Bloom, B. S., Englehart, M. D., Furst, E. J., Hill, W. H., & Krathwohl, D. R. (1956).
Taxonomy of educational objectives: The classification of educational goals. Handbook I: Cognitive domain. White Plains, NY: Longman.
Brown, D. S. (2000). The effect of individual and group concept mapping on students’
conceptual understanding of photosynthesis and cellular respiration in three different academic levels of biology classes. Unpublished doctoral dissertation. University of Missouri, Kansas City.
97
Bruning, I. L. (1983). An information-processing approach to a theory of instruction. Educational Communications and Technology Journal, 31, 99–101.
Byrnes, J. P. (1996). Cognitive development and learning in instructional context.
Needham, MA: A Simon and Schuster Company. Chularut, P. (2001). The influence of concept mapping on achievement, self-regulation,
and self-efficacy in students of English as a second language. Unpublished doctoral dissertation, University of Oklahoma, Norman, OK.
Clark, J. M., & Paivio, A. (1991). Dual coding theory and education. Educational
Psychology Review, 3(3), 149–170. Cliburn, J. W. Jr. (1986). Concept maps to promote meaningful learning. Journal of
College Science Teaching, 19 (4). 377–379. Craik, F. I. M. (1979). Levels of processing: Overview and closing comments. In L. S.
Cermak & F. I. M. Craik (Eds.), Levels of processing in human memory (pp. 447–461). Hillside, NJ: Lawrence Erlbaum Associates, Publishers.
Craik, F. I. M., & Lockhart, R. S. (1972). Levels of processing: A framework for memory
research. Journal of Verbal Learning and Verbal Behavior, 11, 671-684. Craik, F. I. M., & Lockhart, R. S. (1986). CHARM is not enough: Comments on Eich’s
model of cued recall. Psychological Review, 93, 360-364. Davey, B., & Kapinus, B. A. (1985). Prior knowledge and recall of unfamiliar
information: Reader and text factors. Journal of Educational Psychology, 56, 1–39.
Driscoll, M. P. (2000). Psychology of learning for instruction. Boston, MA: Allyn and
Bacon. Driver, R. (1988). Theory into practise II: A constructivist approach to curriculum
development. In P. Fensham (Ed.) Development and Dilemmas in Science Education (pp. 133–149). London: Falmer Press.
Dwyer, F. M. (1965). An experimental evaluation of the relative effectiveness of selected
visual illustrations in teaching science concepts to college students. Unpublished doctoral dissertation, The Pennsylvania State University, University Park, Pa.
Dwyer, F. M. (1978). Strategies for improving visual learning. State College, PA:
Learning Services.
98
Dwyer, F. M., & Dwyer, C. A. (1990). Effects of student’s prior knowledge and presentation mode on achievement (visual/verbal testing) of different educational objectives. Paper presented at the Convention of the Association of Educational Communications and Technology. (ERIC Document Reproduction Service No. ED 323 926).
Elliott, C. (1993). Effects of prior knowledge and various rehearsal strategies on student
achievement of different educational objectives. Unpublished doctoral dissertation. Pennsylvania State University.
Fisher, K. M., Faletti, J. Patterson, H., Thornton, R., Lipson, J., & Spring, C. (1990).
Computer-based concept mapping. Journal of College Science Teaching, 19(6), 347–352.
Fraser, K., & Edwards, J. (1987). Concept maps as reflectors of conceptual
understanding. Proceedings of the second international seminar misconceptions and educational strategies in science and mathematics. Vol. I (pp. 187–192). Ithaca, NY: Cornell University.
Gagne, R. M. (1977). Conditions of learning (3rd ed.). New York : Holt, Rinehart &
Winston. Gagne, R. M. (1985). The Conditions of learning and the theory of instruction (4th ed.).
New York, NY: CBS College Publishing. Gagne, R. M., & Briggs, L. J. (1979). Principles of instructional design (2nd ed.). New
York: Holt, Rinehart & Winston. Gagne, R. M., Briggs, L. J., & Wager, W. W. (1992). Principles of instructional design
(4th ed.). Fort Worth, TX: Harcourt Brace College Publishers. Gaines, C. (1996). Concept mapping and synthesizers: Instructional strategies for
encoding and recalling. Journal of the New York State Nurses Association, 27, 14–18.
Gallini, J. K. (1989). Schema-based strategies and implications for instructional design in
strategy training. In C. B. McCormick, G. E. Miller, & M. Pressley (Eds.), Cognitive strategy research: Form basic research to educational application. New York: Springer-Verlag, Inc.
Gredler, M. E. (2001). Learning and instruction: Theory into practice (4th ed.). Upper
Saddle River, NJ: Merrill Prentice Hall. Green, B., Ritchie, D., & Volkl, C. (2000). Effectiveness of two generative learning
strategies in the science classroom. School Science and Mathematics, 100(2), 83–89.
99
Guastello, E. F., Beasley, T. M., & Sinatra, R. C. (2000). Concept mapping effects on science content comprehension of low-achieving inner-city seventh graders. Remedial and Special Education, 21(6), 356–362.
Hall, M. A. (1985). Reveiwing biology. New York: Amsco School Publications, Inc. Heinze-Fry, J. A., & Novak, J. D. (1990). Concept mapping brings long term movement
towards meaningful learning. Science Education, 74, 461–472. Helton, C. A. (1994). Comparative investigation of three study strategies: Concept
mapping, marking text, and a combination of concept mapping and marking text. Unpublished Doctoral Dissertation. The Tennessee State University.
Holley, C. D., & Dansereau, D. (1984b). Networking: The technique and the empirical
evidence. In C. D. Holley & D. F. Dansereau (Eds.), Spatial learning strategies (pp. 81–108). New York: Academic Press.
Horton, P. B., McConney, A. A., Gallo, M., Woods, A. L., Senn, G. J., & Hamelin, D.
(1993). An investigation of the effectiveness of concept mapping as an instructional tool. Scicence Education, 77, 95–111.
Huck, S. W. (2000). Reading statistics and research, (3rd ed.). New York: Addison
Wesley Longman, Inc. Isaac, S. & Michael, W. B. (1997). Handbook in research and evaluation (3rd ed.). San
Diego, CA: EdITS/Educational and Industrial Test Services. Jegede, O. J., Alaiyemola, F. F., & Okebukola, P. A. O. (1990). The effects of concept
mapping on students’ anxiety and achievement in biology. Journal of Research in Science Teaching, 27(10), 951–960.
Jo, I. H. (2001). The effects of concept mapping on college students’ comprehension of
expository text. Unpublished doctoral dissertation. The Florida State University. Jonassen, D. H., Beissner, K., & Yacci, M. (1993) Structural knowledge: Techniques for
representing, conveying, and acquiring structural knowledge. Hillsdale, NJ: Erlbaum.
Jonassen, D. H., & Grabowski, B. L. (1993). Handbook of individual differences,
learning, and instruction. Hillsdale, NJ: Erlbaum. Joseph, J. H., & Dwyer, F. M. (1983). The effects of prior knowledge, presentation mode,
and visual realism on student achievement. Journal of Experimental Education, 52, 110–121.
100
Keng, H. T. (1996). A comparative study of note-taking, outlining and concept mapping learning strategies on national Taipei Teachers’ College students’ understanding of heat and temperature. Unpublished doctor dissertation. University of Iowa.
Kenny, R., & Schroeder, E. E. (1994). The integration of learning strategies in
interactive multimedia instruction. (ERIC Document Reproduction Service No. ED 373770)
Lambiotte, J., Dansereau, D. F., Cross, D. R., & Reynolds, S. (1989). Multirelational
semantic maps. Educational Psychology Review, 1(4), 331–367. Lehman, J. D., Carter, C., & Kahle, J. B. (1985). Concept mapping, vee mapping, and
achievement: Results of a field study with black high school students. Journal of Research in Science Teaching, 12 (2), 9–15.
Mager, R. F. (1984). Preparing instructional objectives (2nd ed.). Belmont, CA: David S.
Lake. Matlin, M. W. (1998). Cognition (4th ed.). New York, NY: Harcourt Brace College
Publishers. Merrill, M. D. (1983). Component display theory. In C. M. Reigeluth (Ed.) Instructional
design theories and models: An overview of their current status. Hillsdale, NJ: Lawrence Erlbaum Associates.
Miller, G. A. (1956). The magic number, seven plus or minus two: Some limits on our
capacity for processing information. Psychological Review, 63, 81–97. Naidu, S. (1991). Effects of post-questioning, concept mapping and feedback on cognitive
performance in distance education. Unpublished doctor dissertation. Concordia University, Canada.
Novak, J. D. (1990a). Concept mapping: A useful tool for science education. Journal of
Research in Science Teaching, 27(10), 937–949. Novak, J. D. (1990b). Concept maps and vee diagrams: Two metacognitive tools for
science and mathematics education. Instructional Science, 19, 29–52. Novak, J. D. (1998). Learning, creating, and using knowledge: Concept maps as
facilitative tools in schools and corporations. Mahwah, NJ: Lawrence Erlbaum Associates, Publishers.
Novak, J. D., & Gowin, D. B. (1984). Learning how to learn. New York: Cambridge
University Press.
101
Novak, J. D., & Musonda, A. (1991). A twelve-year longitudinal study of science concept learning. American Educational Research Journal, 28(1), 117–153.
Okebokola, P. K. (1990). Attaining meaningful learning of concepts in genetics and
ecology. An examination of potency of the concept mapping technique. Journal of Research in Science Teaching, 27(5), 493–504.
Paivio, A. (1974). Language and knowledge of the world. Educational Researcher, 3(9),
5–12. Paivio, A. (1986). Mental representation: A dual coding approach. New York: Oxford
University Press. Pankratius, W. J. (1990). Building and organized knowledge-base: Concept mapping and
achievement in secondary school physics. Journal of Research in Science Teaching, 27(4), 315–333.
Peterson, L. R., & Peterson, M. (1959). Short-term retention of individual items. Journal
of Experimental Psychology, 58, 193–198. Pettijohn, T. E. (1989). Psychology: A concise introduction (2nd ed.). Guilford, CT: The
Dushkin Publishing Group, Inc. Pintrich, P. R., Cross, D. R., Kozma, R. B., & McMeachie, W. J. (1986). Instructional
psychology. In M. R. Rosenzweig & L. W. Porter (Eds.), Annual Review of Psychology (pp. 611–651). Palo Alto, CA: Annual Review Inc.
Plotnick, E. (1997). Concept mapping: A graphical system for understanding the
relationship between concepts. Eric Digest, EDO-IR-97-05. Plotnick, E. (2001). A graphical system for understanding the relationship between
concepts. Teacher Librarian: the journal for school library professionals, 28(4), 42–44.
Roop, K. M. (2002). Effects of concept mapping as a learning strategy on certificate
practical nursing students’ achievement and critical thinking development. Unpublished doctoral dissertation. Wilmington College, DE.
Roshan, V. (1997). The effect of varied structural knowledge learning strategies in
complementing verbal instruction. Unpublished doctoral dissertation. The Pennsylvania State University.
Rumelhart, D. E. (1980). Schemata: The building blocks of cognition. In R. J. Spiro, B.
C. Bruce, & W. F. Brewer (Eds.), Theoretical issues in reading comprehension. Hillsdale, NJ: Erlbaum.
102
Rumelhart, D. E., & Norman, D. A. (1978). Accretion, tuning, and restructuring: Three methods of learning. In J. W. Cotton & R. L. Klatzky (Eds.), Semantic factors in cognition. Hillsdale, NJ: Erlbaum.
Schau, C., & Mattern, N. (1997). Use of map techniques in teaching statistics courses.
The American Statistician, 51(2), 171–175. Schultz, T. L. (2001). Concept maps vs. embedded questions: Assessing cognitive change
in interior design students. Unpublished doctoral dissertation, The University of Toledo.
Sherris, J. D., & Kahle, J. B. (1984). The effects of instructional organization and locus
of control orientation on meaningful learning in high school biology students. Journal of Research in Science Teaching, 21, 83–94.
Smith, K. M., & Dwyer, F. M (1995). The effect of concept mapping strategies in
facilitating student achievement. International Journal of Instructional Media, 22, 25–31.
Smith, P. L., & Ragan, T. J. (1999). Instructional design (2nd ed.). New York: John Wiley
& Sons. Snead, D. (2000). Concept mapping and science achievement of middle grade students.
Unpublished doctoral dissertation. University of Kentucky. Spaulding, D. T. (1989). Concept mapping and achievement in high school biology and
chemistry. Unpublished doctoral dissertation. Florida Institute of Technology. Stensvold, M. S., & Wilson, J. T. (1990). The interaction of verbal ability with concept
mapping in learning from a chemistry laboratory activity. Science Education, 74(4), 473–480.
Stevens, J. (1986). Applied multivariate statistics for the social sciences. Hillsdale, NJ:
Erlbaum. Steward, J. (1979). Content and cognitive structure: Critique of assessment and
representation techniques used by science educational researchers. Science Education, 63, 395–405.
Sturm, J. M. (1996). Effects of hand-drawn and computer-generated concept mapping on
expository writing and writing attitudes of middle level students with learning and reading disability. Unpublished doctoral dissertation. University of Nebraska. Lincoln, Nebraska
Tabachinick, B. G., & Fidell, L. S. (2001). Using multivariate statistics (4th ed.).
Needham Heights, MA: Allyn & Bacon.
103
Taricani, E. M. (2002). Effects of the level of generativity in concept mapping with knowledge of correct response feedback on learning. Unpublished doctoral dissertation, Pennsylvania State University, University Park, Pa.
Treisman, A. (1979). The psychological reality of levels of processing. In L. S. Cermak
& F. I. M. Craik (eds.). Levels of processing in human memory (pp. 301–330). Hillside, NJ: Erlbaum.
Vosniadou, S. & Brewer, W. F. (1987). Theories of knowledge restructuring in
development. Review of Educational Research, 57, 51–67. Wachter, L. N. (1993). An investigation of the effects of hierarchical concept mapping as
a prefatory organizer on fourth-grade student’s comprehension and retention on expository prose. Unpublished doctoral dissertation, Pennsylvania State University, University Park, Pa.
Walker, J. T. (1996) The Psychology of Learning. NJ: Simon and Schuster Company. Wang, H. F. (1995). Effects of format and student completion of concept maps on college
students’ learning. Unpublished doctoral dissertation, University of Illinois at Urbana-Champaign.
West, C., Farmer, J., & Wolf, P. (1991). Instructional design. Implications from cognitive
science. Englewood Cliffs, NJ: Prentice Hall. Winn, W., & Snyder, D. (1996). Cognitive perspectives in psychology. In D. H. Jonassen
(ed.), Handbook of research for educational communications and technology. New York: Macmillan LIBRARY Reference USA.
104
Appendices
Appendix A: Informed Consent Form, Learning Material and the Criterion Tests
105
Appendix A.1: Informed Consent Form
106
Informed Consent Form (IRB# 01B1105)
The Penn State University, University Park Title of study The Instructional Effects of Varied Concept Mapping Strategies in Facilitating Achievement of Different Educational Objectives. Description 1. This study examines the effects of three concept mapping strategies in the web-based course and their relationship with prior knowledge levels. Concept mapping is a very useful learning strategy. It helps people clarify the concepts and their relationships by using graphics like lines and boxes. By conducting this research, the researcher hopes to find evidence of effective uses of concept mapping strategies in facilitating learning and their relationship with prior knowledge. 2. The study consists of two parts. In Part 1, you will be asked to take a prior knowledge test of physiology. The test contains 36 multiple choice questions and will probably take 10 ~ 15 minutes to finish it. Then, you are asked to participate in a concept map training workshop to learn concept mapping. This will take about 30 ~ 45 minutes. In Part 2, you will be convened in a University Park campus computer lab. You will be required to login online and browse a given website. This website contains an instructional material about human heart. Then you may be asked to do some concept mapping activities depending on which study group you are in. After you finish concept mapping activities, you will take three sets of tests. Each test has 20 multiple-choice questions relating to the instructional materials. Your participation in this research will take about approximately 2 hours (1 hour for each part). 3. There is no risks known of participating the study. Participating in this study, you will learn how to use concept mapping strategy. This is beneficial to your study in university. 4. You must be at least 18 years of age or older to participate in this study. You will receive extra credit for your course study by participating in this study. However, you can also earn this extra credit by doing alternative course assignment given by the instructor, which will take about the same amount of time and effort to complete. Consent form I have read this consent form and understand its content. I understand my participation is voluntary that I can stop participating in this study at any time or decline to answer any given questions at my own will. I also understand that my participation in this research is confidential to the degree permitted by the technology used. Specifically, no guarantees can be made regarding the interception of data sent via the Internet by any third parties. Only the person in charge will have access to my identity, and to the information that can be associated with my identity. I hereby agree to participate in this study. Participant Name ( in PRINT) ________________________ Participant’s Signature: ___________________________________ Date _October_____, 2002 ___ Researcher’s name: ______________________________________ Date _October 20, 2002___ If you have any questions or concerns, please contact the researcher and his advisor at Charles Xiaoxue Wang Dr. Frank Dwyer Graduate Circle, APT. 11-F# Keller Building 310B State College, PA 16801 State College, PA 16802 Tel: (814) 862-0106 (H); Email: [email protected] Tel: (814) 863-7382 (O), Email: [email protected]
107
Appendix A.2: Instructional Material
108
Instructional Materials By
Frank Dwyer
The Heart and Its Functions The human heart is a hallow, bluntly conical, muscular organ. Its pumping action provides the force that circulates the blood through the body. In the average adult, the heart is about five inches long and about two and one half inches thick. A man’s heart weighs about eleven ounces and a woman’s heart weighs about nine ounces. The heart lies toward the front of the body and is in a slanting position between the lungs, immediately below the breastbone. The wide end points toward the right shoulder. The small end of the heart points downward to the front of the chest and toward the left. The lower portion of the heart is called the apex and is the part that you feel beating. In order to better comprehend the following instruction, it will be helpful to visualize a cross-section view of a human heart in a position such that you are facing the person. As you visualizing it, the right side of the heart will be on the left side.
To understand the functioning of the heart you will need to be able to identify the parts of the heart. The heart is enclosed in a thin double-walled sac. The layer which forms the outer wall of the sac is called the pericardium. It is composed of a tough, transparent elastic tissue. It protests the heart from rubbing against the lungs and the walls of the chest. The inner portion of the double walled sac is called the epicardium. It is attached to the heart muscle.
The heart muscle is called the myocardium. It controls the contraction and
relaxation of the heart. The myocardium constitutes by far the greatest volume of the heart and its contraction is responsible for the propulsion of the blood throughout the body. The myocardium varies in thickness. For example, the myocardium forming the auricle walls is thin when compared to the thickness of the myocardium forming the ventricle walls.
The endocardium is the name given to the inside lining of the heart wall.
The human heart is really two pumps combined into a single organ which
circulates blood to all parts of the body. The heart is divided longitudinally into two halves by septum. The two halves may be compared to a block of two houses, which are independent of each other but have a common wall, the septum, between them.
Each half of the heart is divided into an upper chamber and a lower chamber; the
upper chamber are called auricles and the lower chamber are called ventricles. Although there is no direct communication between the right and left sides of the heart, both sides function simultaneously. As we stated previously, the upper chambers on each sides of the septum are auricles, the lower chambers are called ventricles. Auricles have thin walls and act as receiving rooms for the blood while the ventricles below act as pumps, moving the blood away from the heart.
109
As you would view a cross-sectional diagram of the heart, blood enters the right
auricle through veins. Only veins carry blood to the heart. The superior and inferior vena cavas are the two veins which deposit blood in the right auricle. The superior vena cava deposits blood into the right auricle from all body parts above the heart level, for example, the head and the arms.
The other vein, the inferior vena cava, deposits blood into the right auricle from
the trunk and legs --- that is from regions below the heart level. As blood from the body fills the right auricle, some of it begins to drip into the right ventricles immediately.
The auricles and ventricles on each side of the heart communicate with each other
through openings. The opening between the right auricle and right ventricle is called the tricuspid valve. This valve consists of three triangular flaps of thin, strong, fibrous tissue. These flaps permit the flow of blood into right ventricles, but prevent it from flowing backward into the right auricle because the ends of the flaps are anchored to the floor of the right ventricle by slender tendons.
The three flaps act like swinging doors which open only in one direction. Thus,
blood passes from the right auricle through the tricuspid valve into the right ventricle. As soon as the right ventricle is filled with blood, both ventricles begin to contract.
The first effect of the pressure produced in the right ventricle is to force blood
behind the flaps of the tricuspid valve. While the blood pressure behind the flaps brings the flaps together and prevents
the flow of the blood, the contraction of the right ventricle continues until the blood presses hard enough to open the pulmonary valve and to force the blood into the pulmonary artery. The pulmonary valve is located between the right ventricle and the pulmonary artery.
The pulmonary valve, like the tricuspid valve, consists of three flaps which fill
with blood backing up in the pulmonary artery. As soon as the right ventricle begins to relax from its contraction, the pulmonary valve prevents blood from flowing back into the right ventricle from the pulmonary artery. The pulmonary valve opens only when the pressure in the right ventricle is greater than the pressure in the pulmonary artery, forcing the blood into the pulmonary artery.
The pulmonary valve is composed of flaps or pockets, which the swollen
pulmonary artery quickly fill with blood as soon as the right ventricle begins to relax from its contraction. The flaps or pockets of the valve are thus pressed together, and no blood flows back into the right ventricle.
After the blood passes through the pulmonary valve it enters the pulmonary
artery, from which it is carried up through the heart to both the left and right lungs where it is cleaned and oxygenated.
110
Returning from the lungs, the blood enters the heart through four pulmonary veins
and collects in the left auricle. Like the right auricle, the left auricle also contracts when it is full, squeezing
blood through the mitral valve into the left ventricle. The mitral valve is located between the left auricle and left ventricle.
The mitral valve is similar in contraction to the tricuspid valve. As the left
ventricle contracts simultaneously with its mate, the right ventricle, it forces blood behind the flaps of the mitral valve, thereby closing the path back to the left auricle.
The contraction of the left ventricle pumps the blood through the entire body. For
this reason it is the largest, strongest, and most muscular section of the heart. When the left ventricle which is filled with blood contracts, the resulting pressure in the ventricle opens the aortic valve located in the mouth of the aorta.
The aorta is the largest artery which carries the blood from the left ventricle.
The Circulation of the Blood The directional flow of blood in the heart is determined by valves which allow the
blood to flow in only one direction. Both auricles receive blood simultaneously through unguarded opening in the
veins. The right auricle receives its blood through the superior and interior vena cavas while the left auricle receives its blood through the pulmonary veins.
A wave of muscular contraction starts at the top of the heart and passes
downward, simultaneously, over both sides of the heart; that is, both auricles contract at the same time and then relax as the contraction passes down to the ventricles. When the auricles are caused to contract they become small and pale, and in doing so the blood in their chambers is subjected to increased pressure which forces blood through both the tricuspid and mitral valves.
As the ventricles fill, eddies of the blood float the flaps on both the tricuspid and
mitral valves out to a partially closed position. As the ventricle pressure becomes greater than that in the auricles, the valves are tightly closed and so prevent blood from being forced backward into the auricles.
While the auricles are relaxing from the contraction, blood flows into them from
the veins as the contraction of the ventricle is initiated. The instant that the contraction of the auricles has been completed, the ventricles
are stimulated to contract; this contraction increases the pressure in the chambers forcing the valves, both the tricuspid and mitral, completely shut.
111
The pulmonary valve and aortic valve, also called the semi-lunar-valves, that
guard the entrances to the pulmonary artery on the right and aortic artery on the left are closed by the back pressure provided by blood already in these vessels. When the ventricle pressure becomes greater than in the exit vessels, the pulmonary and aortic valves open.
Blood flows from the right ventricles into pulmonary artery then route to the
lungs and from the left ventricle into the aorta for distribution through the entire body. Immediately following ejection of blood into the arteries, the ventricles begin to
relax; this lowers the pressure within their chambers, and the greater pressure in the arteries closed the semi-lunar valves. Pressure within the ventricle is sufficient, however, to maintain closure of the tricuspid and mitral valves against the already increasing auricle pressure.
As the ventricles relax further, pressure within them decreases correspondingly, and the tricuspid ad mitral valves are forced open by increased auricle pressure caused by blood flowing into them from veins. Therefore, before the next auricle contraction, blood is already flowing from the auricles into the ventricles because a greater blood pressure exits in the auricles than in ventricles.
The Cycle of the Heartbeat Consists of Two Parts The relaxation of the ventricles, during which they are filled with blood is called
the diastolic phase. The heart relaxes between beats in the diastolic phase. Blood flows into the heart
filling both auricles. While blood is flowing into the auricles, the recoil of the artery wall still maintains part of the pressure developed by the contraction of the ventricles. This is the time of lowest pressure in the arteries or what is called the diastolic pressure.
The contraction phase or systolic phase begins when the auricles contract. The
blood forces sits way through the mitral and tricuspid valves into ventricles. The ventricles contract and force the blood through the semi-lunar valves, that is,
the pulmonary and aortic valves. After passing through the pulmonary and aortic valves the blood enters the
pulmonary and aortic arteries. The blood leaves the ventricles under terrific pressure and surges through the arteries with a force so great that it bulges their elastic walls. At this point, arterial blood pressure is greatest; this pressure is called the systolic pressure. The heart relaxes again and the tricuspid and mitral valves close. Blood flows into the auricles; the mitral and tricuspid valves are forced to open, and the cycle begins again.
112
Appendix A.3: Prior Knowledge Test of Physiology
113
Prior Knowledge Test of Human Physiology
First Name (in PRINT)____________________ Last Name (in PRINT) ____________________ Your Class Section Number _______________
Directions: Please select ONE answer which you feel best completes the sentence by circling the letter of the given choices.
1. The part of the tooth which contains the hardest substance in the body is the:
A root B Dentine C cement D Enamel
2. The digestion of food occurs principally in the:
A stomach B small intestine C mouth D large intestine
3. Contraction of the smooth muscle of the alimentary canal is called:
A peristalsis B digestion C absorption D assimilation
4. Worn-out red blood cells are decomposed in the:
A heart B lungs C kidneys D liver
5. "Swollen glands" means an enlargement of the:
A lymph nodes B heart valves C vena cava D protal vein
6. The chief value of perspiration is that it
A eliminates body odors B opens the pores C reduces weight D regulates body temperature
114
7. Endocrine glands produce:
A enzyme B endoplasm C hormones D serums
8. The body is stimulated to unusual activity by increased secretion from the:
A pancreas B adrenal glands C thyroid gland D thymus gland
9. The spinal cord is made up of:
A bone tissue B cartilage tissue C connective tissue D nerve tissue
10. Nerves from the eyes and ears are connected to the:
A cerebellum B cerebrum C medulla D spinal cord
11. The chromosome number of the body cells of identical human twins is:
A 12 B 24 C 46 D 92
12. The person who can give blood to any other person but can receive only his own
type blood has blood type:
A A B O C AB D B
13. The ribs are attached to the spine and meet in front of the body at the:
A skull B limbs C joints D breastbone
14. The ribs protect the:
A stomach B breastbone C spinal cord D lungs
115
15. The hollow interior of the long bones is filled with:
A marrow B minerals C red and white corpuscles D Haversian canals
16. The windpipe is located _______ the esophagus:
A in front of B behind C to the left of D to the right of
17. The carbon dioxide-oxygen exchange with the atmosphere occurs in the:
A nose B trachea C lungs D bronchi
18. Blood is oxygenated in the capillaries of:
A air sacs B heart C muscle D liver
19. During inspiration, the ribs:
A do not move B move downward C move inward D move upward
20. The part of the brain that controls respiration is the:
A medulla B cerebellum C cerebrum D spinal cord
21. A defense of the body against bacteria is:
A hemoglobin B phagocytes C red blood cells D blood platelets
116
22. The disease hemophilia is associated with
A the bone structure B blood clotting C the structure of nervous tissue D the formation of red corpuscles
23. The liquid that bathes every cell and acts as a medium of exchange is:
A cell sap B fibrinogen C lymph D fibrin
24. Urine is stored in an organ called the:
A diaphragm B kidney C bladder D lungs
25. Secretions of the ductless glands pass:
A into tubes or ducts B directly into the blood C directly into the organs where
they are used D out of the body
26. Inactivity of the thyroid gland from infancy may produce a condition known as:
A diabetes B beriberi C cretinism D Addison's disease
27. The concentration of sodium and potassium in the blood is controlled by:
A adrenin B cortin C insulin D secretin
28. Diabetes is caused by the improper functioning of the:
A parathyroids B thyroids C pancreas D adrenals
29. The adult human heart is said to beat approximately _________ times per minute.
A 85 B 72 C 60 D 58
117
30. Growth and repair of body tissue involves:
A protein B fats C starch D sugar
31. Blood enters the heart through:
A arteries B vena cavas C the aortic arch D pulmonary veins
32. Blood leaves the heart through the:
A tricuspid valve B aorta C superior vena cava D mitral valve
33. The portion of the heart which divides longitudinally into 2 halves is called the:
A myocardium B tendons C pericardium D septum
34. A blood vessel which carries deoxygenated blood is the:
A aorta B pulmonary artery C hepatic artery D pulmonary vein
35. The backward flow of blood in the veins is prevented by:
A muscles B valves C the heart beat D lymphatics
36. The chamber of the heart which pumps oxygenated blood to all the parts of the
body is the:
A left auricle B right ventricle C right auricle D left ventricle
THANK YOU VERY MUCH!
118
Appendix A.4: Criterion Tests
119
Criterion Tests This is the last part of the study. Please type your full name. Your name is used for reporting your participation to the course professor for extra course credit. Please remember to fill in your time at the beginning and at the end of each test. Thank you very much and good luck!
Your Full Name:______________________ What time is it now? __________________(according to the time on your computer)
Identification Test
Directions: Select ONE best answer that identifies the part of the heart indicated by the numbered arrow by clicking on the radio button. (All the heart images are the same.)
1. Arrow number one (1) points to the _________. A. Septum B. Aorta C. Pulmonary Artery D. Pulmonary Vein E. None of These above 2. Arrow number two (2) points to the __________. A. Superior Vena Cava B. Inferior Vena Cana C. Pulmonary Artery D. Tricuspid Valve E. Aorta 3. Arrow number three (3) points to the _________. A. Right Ventricle B. Right Auricle C. Left Auricle D. Left Ventricle E. Heart Muscle 4. Arrow number four (4) points to the __________. A. Pulmonary Valve B. Pulmonary Vein C. Aortic Valve D. Tricuspid Valve E. Mitral Valve 5. Arrow number five (5) points to the _________. A. Aorta B. Pulmonary Artery C. Superior Vena Cava D. Inferior Vena Cava E. Pulmonary Vein 6. Arrow number six (6) points to the __________. A. Aortic Valve B. Pulmonary Valve C. Mitral Valve D. Tricuspid Valve E. Semi-lunar Valve 7. Arrow number seven (7) points to the _________. A. Left Ventricle B. Right Ventricle C. Right Auricle D. Left Auricle
E. Vascular Space
120
8. Arrow number eight (8) points to the __________. A. Myocardium B. Ectoderm C. Pericardium D. Endocardium E. Epicardium 9. Arrow number nine (9) points to the _________. A. Endocardium B. Myocardium C. Pericardium D. Ectoderm E. Septum 10. Arrow number ten (10) points to the _________. A. Endocardium B. Pericardium C. Septum D. Myocardium E. Aortic Valve 11. Arrow number eleven (11) points to the ________. A. Epicardium B. Pericardium C. Endocardium D. Myocardium E. None of These 12. Arrow number twelve (12) points to the _________. A. Pericardium B. Myocardium C. Endocardium D. Endoderm E. Apex 13. Arrow number three (13) points to the _________. A. Pericardium B. Endocardium C. Ectocardium D. Endoderm E. Myocardium 14. Arrow number four (14) points to the __________. A. Right Ventricle B. Left Ventricle C. Left Auricle D. Right Auricle E. Apex 15. Arrow number five (15) points to the _________. A. Pulmonary Veins B. Tendons C. Aortas D. Pericardium E. None of These 16. Arrow number six (16) points to the __________. A. Venic Valve B. Pulmonary Valve C. Tricuspid Valve D. Mitral Valve E. Aortic Valve 17. Arrow number seven (17) points to the _________. A. Superior Vena Cava B. Tricuspid Valve C. Aortic Valve D. Pulmonary Valve E. Mitral Valve 18. Arrow number eight (18) points to the ______. A. Right Auricle B. Right Ventricle C. Left Auricle D. Left Ventricle E. Semi-Lunar Chamber
121
19. Arrow number nine (19) points to the _________. A. Inferior Vena Cava B. Superior Vena Cava C. Aortas D. Pulmonary Veins E. Pulmonary Arteries 20. Arrow number ten (20) points to the _________. A. Inferior Vena Cava B. Aorta C. Pulmonary Artery D. Septum
E. Superior Vena Cava
What time is it now? __________________(according to the time on your computer) (Please continue to the Test of Terminology)
Terminology Test
Directions: Select ONE answer you feel best completes the sentence by clicking the given radio button. 21. ___________ is (are) the thickest walled
chamber(s) of the heart. 22. The contraction of the heart occurs during
the ____________ phase. A. Auricles A. Systolic B. Myocardium B. Sympathetic C. Ventricles C. Diastolic D. Pericardium D. Parasympathetic E. Endocardium E. Sympatric 23. Lowest blood pressure in the arteries
occurs during the ___________ phase. 24. Blood from the right ventricle goes to the
lungs through the ____________. A. Sympatric A. Tricuspid Valve B. Sympathetic B. Aortic Artery C. Diastolic C. Pulmonary Artery D. Systolic D. Pulmonary Veins E. Parasympathetic E. Superior Vena Cava 25. The ___________ is (are) the strongest
section(s) of the heart. 26. When blood runs through the heart from
the lungs, it enters the ____________ . A. Left Ventricle A. Left Auricle B. Aorta B. Pulmonary Valve C. Septum C. Left Ventricle D. Right Ventricle D. Right Ventricle E. Tendons E. Pulmonary Artery 27. Vessels that allow the blood to flow from
the heart are called the ___________ . 28. Blood passes from the left ventricle out the
aortic valve to the ___________. A. Veins A. Lungs B. Arteries B. Body C. Apex C. Aorta D. Tendons D. Pulmonary Artery E. Valves E. Left Auricle
122
29. The chamber of the heart which pumps oxygenated blood to all parts of the body is the ___________ .
30. The ____________ is another name for the part of the heart called the heart muscle.
A. Right Auricle A. Apex B. Left Auricle B. Epicardium C. Aorta C. Endocardium D. Left Ventricle D. Myocardium E. Right Ventricle E. Septum 31. _____________ is (are) the part(s) of the
heart which controls its contraction and relaxation.
32. The ____________ is the name given to the inside lining of the heart wall.
A. Myocardium A. Epicardium B. Endocardium B. Endocardium C. Ventricles C. Pericardium D. Auricles D. Myocardium E. Septum E. Septum 33. Blood from the body enters the heart
through the ___________. 34. The membrane which borders on the inside
lining of the pericardium and is connected to the heart muscle is called ____________.
A. Aortic Artery A. Extoxim B. Pulmonary Veins B. Epicardium C. Pulmonary Artery C. Endocardium D. Superior and Inferior Vena Cavas D. Myocardium E. Superior Vena Cava Only E. Ectocardium 35. The _____________ allow(s) blood travel
in one direction only. 36. The ______________ is the common
opening between the right auricle and the right ventricle.
A. Septum A. Mitral Valve B. Valves B. Tricuspid Valve C. Arteries C. Septic Valve D. Veins D. Pulmonary Valve E. Tendons E. Aortic Valve 37. The _____________ is a triangular
flapped valve between the left auricle and the left ventricle.
38. The semi-lunar valves are located at the entrance to the _____________.
A. Aortic Valve A. Pulmonary Veins B. Pulmonary Valve B. Superior and Inferior Vena Cavas C. Septic Valve C. Pulmonary and Aortic Arteries D. Tricuspid Valve D. Mitral and Tricuspid Valves E. Mitral Valve E. Ventricles 39. The outside covering of the heart is called
the _____________.
40. Immediately before entering the aorta, blood must pass through the ______________.
A. Endocardium A. Left Ventricle B. Epicardium B. Mitral Valve C. Pericardium C. Lungs D. Myocardium D. Superior Vena Cava E. None of These E. Aortic Valve What time is it now? __________________(according to the time on your computer)
(Please continue to the Test of Comprehension)
123
Comprehension Test
Directions: Select ONE answer that you feel best completes the sentence by clicking the given radio button. 41. Which valve is most like the tricuspid in
function? 42. When the blood is being forced out the
right ventricle, in which position is the tricuspid valve?
A. Pulmonary A. Beginning to Open B. Aortic B. Beginning to Close C. Mitral C. Open D. Superior Vena Cava D. Closed 43 When the blood is being forced out the
aorta, it is also being forced out of the ____________ .
44. The contraction impulse in the heart starts in ___________ .
A. Pulmonary Veins A. The Right Auricle B. Pulmonary Arteries B. Both Ventricles Simultaneously C. Superior Vena Cava C. Both Auricles Simultaneously D. Cardiac Artery D. The Arteries 45. In the diastolic phase the ventricles are
___________.
46. During the first contraction of the systolic phase, in what position will the mitral valve be?
A. Contracting, Full of Blood A. Beginning to Open B. Contracting, Partially Full of Blood B. Open C. Relaxing, Full of Blood C. Beginning to Close D. Relaxing, Partially Full of Blood D. Close 47. During the second contraction of the
systolic phase, blood is being forced from the heart through the ______________.
48. When the blood is entering through the vena cavas, it is also entering through the ___________ .
A. Pulmonary and Aortic Arteries A. Mitral Valves B. Superior and Inferior Vena Cavas B. Pulmonary Veins C. Tricuspid and Mitral Valves C. Pulmonary Artery D. Pulmonary Veins D. Aorta 49. When the heart contracts the
_____________.
50. While the blood from the body is entering the superior vena cava, blood from the body is also entering through the ___________.
A. Auricles and Ventricles Contract Simultaneously
A. Pulmonary Veins
B. Ventricles Contract First, Then the Auricles B. Aorta C. Right Side Contract first, Then the Left Side C. Inferior Vena Cava D. Auricles Contract First, Then, the Ventricles D. Pulmonary Artery 51. When the blood leave the heart through
the pulmonary artery, it is also simultaneously leaving the heart through the _____________ .
52. When the pressure in the right ventricle is superior to that in the pulmonary artery, in what position is the tricuspid valve?
A. Tricuspid Valve A. Closed B. Pulmonary Veins B. Open C. Aorta C. Beginning to Close D. Pulmonary Valve D. Confined by Pressure from the Right Auricle
124
53. When the ventricles contract, blood is
forced out the ____________ .
54. Blood leaving the heart through the aorta had left the heart previously through the _____________ .
A. Superior and Inferior Vena Cavas A. Vena Cavas B. Pulmonary Veins B. Pulmonary Veins C. Tricuspid and Mitral Valves C. Pulmonary Artery D. Pulmonary and Aortic Valves D. Tricuspid and Mitral Valves 55. When the blood in the aorta is exerting a
superior pressure on the aortic valve, what is the position of the mitral valve?
56. When the tricuspid and mitral valves are forced shut, in what position is the pulmonary valve?
A. Closed A. Closed B. Open B. Beginning to Open C. Beginning to Open C. Open D. Confined by Pressure from the Right
Ventricle D. Beginning to Close
57. During the second contraction of the
systolic phase, in what position is the aortic valve?
58. Blood is being forced out the auricles simultaneously as blood is ____________ .
A. Fully Open A. Entering Only the Vena Cavas
B. Partially Open B. Being Forced Out the Pulmonary and Aortic Valves
C. Partially Closed C. Passing through the Tricuspid & Mitral Valves
D. Fully Closed D. Being Forced Out through the Pulmonary Artery
59. If the aortic valve is completely open, the
_______________. 60. When the heart relaxes, the
_____________. A. Second Contraction of the Systolic Phase Is
Occurring A. Auricles Relax First, Then the Ventricles
B. Diastolic Phase Is Occurring B. Right Side Relaxes First, Then the Left Side C. Tricuspid & Mitral Valves Are Completely
Open C. Left Side Relaxes First, Then the Right Side
D. Blood Is Rushing into the Right & Left Ventricles
D. Ventricles Relax First, Then the Auricles
This is the end of the study. Please notice that once you click the "submit" button, you will not be able to do the test again. You should see a "Thank you" note page after successful submission. If not, please let our assistant know about it. Thank you!
Click the button to Submit
. Please leave the lab quietly and thank you for your participation!
125
Appendix B: Concept map workshop materials
126
Appendix B.1: Concept Map Workshop Material for the First Pilot Study
127
Concept Mapping (Workshop Handout)
Charles Xiaoxue Wang
The College of Education Pennsylvania State University
Fall 2001
128
Use Concept Map to Summarize Your Reading Look at the cartoon picture on the cover of this handout. Do you feel that it reveals some truth there? In most cases, you are appreciated by what you have done rather than how hard you get it done. This is specially true in academia. We read a lot as university students but what are about the results of your reading? Do you remember the last time when you were desperately searching in your memory for the information you needed? You knew it was there but you just could not dig it out! This workshop will introduce you how to use concept mapping to avoid this embarrassing situation. 1. What is a concept map?
Concept map is a graphic representation of ideas and concepts. It consists of concepts or nodes linked by labeled lines to show relationships and inter-relationships between terms. Concepts are arranged hierarchically so that the most inclusive, subsumptive concepts appear at the top of the map, with less inclusive, subordinate concepts below (Jonassen & Grabowski, 1993, p.439). Look at following example of concept map.
129
2. Concept mapping as a learning tool • To summarize reading materials • To organize knowledge domains • To organize ideas for writing and research • To plan your research project and identify the variables in it. • to fix learned materials in long-term memory • to revise effectively for examination.
3. How to summarize reading materials through concept mapping To summarize your reading materials through concept mapping, you need to be able to do the following:
• Identify the topic, main concepts and sub-concepts in your reading for concept mapping.
• Clarify the four main types of inter-relationships among the topic, main concepts, and sub-concepts.
• Select appropriate graphic symbols for concept mapping. • Apply some basic strategies in concept mapping. • Follow certain procedure of concept mapping. • Actual mapping and editing the concept map.
130
4. Exercise: Please map out the following passage and compare yours with others’.
Changing Engine Oil From “Nissan Sentra Owner’s Manual” (1993)
To change engine oil is not difficult. As a matter of fact, it’s one of the simplest (and most valuable) operations you can perform on your car. All you’ll need is the oil, an oil filter, a drain pan of some type, an oil spout, an adjustable wrench, and a filter wrench. In preparing for the oil change, besides getting tools listed above ready, you need to warm the car up and then raise the front end of the car by supporting it on drive-on ramps or jackstands. In draining the oil, first you need to locate the drain plug on the bottom of the oil pan and slide a low flat pan of sufficient capacity under the engine to catch the oil. Then, loosen the plug with a wrench and turn it out to drain the oil. After the oil is drained out, use a rag clean the drain plug and the area around the drain hole in the oil pan. Finally, install the drain plug and tighten it finger-tight. If you feel resistance, stop and be sure you are not cross-threading the plug. In changing the filter, you first remove the oil filter with a filter wrench. The filter can hold more than a quart of oil, which will be hot. Then, make sure to clean the mounting
131
base on the engine. Now, position a new filter on the mounting base and spin it on by hand. Do not use a wrench. When the gasket contacts the engine, tighten it another ½ - 1 turn by hand. In refilling the engine oil, locate the oil cap on the valve cover. Then, remove the cap and add oil to the engine. An oil spout is the easiest way to do it, but a funnel will do just as well.
Finally, in checking for leaks, start the engine and see if the oil pressure warning light will remain on for a few seconds; when it goes out, stop the engine and check the level on the dipstick.
5. Final Words Different people may have different ways to represent what they read. Your concept map should reflect your understanding of the content. It is always advisable to write a follow-up note describing what you have mapped. If you want to know more about concept mapping, please go to the following sites. Thanks for your participating in this workshop! Discovery of Concept Map: http://www.personal.psu.edu/users/x/q/xqw1/insys441b/index.htm Build a Concept Map: http://www.personal.psu.edu/users/x/q/xqw1/insys441d/index.htm. Answer for reference
132
Changing Engine Oil
Creating Your Procedural Concept Map (Wang, 2000)
1. Preparing for the oil change
2. Draining the oil
5. Checking for leaks
4.
Refilling
3. Changing the filter
A
A
2.5 Install the drain
plug
1.1 Get tools ready &
warm up the
1.2 Raise the front end of
the car
2.1 Locate the drain
plug
2.2 Loosen the plug
2.3 Drain the oil
2.4 Clean the drain
plug
3.1 Remove the oil filter
3.2 Cleaning the mounting base
3.3 Position a new filter
4.3
Add the oil
4.2 Remove the cap
4.1 Locate the oil cap
5.1Start the engine & check the oil pressure
warning light
5.2 Stop the engine & check the level on the dipstick
Main Steps
Sub-steps
sequence
A
Go to
133
Appendix B.2: Concept Map Workshop Material for the Second Pilot Study
134
Con
cept
Map
Wor
ksho
p O
utlin
e (f
or S
econ
d P
ilot)
1.
Wh
at a
re c
on
cep
t m
aps?
Con
cept
map
s ar
e m
ost c
omm
only
def
ined
as
two-
dim
ensi
onal
dia
gram
s th
at c
onsi
st o
f con
cept
s or
node
s lin
ked
by la
bele
d lin
es to
sho
w r
elat
ions
hips
bet
wee
n an
d am
ong
thos
e co
ncep
ts. T
he
conc
epts
are
usu
ally
arr
ange
d hi
erar
chic
ally
with
the
mos
t inc
lusi
ve, g
ener
al c
once
pts
appe
ar a
t the
top
of th
e m
ap a
nd th
e le
ss in
clus
ive,
sub
ordi
nate
con
cept
s be
low
.
135
2.
W
hy
con
cep
t m
aps
wo
rk?
a.
Link
ing
new
con
cept
with
wha
t we
knew
:
• “B
ig, s
hini
ng, n
oisy
bird
” = “A
irpla
ne”.
b.
Exp
andi
ng th
e ca
paci
ty o
f our
sho
rt te
rm m
emor
y
• M
ake
abst
ract
idea
s an
d co
ncep
ts in
tang
ible
form
.
c.
Mea
ning
ful l
earn
ing
expe
rienc
e
• D
isco
verin
g th
e ne
w r
elat
ions
hip
amon
g co
ncep
ts
• M
ake
the
impl
icit
expl
icit
• In
crea
se th
e irr
etrie
vabi
lity
3.
Ho
w c
ou
ld c
on
cep
t m
aps
hel
p m
e w
ith
my
stu
dy?
d.
Usi
ng c
once
pt m
aps
to s
umm
ariz
e yo
ur s
tudy
• P
repa
ring
for t
he te
st –
big
and
hol
istic
pic
ture
you
r st
udy
• Id
entif
y yo
ur w
eak
poin
ts
e.
Usi
ng c
once
pt m
aps
to o
rgan
ize
your
stu
dy
• P
riorit
ize
your
stu
dy e
ffort
• Z
oom
ing
in a
nd z
oom
ing
out
f. U
sing
con
cept
map
s to
enh
ance
you
r co
mm
unic
atio
n
• P
rese
ntat
ion
--- p
roje
ct o
verv
iew
136
4.
Ho
w t
o c
reat
e a
con
cep
t m
ap
Th
ree
com
po
nen
ts:
Con
cept
s, p
ropo
sitio
ns, a
nd s
truc
ture
of c
once
pt m
ap
137
5.
Pro
ced
ure
of
crea
tin
g c
on
cep
t m
aps:
• Id
enti
fy t
he
con
cep
ts t
o m
ap
o T
opic
s, m
ain
conc
epts
, and
sub
-con
cept
s
• Id
enti
fy th
e re
lati
on
ship
s
o T
opic
s &
mai
n co
ncep
ts a
nd m
ain
conc
epts
& s
ub-c
once
pts
138
o F
requ
ently
use
d ca
tego
ries
of r
elat
ions
§ se
t/sub
-set
ha
s ex
ampl
e/ is
an
exam
ple
of
§ w
hole
/par
t ha
s pa
rt/ i
s a
part
of/i
nclu
des/
cove
rs
§ ch
arac
teris
tics
has
char
acte
ristic
s/is
a c
hara
cter
istic
of
§ ca
usal
ca
uses
/is c
ause
d by
§ sp
atia
l/tem
pora
l occ
urre
d at
/loc
atio
n or
tim
e of
§ do
er/a
ctio
n A
cts
as, f
unct
ion,
con
trol
, etc
….
(Ada
pted
from
Lap
p, F
lood
, & H
offm
an (1
998)
Usi
ng c
once
pt m
appi
ng a
s an
effe
ctiv
e
stra
tegy
in c
onte
nt a
rea
inst
ruct
ion.
In C
onte
nt A
rea
Rea
ding
and
Lea
rnin
g.)
• S
elec
t gra
ph
ics
and
dec
ide
the
stru
ctu
re
o B
e si
mpl
e an
d co
nsis
tent
• L
et’s
pra
ctic
e
o T
-Tes
ts
o W
hat
is p
sych
olo
gy?
o T
he
Aim
, Res
earc
h M
eth
od
s, a
nd
Go
als
of
psy
cho
log
y
139
• C
hec
k lis
t fo
r co
nce
pt
map
pin
g
(1)
Are
topi
cs, m
ain
conc
epts
and
sub
-con
cept
s cl
ear
and
corr
ectly
exp
ress
ed.
(2)
Do
link
wor
ds/p
hras
es c
orre
ctly
and
cle
arly
exp
ress
the
rela
tions
bet
wee
n th
e to
pics
,
mai
n co
ncep
ts a
nd s
ub-c
once
pts?
(3)
Are
the
grap
hics
use
d fo
r m
appi
ng s
impl
e an
d co
nsis
tent
?
(4)
Is th
e co
ncep
t map
an
effe
ctiv
e pr
esen
tatio
n of
the
topi
c?
(5)
Can
you
tell
wha
t the
mai
n co
ncep
ts a
re in
you
r m
ap w
ithou
t loo
king
at i
t? (
A g
ood
conc
ept m
ap s
houl
d he
lp y
ou r
emem
ber
them
.)
140
Rea
ding
for
Con
cept
Map
ping
Wor
ksho
p A
ctiv
itie
s T
-Tes
ts
T
he t-
test
ass
esse
s w
heth
er th
e m
eans
of
two
grou
ps a
re
stat
istic
ally
diff
eren
t fr
om e
ach
othe
r. Th
e pu
rpos
e of
the
t-te
st
is to
det
erm
ine
whe
ther
the
diff
eren
ce in
two
mea
ns is
like
ly to
be
due
to
chan
ce o
r to
som
e ot
her
caus
e, s
uch
as, a
tre
atm
ent.
So
it is
w
idel
y us
ed
to
test
th
e hy
poth
esis
es
peci
ally
in
ra
ndom
ized
exp
erim
enta
l des
ign.
Th
ere
are
two
kind
s of
t-te
st:
inde
pend
ent
t-tes
t an
d de
pend
ent
t-tes
t. In
depe
nden
t t-t
est
is s
omet
imes
cal
led
two-
sam
ple
t-tes
t or
stu
dent
’s t-
test
. D
epen
dent
t-te
st i
s so
met
imes
ca
lled
paire
d-sa
mpl
es t-
test
or c
orre
late
d t-t
est.
Inde
pend
ent
t-tes
t (tw
o-sa
mpl
e t-t
est,
stud
ent’
s t-te
st):
This
is u
sed
to c
ompa
re th
e m
eans
of
one
inde
pend
ent v
aria
ble
for
two
grou
ps o
f ca
ses.
As
an e
xam
ple,
in s
ocia
l stu
dy, p
eopl
e m
ay w
ant t
o co
mpa
re m
ean
diff
eren
ce o
f in
com
e be
twee
n m
ale
facu
lty a
nd f
emal
e fa
culty
in
a un
iver
sity
. In
thi
s ca
se,
the
inde
pend
ent
varia
ble
iden
tifie
d is
inc
ome
whi
le t
he t
wo
grou
ps
are
mal
e fa
culty
and
fem
ale
facu
lty o
f a
parti
cula
r un
iver
sity
. In
shor
t, in
depe
nden
t t-t
est
to
com
pare
th
e sa
me
inde
pend
ent
varia
ble
of tw
o di
ffer
ent g
roup
s.
D
epen
dent
t-t
est
(pai
red-
sam
ples
t-t
est,
corr
elat
ed
t-te
st):
Thi
s is
use
d to
com
pare
the
mea
ns o
f tw
o de
pend
ent
varia
bles
fo
r a
sing
le
grou
p.
The
proc
edur
e co
mpu
tes
the
diff
eren
ces
betw
een
valu
es o
f th
e tw
o de
pend
ent v
aria
bles
for
eac
h ca
se a
nd t
ests
whe
ther
the
ave
rage
diff
ers
from
zer
o. F
or e
xam
ple,
yo
u m
ay b
e in
tere
sted
to
eval
uate
the
eff
ectiv
enes
s of
a r
eadi
ng
prog
ram
. B
efor
e th
e pr
ogra
m s
tarts
, yo
u gi
ve t
rain
ees
a pr
etes
t to
mea
sure
the
ir re
adin
g ab
ility
. At
the
end
of t
he p
rogr
am, y
ou g
ive
them
a p
ost-t
est
to m
easu
re t
heir
read
ing
abili
ty a
gain
. Th
us e
ach
subj
ect
has
two
mea
sure
s,
som
etim
es
calle
d,
befo
re
and
afte
rm
easu
res.
By
com
parin
g th
e re
sults
of
the
two
test
s, y
ou c
ould
fin
d ou
t th
e ef
fect
iven
ess
of t
he r
eadi
ng p
rogr
am.
In t
his
case
, th
e tw
o de
pend
ent
varia
bles
are
the
res
ults
of
pret
est
and
post
-test
. Th
e re
sults
are
of
the
sam
e gr
oup
---
peop
le p
artic
ipat
e in
the
rea
ding
pr
ogra
m.
--
- Ada
pted
from
Yod
er, E
. (20
01).
AE
E 5
21 C
ours
e H
ando
ut. T
he
Col
lege
of A
gric
ultu
ral S
cien
ces,
Pen
nsyl
vani
a St
ate
Uni
vers
ity
Wha
t is
psyc
holo
gy?
Psyc
holo
gy i
s de
fined
as
the
scie
nce
of b
ehav
ior
and
cogn
ition
. B
ehav
ior
is g
ener
ally
def
ined
as
anyt
hing
you
do,
esp
ecia
lly if
it is
ob
serv
able
to
ot
hers
. Ps
ycho
logi
sts
emph
asiz
e th
e st
udy
of
beha
vior
bec
ause
it c
an b
e ob
serv
ed a
nd re
cord
ed. M
any
beha
vior
s,
141
Rea
ding
for
Con
cept
Map
ping
Wor
ksho
p A
ctiv
itie
s su
ch a
s ea
ting,
talk
ing,
writ
ing,
runn
ing,
or f
ight
ing,
are
eas
ily
obse
rvab
le.
Cog
nitio
n in
clud
es
men
tal
proc
esse
s lik
e dr
eam
ing,
th
inki
ng,
rem
embe
ring,
or
solv
ing
prob
lem
s. T
hese
cog
nitiv
e ac
tiviti
es a
re u
sual
ly n
ot o
bser
vabl
e, a
nd o
ften
stud
ied
thro
ugh
self-
repo
rts p
rovi
ded
by r
esea
rch
subj
ects
. C
ogni
tive
beha
vior
is
now
usu
ally
incl
uded
in th
e ge
nera
l con
cept
of b
ehav
ior.
A
noth
er a
rea
of s
cien
tific
stu
dy o
f ps
ycho
logy
is
the
biol
ogic
al,
or
phys
iolo
gica
l pr
oces
ses
that
of
ten
acco
mpa
ny
both
be
havi
or
and
cogn
ition
. B
rain
w
ave
activ
ity
durin
g dr
eam
ing
or
thin
king
, he
art
rate
du
ring
stro
ng
emot
ion
or
fight
ing,
or
bl
ood
chem
istry
ch
ange
s du
ring
eatin
g ar
e ex
ampl
es o
f phy
siol
ogic
al p
roce
sses
.
Whi
le s
ome
psyc
holo
gist
may
foc
us o
n on
e ar
ea, m
any
stud
y ps
ycho
logy
fro
m a
ll th
e th
ree
pers
pect
ives
. Si
nce
the
beha
vior
al,
cogn
itive
, an
d ph
ysio
logi
cal
proc
esse
s ar
e us
ually
in
terc
onne
cted
, man
y ps
ycho
logi
sts
incl
ude
all
thre
e w
hen
they
di
scus
s th
e co
ncep
t of
be
havi
or.
Her
e be
havi
or
incl
udes
ob
serv
able
act
ions
, co
gniti
ve a
ctiv
ities
, an
d th
eir
phys
iolo
gica
l pr
oces
ses.
Ado
pted
from
Pet
tijoh
n (1
989)
Psy
chol
ogy:
A C
onci
se
Intr
oduc
tion
The
aim
, res
earc
h m
etho
ds, a
nd g
oals
of
psyc
holo
gy
Ps
ycho
logy
is
de
fined
as
th
e sc
ienc
e of
be
havi
or
and
cogn
ition
. A
s a
scie
nce,
psy
chol
ogy
shar
es g
oals
and
sci
entif
ic
met
hods
with
oth
er s
cien
ces,
suc
h as
bio
logy
, che
mis
try, s
ocio
logy
, an
d an
thro
polo
gy.
Scie
ntis
ts b
egin
with
a b
ody
of k
now
ledg
e an
d th
en,
proc
eed
syst
emat
ical
ly t
o in
vest
igat
e a
topi
c to
add
to
that
bo
dy o
f kn
owle
dge.
Sci
entis
ts u
se a
var
iety
of
rese
arch
met
hods
, in
clud
ing
obse
rvat
ion,
sur
vey,
tes
t an
d ex
perim
ent.
Thes
e re
sear
ch
met
hods
al
low
sc
ient
ists
to
re
ach
the
goal
s of
de
scrip
tion,
pr
edic
tion,
co
ntro
l an
d ex
plan
atio
n.
The
ultim
ate
aim
fo
r ps
ycho
logi
sts
is to
und
erst
and
beha
vior
and
hel
p pe
ople
.
As
an e
xam
ple
of t
his
aim
, m
any
clin
ical
and
cou
nsel
ing
psyc
holo
gist
s ar
e in
volv
ed i
n he
lpin
g pe
ople
with
per
sona
l an
d em
otio
nal
prob
lem
s. O
ther
s, c
alle
d ex
perim
enta
l ps
ycho
logi
sts,
are
en
gage
d in
res
earc
h to
dis
cove
r th
e ba
sic
prin
cipl
es o
f be
havi
or,
usin
g a
wid
e va
riety
of
subj
ects
: m
onke
ys,
rats
, an
d pe
ople
. St
ill
othe
r ps
ycho
logi
sts
are
busy
app
lyin
g re
sear
ch f
indi
ngs
to p
eopl
e’s
ever
yday
pr
oble
ms.
C
onsu
mer
ps
ycho
logi
sts,
st
udy
purc
hasi
ng
beha
vior
, in
clud
ing
wha
t ty
pe o
f ad
verti
sem
ents
inf
luen
ce p
eopl
e m
ost.
Educ
atio
nal
psyc
holo
gist
s m
ake
teac
hing
and
lea
rnin
g m
ore
effe
ctiv
e.
And
so
cial
ps
ycho
logi
sts
are
invo
lved
in
re
duci
ng
prej
udic
e an
d ag
gres
sion
.
142
Rea
ding
for
Con
cept
Map
ping
Wor
ksho
p A
ctiv
itie
s
Psyc
holo
gy
seek
s to
un
ders
tand
be
havi
or
thro
ugh
mee
ting
four
bas
ic g
oals
: de
scri
ptio
n, p
redi
ctio
n, c
ontr
ol,
and
expl
anat
ion.
Des
crip
tion
is
impo
rtant
in
an
y sc
ienc
e.
It he
lps
psyc
holo
gist
s un
ders
tand
ba
sic
patte
rns
of
beha
vior
. D
escr
iptio
n of
beh
avio
r al
low
s th
em t
o de
velo
p th
eorie
s, o
r as
sum
ptio
ns, a
bout
the
beh
avio
r. It
also
hel
ps t
o fil
l in
gap
s of
w
hat w
e kn
ow a
bout
beh
avio
r. Fo
r ex
ampl
e, c
hild
dev
elop
men
t is
an
are
of p
sych
olog
y th
at d
escr
ibes
the
sta
ges
of m
otor
de
velo
pmen
t in
ba
bies
an
d ha
s en
able
d ps
ycho
logi
sts
to
form
ulat
e a
theo
ry o
f no
rmal
mot
or d
evel
opm
ent.
This
hel
ps
peop
le id
entif
y po
ssib
le p
robl
ems
in b
abie
s w
ho d
o no
t dev
elop
in
the
norm
al s
eque
nce.
Psyc
holo
gist
s of
ten
mak
e pr
edic
tions
abo
ut b
ehav
ior:
thes
e ar
e ba
sed
on t
he d
escr
iptio
ns t
hey
have
obt
aine
d. F
or
exam
ple,
psy
chol
ogis
ts h
ave
desc
ribed
man
y si
tuat
ions
whe
re
peop
le e
xhib
it ce
rtain
beh
avio
r in
ord
er t
o ha
ve s
omet
hing
pl
easa
nt
occu
r. Th
ese
plea
sant
oc
curr
ence
s ca
n be
ca
lled
rew
ards
or
rein
forc
emen
ts.
Afte
r ob
serv
ing
that
rei
nfor
cem
ents
en
cour
age
peop
le t
o m
odify
the
ir be
havi
or,
you
mig
ht d
evel
op
a th
eory
pr
edic
ting
that
pe
ople
w
ill
incr
ease
a
parti
cula
r be
havi
or if
rew
arde
d. A
s an
exa
mpl
e, y
ou m
ight
fin
d th
at w
hen
you
smile
, peo
ple
are
nice
to y
ou. Y
ou c
ould
pre
dict
that
if y
ou
smile
d m
ore,
mor
e pe
ople
wou
ld b
e ni
cer.
Onc
e yo
u co
nclu
ded
that
the
freq
uenc
y of
a g
iven
beh
avio
r in
crea
ses
afte
r a
rew
ard,
you
ar
e in
a
posi
tion
to
cont
rol
(mod
ify)
beha
vior
by
gi
ving
or
w
ithho
ldin
g re
war
ds. F
or e
xam
ple,
you
cou
ld c
ontro
l the
fre
quen
cy
with
whi
ch y
ou d
og s
its u
p an
d be
gs b
y of
ferin
g do
g bi
scui
ts a
s a
rew
ard.
Whe
n yo
u st
op g
ivin
g bi
scui
ts,
the
dog
will
pro
babl
y de
crea
se b
eggi
ng b
ehav
ior.
Th
e fo
urth
go
al
of
psyc
holo
gy
is
expl
anat
ion.
By
desc
ribin
g, p
redi
ctin
g, a
nd c
ontro
lling
beh
avio
r, w
e ga
in i
nsig
ht
into
the
for
ces
that
mot
ivat
e pe
ople
. The
n w
e ca
n be
gin
to e
xpla
in
why
peo
ple
enga
ge i
n va
rious
beh
avio
rs. F
or e
xam
ple,
hun
ger
has
been
ex
plai
ned
as
mot
ivat
e be
havi
or
in
man
y st
udie
s.
The
cond
ition
s th
at c
ause
and
alle
viat
e hu
nger
are
des
crib
ed a
s w
ell
as
the
beha
vior
s th
at c
ontro
l it.
You
fee
l hu
ngry
bot
h be
caus
e yo
ur
body
nee
ds f
ood
for
ener
gy a
nd b
ecau
se y
ou h
ave
lear
ned
to e
at a
t ce
rtain
tim
es o
f the
day
.
Ado
pted
from
Pet
tijoh
n (1
989)
Psy
chol
ogy:
A C
onci
se
Intr
oduc
tion
143
Con
cept
Map
ping
Act
ivit
ies
for
the
Seco
nd P
ilot S
tudy
Pl
ease
rea
d th
e pa
ssag
e “T
-Tes
ts”
and
fill i
n th
e co
ncep
ts a
ccor
ding
ly.
144
Con
cept
Map
ping
Act
ivit
ies
for
the
Seco
nd P
ilot S
tudy
Pl
ease
rea
d th
e pa
ssag
e “W
hat i
s ps
ycho
logy
?” a
nd fi
ll in
bot
h th
e co
ncep
ts a
nd li
nk w
ords
acc
ordi
ng to
it.
145
Con
cept
Map
ping
Act
ivit
ies
for
the
Seco
nd P
ilot S
tudy
Pl
ease
rea
d “T
he A
im, R
esea
rch
Met
hods
and
Goa
ls o
f Psy
chol
ogy”
and
com
plet
e th
e fo
llow
ing
conc
ept m
ap a
ccor
ding
to
the
pass
age.
Che
ck li
st fo
r co
ncep
t map
ping
. (1
) A
re to
pics
, mai
n co
ncep
ts a
nd s
ub-c
once
pts
clea
r and
cor
rect
ly e
xpre
ssed
?
(2)
Do
link
wor
ds/p
hras
es c
orre
ctly
and
cle
arly
exp
ress
the
rela
tions
bet
wee
n th
e to
pics
, mai
n co
ncep
ts a
nd s
ub-c
once
pts?
(3
) A
re th
e gr
aphi
cs u
sed
for m
appi
ng s
impl
e an
d co
nsis
tent
? (4
) Is
the
conc
ept m
ap a
n ef
fect
ive
pres
enta
tion
of th
e to
pic?
(5
) C
an y
ou te
ll w
hat t
he m
ain
conc
epts
are
in y
our m
ap w
ithou
t loo
king
at i
t? (A
goo
d co
ncep
t map
sho
uld
help
you
rem
embe
r the
m.)
146
Appendix B.3: Concept Map Workshop Material for the Major Study
147
Con
cept
Map
Wor
ksho
p O
utlin
e fo
r th
e M
ajor
Stu
dy
1.
W
hat
are
co
nce
pt m
aps?
C
once
pt m
aps
are
mos
t com
mon
ly d
efin
ed a
s tw
o-di
men
sion
al d
iagr
ams
that
con
sist
of c
once
pts
or n
odes
link
ed b
y la
bele
d lin
es to
sho
w re
latio
nshi
ps b
etw
een
and
amon
g th
ose
conc
epts
. The
con
cept
s ar
e us
ually
arr
ange
d hi
erar
chic
ally
with
the
mos
t inc
lusi
ve, g
ener
al c
once
pts
appe
ar a
t the
top
of th
e m
ap a
nd th
e le
ss in
clus
ive,
su
bord
inat
e co
ncep
ts b
elow
.
148
Con
cept
Map
Wor
ksho
p O
utlin
e fo
r th
e M
ajor
Stu
dy
2.
W
hy c
once
pt m
aps
wor
k?
g.
Link
ing
new
con
cept
with
wha
t we
knew
:
• “B
ig, s
hini
ng, n
oisy
bird
” = “A
irpla
ne”.
h.
Exp
andi
ng th
e ca
paci
ty o
f our
sho
rt te
rm m
emor
y
• M
ake
abst
ract
idea
s an
d co
ncep
ts in
tang
ible
form
.
i. M
eani
ngfu
l lea
rnin
g ex
perie
nce
• D
isco
verin
g th
e ne
w re
latio
nshi
p am
ong
conc
epts
• M
ake
the
impl
icit
expl
icit
• In
crea
se th
e irr
etrie
vabi
lity
3.
Ho
w c
ou
ld c
on
cep
t map
s h
elp
me
wit
h m
y st
ud
y?
a.
Usi
ng c
once
pt m
aps
to s
umm
ariz
e yo
ur s
tudy
• P
repa
ring
for t
he te
st –
big
and
hol
istic
pic
ture
you
r stu
dy
• Id
entif
y yo
ur w
eak
poin
ts
b.
Usi
ng c
once
pt m
aps
to o
rgan
ize
your
stu
dy
• P
riorit
ize
your
stu
dy e
ffort
• Z
oom
ing
in a
nd z
oom
ing
out
149
Con
cept
Map
Wor
ksho
p O
utlin
e fo
r th
e M
ajor
Stu
dy
b.
U
sing
con
cept
map
s to
enh
ance
you
r com
mun
icat
ion
• P
rese
ntat
ion
--- p
roje
ct o
verv
iew
4.
Ho
w t
o c
reat
e a
con
cep
t m
ap
a.
T
hre
e co
mp
on
ents
: C
once
pts,
pro
posi
tions
, and
str
uctu
re o
f con
cept
map
.
150
Con
cept
Map
Wor
ksho
p O
utlin
e fo
r th
e M
ajor
Stu
dy
c.
P
roce
du
re o
f cre
atin
g c
on
cep
t map
s:
151
Con
cept
Map
Wor
ksho
p O
utlin
e fo
r th
e M
ajor
Stu
dy
(1)
Iden
tify
the
con
cep
ts to
map
• T
opic
s, m
ain
conc
epts
, and
sub
-con
cept
s
(2)
Iden
tify
the
rela
tion
ship
s
• T
opic
s &
mai
n co
ncep
ts a
nd m
ain
conc
epts
& s
ub-c
once
pts
• F
requ
ently
use
d ca
tego
ries
of re
latio
ns
§ se
t/sub
-set
has
exam
ple/
is a
n ex
ampl
e of
§ w
hole
/par
t
has
part
/ is
a pa
rt o
f/inc
lude
s/co
vers
§ ch
arac
teris
tics
has
char
acte
ristic
s/is
a c
hara
cter
istic
of
§ ca
usal
caus
es/is
cau
sed
by
§ sp
atia
l/tem
pora
l oc
curr
ed a
t /lo
catio
n or
tim
e of
§ do
er/a
ctio
n
Act
s as
, fun
ctio
n, c
ontro
l, et
c….
(Ada
pted
from
Lap
p, F
lood
, & H
offm
an (1
998)
Usi
ng c
once
pt m
appi
ng a
s an
effe
ctiv
e st
rate
gy in
con
tent
area
inst
ruct
ion.
In C
onte
nt A
rea
Rea
ding
and
Lea
rnin
g.)
(3)
Sel
ect g
rap
hic
s an
d d
ecid
e th
e st
ruct
ure
Be s
impl
e an
d co
nsis
tent
152
Con
cept
Map
Wor
ksho
p O
utlin
e fo
r th
e M
ajor
Stu
dy
(4)
Ed
itin
g y
ou
r co
nce
pt m
aps
• A
re to
pics
, mai
n co
ncep
ts a
nd s
ub-c
once
pts
clea
r and
cor
rect
ly e
xpre
ssed
?
• D
o lin
k w
ords
/phr
ases
cor
rect
ly a
nd c
lear
ly e
xpre
ss th
e re
latio
ns b
etw
een
the
topi
cs, m
ain
conc
epts
and
sub
-
conc
epts
?
• A
re th
e gr
aphi
cs u
sed
for m
appi
ng s
impl
e an
d co
nsis
tent
?
• Is
the
conc
ept m
ap a
n ef
fect
ive
pres
enta
tion
of th
e to
pic?
• C
an y
ou te
ll w
hat t
he m
ain
conc
epts
are
in y
our m
ap w
ithou
t loo
king
at i
t? (A
goo
d co
ncep
t map
sho
uld
help
you
rem
embe
r the
m.)
Let
’s p
ract
ice
• T
-Tes
ts
• W
hat i
s ps
ycho
logy
?
• T
he A
im, R
esea
rch
Met
hods
, and
Goa
ls o
f psy
chol
ogy
153
Rea
ding
for
Con
cept
Map
ping
Wor
ksho
p A
ctiv
itie
s T-T
ests
The
t-te
st a
sses
ses
whe
ther
the
mea
ns o
f tw
o gr
oups
are
st
atis
tical
ly d
iffer
ent
from
eac
h ot
her.
The
purp
ose
of t
he t-
test
is
to d
eter
min
e w
heth
er th
e di
ffer
ence
in tw
o m
eans
is li
kely
to
be d
ue t
o ch
ance
or
to s
ome
othe
r ca
use,
suc
h as
, a t
reat
men
t. So
it
is
wid
ely
used
to
te
st
the
hypo
thes
is
espe
cial
ly
in
rand
omiz
ed e
xper
imen
tal d
esig
n.
Ther
e ar
e tw
o ki
nds
of t
-test
: in
depe
nden
t t-t
est
and
depe
nden
t t-t
est.
Inde
pend
ent
t-tes
t is
som
etim
es c
alle
d tw
o-sa
mpl
e t-t
est
or s
tude
nt’s
t-te
st.
Dep
ende
nt t-
test
is
som
etim
es
calle
d pa
ired-
sam
ples
t-te
st o
r cor
rela
ted
t-tes
t.
In
depe
nden
t t-t
est
(two-
sam
ple
t-tes
t, st
uden
t’s
t-test
): Th
is is
use
d to
com
pare
the
mea
ns o
f on
e in
depe
nden
t var
iabl
e fo
r tw
o gr
oups
of
case
s. A
s an
exa
mpl
e, in
soc
ial s
tudy
, peo
ple
may
wan
t to
com
pare
mea
n di
ffer
ence
of
inco
me
betw
een
mal
e fa
culty
and
fem
ale
facu
lty i
n a
univ
ersi
ty.
In t
his
case
, th
e in
depe
nden
t va
riabl
e id
entif
ied
is i
ncom
e w
hile
the
tw
o gr
oups
ar
e m
ale
facu
lty a
nd f
emal
e fa
culty
of
a pa
rticu
lar
univ
ersi
ty. I
n sh
ort,
inde
pend
ent
t-tes
t to
co
mpa
re
the
sam
e in
depe
nden
t va
riabl
e of
two
diff
eren
t gro
ups.
Dep
ende
nt
t-tes
t (p
aire
d-sa
mpl
es
t-tes
t, co
rrel
ated
t-
test
): T
his
is u
sed
to c
ompa
re th
e m
eans
of t
wo
depe
nden
t
varia
bles
fo
r a
sing
le
grou
p.
The
proc
edur
e co
mpu
tes
the
diff
eren
ces
betw
een
valu
es o
f th
e tw
o de
pend
ent v
aria
bles
for
eac
h ca
se a
nd te
sts
whe
ther
the
aver
age
diff
ers
from
zer
o. F
or e
xam
ple,
yo
u m
ay b
e in
tere
sted
to
eval
uate
the
eff
ectiv
enes
s of
a r
eadi
ng
prog
ram
. B
efor
e th
e pr
ogra
m s
tarts
, yo
u gi
ve t
rain
ees
a pr
etes
t to
mea
sure
the
ir re
adin
g ab
ility
. A
t th
e en
d of
the
pro
gram
, yo
u gi
veth
em a
pos
t-tes
t to
mea
sure
the
ir re
adin
g ab
ility
aga
in.
Thus
eac
h su
bjec
t ha
s tw
o m
easu
res,
so
met
imes
ca
lled,
be
fore
an
d af
ter
mea
sure
s. B
y co
mpa
ring
the
resu
lts o
f th
e tw
o te
sts,
you
cou
ld f
ind
out
the
effe
ctiv
enes
s of
the
rea
ding
pro
gram
. In
thi
s ca
se, t
he tw
o de
pend
ent
varia
bles
are
the
res
ults
of
pret
est
and
post
-test
. Th
e re
sults
are
of
the
sam
e gr
oup
---
peop
le p
artic
ipat
e in
the
rea
ding
pr
ogra
m.
--
- Ada
pted
from
Yod
er, E
. (20
01).
AE
E 5
21 C
ours
e H
ando
ut. T
he
Col
lege
of A
gric
ultu
ral S
cien
ces,
Pen
nsyl
vani
a St
ate
Uni
vers
ity
Wha
t is
psyc
holo
gy?
Psyc
holo
gy i
s de
fined
as
the
scie
nce
of b
ehav
ior
and
cogn
ition
. B
ehav
ior
is g
ener
ally
def
ined
as
anyt
hing
you
do,
esp
ecia
lly if
it is
ob
serv
able
to
ot
hers
. Ps
ycho
logi
sts
emph
asiz
e th
e st
udy
of
beha
vior
bec
ause
it c
an b
e ob
serv
ed a
nd re
cord
ed. M
any
beha
vior
s,
154
Rea
ding
for
Con
cept
Map
ping
Wor
ksho
p A
ctiv
itie
s su
ch a
s ea
ting,
talk
ing,
writ
ing,
runn
ing,
or f
ight
ing,
are
eas
ily
obse
rvab
le.
Cog
nitio
n in
clud
es
men
tal
proc
esse
s lik
e dr
eam
ing,
th
inki
ng,
rem
embe
ring,
or
solv
ing
prob
lem
s. T
hese
cog
nitiv
e ac
tiviti
es a
re u
sual
ly n
ot o
bser
vabl
e, a
nd o
ften
stud
ied
thro
ugh
self-
repo
rts p
rovi
ded
by r
esea
rch
subj
ects
. C
ogni
tive
beha
vior
is
now
usu
ally
incl
uded
in th
e ge
nera
l con
cept
of b
ehav
ior.
A
noth
er a
rea
of s
cien
tific
stu
dy o
f ps
ycho
logy
is
the
biol
ogic
al,
or
phys
iolo
gica
l pr
oces
ses
that
of
ten
acco
mpa
ny
both
be
havi
or
and
cogn
ition
. B
rain
w
ave
activ
ity
durin
g dr
eam
ing
or
thin
king
, he
art
rate
du
ring
stro
ng
emot
ion
or
fight
ing,
or
bl
ood
chem
istry
ch
ange
s du
ring
eatin
g ar
e ex
ampl
es o
f phy
siol
ogic
al p
roce
sses
.
Whi
le s
ome
psyc
holo
gist
may
foc
us o
n on
e ar
ea, m
any
stud
y ps
ycho
logy
fro
m a
ll th
e th
ree
pers
pect
ives
. Si
nce
the
beha
vior
al,
cogn
itive
, an
d ph
ysio
logi
cal
proc
esse
s ar
e us
ually
in
terc
onne
cted
, man
y ps
ycho
logi
sts
incl
ude
all
thre
e w
hen
they
di
scus
s th
e co
ncep
t of
be
havi
or.
Her
e be
havi
or
incl
udes
ob
serv
able
act
ions
, co
gniti
ve a
ctiv
ities
, an
d th
eir
phys
iolo
gica
l pr
oces
ses.
Ado
pted
from
Pet
tijoh
n (1
989)
Psy
chol
ogy:
A C
onci
se
Intr
oduc
tion
The
aim
, res
earc
h m
etho
ds, a
nd g
oals
of
psyc
holo
gy
Ps
ycho
logy
is
de
fined
as
th
e sc
ienc
e of
be
havi
or
and
cogn
ition
. A
s a
scie
nce,
psy
chol
ogy
shar
es g
oals
and
sci
entif
ic
met
hods
with
oth
er s
cien
ces,
suc
h as
bio
logy
, che
mis
try, s
ocio
logy
, an
d an
thro
polo
gy.
Scie
ntis
ts b
egin
with
a b
ody
of k
now
ledg
e an
d th
en,
proc
eed
syst
emat
ical
ly t
o in
vest
igat
e a
topi
c to
add
to
that
bo
dy o
f kn
owle
dge.
Sci
entis
ts u
se a
var
iety
of
rese
arch
met
hods
, in
clud
ing
obse
rvat
ion,
sur
vey,
tes
t an
d ex
perim
ent.
Thes
e re
sear
ch
met
hods
al
low
sc
ient
ists
to
re
ach
the
goal
s of
de
scrip
tion,
pr
edic
tion,
co
ntro
l an
d ex
plan
atio
n.
The
ultim
ate
aim
fo
r ps
ycho
logi
sts
is to
und
erst
and
beha
vior
and
hel
p pe
ople
.
As
an e
xam
ple
of t
his
aim
, m
any
clin
ical
and
cou
nsel
ing
psyc
holo
gist
s ar
e in
volv
ed i
n he
lpin
g pe
ople
with
per
sona
l an
d em
otio
nal
prob
lem
s. O
ther
s, c
alle
d ex
perim
enta
l ps
ycho
logi
sts,
are
en
gage
d in
res
earc
h to
dis
cove
r th
e ba
sic
prin
cipl
es o
f be
havi
or,
usin
g a
wid
e va
riety
of
subj
ects
: m
onke
ys,
rats
, an
d pe
ople
. St
ill
othe
r ps
ycho
logi
sts
are
busy
app
lyin
g re
sear
ch f
indi
ngs
to p
eopl
e’s
ever
yday
pr
oble
ms.
C
onsu
mer
ps
ycho
logi
sts,
st
udy
purc
hasi
ng
beha
vior
, in
clud
ing
wha
t ty
pe o
f ad
verti
sem
ents
inf
luen
ce p
eopl
e m
ost.
Educ
atio
nal
psyc
holo
gist
s m
ake
teac
hing
and
lea
rnin
g m
ore
effe
ctiv
e.
And
so
cial
ps
ycho
logi
sts
are
invo
lved
in
re
duci
ng
prej
udic
e an
d ag
gres
sion
.
155
Rea
ding
for
Con
cept
Map
ping
Wor
ksho
p A
ctiv
itie
s
Psyc
holo
gy
seek
s to
un
ders
tand
be
havi
or
thro
ugh
mee
ting
four
bas
ic g
oals
: de
scri
ptio
n, p
redi
ctio
n, c
ontr
ol,
and
expl
anat
ion.
Des
crip
tion
is
impo
rtant
in
an
y sc
ienc
e.
It he
lps
psyc
holo
gist
s un
ders
tand
ba
sic
patte
rns
of
beha
vior
. D
escr
iptio
n of
beh
avio
r al
low
s th
em t
o de
velo
p th
eorie
s, o
r as
sum
ptio
ns, a
bout
the
beh
avio
r. It
also
hel
ps t
o fil
l in
gap
s of
w
hat w
e kn
ow a
bout
beh
avio
r. Fo
r ex
ampl
e, c
hild
dev
elop
men
t is
an
are
of p
sych
olog
y th
at d
escr
ibes
the
sta
ges
of m
otor
de
velo
pmen
t in
ba
bies
an
d ha
s en
able
d ps
ycho
logi
sts
to
form
ulat
e a
theo
ry o
f no
rmal
mot
or d
evel
opm
ent.
This
hel
ps
peop
le id
entif
y po
ssib
le p
robl
ems
in b
abie
s w
ho d
o no
t dev
elop
in
the
norm
al s
eque
nce.
Psyc
holo
gist
s of
ten
mak
e pr
edic
tions
abo
ut b
ehav
ior:
thes
e ar
e ba
sed
on t
he d
escr
iptio
ns t
hey
have
obt
aine
d. F
or
exam
ple,
psy
chol
ogis
ts h
ave
desc
ribed
man
y si
tuat
ions
whe
re
peop
le
exhi
bit
certa
in
beha
vior
in
orde
r to
hav
e so
met
hing
pl
easa
nt
occu
r. Th
ese
plea
sant
oc
curr
ence
s ca
n be
ca
lled
rew
ards
or
rein
forc
emen
ts.
Afte
r ob
serv
ing
that
rei
nfor
cem
ents
en
cour
age
peop
le t
o m
odify
the
ir be
havi
or,
you
mig
ht d
evel
op
a th
eory
pr
edic
ting
that
pe
ople
w
ill
incr
ease
a
parti
cula
r be
havi
or if
rew
arde
d. A
s an
exa
mpl
e, y
ou m
ight
fin
d th
at w
hen
you
smile
, peo
ple
are
nice
to y
ou. Y
ou c
ould
pre
dict
that
if y
ou
smile
d m
ore,
mor
e pe
ople
wou
ld b
e ni
cer.
Onc
e yo
u co
nclu
ded
that
the
freq
uenc
y of
a g
iven
beh
avio
r in
crea
ses
afte
r a
rew
ard,
you
ar
e in
a
posi
tion
to
cont
rol
(mod
ify)
beha
vior
by
gi
ving
or
w
ithho
ldin
g re
war
ds. F
or e
xam
ple,
you
cou
ld c
ontro
l the
fre
quen
cy
with
whi
ch y
ou d
og s
its u
p an
d be
gs b
y of
ferin
g do
g bi
scui
ts a
s a
rew
ard.
Whe
n yo
u st
op g
ivin
g bi
scui
ts,
the
dog
will
pro
babl
y de
crea
se b
eggi
ng b
ehav
ior.
Th
e fo
urth
go
al
of
psyc
holo
gy
is
expl
anat
ion.
By
desc
ribin
g, p
redi
ctin
g, a
nd c
ontro
lling
beh
avio
r, w
e ga
in i
nsig
ht
into
the
for
ces
that
mot
ivat
e pe
ople
. The
n w
e ca
n be
gin
to e
xpla
in
why
peo
ple
enga
ge i
n va
rious
beh
avio
rs. F
or e
xam
ple,
hun
ger
has
been
ex
plai
ned
as
mot
ivat
e be
havi
or
in
man
y st
udie
s.
The
cond
ition
s th
at c
ause
and
alle
viat
e hu
nger
are
des
crib
ed a
s w
ell
as
the
beha
vior
s th
at c
ontro
l it.
You
fee
l hu
ngry
bot
h be
caus
e yo
ur
body
nee
ds f
ood
for
ener
gy a
nd b
ecau
se y
ou h
ave
lear
ned
to e
at a
tce
rtain
tim
es o
f the
day
.
Ado
pted
from
Pet
tijoh
n (1
989)
Psy
chol
ogy:
A C
onci
se
Intr
oduc
tion
156
Con
cept
Map
ping
Act
ivit
ies
for
the
Seco
nd P
ilot S
tudy
Pl
ease
rea
d th
e pa
ssag
e “T
-Tes
ts”
and
fill i
n th
e co
ncep
ts a
ccor
ding
ly.
157
Con
cept
Map
ping
Act
ivit
ies
for
the
Seco
nd P
ilot S
tudy
Pl
ease
rea
d th
e pa
ssag
e “W
hat i
s ps
ycho
logy
?” a
nd fi
ll in
bot
h th
e co
ncep
ts a
nd li
nk w
ords
acc
ordi
ng to
it.
158
Con
cept
Map
ping
Act
ivit
ies
for
the
Seco
nd P
ilot S
tudy
P
leas
e re
ad “
The
Aim
, Res
earc
h M
etho
ds a
nd G
oals
of P
sych
olog
y” a
nd c
ompl
ete
the
follo
win
g co
ncep
t map
acc
ordi
ng to
th
e pa
ssag
e.
C
heck
list
for
conc
ept m
appi
ng.
(1)
Are
topi
cs, m
ain
conc
epts
and
sub
-con
cept
s cl
ear a
nd c
orre
ctly
exp
ress
ed?
(2
) D
o lin
k w
ords
/phr
ases
cor
rect
ly a
nd c
lear
ly e
xpre
ss th
e re
latio
ns b
etw
een
the
topi
cs, m
ain
conc
epts
and
sub
-con
cept
s?
(3)
Are
the
grap
hics
use
d fo
r map
ping
sim
ple
and
cons
iste
nt?
(4)
Is th
e co
ncep
t map
an
effe
ctiv
e pr
esen
tatio
n of
the
topi
c?
(5)
Can
you
tell
wha
t the
mai
n co
ncep
ts a
re in
you
r map
with
out l
ooki
ng a
t it?
(A g
ood
conc
ept m
ap s
houl
d he
lp y
ou re
mem
ber t
hem
.)
159
Appendix C: Directions and Treatments
160
Appendix C.1: Directions and Treatment for the First Pilot Study
161
Con
cept
Map
ping
as
a L
earn
ing
Too
l D
irec
tion
of S
tudy
D
ear P
artic
ipan
ts,
Tha
nk y
ou v
ery
muc
h fo
r par
ticip
atin
g in
my
stud
y. H
ere
are
the
proc
edur
es y
ou n
eed
to fo
llow
in th
is s
tudy
. 1)
Lo
gin
the
Bla
ckbo
ard.
com
(http
://w
ww
.bla
ckbo
ard.
com
), a
nd c
lick
“My
Bla
ckbo
ard”
on
the
top
right
cor
ner.
Y
our u
ser I
D is
you
r Pen
n S
tate
Use
r ID
(e.g
. “jw
h163
”)
You
r pas
s w
ord
is “m
ap”.
2)
C
lick
“Stu
dy o
f Con
cept
Map
ping
Str
ateg
ies”
to g
et in
to th
e co
urse
site
. 3)
G
o to
“Co
urs
e In
form
atio
n” t
o re
ad in
stru
ctio
nal m
ater
ials
at y
our o
wn
pace
. 4)
W
hen
you
feel
you
und
erst
and
the
mat
eria
ls w
ell a
nd re
ady
for t
he te
sts,
Go
to th
e “A
ssig
nm
ent”
to ta
ke th
e te
sts.
PL
EA
SE
do
no
t ref
er to
the
inst
ruct
iona
l mat
eria
ls w
hen
you
are
taki
ng th
e te
sts.
You
hav
e on
ly o
ne
chan
ce to
do
the
test
. Onc
e yo
u su
bmit
the
test
, the
test
will
not
be
avai
labl
e fo
r you
any
mor
e.
A
gain
, tha
nk y
ou v
ery
muc
h fo
r you
r par
ticip
atin
g in
my
stud
y!
R
egar
ds
C
harle
s X
iaox
ue W
ang
162
CO
NC
EP
T M
AP
PIN
G T
ASK
(Tre
atm
ent T
wo,
The
Fir
st P
ilot S
tudy
) 2
PL
EA
SE D
O N
OT
RE
AD
IT
UN
TIL
YO
U F
INIS
H Y
OU
R
INST
RU
CT
ION
AL
MA
TE
RIA
LS
T
hank
you
!
Con
cept
Map
ping
task
163
Ple
ase
iden
tify
the
conc
epts
and
fill
in th
e co
ncep
t map
box
es a
ccor
ding
to th
e re
adin
g m
ater
ials
. Now
look
at y
our
wat
ch. Y
ou s
tart
the
conc
ept m
appi
ng a
t _
____
_ . P
leas
e re
mem
ber t
o re
cord
the
time
whe
n yo
u fin
ish
conc
ept
map
ping
. Tha
nk y
ou.
164
165
166
P
leas
e lo
ok
at y
ou
r w
atch
. Yo
u fi
nis
hed
this
co
nce
pt m
ap a
t ___
____
____
_. T
han
k yo
u v
ery
mu
ch!
167
C
ON
CE
PT M
APP
ING
TA
SK
(T
reat
men
t Thr
ee, T
he F
irst
Pilo
t Stu
dy)
3
PL
EA
SE D
O N
OT
RE
AD
IT
UN
TIL
YO
U F
INIS
H Y
OU
R
INST
RU
CT
ION
AL
MA
TE
RIA
LS
Tha
nk y
ou!
Con
cept
Map
ping
task
168
Plea
se c
reat
ing
conc
ept m
aps
acco
rdin
g to
the
read
ing
mat
eria
ls b
y us
ing
the
conc
ept m
ap b
oxes
giv
en. N
ow lo
ok a
t you
r wat
ch. Y
ou s
tart
the
conc
ept m
appi
ng a
t
____
__ .
Plea
se re
mem
ber t
o re
cord
the
time
whe
n yo
u fi
nish
con
cept
map
ping
. Tha
nk y
ou.
Con
cept
map
1
Ple
ase
map
out
the
rela
tions
hip
of th
e pa
rts
of h
eart
acc
ordi
ng to
the
read
ing.
169
Con
cept
map
2
Ple
ase
map
out
the
func
tions
of 4
cha
mbe
rs a
nd 4
val
ves
of h
eart
.
170
Con
cept
map
3
Ple
ase
map
out
the
path
of t
he b
lood
acc
ordi
ng to
the
read
ing.
171
Con
cept
map
4
Ple
ase
map
out
the
circ
ulat
ion
of h
eart
beat
.
P
leas
e lo
ok
at y
ou
r w
atch
. Yo
u fi
nis
hed
this
co
nce
pt m
ap a
t___
____
____
_. T
han
k yo
u v
ery
mu
ch!
172
C
ON
CE
PT M
APP
ING
TA
SK
(T
reat
men
t Fou
r, T
he F
irst
Pilo
t Stu
dy)
4
PL
EA
SE D
O N
OT
RE
AD
IT
UN
TIL
YO
U F
INIS
H Y
OU
R
INST
RU
CT
ION
AL
MA
TE
RIA
LS
Tha
nk y
ou!
C
once
pt M
appi
ng ta
sk
173
Plea
se c
reat
ing
conc
ept m
aps
acco
rdin
g to
the
read
ing
mat
eria
ls. N
ow lo
ok a
t you
r wat
ch. Y
ou s
tart
the
conc
ept m
appi
ng a
t _
____
_ . P
leas
e re
mem
ber t
o re
cord
the
time
whe
n yo
u fi
nish
con
cept
map
ping
. Tha
nk y
ou.
Con
cept
map
1
Ple
ase
map
out
the
rela
tions
hip
of th
e pa
rts
of h
eart
acc
ordi
ng to
the
read
ing.
174
Con
cept
map
2
Ple
ase
map
out
the
func
tions
of 4
cha
mbe
rs a
nd 4
val
ves
of h
eart
.
175
Con
cept
map
3
Ple
ase
map
out
the
path
of t
he b
lood
acc
ordi
ng to
the
read
ing.
176
Con
cept
map
4
Ple
ase
map
out
the
circ
ulat
ion
of h
eart
beat
. P
leas
e lo
ok
at y
ou
r w
atch
. Yo
u fi
nis
hed
this
co
nce
pt m
ap a
t ___
____
____
_. T
han
k yo
u v
ery
mu
ch!
177
Appendix C.2: Directions and Treatment for the Second Pilot Study
178
C
ON
CE
PT
MA
PP
ING
ST
RA
TE
GIE
S S
TU
DY
(Cou
rse
Pro
ject
of
INS
YS
596
, Spr
ing
2002
)
Inst
ruct
ors:
Dr.
Dw
yer
S
tude
nt: C
harle
s X
iaox
ue W
ang
C
ontr
ol G
roup
(Tre
atm
ent 1
)
179
Dir
ecti
on a
nd T
reat
men
t One
for
Con
cept
Map
Lea
rnin
g St
rate
gies
(T
he S
econ
d P
ilot S
tudy
)
Dea
r Par
ticip
ant o
f Gro
up O
ne:
W
elco
me
to m
y st
udy
and
than
k yo
u ve
ry m
uch
for y
our p
artic
ipat
ion!
Her
e is
wha
t you
nee
d to
do
in th
is s
tudy
.
1.
Rem
embe
r tha
t you
are
in G
roup
ON
E!
2.
Logi
n on
line
and
plea
se u
se I
nter
net E
xplo
re to
go
to th
e w
ebsi
te h
ttp://
ww
w.p
erso
nal.p
su.e
du/u
sers
/x/q
/xqw
1/cm
(Net
scap
e
does
not
wor
k pr
oper
ly).
3.
You
hav
e to
do
the
follo
win
g by
all
your
self.
4.
Rea
d th
e in
stru
ctio
nal t
ext.
5.
Take
the
onlin
e m
ultip
le c
hoic
e qu
estio
n te
sts
and
subm
it th
em o
nlin
e.
6.
Leav
e th
e la
b qu
ietly
.
If y
ou h
ave
any
ques
tions
, ple
ase
rais
e up
you
r han
d an
d ou
r res
earc
h as
sist
ant w
ill c
ome
to y
ou. T
hank
you
ver
y m
uch.
Sinc
erel
y Y
ours
Cha
rles
Xia
oxue
Wan
g
180
C
ON
CE
PT
MA
PP
ING
ST
RA
TE
GIE
S S
TU
DY
(Cou
rse
Pro
ject
of
INS
YS
596
, Spr
ing
2002
)
Inst
ruct
ors:
Dr.
Dw
yer
S
tude
nt: C
harle
s X
iaox
ue W
ang
C
once
pt M
atch
ing
Map
ping
Str
ateg
y (T
reat
men
t 2)
181
Dir
ecti
on a
nd T
reat
men
t Tw
o fo
r C
once
pt M
ap L
earn
ing
Stra
tegi
es
(The
Sec
ond
Pilo
t Stu
dy)
Dea
r Par
ticip
ant o
f Gro
up T
wo:
Wel
com
e to
my
stud
y an
d th
ank
you
very
muc
h fo
r you
r par
ticip
atio
n! H
ere
is w
hat y
ou n
eed
to d
o in
this
stu
dy.
1.
Rem
embe
r tha
t you
are
in G
roup
Tw
o!
2.
Logi
n on
line
and
plea
se u
se I
nter
net E
xplo
re to
go
to th
e w
ebsi
te h
ttp://
ww
w.p
erso
nal.p
su.e
du/u
sers
/x/q
/xqw
1/cm
(N
etsc
ape
does
not
wor
k pr
oper
ly).
3.
You
hav
e to
do
the
follo
win
g by
all
your
self.
4.
Rea
d th
e in
stru
ctio
nal t
ext.
5.
Com
plet
e co
ncep
t map
ping
act
iviti
es a
ccor
ding
to th
e te
xt.
6.
Take
the
onlin
e m
ultip
le c
hoic
e qu
estio
n te
sts
and
subm
it th
em o
nlin
e.
7.
Leav
e th
e la
b qu
ietly
.
If y
ou h
ave
any
ques
tions
, ple
ase
rais
e up
you
r han
d an
d ou
r res
earc
h as
sist
ant w
ill c
ome
to y
ou. T
hank
you
ver
y m
uch.
Sinc
erel
y Y
ours
Cha
rles
Xia
oxue
Wan
g
182
Par
tici
pant
’ N
ame
(in
Pri
nt):
____
____
____
____
____
____
___
D
irec
tion:
Ple
ase
com
plet
e th
e co
ncep
t map
by
fillin
g in
the
conc
epts
acc
ordi
ng to
read
ing
Par
t 1.
Con
cept
Map
of P
arts
of H
eart
from
Out
side
to I
nsid
e
183
Dir
ectio
n: P
leas
e co
mpl
ete
the
conc
ept m
ap b
y fil
ling
in th
e co
ncep
ts a
ccor
ding
to re
adin
g P
art 2
& 3
.
Co
nce
pt M
ap o
f Hea
rt S
tru
ctu
re
184
Dir
ectio
n: P
leas
e co
mpl
ete
the
conc
ept m
ap b
y fi
lling
in th
e co
ncep
ts a
ccor
ding
to re
adin
g P
art
2, 3
&4.
Co
nce
pt
Map
of
Hea
rt V
alve
s an
d T
hei
r L
oca
tio
n
185
Dir
ectio
n: P
leas
e co
mpl
ete
the
conc
ept m
ap b
y fi
lling
in th
e co
ncep
ts a
ccor
ding
to re
adin
g P
art
2, 3
& 4
.
Co
nce
pt
Map
of
Blo
od
Pat
h in
th
e H
eart
186
Dir
ectio
n: P
leas
e co
mpl
ete
the
conc
ept m
ap b
y fi
lling
in th
e co
ncep
ts a
ccor
ding
to re
adin
g P
art 5
.
Co
nce
pt
Map
of
Tw
o P
has
es o
f th
e H
eart
Bea
ts
187
C
ON
CE
PT
MA
PP
ING
ST
RA
TE
GIE
S S
TU
DY
(Cou
rse
Pro
ject
of I
NS
YS
596
, Spr
ing
2002
)
Inst
ruct
ors:
Dr.
Dw
yer
S
tude
nt: C
harle
s X
iaox
ue W
ang
C
once
pt &
Pro
posi
tion
Iden
tifyi
ng M
appi
ng S
trat
egy
(Tre
atm
ent 3
)
188
Dir
ecti
on a
nd T
reat
men
t One
for
Con
cept
Map
Lea
rnin
g St
rate
gies
(T
he S
econ
d P
ilot S
tudy
)
Dea
r Par
ticip
ant o
f Gro
up T
hree
:
Wel
com
e to
my
stud
y an
d th
ank
you
very
muc
h fo
r you
r par
ticip
atio
n! H
ere
is w
hat y
ou n
eed
to d
o in
this
stu
dy.
1.
Rem
embe
r tha
t you
are
in G
roup
Thr
ee!
2.
Logi
n on
line
and
plea
se u
se I
nter
net E
xplo
re to
go
to th
e w
ebsi
te h
ttp://
ww
w.p
erso
nal.p
su.e
du/u
sers
/x/q
/xqw
1/cm
(N
etsc
ape
does
not
wor
k pr
oper
ly).
3.
You
hav
e to
do
the
follo
win
g by
all
your
self.
4.
Rea
d th
e in
stru
ctio
nal t
ext.
5.
Com
plet
e co
ncep
t map
ping
act
iviti
es a
ccor
ding
to th
e te
xt.
6.
Take
the
onlin
e m
ultip
le c
hoic
e qu
estio
n te
sts
and
subm
it th
em o
nlin
e.
7.
Leav
e th
e la
b qu
ietly
.
If y
ou h
ave
any
ques
tions
, ple
ase
rais
e up
you
r han
d an
d ou
r res
earc
h as
sist
ant w
ill c
ome
to y
ou. T
hank
you
ver
y m
uch.
Sinc
erel
y Y
ours
Cha
rles
Xia
oxue
Wan
g
189
Par
tici
pant
’ N
ame
(in
Pri
nt):
____
____
____
____
____
____
____
__
Dir
ectio
n: P
leas
e co
mpl
ete
the
conc
ept m
ap b
y fi
lling
in b
oth
the
conc
epts
and
the
link
wor
ds a
ccor
ding
to re
adin
g P
art 1
. C
on
cep
t Map
of P
arts
of H
eart
fro
m O
uts
ide
to In
sid
e
190
Dir
ectio
n: P
leas
e co
mpl
ete
the
conc
ept m
ap b
y fi
lling
in c
once
pts
and
link
wor
ds a
ccor
ding
to re
adin
g P
art 2
& 3
.
Co
nce
pt M
ap o
f Hea
rt S
tru
ctu
re
191
Dir
ectio
n: P
leas
e co
mpl
ete
the
conc
ept m
ap b
y fi
lling
in c
once
pts
and
link
wor
ds a
ccor
ding
to re
adin
g P
art
2, 3
&4.
Co
nce
pt
Map
of
Hea
rt V
alve
s an
d T
hei
r L
oca
tio
n
192
Dir
ectio
n: P
leas
e co
mpl
ete
the
conc
ept m
ap b
y fi
lling
in c
once
pts
and
link
wor
ds a
ccor
ding
to re
adin
g P
art 2
, 3, &
4.
C
on
cep
t M
ap o
f B
loo
d P
ath
in t
he
Hea
rt
193
Dir
ectio
n: P
leas
e co
mpl
ete
the
conc
ept m
ap b
y fil
ling
in th
e co
ncep
ts a
ccor
ding
to re
adin
g P
art 5
.
Co
nce
pt
Map
of
Tw
o P
has
es o
f th
e H
eart
Bea
ts
194
C
ON
CE
PT
MA
PP
ING
ST
RA
TE
GIE
S S
TU
DY
(Cou
rse
Pro
ject
of
INS
YS
596
, Spr
ing
2002
)
Inst
ruct
ors:
Dr.
Dw
yer
S
tude
nt: C
harle
s X
iaox
ue W
ang
St
uden
t-ge
nera
ted
Map
ping
(Tre
atm
ent 4
)
195
Dir
ecti
on a
nd T
reat
men
t One
for
Con
cept
Map
Lea
rnin
g St
rate
gies
(T
he S
econ
d P
ilot S
tudy
)
Dea
r Par
ticip
ant o
f Gro
up F
our:
Wel
com
e to
my
stud
y an
d th
ank
you
very
muc
h fo
r you
r par
ticip
atio
n! H
ere
is w
hat y
ou n
eed
to d
o in
this
stu
dy.
1.
Rem
embe
r tha
t you
are
in G
roup
Fou
r!
2.
Logi
n on
line
and
plea
se u
se I
nter
net E
xplo
re to
go
to th
e w
ebsi
te h
ttp://
ww
w.p
erso
nal.p
su.e
du/u
sers
/x/q
/xqw
1/cm
(N
etsc
ape
does
not
wor
k pr
oper
ly).
3.
You
hav
e to
do
the
follo
win
g by
all
your
self.
4.
Rea
d th
e in
stru
ctio
nal t
ext.
5.
Com
plet
e co
ncep
t map
ping
act
iviti
es a
ccor
ding
to th
e te
xt.
6.
Take
the
onlin
e m
ultip
le c
hoic
e qu
estio
n te
sts
and
subm
it th
em o
nlin
e.
7.
Leav
e th
e la
b qu
ietly
.
If y
ou h
ave
any
ques
tions
, ple
ase
rais
e up
you
r han
d an
d ou
r res
earc
h as
sist
ant w
ill c
ome
to y
ou. T
hank
you
ver
y m
uch.
Sinc
erel
y Y
ours
Cha
rles
Xia
oxue
Wan
g
196
Part
icip
ant’
Nam
e (in
Pri
nt):
___
____
____
____
____
____
____
____
____
_
D
irec
tion:
Ple
ase
crea
te a
con
cept
map
abo
ut p
arts
of h
eart
from
out
side
to in
side
acc
ordi
ng to
read
ing
Par
t 1.
C
on
cep
t Map
of P
arts
of H
eart
fro
m O
uts
ide
to In
sid
e
197
Dir
ectio
n: P
leas
e cr
eate
a c
once
pt m
ap a
bout
hea
rt st
ruct
ure
acco
rdin
g to
read
ing
Par
t 2 &
3.
C
on
cep
t Map
of H
eart
Str
uct
ure
198
Dir
ectio
n: P
leas
e cr
eate
a c
once
pt m
ap o
f hea
rt va
lves
and
thei
r loc
atio
ns a
ccor
ding
to re
adin
g P
art
2, 3
, & 4
.
Co
nce
pt
Map
of
Hea
rt V
alve
s an
d T
hei
r L
oca
tio
n
199
Dir
ectio
n: P
leas
e cr
eate
a c
once
pt m
ap o
f blo
od p
ath
in th
e he
art a
ccor
ding
to re
adin
g P
art
2, 3
& 4
.
Co
nce
pt
Map
of
Blo
od
Pat
h in
th
e H
eart
200
Dir
ectio
n: P
leas
e cr
eate
a c
once
pt m
ap o
f tw
o ph
ases
of h
eart
beat
s ac
cord
ing
to re
adin
g P
art 5
.
Con
cept
Map
of T
wo
Pha
ses
of th
e H
eart
Bea
ts
201
Appendix C.3: Directions and Treatments for the Major Study
202
203
Dea
r P
arti
cipa
nt o
f Gro
up O
ne:
Wel
com
e to
my
stud
y an
d th
ank
you
very
muc
h fo
r you
r par
ticip
atio
n! H
ere
is w
hat y
ou n
eed
to d
o by
you
rsel
f in
this
st
udy.
1.
L
ogin
onl
ine
and
plea
se u
se In
tern
et E
xplo
re to
go
to th
e w
ebsi
te h
ttp://
ww
w.p
erso
nal.p
su.e
du/u
sers
/x/q
/xqw
1/cm
(Net
scap
e do
es n
ot w
ork
prop
erly
).
2.
Wri
te y
our n
ame
in P
RIN
T a
nd y
our s
tart
ing
time
acco
rdin
g to
the
time
on y
our
com
pute
r on
this
cov
er p
age
3.
Rea
d in
stru
ctio
ns a
nd b
egin
you
r stu
dy. R
emem
ber t
hat y
ou a
re in
Gro
up O
NE
! T
here
is n
o co
ncep
t map
ping
activ
ities
for y
ou. I
f you
are
inte
rest
ed in
wha
t oth
ers
are
doin
g, I
can
send
it to
you
aft
er th
is s
tudy
. For
the
purp
ose
of
this
stu
dy, p
leas
e fo
llow
the
inst
ruct
ion
exac
tly.
4.
Rea
d th
e te
xt a
nd ta
ke th
e m
ultip
le c
hoic
e qu
estio
n te
sts
and
subm
it th
em o
nlin
e.
5.
Han
d in
this
inst
ruct
iona
l she
et to
our
rese
arch
ass
ista
nt a
nd g
et a
cop
y of
the
info
rmed
con
sent
form
for t
his
stud
y at
exit
whi
le le
avin
g th
e la
b qu
ietl
y.
If y
ou h
ave
any
ques
tions
, ple
ase
rais
e up
you
r han
d an
d ou
r res
earc
h as
sist
ant w
ill c
ome
to y
ou. T
hank
you
ver
y m
uch.
Sinc
erel
y Y
ours
C
harl
es X
iaox
ue W
ang
204
205
Dea
r P
arti
cipa
nt o
f Gro
up T
wo:
Wel
com
e to
my
stud
y an
d th
ank
you
very
muc
h fo
r you
r par
ticip
atio
n! H
ere
is w
hat y
ou n
eed
to d
o by
you
rsel
f in
this
stu
dy.
1.
L
ogin
onl
ine
and
plea
se u
se In
tern
et E
xplo
re to
go
to th
e w
ebsi
te h
ttp://
ww
w.p
erso
nal.p
su.e
du/u
sers
/x/q
/xqw
1/cm
(Net
scap
e do
es n
ot w
ork
prop
erly
).
2.
Wri
te y
our n
ame
in P
RIN
T a
nd y
our s
tart
ing
time
acco
rdin
g to
the
time
on y
our
com
pute
r on
this
cov
er p
age
3.
Rea
d in
stru
ctio
ns a
nd b
egin
you
r stu
dy. R
emem
ber t
hat y
ou a
re in
Gro
up T
WO
!
4.
Rea
d th
e te
xt a
nd d
o co
ncep
t map
ping
act
iviti
es a
ccor
ding
to th
e in
stru
ctio
ns.
5.
Han
d in
this
act
ivity
she
ets
to o
ur re
sear
ch a
ssis
tant
whe
n yo
u co
mpl
ete
map
ping
act
iviti
es a
nd a
re re
ady
to ta
ke th
e
test
s.
6.
Tak
e th
e m
ultip
le c
hoic
e qu
estio
n te
sts
and
subm
it th
em o
nlin
e.
7.
Lea
ve th
e la
b qu
ietl
y an
d ge
t a c
opy
of th
e in
form
ed c
onse
nt fo
rm fo
r thi
s st
udy
from
rese
arch
ass
ista
nts
at e
xit.
8.
If y
ou h
ave
any
ques
tions
, ple
ase
rais
e up
you
r han
d an
d ou
r res
earc
h as
sist
ant w
ill c
ome
to y
ou. T
hank
you
ver
y
muc
h.
Sinc
erel
y Y
ours
C
harl
es X
iaox
ue W
ang
206
1.
Plea
se fi
ll in
the
boxe
s in
the
conc
ept m
ap a
ccor
ding
to th
e re
adin
g of
Par
t 1 fo
cusi
ng o
n pa
rts
of th
e he
art.
207
2.
Plea
se fi
ll in
the
boxe
s in
the
conc
ept m
ap a
ccor
ding
to th
e re
adin
g of
Par
t 2 fo
cusi
ng o
n ch
ambe
rs o
f the
hea
rt.
208
3.
Plea
se fi
ll in
the
boxe
s in
the
conc
ept m
ap a
ccor
ding
to th
e re
adin
g of
Par
t 2, 3
, & 4
focu
sing
on
valv
es, t
heir
loca
tions
re
latio
nshi
p be
twee
n th
em.
209
4.
Plea
se fi
ll in
the
boxe
s in
the
conc
ept m
ap a
ccor
ding
the
read
ing
Part
2, 3
, & 4
focu
sing
on
bloo
d ve
ins
and
arte
ries
whe
n bl
ood
goes
thro
ugh
twic
e in
the
hum
an h
eart
.
210
5.
Plea
se fi
ll in
the
boxe
s in
the
conc
ept m
ap a
ccor
ding
the
read
ing
of P
art 5
focu
sing
on
the
rela
tions
hip
betw
een
the
cham
bers
and
val
ves
in th
e tw
o ph
ases
of t
he h
eat b
eat.
Pl
ease
che
ck to
see
if a
ll th
e co
ncep
t map
s co
rrec
tly re
flect
s yo
ur u
nder
stan
ding
of t
he te
xts.
211
212
Dea
r P
arti
cipa
nt o
f Gro
up T
hree
:
Wel
com
e to
my
stud
y an
d th
ank
you
very
muc
h fo
r you
r par
ticip
atio
n! H
ere
is w
hat y
ou n
eed
to d
o by
you
rsel
f in
this
st
udy.
1.
L
ogin
onl
ine
and
plea
se u
se In
tern
et E
xplo
re to
go
to th
e w
ebsi
te h
ttp://
ww
w.p
erso
nal.p
su.e
du/u
sers
/x/q
/xqw
1/cm
(Net
scap
e do
es n
ot w
ork
prop
erly
).
2.
Wri
te y
our n
ame
in P
RIN
T a
nd y
our s
tart
ing
time
acco
rdin
g to
the
time
on y
our
com
pute
r on
this
cov
er p
age
3.
Rea
d in
stru
ctio
ns a
nd b
egin
you
r stu
dy. R
emem
ber t
hat y
ou a
re in
Gro
up T
hree
!
4.
Rea
d th
e te
xt a
nd d
o co
ncep
t map
ping
act
iviti
es a
ccor
ding
to th
e in
stru
ctio
ns.
5.
Han
d in
this
act
ivity
she
ets
to o
ur re
sear
ch a
ssis
tant
whe
n yo
u co
mpl
ete
map
ping
act
iviti
es a
nd a
re re
ady
to ta
ke th
e
test
s.
6.
Tak
e th
e m
ultip
le c
hoic
e qu
estio
n te
sts
and
subm
it th
em o
nlin
e.
7.
Lea
ve th
e la
b qu
ietl
y an
d ge
t a c
opy
of th
e in
form
ed c
onse
nt fo
rm fo
r thi
s st
udy
from
rese
arch
ass
ista
nts
at e
xit.
If y
ou h
ave
any
ques
tions
, ple
ase
rais
e up
you
r han
d an
d ou
r res
earc
h as
sist
ant w
ill c
ome
to y
ou. T
hank
you
ver
y m
uch.
Sinc
erel
y Y
ours
C
harl
es X
iaox
ue W
ang
213
1.
Plea
se fi
ll in
link
wor
ds o
r ph
rase
s fo
r pr
opos
ition
s be
twee
n co
ncep
ts a
ccor
ding
to th
e re
adin
g of
Par
t 1 fo
cusi
ng o
n pa
rts
of th
e he
art.
The
re a
re fo
ur o
f the
m in
this
con
cept
map
.
214
2.
Plea
se fi
ll in
link
wor
ds o
r ph
rase
s fo
r pr
opos
ition
s be
twee
n co
ncep
ts a
ccor
ding
to th
e re
adin
g of
Par
t 2 fo
cusi
ng o
n ch
ambe
rs o
f the
hea
rt.
The
re a
re e
ight
of t
hem
in th
is c
once
pt m
ap.
215
3.
Plea
se fi
ll in
link
wor
ds o
r ph
rase
s fo
r pr
opos
ition
s be
twee
n co
ncep
ts a
ccor
ding
to th
e re
adin
g of
Par
t 2, 3
, & 4
focu
sing
on
val
ves,
thei
r lo
catio
ns a
nd r
elat
ions
hips
bet
wee
n th
em. T
here
are
eig
ht o
f the
m in
this
con
cept
map
.
216
4.
Plea
se fi
ll in
link
wor
ds o
r ph
rase
s fo
r pr
opos
ition
s be
twee
n co
ncep
ts a
ccor
ding
the
read
ing
Part
2, 3
, & 4
focu
sing
on
bloo
d ve
ins
and
arte
ries
whe
n bl
ood
goes
thro
ugh
twic
e in
the
hum
an h
eart
. The
re a
re fi
ve o
f the
m in
this
con
cept
map
.
217
5.
Plea
se fi
ll in
link
wor
ds o
r ph
rase
s fo
r pr
opos
ition
s be
twee
n co
ncep
ts a
ccor
ding
the
read
ing
of P
art 5
focu
sing
on
the
rela
tions
hip
betw
een
the
cham
bers
and
val
ves
in th
e tw
o ph
ases
of t
he h
eat b
eat.
The
re a
re e
ight
of t
hem
in th
is c
once
pt m
ap.
Pl
ease
che
ck to
see
if a
ll th
e co
ncep
t map
s co
rrec
tly re
flect
s yo
ur u
nder
stan
ding
of t
he te
xts.
218
219
Dea
r P
arti
cipa
nt o
f Gro
up F
our:
Wel
com
e to
my
stud
y an
d th
ank
you
very
muc
h fo
r you
r par
ticip
atio
n! H
ere
is w
hat y
ou n
eed
to d
o by
you
rsel
f in
this
stud
y.
7.
Log
in o
nlin
e an
d pl
ease
use
Inte
rnet
Exp
lore
to g
o to
the
web
site
http
://w
ww
.per
sona
l.psu
.edu
/use
rs/x
/q/x
qw1/
cm
(Net
scap
e do
es n
ot w
ork
prop
erly
).
8.
Wri
te y
our n
ame
in P
RIN
T a
nd y
our s
tart
ing
time
acco
rdin
g to
the
time
on y
our
com
pute
r on
this
cov
er p
age
9.
Rea
d in
stru
ctio
ns a
nd b
egin
you
r stu
dy. R
emem
ber t
hat y
ou a
re in
Gro
up F
our!
10.
Rea
d th
e on
line
text
and
do
conc
ept m
appi
ng a
ctiv
ities
acc
ordi
ng to
the
inst
ruct
ions
.
11.
Han
d in
this
act
ivity
she
ets
to o
ur re
sear
ch a
ssis
tant
whe
n yo
u co
mpl
ete
map
ping
act
iviti
es a
nd a
re re
ady
to ta
ke th
e
test
s.
12.
Tak
e th
e m
ultip
le c
hoic
e qu
estio
n te
sts
and
subm
it th
em o
nlin
e.
13.
Lea
ve th
e la
b qu
ietl
y an
d ge
t a c
opy
of th
e in
form
ed c
onse
nt fo
rm fo
r thi
s st
udy
from
rese
arch
ass
ista
nts
at e
xit.
If y
ou h
ave
any
ques
tions
, ple
ase
rais
e up
you
r han
d an
d ou
r res
earc
h as
sist
ant w
ill c
ome
to y
ou. T
hank
you
ver
y m
uch.
Sinc
erel
y Y
ours
Cha
rles
Xia
oxue
Wan
g
220
1.
Cre
ate
a co
ncep
t map
acc
ordi
ng to
the
read
ing
of P
art 1
focu
sing
ON
LY
on
the
impo
rtan
t par
ts o
f the
hum
an
hear
t.
221
2.
Cre
ate
a co
ncep
t map
abo
ut c
ham
bers
of t
he h
eart
acc
ordi
ng to
the
read
ing
of P
art 2
& 3
.
222
3.
Cre
ate
a co
ncep
t map
abo
ut v
alve
s of
the
hum
an h
eart
acc
ordi
ng to
the
read
ing
of P
art 2
, 3, a
nd 4
focu
sing
on
ly o
n th
eir
loca
tions
and
rel
atio
nshi
p be
twee
n th
em.
223
4.
Cre
ate
a co
ncep
t map
abo
ut b
lood
pat
h a
ccor
ding
to th
e re
adin
g of
Par
t 2, 3
, & 4
focu
sing
on
bloo
d ve
ins
and
arte
ries
whe
n bl
ood
goes
thro
ugh
twic
e in
the
hum
an h
eart
.
224
5.
Cre
ate
a co
ncep
t map
abo
ut t
wo
phas
es o
f the
hea
rt b
eat a
ccor
ding
the
read
ing
Part
5 fo
cusi
ng o
n th
e re
latio
nshi
p be
twee
n th
e ch
ambe
rs a
nd v
alve
s.
Pl
ease
che
ck to
see
if a
ll th
e co
ncep
t map
s co
rrec
tly re
flect
s yo
ur u
nder
stan
ding
of t
he te
xts.
225
VITA Xiaoxue Wang
EDUCATION
Doctor of Philosophy in Instructional Systems The Pennsylvania State University, U.S.A. 8/2003 Master of Education in Teaching English to the Speakers of Other Languages University of Manchester, Manchester, U.K. 5/ 1992
Bachelor of Arts, Teaching of English Language and Literature Southwestern China Normal University, Chongqing, P. R. China. 7/ 1982
PROFESSIONAL EXPERIENCE
Associate Professor and Professor in Charge Intensive Language Training Center (ILTC) Sichuan University, Chengdu, Sichuan, P. R. China. 12/1994 – 12/1998
Lecturer & Program Coordinator ILTC, Sichuan University, Chengdu, Sichuan, P. R. China. 8/1988 – 11/1994
Assistant Professor ILTC, Sichuan University, Chengdu, Sichuan, P. R. China. 6/1988 – 8/1988
Middle & High School English Teacher Ba Yi Middle and High School, Anxian County, Sichuan, P. R. China. 8/1982 – 6/1987
HONORS AND AWARDS
Alumni Society Graduate Student Research Initiation Grant College of Education, Pennsylvania State University. 2002 – 2003
Teacher of the Year Sichuan University, Chengdu, Sichuan, P. R. China 1995
Teacher of the Year ILTC, Sichuan University, Chengdu, Sichuan, P. R. China 1997 – 1998
1995 – 1996 Research Funds for Excellent Returned Scholars Ministry of Education, Beijing, P. R. China 1993