Page 1
THE INTEGRATION OF QUANTITATIVE INFORMATION WITH AN INTELLIGENT DECISION SUPPORT SYSTEM
FOR RESIDENTIAL ENERGY RETROFITS
By
Yunjeong Mo
A THESIS
Submitted to Michigan State University
in partial fulfillment of the requirements for the degree of
MASTER OF SCIENCE
Construction Management
2012
Page 2
ABSTRACT
THE INTEGRATION OF QUANTITATIVE INFORMATION WITH AN INTELLIGENT DECISION SUPPORT SYSTEM
FOR RESIDENTIAL ENERGY RETROFITS
By
Yunjeong Mo
The purpose of this research is to support the development of an intelligent Decision Support
System (DSS) by integrating quantitative information with expert knowledge in order to
facilitate effective retrofit decision-making. To achieve this goal, the Energy Retrofit Decision
Process Framework is analyzed. Expert system shell software, a retrofit measure cost database,
and energy simulation software are needed for developing the DSS; Exsys Corvid, the NREM
database and BEopt were chosen for implementing an integration model. This integration model
demonstrates the holistic function of a residential energy retrofit system for existing homes, by
providing a prioritized list of retrofit measures with cost information, energy simulation and
expert advice. The users, such as homeowners and energy auditors, can acquire all of the
necessary retrofit information from this unified system without having to explore several
separate systems. The integration model plays the role of a prototype for the finalized intelligent
decision support system. It implements all of the necessary functions for the finalized DSS,
including integration of the database, energy simulation and expert knowledge.
Page 3
Copyright by
YUNJEONG MO
2012
Page 4
iv
Dedicated to my Parents…
Page 5
v
ACKNOWLEDGEMENTS
God was always with me through this long journey, in the form of hope and perseverance, as
well as in the form of great mentors. In writing this thesis, I learned that this was not solely my
independent work, but the result of a collective effort. I would like to express my gratitude to all
those who have contributed to this thesis and prepared me for future research. First, I would like
to thank my academic advisor and mentor, Professor Matt Syal. This work would not have been
possible without his trust and support. He oriented me in the correct direction and worked closely
with me throughout the research and writing of this thesis. I would also like to thank my other
advisory committee members, Professors Suk-Kyung Kim and Michael Mazor, for their
stimulating suggestions and comments, which improved my study. I want to thank my colleagues,
Daniel Duah and Stanley Samuel, for their academic and emotional support. Finally, I would like
to give special thanks to my family and friends back home in Korea, whose trust and support
enabled me to complete this work.
Page 6
vi
TABLE OF CONTENTS LIST OF FIGURES………………………………………………………………………... vii CHAPTER 1 INTRODUCTION 1.1 Introduction………………………………………………………………………….…. 1
1.1.1 Cost Effective Energy Retrofit Team Project………………………………….. 3 1.1.2 Information Types for the Decision Support System Framework……………... 5
1.2 Need Statement……………………………………………………………………….... 6 1.2.1 Need for Energy Retrofitting for Existing Homes……………………………... 6 1.2.2 Need for Quality Information and Efficient Information Delivery……………. 7 1.2.3 Need for Expert Knowledge…………………………………………………… 8 1.2.4 Need for Effective Use of Quantitative Information in DSS……………….….. 10 1.2.5 Need for an Integrated Intelligent Decision Support Systems…………………. 12
1.3 Goals and Objectives………………………………………………………..…………. 13 1.4 Methodology……………………………………………………………………..…….. 15 1.5 Research Scope and Limitations…………………………………………...…………... 24
1.5.1 Research Scope………………………………………………………………… 24 1.5.2 Research Limitations………………………………………………………….. 24
1.6 Deliverables and Research Contributions…………………………………………….... 25 1.6.1 Deliverables……………………………………………………………………. 25 1.6.2 Research Contributions………………………………………………………… 25
1.7 Chapter Summary……………………………………………………………………… 26
CHAPTER 2 LITERATURE REVIEW AND BACKGROUND INFORMATION 2.1 Overview……………………………………………………………………………….. 28 2.2 Background of Energy Retrofit Decision-Making……………………………………... 28
2.2.1 Needs for Energy Savings in Existing Buildings………………………………. 29 2.2.2 Barriers to Residential Energy Retrofit………………………………………... 30 2.2.3 Retrofit Options………………………………………………………………... 33 2.2.4 Governmental Policies…………………………………………………………. 35 2.2.5 Energy Retrofit Programs……………………………………………………… 36
2.3 Introduction of Artificial Intelligence (AI), Expert Systems (ES), and Decision Support Systems (DSS)..………..……………………………………… 38 2.3.1 Definitions of AI, ES, and DSS………………………………………………... 38 2.3.2 Comparison of Expert Systems and Decision Support Systems……………….. 39 2.3.3 Components of an Expert System……………………………………………… 40 2.3.4 Components of a Decision Support System…………………………………….42 2.3.5 Integration of Expert Systems and Decision Support Systems………………… 43 2.3.6 Use of a Database in Expert Systems………………………………………….. 44 2.3.7 Use of Simulation in Expert Systems………………………………………….. 45
Page 7
vii
2.4 Expert Systems and Decision Support Systems in Construction and Energy Retrofit…………………………………………………… 46 2.4.1 ES and DSS in Construction Management…………………………………….. 46 2.4.2 Decision Support Systems in Energy Retrofit…………………………………. 50 2.4.3 Expert Systems in Energy Retrofit…………………………………………….. 51 2.4.4 Integrated Expert System for Buildings………………………………………... 52 2.4.5 Assessment and Improvement of Energy Analysis……………………………. 55
2.5 Chapter Summary…………………………………………………………………..….. 56
CHAPTER 3 FRAMEWORK FOR IMPLEMENTING INTEGRATION 3.1 Overview……………………………………………………………………………….. 57 3.2 The Energy Retrofit Decision Process Framework…………………...……………….. 57
3.2.1 Identifying Retrofit Measures………………………………………………….. 58 3.2.2 Shortlisting and Prioritizing Measures…………………………………………. 59 3.2.3 Providing Expert Advice on Installation……………………………………….. 60 3.2.4 Integrating the Quantitative Data Sources……………………………………... 60 3.2.5 Using Expert Knowledge………………………………………………………. 61 3.2.6 Modified Framework for the Integration of Quantitative Data Sources……….. 62
3.3 Analysis of the Framework with a Working Example…………………………………. 63 3.3.1 Overview of the Framework Working Example……………………………….. 63 3.3.2 BEopt Energy Simulation for the Selected Measures………………………….. 64 3.3.3 Cost Information Sources……………………………………………………… 67 3.3.4 Basic Cost Formula for the Prioritization of Measures………………………... 68
3.4 Exsys Corvid: Expert System Shell Software …………………………………………. 71 3.4.1 Decision-Making Logic………………………………………………………... 71 3.4.2 Variables……………………………………………………………………….. 72 3.4.3 Logic Block…………………………………………………………………….. 78 3.4.4 Command Block……………………………………………………………….. 79
3.5 CHAPTER SUMMARY………………………………………………………………. 80
CHAPTER 4 ANALYSIS OF NREM DATABASE AND BEOPT 4.1 Overview……………………………………………………………………………….. 82 4.2 National Residential Efficiency Measures (NREM) Database………………………… 83
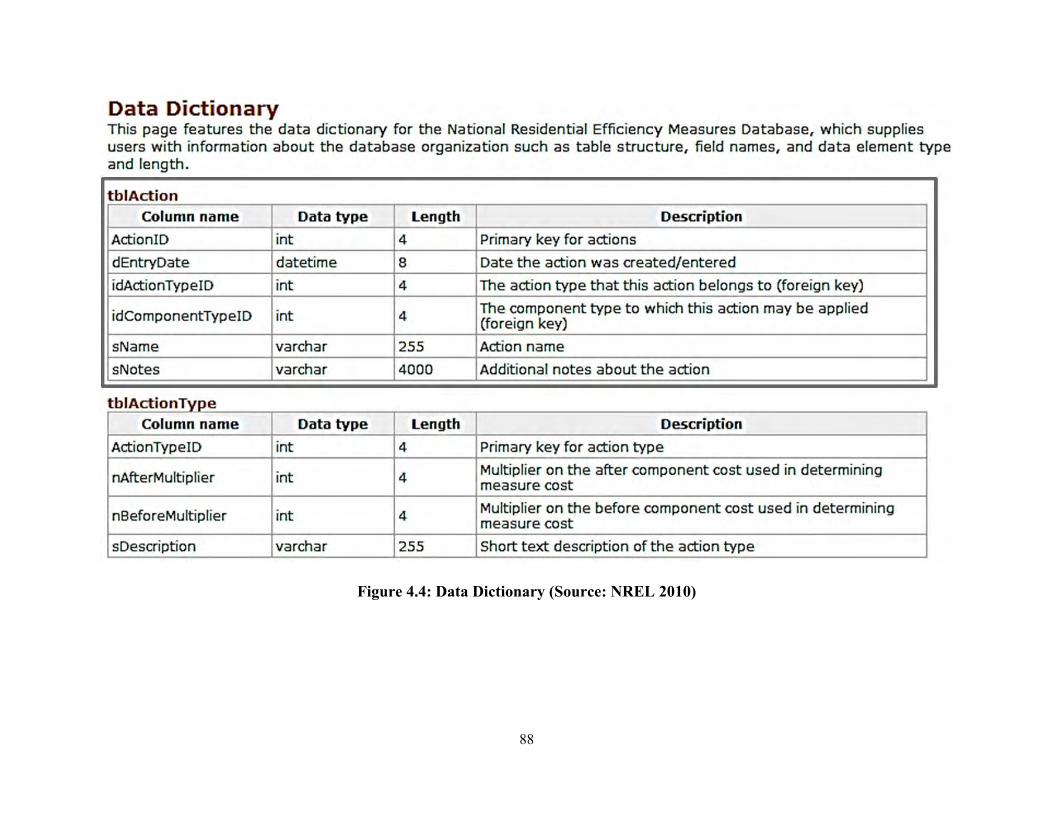
4.2.1 Database Structure……………………………………………………………... 84 4.2.2 Basic Objects…………………………………………………………………... 85 4.2.3 Database Configuration………………………………………………………... 86 4.2.4 Measure Construction………………………………………………………….. 89 4.2.5 Actions for Retrofit Measures………………………………………………….. 94 4.2.6 Cost Sources and Types………………………………………………………... 95
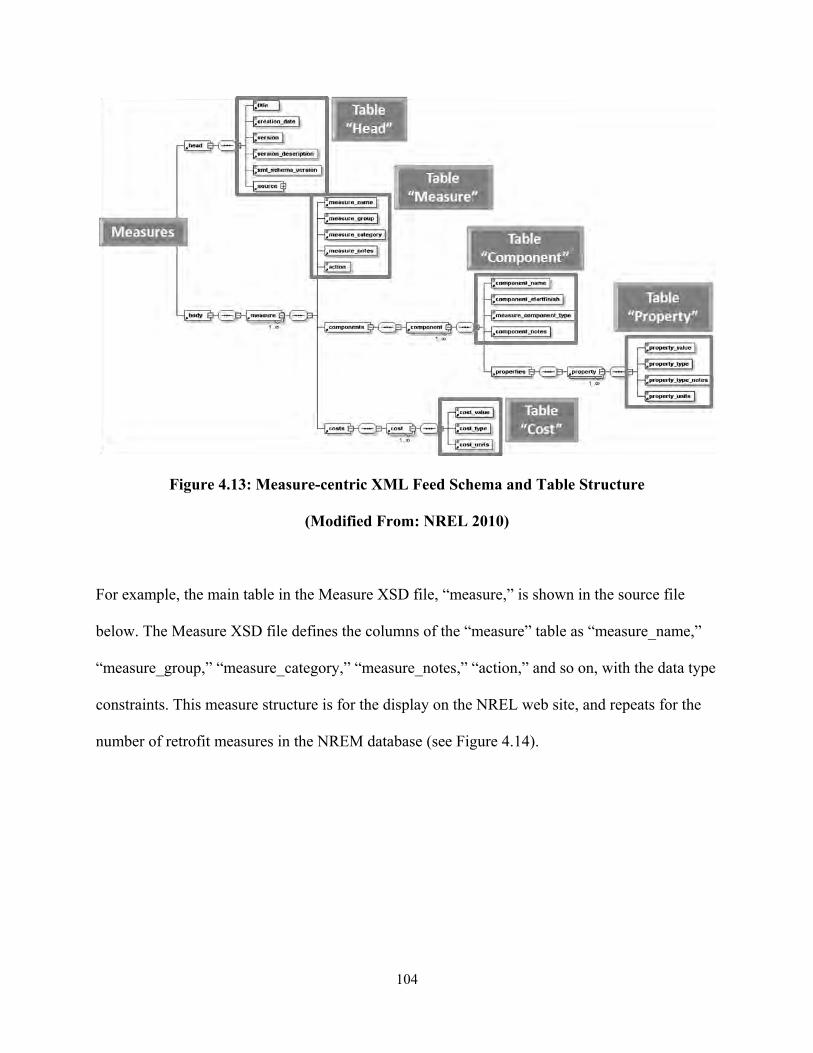
4.3 Technical Analysis of the NREM Database…………………………………………… 96 4.3.1 Extensible Markup Language (XML) and XML Schema Definition (XSD)...... 97 4.3.2 XML Path Language (XPath) and Other Related Terms………………………. 98 4.3.3 NREM XSD File (Raw Data, Measure Files)………………………………….. 99 4.3.4 NREM XML File (Raw Data, Measure Files)…………………………………. 105
Page 8
viii
4.3.5 The Various Software Used for the NREM Database Analysis……………….. 109 4.4 Building Energy Optimazation (BEopt)…………………………………..…………… 111
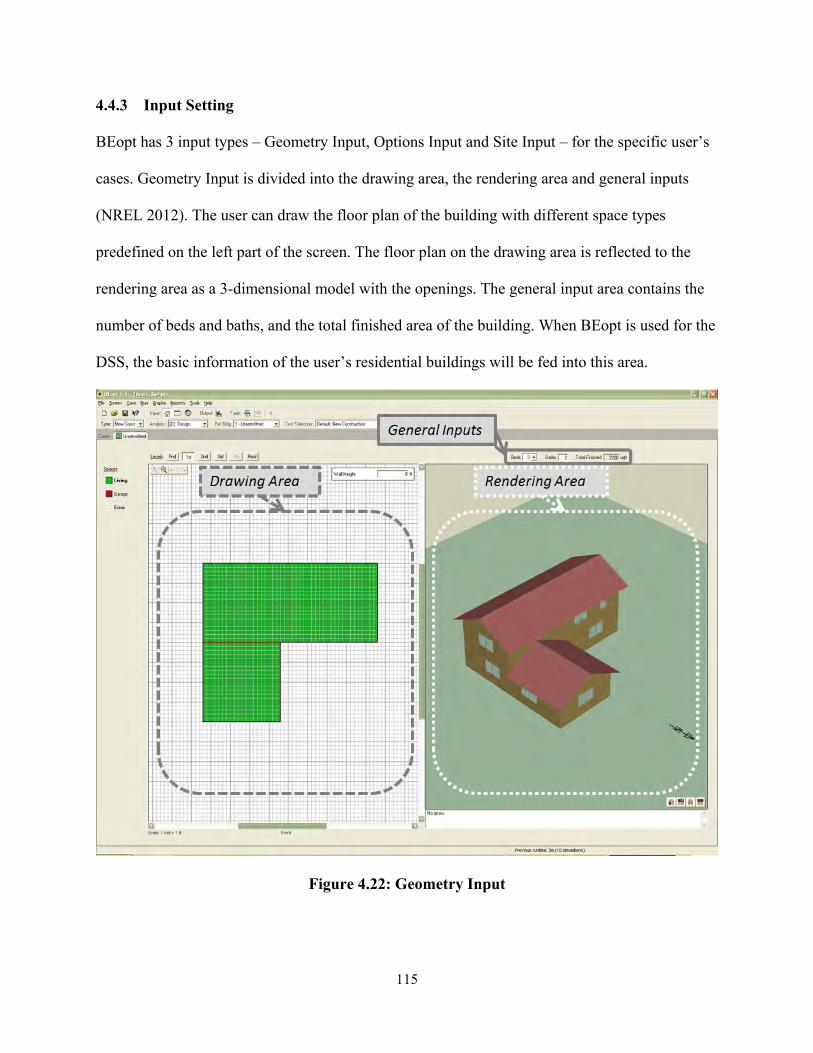
4.4.1 Path to Zero Net Energy (BEopt Graph)………………………………………. 112 4.4.2 BEopt Running Process………………………………………………………... 114 4.4.3 Input Setting……………………………………………………………………. 115 4.4.4 Energy Simulation Output……………………………………………………... 117 4.4.5 Creating a Report………………………………………………………………. 119 4.4.6 BEopt Cost Information………………………………………………………... 120
4.5 Chapter Summary………………………………………………………………..…….. 121 CHAPTER 5 QUANTITATIVE INFORMATION INTEGRATION MODE WITH A WORKING EXAMPLE 5.1 Overview……………………………………………………………………………….. 122
5.1.1 Overall Procedure……………………………………………………………… 122 5.1.2 Technical Limitation: Manual Work (BEopt)………………………………….. 124
5.2 Structural Analysis……………………………………………………………………... 125 5.2.1 Linking Exsys Corvid Components and Quantitative Data Sources…………... 125 5.2.2 Exsys Structure for Integration Model…………………………………………. 126 5.2.3 Applying Exsys Structure to the Framework…………………………………... 128
5.3 Integrating External Quantitative Information…………………………………………. 129 5.3.1 Integrating the NREM XML Database………………………………………… 130 5.3.2 Integrating BEopt Information…………………………………………………. 132 5.3.3 Integrating Text, Image and Link Information………………………………… 137
5.4 Integration Model Developing Process………………………………….……………... 139 5.4.1 Organization of Questions……………………………………………………... 139 5.4.2 Composition of Answer List…………………………………………………… 140 5.4.3 Output Result Arrangement……………………………………………………. 142 5.4.4 Variable Setting………………………………………………………………... 143 5.4.5 Logic Block…………………………………………………………………….. 145 5.4.6 Command Block……………………………………………………………….. 151
5.5 Working Example……………………………………………………………………… 153 5.5.1 Basic Questioning Process……………………………………………………... 153 5.5.2 Result Screen……………………………………………………………........... 157 5.5.3 Remaining Budget……………………………………………………………... 161 5.5.4 Result Values Validation………………………………………………………. 164
5.6 Additional Example…………………………………………………………….……… 167 5.7 BEopt Calling Example (Separate Model)……………………………….……………. 170 5.8 Chapter Summary……………………………………………………………………… 173 CHAPTER 6 SUMMARY AND CONCLUSIONS 6.1 Overview……………………………………………………………………………….. 175 6.2 Summary of the Objectives…………………………………………………………….. 176 6.3 Concluding Observations and Limitations…………………………...…………………181 6.4 Plans for Future Research……………………………………………………………… 183
Page 9
ix
6.5 Chapter Summary……………………………………………………………………… 184
APPENDICES 1 INTEGRATION MODEL WORKING EXAMPLE FULL PROCESS Appendix 1.1 : Main Example – Queries…………………………………………………. 186 Appendix 1.2 : Main Example – Results………………………………………………….. 197 Appendix 1.3 : Main Example – Developed Logic (Backward Chaining)………………... 210 Appendix 1.4 : Main Example – Developed Logic (Logic Block)………………………...211 Appendix 1.5 : Main Example – Developed Logic (Meta Block)………………………… 214 Appendix 1.6 : Main Example – Command Block……………………………………….. 215 Appendix 1.7 : Main Example – Variables……………………………………………….. 216 Appendix 1.8 : Main Example – Budget Calculation Related Variables…………………. 220 Appendix 1.9 : Main Example – BEopt Information……………………………………... 222 Appendix 1.10 : Main Example – Creating Meta Block…………………………………… 228 Appendix 1.11 : BEopt Calling Example…………………………………………………... 232 Appendix 1.12 : Images, Documents, and Web Link Sources for the Integration Model…. 235 APPENDICES 2 EMAILS ABOUT TECHNICAL LIMITATIONS AND SOFTWARE Appendix 2.1 : Email from BEopt………………………………………………………… 237 Appendix 2.2 : Email from Exsys………………………………………………………….238 Appendix 2.3 : Email about Software…………………………………………………….. 239 REFERENCES…………………………………………………………...…....................... 240
Page 10
x
LIST OF FIGURES Figure 1.1 : Research Tasks of the Cost Effective Energy Retrofit Team……………….. 4 Figure 1.2 : Two Information Types for the Decision Support System………………….. 5 Figure 1.3 : Research Objectives…………………………………………………………. 15 Figure 1.4 : The usage of software……………………………………………………….. 19 Figure 1.5 : Sample Diagram of Database Integration…………………………………… 19 Figure 1.6 : Structure-Based System Integration Outline………………………………… 22 Figure 1.7 : Process-Based System Integration Outline………………………………….. 23 Figure 1.8 : Simplified Research Structure………………………………………………. 26 Figure 1.9 : Detailed Research Structure…………………………………………………. 27 Figure 2.1 : Structure of the Literature Review…………………………………………... 28 Figure 2.2 : Components of an Expert System…………………………………………… 42 Figure 2.3 : Components of a Decision Support System…………………………………. 43 Figure 3.1 : Energy Retrofit Decision Process Framework………………………………. 58 Figure 3.2 : Developing ES Logic Using Expert Knowledge……………………………. 62 Figure 3.3 : Modified Framework Focused on Quantitative Data………………………... 62 Figure 3.4 : BEopt Modeling of the Working Example………………………………….. 63 Figure 3.5 : Annualized Utility Bills Graph from BEopt………………………………… 66 Figure 3.6 : Cost Information for Prioritizing Measures…………………………………. 68 Figure 3.7 : Static List Variables…………………………………………………………. 73 Figure 3.8 : Dynamic List Variables……………………………………………………… 74 Figure 3.9 : Numeric Variables…………………………………………………………… 75
Page 11
xi
Figure 3.10 : String Variables……………………………………………………………… 76 Figure 3.11 : Collection Variables…………………………………………………………. 77 Figure 3.12 : Confidence Variables………………………………………………………... 78 Figure 3.13 : Basic Structure of Exsys Corvid…………………………………………….. 80 Figure 4.1 : NREM Development Process and Use………………………………………. 83 Figure 4.2 : Database Structure and Hierarchy…………………………………………… 84 Figure 4.3 : Database Schema…………………………………………………………….. 87 Figure 4.4 : Data Dictionary……………………………………………………………… 88 Figure 4.5 : Types of Retrofit Measures………………………………………………….. 89 Figure 4.6 : Types of Retrofit Measures and Components……………………………….. 90 Figure 4.7 : The Relationship between Data Hierarchy and Measure Structure…………. 91 Figure 4.8 : An Example of a Retrofit Measure………………………………………….. 93 Figure 4.9 : Cost Multipliers for Action Types…………………………………………... 95 Figure 4.10 : Use of XPath for the Integration of DSS and NREM XML database………. 99 Figure 4.11 : Detailed Data Schema……………………………………………………….. 101 Figure 4.12 : Data XSD File, Table Structure Example…………………………………… 102 Figure 4.13 : Measure-centric XML Feed Schema and Table Structure…………………... 104 Figure 4.14 : Measure XSD File, Table Structure Example……………………………….. 105 Figure 4.15 : Data XML File, Data Example……………………………………………… 107 Figure 4.16 : Detailed Database Schema…………………………………………………... 107 Figure 4.17 : Measure XML File, Data Example………………………………………….. 108 Figure 4.18 : Data Access File……………………………………………………………... 110 Figure 4.19 : Measure Access File………………………………………………………… 110
Page 12
xii
Figure 4.20 : A Building’s Path to Zero Net Energy………………………………………. 113 Figure 4.21 : BEopt Running Process……………………………………………………… 114 Figure 4.22 : Geometry Input……………………………………………………………… 115 Figure 4.23 : Option Input…………………………………………………………………. 116 Figure 4.24 : Site Input…………………………………………………………………….. 117 Figure 4.25 : Output Graphs……………………………………………………………….. 118 Figure 4.26 : BEopt Cost Sources…………………………………………………………. 120 Figure 5.1 : Overall Procedure and Limitation…………………………………………… 124 Figure 5.2 : Exsys Corvid Components and External Data Sources……………………... 126 Figure 5.3 : Exsys Corvid Developing Structure…………………………………………. 127 Figure 5.4 : The Framework with Corvid Structure……………………………………… 128 Figure 5.5 : Information Flow…………………………………………………………….. 130 Figure 5.6 : Variable Option Setting……………………………………………………… 131 Figure 5.7 : XML File Location…………………………………………………………... 131 Figure 5.8 : BEopt Input Screen………………………………………………………….. 132 Figure 5.9 : BEopt Output Screen………………………………………………………… 133 Figure 5.10 : Exported BEopt Output Data (Raw File)……………………………………. 134 Figure 5.11 : Converting File Using Excel Macro…………………………………………. 134 Figure 5.12 : Converted BEopt Output Data………………………………………………. 135 Figure 5.13 : Importing BEoput Ouput File from Meta Block…………………………….. 136 Figure 5.14 : Imported Column Heads in Meta Block…………………………………….. 136 Figure 5.15 : Imported Data in Meta Block………………………………………………... 137 Figure 5.16 : Text, Image, Link Information in Meta Block………………………………. 138
Page 13
xiii
Figure 5.17 : Selecting Possible Measure Improvements from NREM Database…………. 140 Figure 5.18 : Compatible Measure Example between NREM Database and BEopt………. 141 Figure 5.19 : Incompatible Measure Example between NREM Database and BEopt…….. 142 Figure 5.20 : The Concept of Backward Chaining………………………………………… 146 Figure 5.21 : The Use of Backward Chaining in Logic Block…………………………….. 147 Figure 5.22 : Table of Cost Information…………………………………………………… 148 Figure 5.23 : Transforming Variables for Remaining Budget Calculation………………... 151 Figure 5.24 : Command Block in Integration Model………………………………………. 152 Figure 5.25 : Result Setting in Command Block…………………………………………... 153 Figure 5.26 : Initial Questions in the Running Process……………………………………. 154 Figure 5.27 : Measure Questions (Current State, Quantity)……………………………….. 155 Figure 5.28 : Measure Questions (NREM After-Component and Cost Lists)……………... 156 Figure 5.29 : NREM Webpage Link with NREM Database Information…………………. 157 Figure 5.30 : The Beginning Part of the Result Screen……………………………………. 158 Figure 5.31 : Information on the Result Screen……………………………………………. 159 Figure 5.32 : Web Link from the Result Screen…………………………………………… 160 Figure 5.33 : Additional Document from the Result Screen………………………………. 160 Figure 5.34 : Effect of Payback Year Information………………………………………… 161 Figure 5.35 : Calculated Remaining Budget……………………………………………….. 164 Figure 5.36 : Attic Insulation Result……………………………………………………….. 165 Figure 5.37 : Checking Attic Insulation Unit Cost Using XPath…………………………... 166 Figure 5.38 : Checking Attic Insulation Unit Cost in the NREM XML Source File……… 167 Figure 5.39 : Another Example of User’s Retrofit Measures……………………………… 168
Page 14
xiv
Figure 5.40 : Annual Utility Bill Graph……………………………………………………. 168 Figure 5.41 : Exported Annual Utility Bill Information (Total Column)………………….. 169 Figure 5.42 : Applying the Changed BEopt Information (Total Column)……………….... 169 Figure 5.43 : Setting Run as Application…………………………………………………... 170 Figure 5.44 : Command Block of BEopt Calling Model…………………………………... 171 Figure 5.45 : Command Block of BEopt Calling Model…………………………………... 172 Figure 5.46 : Opening BEopt Application within Exsys Corvid…………………………... 172 Figure 5.47 : Result Screen and Output Text File…………………………………………. 173 Figure 5.48 : Summary of Running Process……………………………………………….. 174
Page 15
xv
Figure Appendix 1.1 : Main Example – Queries…………………………………………. 186 Figure Appendix 1.2 : Main Example – Results………………………………………….. 197 Figure Appendix 1.3 : Main Example – Developed Logic (Backward Chaining)………... 210 Figure Appendix 1.4 : Main Example – Developed Logic (Logic Block)………………...211 Figure Appendix 1.5 : Main Example – Developed Logic (Meta Block)………………… 214 Figure Appendix 1.6 : Main Example – Command Block……………………………….. 215 Figure Appendix 1.7 : Main Example – Variables……………………………………….. 216 Figure Appendix 1.8 : Main Example – Budget Calculation Related Variables…………. 220 Figure Appendix 1.9 : Main Example – BEopt Information……………………………... 222 Figure Appendix 1.10 : Main Example – Creating Meta Block…………………………… 228 Figure Appendix 1.11 : BEopt Calling Example…………………………………………... 232 Figure Appendix 2.1 : Email from BEopt………………………………………………… 237 Figure Appendix 2.2 : Email from Exsys………………………………………………….238 Figure Appendix 2.3 : Email about Software…………………………………………….. 239
Page 16
1
CHAPTER 1
INTRODUCTION
1.1 INTRODUCTION
In modern society, there is a need to reduce energy use to achieve sustainability. The building
sector primarily contributes to conventional fuel consumption; as a result, it induces significant
global warming gas releases. Buildings consume about 40 percent of all global energy, thus,
increasing the energy efficiency of the building sector will have a great economic impact as well
as work to achieve a more sustainable environment (Kolokotsa et al. 2009).
The residential building sector used over 20 percent of the total energy in the U.S. during the last
few decades, so reducing household energy will play a significant role in improving energy
security (Jones et al. 2010). The U.S. Department of Energy (DOE) Building America Program
has promoted research to adopt advanced building energy technologies in residential buildings to
save large amounts of energy.
To provide information on achieving energy efficiency in residential buildings, a Decision
Support System (DSS) is a suitable technology choice. A DSS is an interactive information
system based on a computer and a comprehensive database. According to Turban and Watkins
(1986), an Expert System (ES) is a computer program for utilizing expert knowledge, with a
reasoning mechanism and a knowledge base. A Decision Support System in the form of a rule-
based Expert System can help homeowners make efficient decisions about home energy retrofits
with qualitative expert knowledge and quantitative retrofit data.
Page 17
2
According to the Merriam-Webster Dictionary (2011), an expert system means “computer
software that attempts to mimic the reasoning of a human specialist.” Expert Systems reason and
produce decisions in a manner similar to humans to solve complex problems (Syal 2012). They
are one of the most developed applications to have emerged from artificial intelligence (AI)
research, and have been widely used (Palmquist 1996). AI aims to perceive the process, systems,
and principles that enable intelligent behavior, and computers are used as modeling tools to
embody these intellectual decision-making processes (Sharples et al. 1994).
Expert systems have been implemented, from a simple system to complex multipurpose systems,
in various fields such as agriculture, education, law, manufacturing, environmental management
and medicine, as well as construction management. Expert systems successfully deliver an
extensive amount of experts’ knowledge for decision makers to use in an approachable and
comprehensible way. Recently, expert systems have been used in integrated forms, combining
with other technologies. For example, in the environment management field, an expert system
integrated with Geographic Information Systems (GIS) and simulation modeling has been
developed to facilitate user requirements more effectively (Wai et al. 2005).
In the construction management field, ESs have been used as selection systems, advisory
systems, monitoring and control systems, and analysis and evaluation systems to help the
decision-making process (Yang et al. 1996). To be more specific, expert systems have been
applied to the prequalification of construction contractors, for planning and scheduling
construction projects, for monitoring and control of earthmoving scraper operations, for the
process of construction delay analysis, as a system for the analysis of change order claims, as a
Page 18
3
prototype system for construction planning and productivity analysis, and so forth. (Yang et al.
1996).
Juan et al. (2009) presented a housing condition assessment and refurbishment DSS, composed
of an interface module, an analysis module, and a database module. The interface module
provided expert knowledge on refurbishment designers and contractors, and the database module
provided access to cost information and refurbishment skills in a given market.
In this research, an expert system is proposed to serve as the decision support system for a
residential energy retrofit system. One of the main barriers to the home energy retrofit initiative
has been identified as the lack of accessible information for homeowners (Residential Energy
Services Network [RESNET] 2010). An expert system can provide an efficient way to resolve
this problem. It will be implemented as a hybrid form by integrating the expert knowledge base
with a cost database and an energy simulation program.
1.1.1 Cost Effective Energy Retrofit Team Project
The U.S. Department of Energy (DOE)’s Building America Program has funded research on four
major tasks by the Cost Effective Energy Retrofit Team since October 2010. The research
proposed in this thesis is a part of Task 6.3, which is one of four tasks shown in Figure 1.1. The
major tasks are summarized in Figure 1.1 and following descriptions below:
Page 19
4
Figure 1.1: Research Tasks of the Cost Effective Energy Retrofit Team
Task 6.1: A market characterization project aims to identify the dominant archetypes of
homes in the Great Lakes Region of the US. The archetypes are identified by
architectural style, vintage, and construction style. Once identified, they are tested, and a
prescriptive package of measures is identified for them.
Task 6.2: This work aims to identify key stakeholders in the value chain of home energy
retrofits, and to collect information about the needs of those stakeholders. This
information will then be used to implement retrofits in a manner that targets the end-user.
Task 6.3: This project proposes an information framework of a query-based intelligent
DSS for energy efficiency upgrades. It will provide appropriate information to users on
home energy retrofit efficiency.
Page 20
5
Task 7.1: This project performs field testing of the dominant measures, to identify a
prescriptive package of measures that will improve home energy performance. In
addition, it will identify quality control strategies for the installation of the identified
measures.
1.1.2 Information Types for the Decision Support System Framework
The Decision Support System is envisioned as being implemented in the form of a query-based
expert system. The fundamental framework of the Decision Support System utilizes two major
information sources. One is quantitative information, which includes cost and retrofit measure
information, and the other is qualitative information derived from expert knowledge.
Samuel, Duah and Syal (2011) defined the two data types as follows in Figure 1.2:
Knowledge: Qualitative information/Informal information/Experience/Heuristics/
Expertise
Database: Quantitative information/Formal information/Published information
Figure 1.2: Two Information Types for the Decision Support System
Page 21
6
1.2 NEED STATEMENT
1.2.1 Need for Energy Retrofitting for Existing Homes
A home energy retrofit system can be applied to two different categories, “new construction” and
“existing homes.” This research focuses on retrofitting existing homes to improve their energy
efficiency. According to the American Housing Survey for the United States 2009 (HUD 2011),
there were approximately 130 million existing housing units at that time. The number of new
homes built is at about half million to two million per year (U.S. Department of Energy Building
America [US DOE BA] 2010a). The number of existing homes provides a very high volume of
home energy retrofit opportunities; improving their energy efficiency would give rise to
enormous energy savings.
A study conducted by the Joint Center for Housing Studies (JCHS) at Harvard University (2009)
showed that homeowners spent 52 billion dollars on energy remodeling projects in 2007, which
showed an increase from 33 billion dollars of 1997. This highlights that the demands for green
remodeling projects are growing due to rising home energy costs and increasing in homeowners’
environmental concerns (JCHS 2009).
According to the study by JCHS (2009), homes built before the oil crisis in the 1970s are not
energy-efficient because homeowners were not concerned about energy conservation. The U.S.
government recognized the need to improve the energy efficiency of existing buildings,
including residential buildings; the U.S. Department of Energy is currently offering many energy
efficiency retrofit programs such as “Building America” and the “Weatherization Assistance
Program.”
Page 22
7
1.2.2 Need for Quality Information and Efficient Information Delivery
1) Lack of quality information
“The problem is not a lack of energy efficient technology, but a lack of information required to
implement such technologies.” This was stated at an experts’ meeting held in October 2010 in
Albany, New York, hosted by the U.S. Department of Energy’s (DOE’s) Building America
Program, and the New York State Energy Research and Development Authority (NYSERDA).
This meeting was held to identify key research topics, and to find gaps in the adoption of
condensing boilers, which should be more energy-efficient than conventional boilers. This
statement illustrates one of the major needs of home energy retrofitting (Samuel 2011). The
meeting report stated that “condensing boilers are not being successfully implemented in a large
scale because of a clear lack of information on optimum installation strategies and insufficient
training for installers and designers” (Steven Winter Associates, Inc. 2010). This statement can
be applied broadly to other innovative technologies and appliances related to home energy
efficiency. The Decision Support System will give guidelines to consumers and auditors with
qualified expertise.
2) Lack of efficient information delivery
The Residential Buildings Energy Efficiency Meeting, held in July of 2010, identified additional
key barriers associated with residential energy efficiency information. The meeting report stated
that “Information is out there but is not getting into the hands of the right people,” and “There is
limited access to information for consumers and contractors” (US DOE BA 2010b). It
emphasized information from researchers, manufacturers and public institutions needs to flow to
Page 23
8
the home energy retrofit industry and homeowners in prompt and appropriate ways in order to
encourage large-scale adoption of energy retrofits (Samuel 2011).
1.2.3 Need for Expert Knowledge
1) Confusion from published information
“Too much information is out there for building technology, but no one knows what to read and
no one knows what to believe,” stated Liz Cocke, director of the Affordable Housing Research
division of the U.S. Department of Housing and Urban Development (HUD), at a conference
held in December, 2011. Researchers, manufacturers, and homeowners are concerned that
finding published information about home energy efficiency is overwhelming. Most of this
information is scattered, making it difficult to find the proper information in an effective way
(Partnership for Advancing Technology in Housing [PATH] 2002). When homeowners are faced
with information selected from a variety published sources, they are also confused about the
contradictions between quantitative and qualitative information (PATH 2002). Moreover, in
many cases, manufacturers provide inaccurate information about energy-efficiency technologies
in their product advertisements, based on their self-interests. As a result, consumers who have
suffered from such misinformation will tend to mistrust other related information as well
(Golove & Eto 1996).
2) Mistrust of energy auditors and contractors
In the Residential Buildings Energy Efficiency Meeting held in July, 2010, it was stated that
homeowners lacked the information needed to distinguish between an energy efficient product
and those using false claims of energy efficiency as a marketing means (US DOE BA 2010b).
Page 24
9
Homeowners may also distrust contractors’ and manufacturers’ claims, and distrust energy
auditors with interests in gaining contracts (Samuel 2011, Romero 2011). These parties have a
great influence on the homeowners’ decision-making processes. The proposed DSS can also be
used by auditors and contractors to add more credibility to their works.
3) Difficult to prioritize retrofit measures within a given budget
Through the interviews conducted by Samuel (2011), energy experts suggested following a cost-
effective approach that would shortlist and prioritize measures within the user’s given budget.
However, users do not have enough information about how they can prioritize retrofit measures
effectively. Based on Samuel (2011) and the need to fill the lack of a quality information
delivery system, this study will consider several concepts when prioritizing retrofit measures,
which the Decision Support System will apply to its frame, as follows:
Consideration of interactions between building components to prioritize measures.
Consideration of user needs in shortlisting and prioritization.
Cost of retrofit measures in shortlisting and prioritizing measures.
Analysis of energy savings by building energy simulation software.
4) Query-Based Expert System as a tool to capture and utilize the expert knowledge
A Query-Base Expert System (QBES) can be used as an effective tool for capturing and utilizing
expert knowledge. Turban et al. (2004) explained the functioning stages of a QBES as follows:
Stage I: Qualitative Information Acquisition and Storage (Knowledge)
Stage II: Quantitative Information Acquisition and Storage (Data)
Stage III: Information Processing by Integration of Knowledge and Database
Page 25
10
Stage IV: User Interface
Similarly, in this research, knowledge from experts is collected through expert interviews to
form a knowledgebase. The sources of quantitative information or data known as factual
information are both from the NREM database and from building-science related publications,
which include the Building America literature. The information will be integrated in the Expert
System and will provide expert knowledge through its user interface. Through such functioning
stages, an ES captures and utilizes expert knowledge.
1.2.4 Need for Effective Use of Quantitative Information in Decision Support System
1) Cost database
The National Renewable Energy Laboratory (NREL) established the unified National Residential
Efficiency Measure (NREM) database by integrating several existing DOE databases on building
retrofit measures and costs, to provide residential retrofit information in a standardized format
(National Renewable Energy Laboratory [NREL] 2010). Its standard technical definitions for
energy retrofit measures maintain the consistency of input information, and can be utilized by
software analysts and developers through a Web interface and XML (extensible markup
language) feeds (Polly et al. 2011).
The NREM database can be applied to various residential energy retrofit applications in order to
calculate the cost information for the selected measures. This standardized information is a
essential element of the DSS on energy, to provide consistent retrofit cost information to
customers, contractors and energy auditors.
Page 26
11
2) Energy simulation software
Building simulation programs can be used to design and assess the overall performance of
buildings, because they can analyze the various building systems, and forecast the behavior
based on such analysis. When a simulation program is combined with a DSS, it can provide a
holistic assessment of the building system (Avgelis & Papadopoulos 2010).
The NREL has developed energy simulation software, Building Energy Optimization (BEopt).
BEopt evaluates residential building designs and analyzes home retrofits through cost-based
optimization. BEopt uses sequential search optimization techniques to find minimum-cost
building designs at different target energy-saving levels, and to identify multiple near-optimal
designs along the path, allowing for maximal solutions based on builder or contractor
preferences (BEopt Version 1.1).
BEopt suggests the optimal energy combinations of building measures related to a building’s
envelope, appliances, equipment, and so forth, combined with weather data, energy costs and
energy savings (Schmidt 2008). BEopt mainly accesses its cost information from the NREM
database and RS Means data. BEopt can be used for both new construction and existing homes,
and it is the preferred energy simulation software in this research, for analyzing existing
residential energy efficiency.
Page 27
12
3) Existing published literature
Information from existing literature can be a helpful source for explaining various details of the
energy retrofit measures. Text explanations and pictures from established research can aid DSS
users in understanding specialized and technical information more effectively.
Federal and state governments promote energy efficiency in the residential sector through a
variety of programs; two of them, the DOE’s Building America program and the Partnership for
Advancing Technology in Housing (PATH), have conducted vigorous field research on the topic.
The information from their research reports will be used in this thesis to explain energy
retrofitting.
1.2.5 Need for an Integrated Intelligent Decision Support System
A cost information database, energy simulation software, existing literature information and
experts’ opinions all play significant roles in residential energy retrofitting decision-making.
Even though the outcomes of these components are inter-related, they have not generally been
used in an integrated manner. Integrating all of them in a Decision Support System will provide
synthesized energy retrofit information in a comprehensive and coordinated fashion. Such an
integrated intelligent DSS will provide an overall basis for developing an effective query-based
expert system. In this integrated intelligent DSS, the database will be utilized to configure the
cost-related quantitative part of the decision, and the simulation program will interpret and help
prioritize the measure selection decisions. Finally, the published literature will provide
installation- and safety-related details. This integrated process will support users in making their
Page 28
13
decisions with more confidence, and will eventually help promote the adoption of energy
retrofitting.
1.3 GOALS AND OBJECTIVES
The primary purpose of this research is to support the development of an intelligent Decision
Support System by integrating quantitative information with expert knowledge in order to
facilitate effective retrofit decision-making. In order to achieve the research goal, the specific
project objectives below are attained:
OBJECTIVE 1: To understand the energy retrofit decision process framework
Samuel (2011) developed the Energy Retrofit Decision Process Framework. The framework is
the foundation of this thesis research. Within the context he proposed, this research identifies,
shortlists, and prioritizes retrofit measures based on users’ needs. Then, expert knowledge is
provided for the efficient installation of the measures.
OBJECTIVE 2: To understand the backgrounds of energy retrofit decision-making and
the use of expert knowledge by means of Artificial Intelligence (AI) / Expert Systems (ES) /
Decision Support Systems (DSS)
The main aspect of the overall Decision Support System is to provide expert knowledge to
consumers through a query-based expert system. Although this research is focused on the use of
quantitative data, an understanding of the associated expert knowledge is needed in order to
integrate the two effectively. Thus, the role of expert knowledge in residential energy retrofit
decisions should be explained at the beginning of this research.
Page 29
14
OBJECTIVE 3: To identify and explain various aspects of quantitative information
Quantitative information from various sources is another core of the Decision Support System.
Identifying and explaining the various aspects of quantitative information are necessary to
understand their integration in the DSS. In this research, the main quantitative information is
derived from three sources:
3a. The first data source for objective 3 is the NREM database, for the acquisition of the cost-
related information on energy retrofits.
3b. The second data source is BEopt energy simulation software for prioritizing the retrofit
measures initially selected, based on homeowners’ need.
3c. The third source is published text, figures and pictures, to provide various explanations and
installation advice for the selected measures.
OBJECTIVE 4: To integrate various aspects of quantitative information with expert
knowledge
For the effective use of the Decision Support System, various aspects of quantitative information
from Objective 3 are integrated with the DSS.
Page 30
15
Figure 1.3: Research Objectives
1.4 METHODOLOGY
In this section, the objectives were broken down into various work steps. This research
methodology was mainly based on the procedural approach to performing each objective step-
by-step. The feature of each component to be integrated was analyzed first; technical skills for
the integration were then introduced. The integration followed prototyping analysis and design,
which was a system development method for iteratively developing a system, from simple
samples to the final system, through learning acquired from the former simpler models.
OBJECTIVE 1: To understand the energy retrofit decision process framework
Step 1: Review the framework and refined expert knowledge
This research was based on the Decision Support System framework developed by the Task 6.3
research group. The framework included not only the overall framework for the subsequent
research but also the refined expert knowledge derived from interviews with residential energy
Page 31
16
experts. This study thoroughly explained the framework and the important role of expert
knowledge in residential energy retrofit decisions, and utilized the information to carry on this
research.
OBJECTIVE 2: To understand the backgrounds of energy retrofit decision-making and
the use of expert knowledge by means of Artificial Intelligence (AI) / Expert Systems (ES) /
Decision Support Systems (DSS): Step 2 and Step 3 are associated with this objective.
Step 2: Review research background
Initially, the background and needs of this research were reviewed. A full understanding of the
reciprocal actions among the tasks gave a holistic point-of-view for proceeding to the next step
of this research.
Step 3: Review the long-term plan of Task 6.3
In this step, the long-term plan of this task was examined. The whole picture of this task was
reviewed to explain the phases and their specific roles in this research.
OBJECTIVE 3: To identify and explain various aspects of quantitative information: Step 4
through Step 6 are conducted to achieve Objective 3. 3a to 3c identify the data sources used for
each step.
3a. The first data source for objective 3 is the NREM database, for the acquisition of the cost-
related information on energy retrofits.
Page 32
17
Step 4: Analyze current NREM database
The existing NREL portal was studied to learn about the NREM database. The database stored
properties and costs for measure components and measure actions, and a thorough analysis of the
NREM database was the solid foundation of this research.
3b. The second data source is BEopt energy simulation software for prioritizing the retrofit
measures initially selected, based on homeowners’ need.
Step 5: Learn how to use BEopt
In the process of developing this research, energy simulation programs were indispensable. In
the query-based Decision Support System, with the selected measures and cost information
chosen as a result of the user’s query and the NREM database, the energy efficiency results were
simulated with software, such as BEopt. Using tutorials to practice these programs increased
familiarity with them.
3c. The third source is published text, figures and pictures, to provide various explanations and
installation advice for the selected measures.
Step 6: Compile existing energy retrofit information and organize them
A literature-based study was performed to compile existing energy retrofit information; the text
and pictures from the study were organized according to the measure categories applied to the
Decision Support System. This information was used to illustrate the expert knowledge.
Page 33
18
OBJECTIVE 4: To integrate various aspects of quantitative information with expert
knowledge: Step 7 through Step 15 are associated with this objective.
Step 7: Understand and utilize XML
The NREM database was established with XML (eXtensible Markup Language). To understand
and use the XML database documents, XML and its related terms and syntax should be
understood. This study performed a literature-based study of XML and utilized this information
to analyze the NREM database in a technical way.
Step 8: Understand and utilize Exsys Corvid
Exsys Corvid was the main software being used to realize the new intelligent Decision Support
System. Exsys Corvid constituted the query system based on the main logic tree. In this process
it imported and utilized the external NREM database and energy simulation software.
Understanding Exsys Corvid was the key to the integration process. This study performed a
literature-based study, mainly using the tutorials and practicing with the program with an
example, and then applying this knowledge to the real integration.
Step 9: Utilize software tools for database and simulation program integration
To analyze the NREM database established with XML in a technical way, some software tools
were needed, such as XML Spy, BaseX and Microsoft Access. XML Spy was an XML editing
tool and BaseX was XML database software. Microsoft Access was a helpful tool for analyzing
databases as well. These programs were studied through their tutorials and practiced to increase
familiarity with them.
Page 34
19
Figure 1.4: The usage of software
Step 10: Develop simplified database integration sample
Database integration was divided into two categories: technical and business. The technical part
involved importing the external database to the Exsys System. This step did not consider the
complicated business logic tree very much. However, it was only after settling the technical
integration that the tremendous volume of business information could be added to the technical
structure. With the basic knowledge gained from the above software, a sample database
integration was conducted to explain the technical part of the integration.
Figure 1.5: Sample Diagram of Database Integration
Page 35
20
Step 11: Develop simplified simulation program integration sample
The energy simulation program integration followed the same process as the database integration.
With the basic knowledge from the above software, sample simulation program integration was
performed, to explain the technical part of the integration.
Step 12: Analyze and understand the logic tree of the Decision Support System
A logic tree explained the hierarchical structure of queries that would be asked of the users. This
logic tree played the role of the foundation of the query-based Expert System. Therefore, only
after understanding the logic tree thoroughly, could the proper points be integrated into the
database and the simulation. This study explored the logic tree development performed by the
Task 6.3 research team.
Step 13: Fully integrate NREM database to Decision Support System
The full business and technical parts of the system were introduced, and the NREM database was
integrated into the Expert System. First, the NREM database was integrated into the Expert
System technically, and then the complicated business logic was applied to the system
development.
Step 14: Fully integrate energy simulation software to Decision Support System
The full business and technical parts of the system were presented, and BEopt was integrated
into the Expert System. First, the energy simulation software was integrated into the Expert
System technically, and then the complicated business logic was applied to the system
development, using an iterative methodology.
Page 36
21
Step 15: Run and modify the integrated Decision Support System
The whole process – to query the users in order to shortlist and prioritize their retrofit measures,
to select the cost data of the measures from the NREM database, to simulate energy efficiency
with BEopt, and to provide expert knowledge with the supporting text and pictures – was tested.
The general function of the integration model is evaluated to consolidate the system.
Page 37
22
Figure 1.6: Structure-Based System Integration Outline
Page 38
23
Figure 1.7: Process-Based System Integration Outline
Page 39
24
1.5 RESEARCH SCOPE AND LIMITATIONS
1.5.1 Research Scope
The scope of this research is as follows:
This research covers overall home energy retrofits and task 6.3, Intelligent DSS for
Energy Efficiency Upgrades.
This research explains the fundamental concept of an Expert System and the main
application, Exsys Corvid, which is utilized to establish the query-based expert system.
This research analyzes the quantitative NREM database and the integration of the XML
database with an Expert System.
This research utilizes energy simulation software, BEopt, and integrates it with the Expert
System.
This research compiles existing residential retrofit research and Building America reports,
and integrates their text and visual information with the Expert System.
1.5.2 Research Limitations
The limitations of this research are as follows:
This research is based on the framework developed by the Task 6.3 research team for
Intelligent DSS for Energy Efficiency Upgrades.
This research mainly focuses on the quantitative knowledge in an Expert System.
Integrating database is limited to the NREM database.
Integrating energy simulation software is limited to BEopt.
Page 40
25
1.6 DELIVERABLES AND RESEARCH CONTRIBUTIONS
1.6.1 Deliverables
This research explains the quantitative database and the various applications for residential
energy retrofits, and utilizes them in an integrated, all-in-one Expert System. The following
research deliverables are identified and delivered:
Integrate external energy retrofit data to an Expert System, and realize the practical use of
the NREM database cost information through the Expert System.
Integrate external energy simulation software to an Expert System, and realize the
practical use of home energy simulation software through an Expert System.
1.6.2 Research Contributions
This research focuses on integrating several sources for home energy retrofit information and
software synthetically; the main outcome is the realization of a synthesized residential energy
retrofit information system. With this integrated intelligent DSS, this research contributes to
providing a unified source of home energy retrofit information, as well as easy access to that
home energy retrofit information.
Page 41
26
1.7 CHAPTER SUMMARY
Figure 1.8: Simplified Research Structure
This chapter demonstrated the background information for this study. It developed the research
needs, goals and objectives, and the methodology for achieving those objectives. In the latter part,
research scope and limitations were clarified, and the deliverables and contributions of this
research were also provided.
Figure 1.8 and Figure 1.9 visualize the summary of this chapter.
Page 42
27
Figure 1.9: Detailed Research Structure
Page 43
28
CHAPTER 2
LITERATURE REVIEW AND BACKGROUND INFORMATION
2.1 OVERVIEW
The previous chapter introduced the main purpose of this research, and specified the
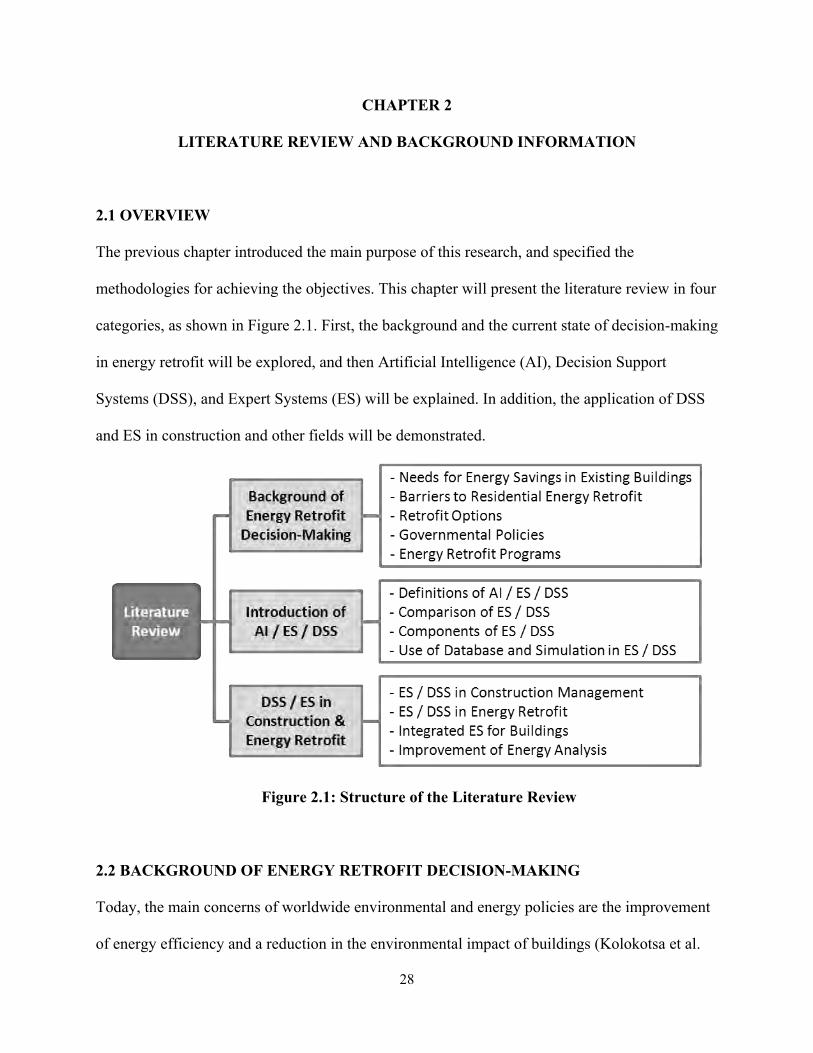
methodologies for achieving the objectives. This chapter will present the literature review in four
categories, as shown in Figure 2.1. First, the background and the current state of decision-making
in energy retrofit will be explored, and then Artificial Intelligence (AI), Decision Support
Systems (DSS), and Expert Systems (ES) will be explained. In addition, the application of DSS
and ES in construction and other fields will be demonstrated.
Figure 2.1: Structure of the Literature Review
2.2 BACKGROUND OF ENERGY RETROFIT DECISION-MAKING
Today, the main concerns of worldwide environmental and energy policies are the improvement
of energy efficiency and a reduction in the environmental impact of buildings (Kolokotsa et al.
Page 44
29
2009). When searching for ways to reduce carbon dioxide (CO2) emissions and energy use,
policymakers and other stakeholders pay attention to energy consumption in buildings.
Commercial and residential buildings are responsible for 42 percent of energy consumption and
41 percent of CO2 emissions in the U.S (Palmer et al. 2012). However, it is significant to
acknowledge that approximately 86 percent of building-energy expenses are related to existing
buildings, not to new construction (Holness 2008). Clearly, significant reductions in CO2
emissions and energy consumption in the U.S. lie in retrofitting the existing building stock
(Palmer et al. 2012).
2.2.1 Needs for Energy Savings in Existing Buildings
New building codes, advanced appliance standards, and improvements in technology have
helped new buildings to be much more energy efficient than existing buildings. For example, on
average, a home built in the 1940s consumes 35 percent more energy per square foot than a
home built in the 1990s (U.S. Department of Energy 2008). According to the Joint Center for
Housing Studies (2009), approximately 40 percent of residential energy consumption is done by
homes built before 1970, and 72 percent is done by homes built before 1990. These examples
demonstrate that advances in home insulation, fenestration, and more efficient air-conditioning
in homes built more recently have paid off despite the increased percentage of households using
central air-conditioning (Holness 2008).
To reduce the energy consumption of existing buildings, the International Energy Agency (IEA
2008) suggests action on:
Page 45
30
Building codes for new buildings
Passive energy houses and zero energy buildings
Policy packages to promote energy efficiency in existing buildings
Building certification schemes
Energy efficiency improvements in windows
Energy auditing for such actions can range from a simple survey to a detailed computer
simulation, and any actions related to the operations of existing buildings can include either
refurbishment or retrofitting. While the term refurbishment implies the modification of a
building to return it to its original state, retrofitting is comprised of the improvement of the
energy and/or environmental performance of a building (Kolokotsa et al. 2009).
Over the last decade, the residential building sector has been responsible for more than 20
percent of the total energy consumption in the U.S., which means housing has been a great
portion of the overall energy consumption and greenhouse gas emissions (Jones et al. 2010). In
addition, many research studies have demonstrated the potential for reducing the energy
consumption of households, implying that existing residential buildings will play a significant
role in this field (Jones et al. 2010).
2.2.2 Barriers to Residential Energy Retrofit
Although the importance of a residential energy retrofit is well known, the implementation rate is
slow due to the barriers in this field. The Home Performance Resource Center (2010) mentions
common barriers to energy audits and retrofits as follows:
Page 46
31
Consumer inertia caused by time, cost, hassles, and general difficulties in collecting
information.
Limited access to capital for financing improvements.
Lack of public consciousness,
Home retrofit services are unobtainable in many places.
One of the barriers is a lack of information about cost-effective investments for improving
energy efficiency. This is more important for owners of older, existing buildings who do not
have knowledge about how to evaluate energy retrofit options and how to improve the energy
efficiency. For example, homeowners usually do not know how much insulation is already
applied in their walls, what the best option is for providing additional insulation, and how much
energy they can save as the result of an energy retrofit. Comparing alternative options and
combinations of possible options are also difficult for general users (Joint Center for Housing
Studies 2009).
Palmer et al. (2012) also explained these barriers as being two-fold. The first issue deals with
whether the industry is influencing homeowners and providing them with suitable information.
The survey results and past reports demonstrate that the industry has only made a small step into
the residential market. The second issue is related to how much the homeowners are following
the suggestions of energy audits in order to improve the energy efficiency of their home. Their
research also demonstrates that homeowners rarely implement all of an auditor’s
recommendations for an energy retrofit (Palmer et al. 2012).
Page 47
32
While the lack of truthful, approachable, and actionable information on the best way to
accomplish the prospective savings is still a crucial barrier, another barrier can be the lack of a
supportive policy, such as financial incentives. Users experience difficulties in financing
expensive home retrofits, and renters’ find limitations in changing the energy use in buildings
owned by others. These barriers can be improved with proper support from governmental
policies (Gardner & Stern 2008).
Research conducted in the late 1970s, during the last U.S energy crisis, explained that a major
barrier to homeowners taking action was the inconvenience and difficulty of identifying and
executing energy retrofits, although utility companies provided rebates to households for most
major home retrofit costs (Gardner & Stern 2008). Another research review from the early 1980s
demonstrated that financial incentives for reducing initial costs stimulated more households to
implement retrofits. Governmental programs were found to derive stronger outcomes when they
were combined with nonfinancial supports to enhance the programs, such as strong marketing
strategies. These helped programs to be more expedient in convincing households to take
advantage of the incentives (Gardner & Stern 2008). During the 1970s and 80s, soaring oil prices
emphasized the need for energy savings to both homeowners and policymakers. However,
homeowners still did not know the best way to achieve this goal, and public policies could not
offer the necessary support for the homeowners to take effective action. These previous
experiences have led to changes in energy retrofit policies and public awareness for
contemporary homeowners and policymakers (Gardner & Stern 2008).
Page 48
33
Efforts to enhance residential energy retrofits have been continuously made. The U.S.
Department of Energy (DOE) Building America Program, which is a research program driven by
industry, has worked with building-science research teams and national laboratories to overcome
these barriers, and to expedite the development and adoption of innovative building energy
technologies in new and existing residential buildings. Their research is related to (US DOE BA
2011a):
Developing retrofit strategies for existing homes in order to achieve substantial energy
savings and guarantee the safety and quality of residential buildings.
Building new community-scale homes that not only save 40 to 100 percent on energy but
also improve indoor air quality and comfort, reduce construction time and waste, provide
innovative energy and material-saving technologies, improve productivity of builders,
and offer new product opportunities to manufacturers and suppliers.
2.2.3 Retrofit Options
There have been continuous efforts to develop residential energy efficiency options. Various
researchers have provided a list of retrofit actions, as follows (International Energy Agency [IEA]
2008):
Lighting improvements such as the replacement of lamps and the adoption of a lighting
control system.
Heating and cooling improvements such as the installation of additional monitoring
devices.
Electro-mechanical equipment improvements such as corrections of load factors.
General improvements such as insulation, and so forth
Page 49
34
Energy usage in residential buildings can be decreased by upgrading windows, adding internal
and external insulation to walls, adding insulation to roofs, and applying measures to reduce
uncontrolled air exchange (Harvey et al. 2009). Among such actions, the improvement of
insulation is regarded as one of the fundamental energy retrofit strategies.
According to the U.S. DOE, 2009 Buildings Energy Data Book, 60 percent of resident buildings
were not well insulated, and 70 percent of commercial buildings did not have roof or wall
insulation (Dernbach et al. 2011). The U.S. Census data (2010) highlighted the fact that
approximately 60 percent of the homes in the U.S were built before 1980; the majority of these
has relatively low level insulation, such as R-11, or even no insulation (Cooperman et al. 2011a).
The DOE Building Energy Data Book (EERE 2010) explained that homes built between 2000
and 2005 consume 40 percent less energy per square foot, compared to homes built before 1950.
This is mainly led by retrofit improvements to the building envelope at the household level,
implemented nationally (Cooperman et al. 2011a).
Existing homes can easily be retrofitted by adding blown in or spray insulation to wall cavities.
If a home retrofits with new siding, high-density foam can be added to the existing sheathing,
providing a new vapor and air barrier for the existing home. The general solution for attic and
roof retrofits is to add insulation to the attic. Additional insulation containing an air gap increases
the R-value of the roof, and helps the roof to maintain a constant temperature during cold
seasons (Cooperman et al. 2011a).
Page 50
35
Super-insulation is advantageous to most houses for both heating and cooling. With this retrofit,
any home using natural gas or electricity for its HVAC system has the potential to save 50
percent of their current utility costs. However, the cost of the retrofit and a long payback period
are hindrances to super-insulated construction. As higher energy efficiency products are supplied
at a lower cost, and as governmental policies encourage more energy efficient buildings, the
energy-retrofitted house will become more predominant on the market (Cooperman et al. 2011b).
2.2.4 Governmental Policies
Federal and state governments try to improve energy efficiency in the residential sector with
various programs, such as the Energy Star Homes program or the federal Building America
Program. In addition to such programs, there are separate tax credits for residential geothermal,
solar, and energy efficiency investments, to encourage homeowners to implement residential
retrofits and take advantage of these tax credits (Dernbach et al. 2011).
Homeowners – individual taxpayers – can receive a number of federal tax benefits by adopting
energy efficient measures and installing renewable energy equipment in their homes. The
purchase or installation of retrofit measures for building envelope or heating/cooling equipment
may meet the criteria for a tax credit, which is equivalent to 30 percent of the adequate
equipment cost; this is up to a 1,500 dollar tax credit per home. Home envelope technologies are
comprised of insulation or sealing, replacement of windows, skylights or external doors, and
qualifying window films or roofs (Dernbach et al. 2011).
Page 51
36
The role of government incentives in residential retrofits looks intricate. According to Palmer et
al. (2012), while some survey results illustrate government rebates, tax credits, or other
incentives help to mitigate the costs of some energy improvements, other survey analyses show
that there is no discernible relationship between government incentives and the extent to which
homeowners pursue energy improvements (Palmer et al. 2012). However, it is certain that as
federal and state policymakers look for low-cost ways to decrease energy consumption and
greenhouse gas emissions, their efforts to create policies that support greater energy efficiency in
buildings are increasing (Palmer et al. 2012).
2.2.5 Energy Retrofit Programs
The government has developed several programs to improve the energy efficiency of buildings.
This section explains some of these programs.
The first program is the Weatherization Assistance Program (WAP), which began in Maine. It
was created to assist homeowners and renters to air seal their homes, to reduce the burden of
costly home energy bills. Though the program was started to apply low cost ad hoc methods, it
progressed to more permanent solutions. In the 1990s, WAP started implementing energy audits
in homes in 37 states, and achieved better energy efficiencies as high as 80 percent per home
through improving management practices, audit tools and training methods (Samuel 2011, Berry
et al. 1997).
The second program is the Energy Star Program, which is a joint program of the U.S.
Environmental Protection Agency (EPA) and the U.S. Department of Energy (DOE). It aims to
Page 52
37
protect the environment by means of the development of energy efficient products and measures.
This program encourages homes to be 15 percent more energy efficient than ones built to code
(Jones et al. 2010). It began in 1992, with an effort to mark appliances as energy efficient, with a
particular focus on computers. Since then, the program has expanded to include other appliances;
in 2009, Energy Star had 60 product categories under its program. It is estimated that the Energy
Star Program saved up to 17 billion dollars in energy-related expenses in the U.S (Samuel 2011,
US EPA 2010).
The third program is the Building America Program, which is an industry-driven program,
sponsored by the U.S. Department of Energy. The Building America Program emphasizes the
importance of energy efficient retrofits for existing buildings. The main goals of the Building
America Program are to build up energy retrofit strategies for existing homes, which would lead
to considerable energy savings, and to guarantee the safety and quality of homes. Building
America plans to reduce energy consumption in existing homes by 20-30 percent by the year
2020 (Samuel 2011, US DOE BA 2010a).
The last program discussed here is the BetterBuildings Neighborhood program, which has a
marketing focus. This pioneering program encourages the U.S. DOE, state and local
governments, communities, private-sector companies, and non-profit organizations to collaborate
on the improvement of energy efficiency from the neighborhood to the nation. The
BetterBuildings Neighborhood program aims to improve energy efficiency in homes, businesses,
and communities throughout the country (California Center for Sustainable Energy [CCSE]
2012).
Page 53
38
2.3 INTRODUCTION OF ARTIFICIAL INTELLIGENCE (AI), EXPERT SYSTEMS
(ES), AND DECISION SUPPORT SYSTEMS (DSS)
The concepts of artificial intelligent, expert systems, and decision support systems are explored
in this section. In the decision support process for energy retrofits, the decision maker has to
consider several aspects, such as environment, energy, finances, and social influence in order to
make the best choices on design and operation. However, the components related to decision-
making have intricate connections to each other, and consequently, the decision maker encounter
a multi-objective optimization problem. Thus, a more advanced decision support system is
needed to assist building experts in the application of their expertise, and to help other, general
users to follow the same decision-making methods the experts follow (IEA 2008).
2.3.1 Definitions of Artificial Intelligence, Expert Systems, and Decision Support Systems
The field of Artificial Intelligence (AI) deals with intelligent computers, which seizes and
demonstrates similar behavior characteristics to those of human beings. AI is more of a concept
than a discipline; it includes various related technologies, such as expert systems, natural
language processing, voice recognition, robotics, and pattern recognition (Bidgoli 1993).
Expert systems (ES) are a part of applied AI, and were initiated by the AI community in the mid-
1960s. The basic concept of ES is to employee the expertise, the enormous task-specific
knowledge derived from humans, to a computer. Users can recall the stored expert knowledge
through the computer for specific advice in solving a problem. The computer can arrive at a
specific conclusion by means of inferences. It then provides advice or necessary logic in the
same way a human expert would (Liao 2005). The emphasis of ES is on relatively narrow
Page 54
39
problems, where the range of problems is limited and the nature of the problem is known
(Bidgoli 1993).
Decision Support Systems (DSS) can be defined as a computer-based information system
composed of hardware, software and the human elements intended to assist any user’s decision-
making, thus improving the process and outcome of decision-making (Arnott 2004). The
emphasis of this type of system is on semi-structured or unstructured tasks (Bidgoli 1993).
2.3.2 Comparison of Expert Systems and Decision Support Systems
Expert systems (ES) and decision support systems (DSS) are two growing areas in computer
appliances. Both of them support the decision making and problem solving of users, and their
primary goal is to improve the quality of the decision-making process (Doukidis 1988). However,
they differ in some aspects.
A DSS consists of a database, a model base, and dialog management, while an ES consists of a
knowledge base, an inference engine, and a user interface (Bidgoli 1993). A DSS is an
interactive, computer-based information system that employees decision rules and models,
combined with a comprehensive database. Compared to a DSS, an ES is a computer program
that utilizes a knowledge base containing expert knowledge for a specific problem. In addition, it
has a reasoning mechanism and uses inferences for selecting information from the knowledge
base. An ES also includes an explanation and justification mechanism, which provides the user
with some details of the reasoning process (Turban & Watkins 1986).
Page 55
40
While the problem area dealt with by a DSS is broad and complicated, an ES is constrained to a
more structured and narrow domain. Therefore, a DSS is appropriate for informal and unique
situations, and an ES is suitable for providing advice on recurring problems. Generally, an ES
can be qualified as a special class of DSS, with distinctive characteristics, and can help a DSS to
be more active and valuable in the decision process. For example, a DSS is often used to answer
the question “what if?” but a DSS combined with an ES can also answer the question “why?”
(Turban & Watkins 1986).
Duan and Burrel (1995) summarized some of the comparisons other researchers made between
an ES and a DSS: According to Ford (1985), the objective of a DSS is to support the user’s
decision-making process by providing access to data and models, while an ES gives the user a
significantly better and more correct conclusion or decision than could otherwise be attained.
Thus, a DSS enables the user to deal with a problem in a flexible and personal way when
operating the data and models, while ES has less flexibility. Turban and Watkins (1986) also
pointed out that the problem area of a DSS is broad and complex, while an ES deals with more
structured and narrow areas. Doukidis (1988) stated that a DSS implements flexible problem-
solving tools and data for the users to utilize in their own way, instead of the fixed problem-
solving process of an ES.
2.3.3 Components of an Expert System
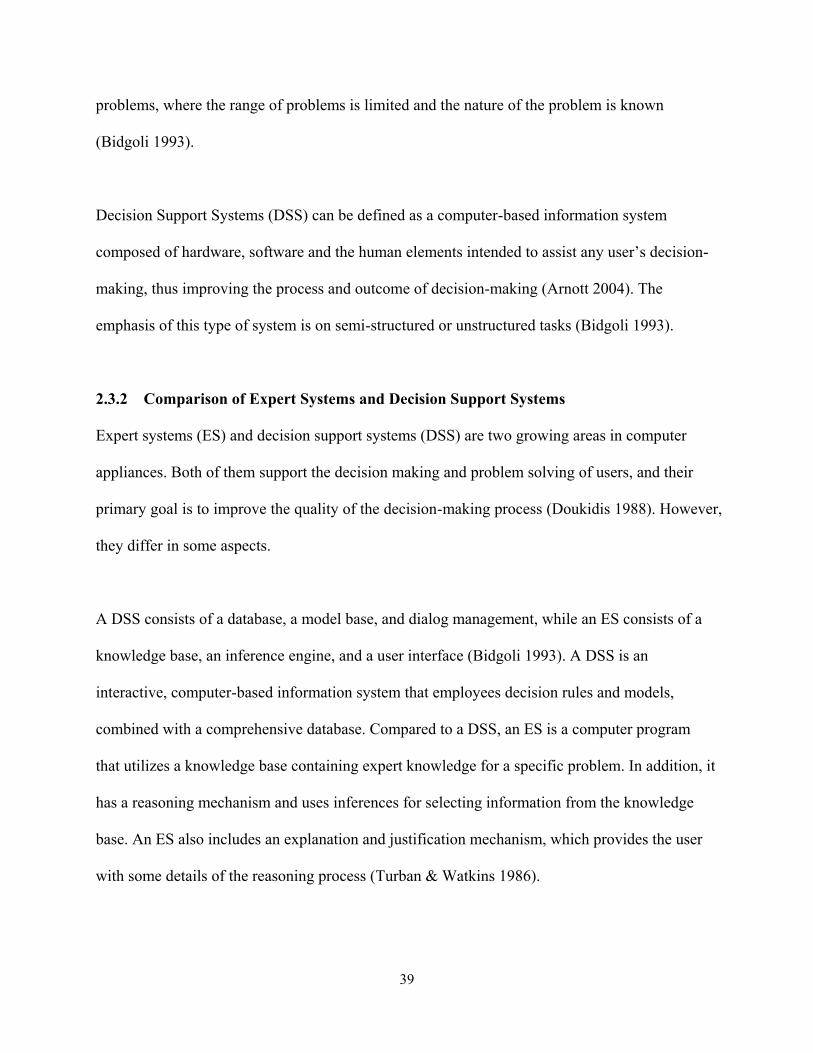
An ES application can be composed of the subsystems as follows (Syal 2012, Rolston 1989):
User Interface: The user interface provides the user with an accessible medium for
interaction with the system. It receives the information from the user and translates it to
Page 56
41
the system; it then provides the user with information from the system in a format that the
user can easily understand.
Knowledgebase: This stores the expertise in the form of heuristic, qualitative and factual
knowledge. The ability of an ES to be a reliable decision support tool depends on the
capacity of the knowledge accumulated in the knowledgebase.
Inference Engine: This is a software system that performs the reasoning process and
infers new decision-making options based on the stored expert knowledge. It utilizes 2
primary functions: backward chaining and forward chaining. Backward chaining is a top-
down reasoning process that begins with the desired goals and works backward to the
required condition. Forward chaining, on the other hand, is a bottom-up reasoning
process that starts with the known conditions and works to the desired goal. The
inference engine fortifies the ES, giving it the ability to infer new knowledge with which
it can respond to different situations.
Explanation Facility: An ES uses the explanation facility to explain the logic it used in
providing the output. It identifies the steps it utilized in the reasoning process, and
demonstrates them in a format that can be easily understood by the user. Compared to
traditional computer systems, the explanation facility makes the ES more reliable by
explaining the reasons for its decision-making.
Page 57
42
Figure 2.2: Components of an Expert System
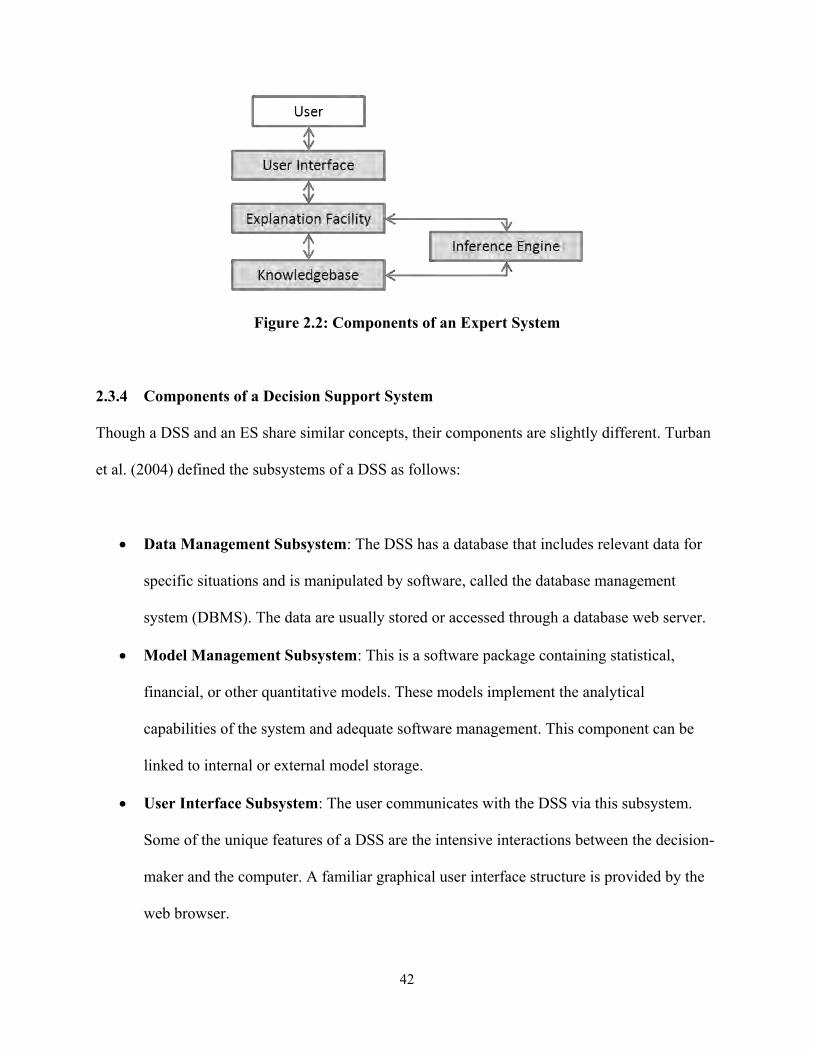
2.3.4 Components of a Decision Support System
Though a DSS and an ES share similar concepts, their components are slightly different. Turban
et al. (2004) defined the subsystems of a DSS as follows:
Data Management Subsystem: The DSS has a database that includes relevant data for
specific situations and is manipulated by software, called the database management
system (DBMS). The data are usually stored or accessed through a database web server.
Model Management Subsystem: This is a software package containing statistical,
financial, or other quantitative models. These models implement the analytical
capabilities of the system and adequate software management. This component can be
linked to internal or external model storage.
User Interface Subsystem: The user communicates with the DSS via this subsystem.
Some of the unique features of a DSS are the intensive interactions between the decision-
maker and the computer. A familiar graphical user interface structure is provided by the
web browser.
Page 58
43
Knowledge-based Management Subsystem: This can act as an independent subsystem,
or can support other systems. It can also be interconnected with the organization’s
knowledge repository inside a knowledge management system. Knowledge is usually
provided via a web server, where many artificial intelligence methods have been
executed.
Figure 2.3: Components of a Decision Support System
Among the components, the knowledge-based management system is optional for a DSS, but it
can provide advantages by providing support for the other three components with expert
knowledge (Turban et al. 2004).
2.3.5 Integration of Expert Systems and Decision Support Systems
Most existing ESs and DSSs are not integrated. While an ES provides an independent expert
consultation system, a DSS provides support devices to decision makers. However, when the two
systems are integrated, it can yield synergetic results in certain problem domains. While typical
DSSs are suited for quantitative, mathematical, and computational reasoning, a DSS should also
Page 59
44
be implemented to support qualitative analysis based on analogical reasoning, pattern recognition,
content analysis, and so forth. ESs are also appropriate for these types of methodologies, and
thus can help the DSS be more interactive and more valuable in the support of a variety of
decision processes (Turban & Watkins 1986).
As explained in section 2.3.4, the Data Management Subsystem, Model Management Subsystem
and User Interface Subsystem are the fundamental components of a DSS. The optional
component, the Knowledge-based Management Subsystem, plays a role as an ES, supporting the
qualitative analysis with a reasoning process. In this research, both quantitative and qualitative
information will be used for residential energy retrofits, and a DSS combined with an ES will be
the foundation of the intelligent DSS, which will be implemented in the later steps.
2.3.6 Use of a Database in Expert Systems
Expert Systems or Decision Support Systems are sometimes combined with a database to
improve the functions of both the database and the ESs or DSSs. Turban and Watkins (1986)
advocate the idea of integrating an ES into the database and database management systems
(DBMS) to enhance the maintenance and operation of the database and DBMS by adding
reasoning ability to the DBMS operation. Through this integration, the user can know both the
contents of the stored facts and the meaning of the facts, enabled by the rule-based capabilities of
expert systems (Bidgoli 1993).
A DBMS usually provides some fundamental capabilities, such as the summarization or
categorization of data. However, users often expect more high-level capabilities. The
Page 60
45
sophisticated semantic knowledge and inferential capabilities that would come with integrating
an ES could make a DBMS more efficient and user-friendly (Turban & Watkins 1986).
In the early 1990s, many MIS practitioners implemented DSSs using relational database
technologies, such as Oracle or DB2. A DSS is usually used to help make managerial decisions,
and analyzes many units of data in a heuristic way. During this period, the leading technology
transferred information to a client/server-based DSS from a mainframe-based DSS; some online
analytical processing (OLAP) applications also emerged (Power 2003).
2.3.7 Use of Simulation in Expert Systems
In addition to the integration of expert systems and DBMSs, simulation applications can also be
combined with ES. The purpose of incorporating expert systems with simulations is to integrate
the different functions in a modular way, as well as to validate a simulation model using expert
systems (Waikar et al. 1993).
Both simulation and AI, including ES and DSS, deal with complex real-world systems. They
have similar modular representations of knowledge and inference procedures. In addition, AI and
simulation both identify and encode diverse structural and functional factors for running a
system. In this context, expert system research has encouraged the combination of AI and
simulation (Waikar et al. 1993).
For example, combining an expert system with building simulation for an assessment of HVAC
systems makes a holistic approach available. Building simulation provides a useful tool for
Page 61
46
assessing a design and overall building performance; it also helps an ES to analyze and infer the
thermodynamic behavior of HVAC systems (Avgelis & Papadopoulos 2010).
In this research, several existing building energy efficiency simulation applications are
considered, such as Building Energy Optimization (BEopt), Model Maker, eQuest, and
REM/Rate. Among these applications, BEopt and Model Maker were developed by the National
Renewable Energy Laboratory (NREL). While BEopt runs as a stand-alone application, Model
Maker runs as a web-based application, and provides a more simplified energy simulation than
BEopt. Through several tests and trials, BEopt was selected as the simulation software for this
research.
2.4 EXPERT SYSTEMS AND DECISION SUPPORT SYSTEMS IN CONSTRUCTION
AND ENERGY RETROFIT
Energy conservation is a key concept in sustainable buildings, but it is difficult to keep the
balance between energy savings and the occupants’ comfort. Therefore, advanced AI techniques
are being implemented in this area, aimed at meeting the requirements of energy efficiency and
the building users’ amenities (Dounis 2010).
2.4.1 Expert Systems and Decision Support Systems in Construction Management
According to Turban et al (2004), the key characteristics and capabilities of an ES and a DSS can
be summarized as follows:
Semi-structured and unstructured problems
Support managers at all levels
Page 62
47
Support individuals and groups
Interdependent or sequential decisions
Support intelligence, design, choice, implementation
Support variety of decision processes and styles
Adaptable and flexible
Interactive ease of use
Effectiveness, not efficiency
Humans control the machine
Ease of development by end users
Modeling and analysis
Data access
Standalone integration and web-based
These characteristics are also suitable for the construction management field. Several researchers
have suggested potential applications of expert systems in construction management (CM),
particularly in the sub-fields of estimating, construction planning, site planning and construction
financing (see Al-Tabtabai et al 1997, Baldwin & Oteifa 1993, Son 2005, and Warszawski 1985).
In addition, Kaklauskas et al (2007) looked at the construction quality assessment system, for
which an expert system has been implemented.
1) Estimating
Expert systems can be cost-effectively applied in this area. The knowledge base of an estimating
system should include the various types of projects in the form of trees of semantic networks
Page 63
48
with a hierarchical composition of elements. Labor, materials and equipment per work unit are
the inputs of production factors, and allocation of project overhead, the nature of the project, its
size, and other significant parameters build the rules. The context would contain all the relevant
information about the project to be priced. The inference procedure would include the sequential
identification of the various physical project components, matching them with proper
components in the knowledge base (Al-Tabtabai et al 1997, Warszawski 1985).
2) Construction Planning
Construction planning is the most complicated activity. It includes scheduling, resource
allocation and the budgeting of a project. The knowledge base would contain a representation of
different project types for the user’s construction activity, such as residential, commercial, or
industrial buildings. It would be provided as a frame system or a semantic network, including its
construction technologies and work composition. The context information would include general
project descriptions, quantities of the components, and some constraints for construction. It
would also contain information about the company’s own resources, their allocation status, and
so forth. The inference procedure would apply the project data to the existing representations in
order to match the proper case (Baldwin & Oteifa 1993, Warszawski 1985).
3) Site Planning
In this area, the ES aims to decide the location of equipment, materials and support facilities at
the construction site. The knowledge base would include the pertinent specifications for the main
construction equipment and the constraints on their location as well as a certain optimization
Page 64
49
algorithms. The context would have information about the specific site to be planned, and a list
of the equipment and facilities for the project (Son 2005, Warszawski 1985).
4) Construction Financing
The purpose of a construction financing ES is to design and control cash flow in a construction
company. The knowledge base would include a project representation similar to a construction
planning representation, and the context would include the resources and cash flow information
about the particular project. The inference procedure would be initiated by generating the
preliminary cash flow using standard assumptions, and then modified according to the rules in
the knowledge base and the constraints in the context (Warszawski 1985).
5) Construction Quality Assessment
Kaklauskas et al. (2007) explained an example of a hybrid decision support system in the
construction area. The system supports the quality assessment of construction projects. It
automates the assessment process by using digital images of the project area, analyzing the
images to detect defects in the measures. In this process, the DSS incorporates advanced
technologies such as digital cameras, optical scanners, gyroscopic technology, machine learning,
pattern recognition, and image processing. The hybrid decision support system for construction
quality assessment can provide a reliable result and reduce the time needed for analyzing the
collected data (Kaklauskas et al. 2007).
Page 65
50
In addition to these, ESs and DSSs can be used in other construction management areas, such as
production scheduling in a plant to prefabricate concrete building components (Dawood and
Marasini 2001).
2.4.2 Decision Support System in Energy Retrofit
Juan et al. (2009) suggested a decision support system for the energy retrofit of buildings. The
development procedure of such a DSS includes three steps (Juan et al. 2009):
Evaluate the online mechanism for condition evaluation, including the physical and
functional states of residential buildings.
Implement an optimization algorithm model with two facets: quality priority and budget
priority, in order to understand the satisfactory retrofit strategies.
Demonstrate the interface of the decision support information to users who plan to
improve the energy efficiency of their homes.
In this DSS, two main decision models will be implemented according to the user’s priority.
1) Budget-based Restriction (Budget Priority)
Homeowners usually have a pre-determined retrofit budget. However, it is difficult for them to
successfully perform the retrofit work to meet optimum quality standards without sufficient
knowledge and experience. This budget prioritization system can provide these results in an
intelligent way, by presenting the optimal quality of retrofit actions that are within the user’s
fixed budget.
Page 66
51
2) Quality-based Restriction (Quality Priority)
Homeowners may also have an expectation regarding retrofit quality. Housing retrofits can be
considered in two ways. One is to recover current function or performance, and the other is to
increase or renovate the function or performance.
In this example, the DSS consists of an interface module, an analysis module, and a database
module. The interface module provides expert knowledge in a user-friendly way, to improve the
quality of communication among the users, the retrofit designers and contractors. The operating
analysis module helps make the complicated operation process more efficient and effective. The
dynamic database module provides updates on cost data and on new retrofit action skills
available in a market (Juan et al. 2009).
2.4.3 Expert Systems in Energy Retrofit
A number of Building Energy Management Systems (BEMS) have been implemented with the
recent evolution in information technology. The purpose of the BEMS is to minimize energy
consumption and maintain the amenities for the occupants of a building. The decision-making
process in an effective energy management system is supported by adequate tools and
methodologies. Doukas et al. (2009) proposed an energy retrofit model with the following units:
Proposals Database: This database contains a set of possible retrofit measures,
specifically for building operations, installation and maintenance costs, and energy saving
costs attained by the application of measures. The data are based on the results of a
survey conducted in Greece, related to the implementation of energy efficiency for
existing homes, and the cost data are adjusted to reflect today’s prices.
Page 67
52
Decision Support Unit: This is the core of the model and provides the sequence of the
evaluation processes for the retrofits. The unit’s evaluation is implemented by experience
data and external parameters. Experience data give intelligent characteristics to the
decision support unit, and the external parameters cover new equipment costs, taxes,
interest rates, fuel costs, and so forth.
Experience Database: This contains the BEMS data, relevant external parameters, and
experience database. The decision support unit can extract the building information
needed for the decision process from the experience database.
Proposal List: This includes the final list of proposals for the building, combined with
their pertinent data.
This model incorporates experience, the BEMS-associated data, and external factors such as
climate conditions, investment rates, and fuel costs. It also shows the potential for introducing
new retrofit actions and new energy-efficient standards (Doukas et al. 2009).
2.4.4 Integrated Expert System for Buildings
The refurbishment of buildings mainly uses neural networks, genetic algorithms, fuzzy systems,
knowledge-based systems, and decision support systems. Decision support systems play a
significant role in this area, and various DSSs have been developed, such as the Energy
Performance Indoor Environmental Quality Retrofit (EPIQR) and the Tool for selecting Office
Building Upgrading Solutions (TOBUS). EPIQR is a decision support application that includes
financial, technical, energy and comfort analysis. It has been developed to help surveyors,
architects, or building owners select the most appropriate refurbishment actions in order to
Page 68
53
renovate the physical and functional state of a building, to increase the indoor air quality and
reduce energy consumption (Zavadskas et al. 2006).
Zavadskas et al. (2006) developed a Building’s Refurbishment Knowledge and Device Based
Decision Support System (BR-KDDSS), which is composed of a database, a database
management system, a model-base, a model-base management system and a user interface. The
BR-KDSS provides users with the general physical and functional information of the building,
the physical state of the building envelope, a calculation of the quantity of refurbishment work to
be implemented, the adjusted energy consumption of the building, required measures for
improving the indoor air quality, an analysis of the refurbishment scenario, and so forth.
(Zavadskas et al. 2006).
The database of BR-KDDSS includes the following tables (Zavadskas et al. 2006):
Initial Data Tables: These include general facts, and information on the deterioration
and obsolescence of the building. They also contain the purpose and significance of the
refurbishment, and cost information.
Refurbishment Solutions Tables: These provide knowledge about substitute building
refurbishment solutions pertaining to building enclosures, utilities and space planning,
and so forth.
Multi-variant Design Tables: These contain knowledge about the interrelationship of
measures to be improved, possible combinations and compatibility of the measures, and
complicated multi-variant design data about the refurbishment.
Page 69
54
The BR-KDDSS also consists of four main categories for the decision-making rules and
procedures (Zavadskas et al. 2006):
Alternatives for the Elements of a Renovated Building: These rules suggest possible
improvements to the retrofit measures.
Criteria Describing the Generated Alternatives: These rules include the system criteria
for retrofit measure improvement, and provide the values and importance of each
criterion.
Development of Suggestions: The rules in the BR-KDDSS suggest suppliers to use, and
further negotiations to be performed. The main goal of this rule set is to find the most
suitable suppliers based on the user’s budget, the cost of measures, the priority, utility
bills, market value of the building elements, and the reputation of the suppliers.
Composition of Comprehensive Negotiation: The system composes a negotiation email
for each chosen supplier based on previous BR-KDDSS data, the rule sets and procedures.
It includes information about price negotiations for measures, and a reference to the
system calculations.
In addition, Zavadskas et al. (2006) suggested two more improvements to the knowledge
subsystem. One is the improvement provided by construction innovation knowledge, which is
derived during the life cycle of a construction project. The other is the improvement supported
by communicating with construction experts to acquire their knowledge. Through these efforts,
users can obtain a more satisfactory result from the refurbishment (Zavadskas et al. 2006).
Page 70
55
2.4.5 Assessment and Improvement of Energy Analysis
This research aims to implement an intelligent Decision Support System incorporated with a cost
database and with energy simulation software. Polly et al. (2011) explained the National
Renewable Energy Laboratory’s (NREL) methodology to access and improve the accuracy of the
energy analysis for residential buildings. This will be the basis of the system development in this
research. Among several ongoing efforts by the NREL to improve energy analysis accuracy,
there are some topics relevant to this research (Polly et al. 2011):
National Residential Efficiency Measures (NREM) Database: The NREM database
was developed in 2009, to produce standard technical definitions for energy retrofit
measures. Thus, software analysts and developers trying to make energy retrofit-related
systems can access the database in order to utilize consistent input information. The
database is open to the public via a web interface and XML (extensible markup language)
feeds. It will be updated regularly to improve the measure definitions.
Building America House Simulation Protocols: The NREL continues to sustain and
upgrade the Building America House Simulation Protocols, which were developed in
2010. These improvements will be documented and other organizations can adopt the
published updates.
BEopt Diagnostic Test Suite: BEopt is a building energy optimization tool, developed
by the NREL to expedite the prompt comparison of research-level building simulation
engines. Since BEopt is intended to assess alternative energy efficiency options and
retrofit measures in new construction and existing buildings, comprehensive building
characteristics, including site conditions and the behavior of occupants, can be simulated
in an automatic and systematic way.
Page 71
56
Estimating Uncertainty in Energy Analysis Predictions: When a system is developed,
some degree of uncertainty exists in exactly how the input value matches the real “true”
value, whether an input is defaulted, estimated, or measured. These input errors lead to
output errors through a building energy simulation program, making some inaccuracies in
software predictions possible. A number of ongoing research studies are related to the
minimization of these errors.
These topics will suggest the direction of the integration model in this research. More detailed
explanations will be provided in subsequent chapters.
2.5 CHAPTER SUMMARY
In this chapter, a number of articles and books were reviewed, in order to configure the logical
and theoretical support for this research. First, the background and current state of decision-
making in energy retrofits were examined. Then, AI, ES, and DSS were introduced, and
applications in the construction and energy retrofit fields were examined. Furthermore, the
components and structures of some existing DSSs and ESs were scrutinized as reference
examples for the integration model in this research.
Page 72
57
CHAPTER 3
FRAMEWORK FOR IMPLEMENTING INTEGRATION
3.1 OVERVIEW
According to the Partnership for Advancing Technology in Housing (PATH 2002), one of the
barriers to the extensive implementation of energy efficient measures in existing homes is the
absence of a standard protocol that prescribes the professional method for residential energy
efficiency. To overcome this barrier, a standard protocol was developed by conducting
interviews with construction-industry professionals. The Energy Retrofit Decision Process
Framework for a query-based intelligent decision support system was configured by the Task 6.3
research team, based on this protocol (Samuel 2011).
The main purpose of this research is to integrate the quantitative data sources into a query-based
intelligent decision support system. The framework forms the foundation for the integration
model development. The framework and its example will be analyzed in this chapter, before
proceeding to the system development. Then, the use of expert knowledge in energy retrofit will
be explained, and the software for dealing with such expert knowledge will be examined for the
next step of system development.
3.2 THE ENERGY RETROFIT DECISION PROCESS FRAMEWORK
The Energy Retrofit Decision Process Framework defines the steps for implementing the
standard protocol for a residential energy retrofit. In addition, it classifies the data sources for the
framework into qualitative data and quantitative data. In this research, the integration model will
Page 73
58
be developed following the basic process of the framework, with a focus on the integration of
quantitative data sources, such as the NREM database, BEopt and other published information in
the form of images, text files and web links. The framework consists of three main steps: identify
retrofit measures, shortlist and prioritize measures, and provide expert advice on installation.
Each function will be explained in the following sections, with an additional description of
quantitative data integration.
Figure 3.1: Energy Retrofit Decision Process Framework (Source: Samuel 2011)
3.2.1 Identifying Retrofit Measures
The retrofit measures are identified in the query-based intelligent Decision Support System
through a query process in which the users provide information about the current measure
conditions of their homes. This framework takes a dual approach, analyzing both homeowner
Page 74
59
needs and home upgrade needs, and considering upgrade possibilities for the existing
inefficiencies.
In this framework, retrofit measures are classified by the measure types of the NREM database:
major appliances, domestic hot water, enclosure, heating ventilation and air conditioning (HVAC)
equipment, lighting and miscellaneous. If a measure component is identified as being older than
its useful life, or if the system is inefficient, it is considered as needing to be upgraded to existing
energy standards, such as Energy Star, or the Building America Benchmark (Samuel 2011).
3.2.2 Shortlisting and Prioritizing Measures
Once the measures have been identified, they are shortlisted to fit the homeowner’s budget and
are prioritized based on cost effectiveness, to help the owners obtain the maximum return on
investment from the retrofit, following the order explained below (Samuel 2011).
First, an energy simulation tool is used to determine the energy savings, which will help the
system to prioritize measures based on the user’s budget and the cost effectiveness of the
measures. Second, the system gives top priority to homeowner needs when shortlisting and
prioritizing measures. Thus, the user’s immediate need has the highest priority, even if it is less
cost effective than another. Third, the system considers interactions between components of the
home. In order to analyze the energy-related interactions, Samuel (2011) divided the measures
into three types: thermal envelope and lighting measures, heating and cooling measures, and
stand-alone measures. Major energy-related interactions occur in thermal envelope and lighting
measures, and in heating and cooling measures. Stand-alone measures, such as non-HVAC
Page 75
60
appliances, have either limited or no interactions with other components in terms of energy
performance. The final step of the framework deals with health and safety-related information,
and suggests strategies to help alleviate these issues (Samuel 2011).
3.2.3 Providing Expert Advice on Installation
The framework defines the final function of the process as providing information related to
measure installation. Through expert interviews, this installation information has been
categorized as follows: installation techniques, level of installation difficulty, installer skill level,
installer safety, material selection and procurement, and other factors. The main sources of
installation information are expert knowledge, published information and existing Building
America resources; they will be provided in the form of images, text files and web links (Samuel
2010).
3.2.4 Integrating the Quantitative Data Sources
In this framework, quantitative data play a significant role in prioritizing measures by providing
cost information. BEopt provides annual energy savings that result from the retrofit measure
simulation, and the NREM database delivers retrofit implementation costs from the current
before-component to the energy efficient after-component. The cost information collected from
these external data sources is utilized in a calculation to derive the cost effectiveness. In this
research, the integration model focuses on this quantitative data integration feature. However, it
also follows the general steps of the framework, as explained in the preceding sections.
Page 76
61
3.2.5 Using Expert Knowledge
The expert interviews were conducted by the Task 6.3 research team in order to elicit expert
knowledge about residential energy retrofits. The knowledge extracted from the expert
interviews is summarized as follows (Samuel 2011):
Measure Selection
- Decisions must be made within the user’s budget, with cost-effective prioritization.
- Measures must be analyzed using computer energy modeling.
- Interactions between building components must be considered.
- User motivation for retrofits must be addressed.
- The user must be provided with post-occupancy health and safety information.
Construction/Installation Knowledge Categories
- Techniques
- Installer skill
- Installer safety
- Material selection and procurement
- Other factors
The expert knowledge is used to form a decision tree, which is a group of decision-making rules.
The main logic is then derived from the rules in order to improve the energy efficiency of the
existing homes.
Page 77
62
Figure 3.2: Developing ES Logic Using Expert Knowledge
3.2.6 Modified Framework for the Integration of Quantitative Data Sources
The Energy Retrofit Decision Process Framework originally contained the entire Decision
Support System process and data sources, including qualitative data. However, the framework is
analyzed here in a simplified manner, with a focus on the integration of quantitative data sources
and the working process. Figure 3.3 illustrates the modified framework.
Figure 3.3: Modified Framework Focused on Quantitative Data
Page 78
63
3.3 ANALYSIS OF THE FRAMEWORK WITH AWORKING EXAMPLE
The integration model was developed based on the framework. To demonstrate the
comprehensive integration of quantitative data sources with the overall process, the integration
working example follows the main procedure and measure settings of the framework example
developed by the Task 6.3 research team (Samuel 2011). The original framework example is
analyzed below; however, it has been slightly modified to make it more appropriate for the
software applications which are being used for the integration model. The BEopt example has
been newly simulated with modified measure information, using a more recent software version.
3.3.1 Overview of the Framework Working Example
The example hypothesized a 100-year-old home, measuring 2,200 square feet of finished area
with three bedrooms and two bathrooms (see Figure 3.4). The user’s budget is set at 8,000
dollars.
Figure 3.4: BEopt Modeling of the Working Example
Page 79
64
(For interpretation of the references to color in this and all other figures,
the reader is referred to the electronic version of this thesis.)
In this research, the integration working example assumes that six retrofit measures were
selected beforehand, through queries related to the current energy efficiency of the existing home.
The measures were categorized by the three types explained in Section 3.2.2, and it is assumed
that the user needs to replace the dishwasher immediately. The six measures and their
improvements are described as follows:
Stand-Alone Measures
- Replace the current dishwasher to a new Energy Star-rated dishwasher.
Thermal Envelope and Lighting Measures
- Insulate attic to R-60 fiberglass.
- Insulate crawlspace wall to R-15 continuous.
- Upgrade existing windows from single-pane to triple-pane.
- Upgrade existing lighting from 20% CFL to 100% CFL.
Heating and Cooling Measures
- Upgrade existing gas furnace from 78% AFUE to 92% AFUE.
3.3.2 BEopt Energy Simulation for the Selected Measures
BEopt energy simulation software version 1.1 was used to derive the annual energy savings for
the selected measures as shown in Figure 3.5. Ten cases were run for this example:
Case 1 – Un-retrofitted: This represents the current measure states of the existing home.
It plays the role of a reference point for comparison with the other cases.
Page 80
65
Case 2 – Dishwasher: This case is modeled to examine the improvement in annual
energy savings when only the dishwasher is applied. In this case, the BEopt input option
of a dishwasher is adjusted to a more energy efficient one, while the rest of the options
stay same as Case 1.
Case 3 – Attic & Ceiling: This examines the improvement when only attic and ceiling
insulation are applied.
Case 4 – Crawlspace Walls: This examines the improvement when only the crawlspace
wall insulation is applied.
Case 5 – Windows: This examines the improvement when only the windows are
upgraded.
Case 6 – Lighting: This examines the improvement when only the lighting is upgraded.
Case 7 – Furnace: This examines the improvement when only the furnace is upgraded.
Case 8 – Without Furnace: This case is modeled to derive the total heating cost of the
un-retrofitted home. It removes the heating load by adjusting the furnace input option to
“None” while the rest of the input options are identical to Case 1.
Case 9 – Retrofit + Furnace: This case is modeled to examine the improvement when
all six measures are applied, including the furnace.
Case 10 – Retrofit – Furnace: This case is modeled to derive the total heating cost of
the fully retrofitted home. It removes the heating load by adjusting the furnace input
option to “None” while the rest of the input options are identical to Case 9.
Page 81
66
Figure 3.5: Annualized Utility Bills Graph from BEopt (Total Costs)
As explained in Case 8 and Case 10, heating costs are derived separately from other measures, in
order to assess the influences of the furnace. The calculation is suggested as follows (Samuel
2011):
The total heating cost of the un-retrofitted home is derived:
UH = UF – UWH = (Cost of Case 1) – (Cost of Case 8)
Where
UH = Total energy consumption for heating the un-retrofitted home
UF = Total energy consumption of the un-retrofitted home with heating load (Case 1)
UWH = Total energy consumption of un-retrofitted home without heating load (Case 8)
Page 82
67
The total heating cost of the fully retrofitted home is similarly calculated:
RH = RF – RWH = (Cost of Case 9) – (Cost of Case 10)
Where
RH = Total energy consumption for heating the retrofitted home
RF = Total energy consumption for the retrofitted home with heating load (Case 9)
RWH = Total energy consumption of the retrofitted home without heating load (Case 10)
The framework investigates the inter-relationship between thermal envelope and lighting
measures, and heating and cooling measures. These heating costs are used to examine the
reciprocal actions, and to consider a reduction in the size of the furnace, as a result of improved
energy efficiency, when the other retrofit measures are applied (Samuel 2011).
3.3.3 Cost Information Sources
The main quantitative data sources for this framework are the National Residential Efficiency
Measures (NREM) database and Building Energy Optimization (BEopt). In addition to these, the
framework also employees the Database of State Incentives for Renewables and Efficiency
(DSIRE) in order to use cost information related to annual loan payments and the financial
incentives available from the government for the installation of energy efficient measures.
DSIRE is a continuing project of the North Carolina Solar Center and the Interstate Renewable
Energy Council (IREC), which is funded by the U.S. Department of Energy’s Office of Energy
Efficiency and Renewable Energy (EERE), mainly through the Office of Planning, Budget and
Analysis (PBA). The site is managed by the National Renewable Energy Laboratory (NREL).
Page 83
68
The database includes information about renewables, energy efficient technologies and measures
for both Federal and State resources (DSIRE 2011, Samuel 2011).
3.3.4 Basic Cost Formula for the Prioritization of Measures
After collecting the cost information from external sources, the cost effectiveness is calculated
by means of Effective Cost and Effective Return. These two values are derived from the cost
information gathered from the NREM database, BEopt and DSIRE. Figure 3.6 illustrates the
overall calculation.
Figure 3.6: Cost Information for Prioritizing Measures (Modified From: Samuel 2011)
According to the framework working example developed by the Task 6.3 research team (Samuel
2011), each column represents the cost information as follows:
Column A: Specifies the name of measure to be improved.
Column B: Represents the existing efficiency of the measure, which is equivalent to the
before-component in the NREM database.
Page 84
69
Column C: Represents the upgraded efficiency of the measure, which is equivalent to the
after-component in the NREM database.
Column D: Represents the cost to implement the improvement of the measure from the
existing efficiency (Column A) to the upgraded efficiency (Column B), which is
calculated by multiplying the measure quantity with the average unit cost from the
NREM database.
Column E: Represents the incentive amount, which is derived from DSIRE.
Column F: Represents Effective Cost, which is the cost information directly used for
prioritizing retrofit measures. The other cost information in this table is collected in order
to derive Effective Cost and Effective Return in Column I.
Effective Cost
= NREM Cost – Incentive Amount = Column D – Column E
Column G: Represents the annual loan payment, which is derived from DSIRE. In the
working example, Samuel (2011) assumed an annual loan payment for a term of ten years,
with a fixed annual percentage rate (APR) of 7 percent.
Column H: Represents the annualized energy savings derived from the BEopt energy
simulation.
Column I: Represents Effective Return, which is directly used for prioritizing retrofit
measures with Effective Cost in Column F.
Effective Return
= BEopt Annual Energy Savings – Annual Loan Payment = Column H – Column G
Column J: Represents Simple Payback, which means the number of years to pay back
the investment cost for the retrofitting measures. Retrofit measures whose Simple
Page 85
70
Payback years are greater than the number of years the user intends to live at the home
are rejected on the prioritized list, except for the user’s immediate needs, and the furnace
performance requirements need to be re-assessed to reflect the improved efficiency
achieved with the other updates.
Simple Payback
= Effective Cost / BEopt Annual Energy Savings = Column F / Column H
Based on this cost information, the retrofit measures are prioritized and the remaining budgets
are calculated as follows (Samuel 2011):
Prioritizing Process
1) Pick the immediate user need.
2) Pick the highest Effective Return.
3) Pick the next highest Effective Return.
4) Iterate this process until the user’s budget becomes zero.
Remaining Budget
= The initial user’s budget – Effective Cost (of Highest Effective Return)
– Effective Cost (of Next Highest Effective Return)
– Effective Cost (of Next Highest Effective Return)
… (Iterate this process until the user’s budget becomes zero)
These prioritized measures and the remaining budget are provided to the users at the end of the
process in order to help their energy efficiency implementation.
Page 86
71
The precedent theoretical working example explained in this section will be converted into a
computerized integration model working example; in this process, expert system shell software
is required.
3.4 EXSYS CORVID: EXPERT SYSTEM SHELL SOFTWARE
Expert systems are computer programs that mimic the interaction between a person and a human
expert for advice or a recommendation about the user’s work (Exsys 2011). Expert system shell
software is a software application for implementing an expert system, and Exsys Corvid has been
chosen for use in this research among several expert system shell software programs available in
the market. This software is the core of this query-based intelligent Decision Support System. It,
therefore, needs to be explored before designing the integration model.
3.4.1 Decision-Making Logic
Exsys Corvid suggests three main roles for expert system development (Exsys 2011):
Fully capturing the decision-making logic and process of the domain expert.
Wrapping the system in a user interface with the desired look and feel for online
deployment.
Integrating with other IT sources.
The first function is the core of the expert system development, which will be explained later in
this section. The second function is related to how to deliver the expert knowledge to the users,
which is associated with the design and organization of the questions and the results screen. The
last function is significant in this research, since it enables the integration of external quantitative
Page 87
72
data sources and additional information, such as images, text files and web links, into the
Decision Support System.
The main purpose of an expert system is to provide expert knowledge to the users. Therefore,
capturing the logic and processes of the expert’s knowledge is indispensable to developing a
system that can provide advice compatible with that of an expert. The key to capturing expert
knowledge is to illustrate the system logic that follows the way the expert thinks about it. It
consists of the procedure for identifying the decision steps of an individual expert, and
converting that into a form that a computer can use, but which people find easily readable and
understandable (Exsys 2011).
The expert system uses IF/THEN rules to describe the decision-making process. A rule consists
of one or more IF conditions, and one or more THEN conditions. The IF conditions evaluate to
“true” or “false,” which can be built with algebraic expressions, special system functions, or a
simple test to verify when a particular value is selected. The THEN statements allocate a value to
a variable, by setting a specific value, adding content to a report, or modifying a confidence
value for a specific condition. Each rule is a part of the whole decision-making logic; the
inference engine manages to use the rules effectively to solve a particular problem (Exsys 2011).
3.4.2 Variables
The first step to implementing decision-making logic is to deconstruct a problem into logical
pieces, which are equivalent to Corvid variables. These variables are then used to configure rules
and describe logic in the expert system. When the system is run, the values of variables are
Page 88
73
assigned by asking the users to provide values directly, deriving values from other rules, or using
external sources such as another application or database. Exsys Corvid has seven variable types. A
variable setting begins by deciding on a specific type, according to the purpose or attribute of the
variable. Exsys Corvid explains the variable types as follows (Exsys 2011):
Static List Variables: These are simple multiple choice lists with possible values. The user
chooses one or more values for a particular situation from the list, which is fixed during the
system development. Static List is one of the most common variable types in Corvid. For
example, a Static List Variable [_User_Need] can have “Dishwasher,” “Attic Insulation,”
“Crawlspace Insulation,” “Windows,” “Lighting,” and “Furnace.” The user can choose one
of them as the answer.
Figure 3.7: Static List Variables
Page 89
74
Dynamic List Variables: These variables are similar to Static List Variables in that they
are multiple choice lists. However, unlike Static List Variables, Dynamic List Variables are
not fixed during system development, but change dynamically at runtime. For example,
[_After_Comp_List1] provides the possible measure improvement list for a selected
current measure. The list varies dynamically based on the current measure selected during
the system’s runtime.
Figure 3.8: Dynamic List Variables
Numeric Variables: Numeric Variables, String Variables and Date Variables are all
Continuous Variables. Numeric Variables can have a range of numeric values, which are
used for algebraic expressions or calculation.
Page 90
75
String Variables: These are used for general literal values. Although numeric values can
be assigned to the String Variable type, they cannot be utilized for mathematical
calculation.
Date Variables: These are used to express date values.
Figure 3.9: Numeric Variables
Page 91
76
Figure 3.10: String Variables
Collection Variables: The value of Collection Variables is a list of strings. Collection
Variables are never directly asked of the users; they are only assigned at runtime. System
content such as other variable values, additional text information, images or web links can
be added to the Collection Value List either in a sorted or unsorted manner. This collected
information builds a report that can be provided on the result screen.
Page 92
77
Figure 3.11: Collection Variables
Confidence Variables: The value of Confidence Variables is a numeric “Confidence
Value,” which indicates the level to which a user’s input is appropriate or inappropriate for
a specific situation. The Confidence Value can be used as a form of “score” for a selected
answer. In this way, the Confidence Variable can provide the best recommendation among
the answers by comparing their scores. This variable type can also be used for the
cumulative calculation. For example, Confidence Variable type is utilized to derive the
cumulative remaining budget in the integration model.
Page 93
78
Figure 3.12: Confidence Variables
In this research, the integration model uses all of the types of variables except for Date Variables.
In particular, Dynamic Variables, Collection Variables, and Confidence Variables play significant
roles in developing complicated system logic.
3.4.3 Logic Block
The rules for the expert system are developed in Logic Blocks. The rules are organized in a tree
structure with groups of relevant rules, which cover all of the related situations for a problem.
The system logic describes the decision-making process. It is defined by several IF/THEN rules.
Logic Blocks do not have any specific form. They enable several different ways of building the
Page 94
79
logic for a system. Logic Blocks can also handle more advanced functions, such as backward
chaining or Meta Blocks, in order to implement more complicated logic (Exsys 2011).
3.4.4 Command Block
Command Blocks control the ways of operating a system, the actions to take, and the system’s
performance running order. While Logic Block rules determine how to do things, Command
Blocks regulate what to do in the system. By separating the procedural control from the rule logic,
it is much easier to build, maintain and update systems. Command Blocks usually consist of three
sections (Exsys 2011):
Starting Commands: These commands provide the title and a brief explanation of the
system to the users. They are related to implementing a user-interface, not to implementing
decision-making logic.
Logic Commands: These are the main parts of the Command Block; they tell the system
what to do with the rules in the Logic Blocks. They are composed of variable Corvid
commands used to run the rules.
Result Commands: These are commands for displaying the result to the users. They
decide which information will be delivered on the result screen; additional images, text
files, and web links can be also provided.
Figure 3.13 demonstrates the basic structure of Exsys Corvid. This will be explained in detail in
Chapter 5, with the development of the integration model working example.
Page 95
80
Figure 3.13: Basic Structure of Exsys Corvid
3.5 CHAPTER SUMMARY
In this chapter, the Energy Retrofit Decision Process Framework and its working example were
analyzed. In addition, the expert system shell software, Exsys Corvid was explained.
Since the integration of quantitative data sources must be understood in the overall context, the
framework was examined before proceeding to the integration model development. The
framework consists of three main processes: identify retrofit measures, shortlist and prioritize
measures, and provide expert advice on installation. The integration model follows this process
when it integrates the external data sources. The manual framework working example was
converted to a computerized integration working example using several software packages.
After analyzing the precedent framework and the working example, Exsys Corvid, expert system
shell software was explored for the subsequent integration model development. Exsys Corvid is
the core application of the integration model, which implements the process logic based on
expert knowledge. Variables, Logic Blocks, and Command Blocks are the fundamental
Page 96
81
components of Exsys Corvid. Their function was explained for the development of rules and the
integration of quantitative data sources.
Page 97
82
CHAPTER 4
ANALYSIS OF NREM DATABASE AND BEOPT
4.1 OVERVIEW
The National Residential Efficiency Measures (NREM) Database and Building Energy
Optimization (BEopt) are the main quantitative information sources for the DSS. For efficient
integration, both their systematic structures and their information content should be analyzed.
The NREM database is mainly used to derive the cost information of the retrofit measures, which
are selected from the intelligent decision support system. Thus, the database should be analyzed
from the point of view of linking the measure and cost information between the two disparate
systems, the NREM database and the DSS. Similarly, BEopt simulates the energy efficiency of
the selected retrofit measures and provides energy efficiency cost information to the DSS. Thus,
both their information relationship and data generating structures should be examined.
This chapter consists of three main sections. Section 4.2 provides a brief explanation of the
structure and data content of the NREM database. Section 4.3 explores the basic concept of
Extensible Markup Language (XML) and XML Path Language (XPath), which are important
connecting tools, in order to integrate the DSS and the NREM database. Section 4.4 examines
the function of BEopt, focusing on its input and output reports, related to the cost information of
the retrofit measures.
Page 98
83
4.2 NATIONAL RESIDENTIAL EFFICIENCY MEASURES (NREM) DATABASE
The NREM database was developed by the National Renewable Energy Laboratory (NREL) to
help users improve the energy efficiency of existing residential buildings utilizing cost
information on retrofit measures (NREL 2010). It has been used in other energy efficiency
related applications, such as BEopt, and is also used in the Decision Support System for this
research. Figure 4.1 illustrates the NREM development process and use.
Figure 4.1: NREM Development Process and Use (Source: NREL 2010)
The primary purpose of the NREM database was to generate a unified national database. Even
though several existing databases in the US Department of Energy (DOE) contain residential
efficiency measures, the retrofit data were scattered, and their data formats were different from
each other. The NREM database was developed to solve this problem by offering a unified
national database that integrates several exiting retrofit databases (NREL 2010).
Page 99
84
The NREM database associated the performance and cost information for retrofit measures in a
standardized format. This standardized information can be used with various other systems. If
they utilize the same, standardized data format, it will be easier to transfer data between the
related systems, and to integrate the systems when needed. Though the NREM database does
not contain energy savings estimates, it provides the standardized retrofit measure definitions,
which can help other building energy simulation tools use the data for their energy retrofit
calculations (NREL 2010). In this research, the Decision Support System also uses the NREM
database for prioritizing residential retrofit measures.
4.2.1 Database Structure
Figure 4.2: Database Structure and Hierarchy (Modified From: NREL 2010)
As Figure 4.2 illustrates, the data and retrofit measures in the NREM database are organized with
a hierarchy. The NREL (2010) specifies the hierarchical structure as follows:
Page 100
85
Group: This is the highest level, which is a classification of major house systems. It
currently contains six types, which will be explained in detail in section 4.2.6.
Category: This is the sub-classification of a Group. For example, “HVAC” is a group,
and “Cooling” and “Heating” are the categories of “HVAC”.
Component Type: This is the sub-classification of a Category, which is more specific.
For example, “Central Air Conditioner” and “Room Air Conditioner” are more specific
methods of “Cooling,” and these are defined as Component Types in the NREM database.
Component: This is the lowest level of structure, which uses the unique name as a
system descriptor. Components stand for the most specific retrofit measures, which have
distinctive properties. For example, even though both are “Central Air Conditioners,”
“Central Air Conditioner (SEER 13)” and “Central Air Conditioner (SEER 15)” have
different energy retrofit properties, thus they are differentiated by their component names.
4.2.2 Basic Objects
The NREM database consists of several objects – Measures, Components, Properties, Actions,
Costs and References. The objects are stored in the NREM database, with a set of rules
combined with other types of objects. Objects are explained as follows (NREL 2010):
Measures: A Measure consists of a Before-component, an Action, and an After-
component. This measure structure is mostly used when the DSS selects the cost
information for the selected retrofit measures from the user needs.
Components: These are unitary items, such as refrigerators or central air-conditioners.
Components also contain constructed-assembles, such as a wood-stud wall or an attic, or
parts of assembles, such as vapor barriers.
Page 101
86
Properties: Component properties are characteristics of the components. They describe
performance parameters such as the R-value and seasonal energy efficiency ratio (SEER),
the lifetime of components, and other pertinent descriptive attributes.
Actions: Actions specify the labor operation-types that explain how the After-
components are implemented. The NREM database has five types of Actions: Replace,
Install, Remove, Insulate and Seal.
Costs: Cost information provides Cost range and Average cost, which are associated with
Before-components, Actions, and After-components. They are the cost values of
implementing the After-components from the current Before-components using the
specific Actions.
References: References can be assigned to Components and Actions, but up until now,
they have not been used substantially in the NREM database.
4.2.3 Database Configuration
The objects mentioned above (action, component, properties, costs and references) form the
structure of the NREM database, and tables with more specific data are added onto this skeleton
to configure the whole database. The objects ultimately constitute the measure structure, which
will be explained further in a later part of this chapter. Figure 4.3 explains the NREM database
schema.
Page 102
87
Figure 4.3: Database Schema (Modified From: NREL 2010)
While the data schema describes the macro level database configuration, the data dictionary
confines the micro level database configuration. It describes each of the columns in every table
in the NREM database with the constraints on the data type and the length. These constraints are
applied to the XSD files, which regulate the data attributes of XML files.
Page 103
88
Figure 4.4: Data Dictionary (Source: NREL 2010)
Page 104
89
4.2.4 Measure Construction
The NREL developed a rule set that evaluates the energy efficiency of component properties.
These rules are utilized in constructing the Measures. According to the rule set, the after-
component must be more energy efficient than the before-component. In addition to the practical
improvement, it must provide the same level of service as the before-component. The NREM
database also suggests the value-added energy efficiency practices for the database users (NREL
2010).
1) Types of Retrofit Measures
There are six types of retrofit measures: Appliance, Domestic Hot Water, Lighting, Enclosure,
HVAC and Miscellaneous. When matched against the data hierarchy of the NREM database
(Figure 4.2), the retrofit measure types correspond with Group, which is the highest level of the
data structure. Each retrofit measure type consists of component types, and each component type
has several measures as Figure 4.5 shows. A retrofit measure example will be explained more
specifically in the next section.
Figure 4.5: Types of Retrofit Measures (Group Level)
Page 105
90
Figure 4.6 shows the six retrofit measure types and their forty-seven component types. The
numbers in parentheses represent the number of retrofit measures under each component type;
these vary from one to seven hundred thirteen. Retrofit measure data are collected from various
sources. The amount of data depends on the reasons for the retrofit, such as market variety for
the measure product, the complexity of the installation, and so forth.
Figure 4.6: Types of Retrofit Measures and Components
2) Examples of Retrofit Measures
A retrofit measure in the NREM database can be analyzed from two different points-of-view.
One is based on the vertical data hierarchy, which is stratified by group, category, component
Page 106
91
type and component. The other is based on the horizontal measure structure, which is comprised
of before-component, after-component, property, action and cost.
Figure 4.7: The Relationship between Data Hierarchy and Measure Structure
Figure 4.8 is an example of the retrofit measures shown on the web interface. The left frame is
organized by the six measure groups and the component types under the group. The example of a
clothes dryer is vertically analyzed, based on the data hierarchy as follows:
Group: Appliances
Category: Clothes Drying
Component Type: Clothes Dryer
Measure: Replace electric dryer with electric
Page 107
92
The retrofit measure also can be analyzed horizontally, based on the measure structure as follows:
Before-Component: Clothes Dryer (Electric)
Property of Before-Component: Drying Energy (13 kBtu / load), Fuel Type (Electric),
Lifetime (13 Years), Machine Energy (0.23 kWh / load)
Action: Replace
After-Component: Clothes Dryer (Gas)
Property of After-Component: Drying Energy (22 kBtu / load), Fuel Type (Electric),
Lifetime (13 Years), Machine Energy (0.23 kWh / load)
Cost: Cost Range (730 – 1700 $), Average Cost (1300 $)
In order to integrate the NREM database into the DSS, the horizontal measure structure should
be thoroughly understood, since before-components, after-components and average costs in the
measure structure will be what the DSS mainly utilizes.
Page 108
93
Figure 4.8: An Example of a Retrofit Measure
Page 109
94
4.2.5 Actions for Retrofit Measures
As explained before, the measure structures consist of components, properties, costs and actions.
Actions are specific labor operation methods to be applied to the after-components, and the
NREM database classifies the actions into five different categories (NREL 2010):
Replace: This action is to exchange a before-component for a more energy efficient
after-component of the same type, when the homeowner wishes to retain the existing
function.
Install: This action is to initiate an energy efficient after-component from none.
Installation upgrades the existing condition of a home, but it is not usually required by the
homeowner.
Remove: This action is to exchange a before-component for none. The Remove action
can be combined with the Install action, when the users wish to use different component
types.
Insulate: This action is related to the installation of additional insulation into existing
measure components.
Seal: This action is related to leakage reductions for either the whole house or ducts.
According to the NREM database rule, each retrofit measure is composed of a before-component,
an action, and an after-component. The rule also associates specific costs with different types of
actions, and the cost values are basically derived from the formula shown below. In this formula,
C stands for a cost value, and M stands for a cost multiplier. Among the subscripts, “before” is a
before-component, “after” is an after-component, and “action” is an action type (NREL 2010).
Page 110
95
Figure 4.9 shows the multipliers for each of the action types and the formula for the measure cost
calculation.
Figure 4.9: Cost Multipliers for Action Types (Source: NREL 2010)
4.2.6 Cost Sources and Types
The cost data in the NREM database is initially drawn from The Home Energy Saver cost data,
which contains total measure costs or standardized measure costs, such as per square foot of wall
area (NREL 2010). The NREL (2010) has also collected cost data from additional external
sources, and the main sources are as follows:
Construction Cost Estimation Resources: Current cost estimates for residential repair
and remodeling projects, such as RS Means cost data, are provided. The NREM total cost
includes material and labor costs, which are normalized in different units. It combines the
overhead and profit (O&P) costs as well.
Web-based Resources: The cost information from major home improvement retail stores
are used for some component types. For newer components with less of an offline market
share, online cost quotes are provided.
Page 111
96
Home Performance Industry Partners: Costs from industry partners and distributors
are included in the database, classified either into costs for actions, components, or total
cost for a single measure.
Publication: Academic reports and governmental or industry data publications are also
included in the NREM database.
Formulaic: For some component types, for which there is little cost data, a formulaic
approach is used to derive the cost data through interpolation or extrapolation.
Two cost types are specified in the database, to provide a guideline for the available measure
costs in the marketplace. It also gives the year in which the measure cost was recorded (NREL
2010). The NREL defines the cost types as follows:
Average Cost: This presents the mean cost derived from the raw cost data for each
measure.
Cost Range: The cost range is comprised of the 10th and 90th percentile costs, calculated
from the collected cost data.
When the NREM database is integrated into the DSS, the average cost data for the specific
retrofit measures will be used.
4.3 TECHNICAL ANALYSIS OF THE NREM DATABASE
The NREL has constructed the NREM database using Extensible Markup Language (XML).
Users can access the database from anywhere via a web user interface (UI), and can also
download the database to their local computers as a form of XML file. Data objects such as
Page 112
97
measure components, actions and costs are stored in the XML files as table structures, which are
accessible using queries. XML Path Language (XPath) is a way to select specific data from the
XML database. It is used as the main method for connecting the expert system shell program and
the XML NREM database in this research.
4.3.1 Extensible Markup Language (XML) and XML Schema Definition (XSD)
XML is used to constitute the NREL database, hence XML and other related technical languages
such as XSD and XPath should be reviewed in order to fully understand the NREL database, and
to integrate it into the Expert System.
XML is an abbreviation for Extensible Markup Language. It was initially designed to help
electronic publishing handle large amounts of data; it was more focused on carrying data rather
than displaying data (W3C 2012). Although XML was mainly designed to focus on documents,
there are simple, general and usable characteristics of XML that are suitable for structural data
storage as well, and its role in data exchange is increasing rapidly over the Internet (W3C 2012).
The NREL database is also developed with XML; the uploaded data files on the NREL webpage
can be retrieved anywhere, so it becomes ubiquitous. The database XML files can be imported to
any other systems that support the use of external XML files.
XML Schemas help machines to perform the data rules built by people, by providing the data
structure definition, constraints on content, and semantics of XML documents (W3C 2011). In
other words, XML Schema, also known as XSD (XML Schema Definition), is used to validate
an XML file, which is the process of checking the syntax of XML documents. XSD files also
employee an XML-based format, which helps to process them with regular XML tools.
Page 113
98
The NREM XML database files consist of these two types of files as well: XML files with the
file extension ‘.xml’, and XSD files with the file extension ‘.xsd’. First, the NREM has two
XML files, ‘raw data.xml’ and ‘measure.xml’, which contain the actual retrofit measure data.
Although they both have basically the same retrofit measure data, the structures of the data files
are different, in that the former includes all the retrofit measure raw data in the database, while
the latter offers the data organized by a defined measure structure, with before-components,
after-components, costs, and properties, as seen on the NREL website. The NREM also has two
XSD files, ‘raw data.xsd’ and ‘measure.xsd’, which match up their same nominal xml files.
These are separated from the core data contents of xml files, and check to make sure the XML
document conforms to the schema.
4.3.2 XML Path Language (XPath) and Other Related Terms
XML Path Language (XPath) is defined as a query language for addressing specific parts of an
XML document, which is modeled as a tree of nodes. XPath uses path expressions to navigate
the hierarchical tree structure of an XML document, as its name implies (W3C 1999). While
XSD operates with XML syntax and checks the surface syntax, XPath facilitates non-XML
syntax, and focuses on the abstract and logical structure of an XML document (W3C 1999).
When the expert system shell software, Exsys Corvid, imports the variable values from external
XML files, XPath commands are used to select the node values from the NREM XML file.
Therefore, XML Path Language should be understood before integrating the NREL database into
the Decision Support System. Figure 4.10 shows the tree structure of the NREM XML document
and the use of XPath to select Average Cost value of a specific measure.
Page 114
99
Figure 4.10: Use of XPath for the Integration of DSS and NREM XML database
4.3.3 NREM XSD File (Raw Data, Measure Files)
The Data XSD file (raw data.xsd) of the NREM database defines the structure and data
constraints of the Data XML file (raw data.xml). The current NREM database, version 2.0,
consists of 13 tables in the Data XSD file as Figure 4.11 presents. It defines the data structure
and identifies which data columns are in each table. It also provides constraints on the data
attributes in each column. The table names and the data columns of each table are as follows
(The prefix ‘s’ stands for string, ‘n’ for numeric, and ‘d’ for date):
Page 115
100
tblAction: Defines the constraints on retrofit action data and consists of 3 columns –
sName, dEntryDate, sNotes.
tblActionType: Defines the constraints on action type data and consists of 3 columns –
nBeforeMultiplier, nAfterMultiplier, sDescription.
tblCategory: Defines the constraints on measure category data and consists of 1 column
– sName.
tblComponent: Defines the constraints on measure component data and consists of 2
columns – sName, dEntryDate.
tblComponentType: Defines the constraints on component type data and consists of 2
columns – sName, dUploadDate.
tblCost: Defines the constraints on measure cost data and consists of 1 column – nValue.
tblCostType: Defines the constraints on cost type data and consists of 2 columns –
sDescription, sUnits.
tblGroup: Defines the constraints on measure group data and consists of 1 column –
sName.
tblPerformanceLevels: Defines the constraints on measure performance level data and
consists of 3 columns – sComponentName, sHowClose, dPerformanceLevelDate.
tblPerformanceLevelType: Defines the constraints on performance level type data and
consists of 2 columns – sClimateZone, sName.
tblProperties: Defines the constraints on measure property data and consists of 1 column
– sValue.
tblPropertyType: Defines the constraints on property type data and consists of 3
columns – sDefinition, sDescription, sUnits.
Page 116
101
tblWebMeasures: Defines the constraints on measure data, structured as shown via the
web interface, and consists of 8 columns – sBeforeComponent, sActionName,
sAfterComponent, nLowCost, nHighCost, nAverageCost, sCostUnits, sComponentType.
Figure 4.11: Detailed Data Schema (Source: NREL 2010)
For example, according to the source file presented in Figure 4.12, the first table in the Data
XSD file, “tblAction” defines its columns as “sName”, “dEntryDate” and “sNotes” for a measure
attribute, which contains “ActionID” and its reference information “idComponentTypeID” and
“idActionTypeID”.
Page 117
102
Figure 4.12: Data XSD File, Table Structure Example
The Measure XSD file (measure.xsd) of the NREM database defines the structure and data
constraints of the Measure XML file (measure.xml). The current NREM database consists of 8
tables in the Measure XSD file. It defines the data structure and constraints in a similar way to
the Data XSD file. However, the overall Measure XSD file organization is to show the retrofit
measure structures on the NREL website. Therefore, its basic structure unit is for one retrofit
measure, and the unit is iterated as the number of retrofit measures in the NREM database. The
measure structure unit is composed of data from the 8 tables below, which are originally derived
from the raw data, as presented in Figure 4.13. The table names and the data columns of each
table are as follows:
Page 118
103
climate_zones: Defines the constraints on climate zone data for a measure structure that
will be shown on the web interface, and consists of 1 column – climate_zone.
component: Defines the constraints on component data, and consists of 4 columns –
component_name, component_startfinish, measure_component_type, component_notes
cost: Defines the constraints on cost data, and consists of 3 columns – cost_value,
cost_type, cost_units
head: Defines the constraints on the head data for the beginning part of the Measure XSD
file, and consists of 5 columns – title, creation_date, version, version_description,
xml_schema_version
measure: This is the main part of the Measure XSD file. It defines the constraints on the
measure data and consists of 5 columns – measure_name, measure_group,
measures_category, measures_notes, action
performance_level: Defines the constraints on performance level data for before-
components and after-components, and consists of 3 columns – name, date, type
property: Defines the constraints on property data for before-components and after-
components, and consists of 4 columns – property_value, property_type,
property_type_notes, property_units
source: Defines the constraints on information sources of measures, and consists of 4
columns – moreinformation, disclaimer, credit, feedback
Page 119
104
Figure 4.13: Measure-centric XML Feed Schema and Table Structure
(Modified From: NREL 2010)
For example, the main table in the Measure XSD file, “measure,” is shown in the source file
below. The Measure XSD file defines the columns of the “measure” table as “measure_name,”
“measure_group,” “measure_category,” “measure_notes,” “action,” and so on, with the data type
constraints. This measure structure is for the display on the NREL web site, and repeats for the
number of retrofit measures in the NREM database (see Figure 4.14).
Page 120
105
Figure 4.14: Measure XSD File, Table Structure Example
4.3.4 NREM XML File (Raw Data, Measure Files)
The Data XML file (raw data.xml) of the NREM database contains retrofit measure data in
accordance with the constraints of the Data XSD file (raw data.xsd). As explained previously in
the section on the Data XSD file, the Data XML file consists of the same 13 tables, and an
additional 3 tables that link measure information. While the XSD files only define the column
names and have no data in them, the XML files include measure data. The additional 3 tables
play roles to connect the following information:
tblLinkActionCosts: Provides the link between ActionID column and CostID column to
deliver cost information related to the action types.
Page 121
106
tblLinkCategoryComponentType: Provides the link between the CategoryID column
and ComponentTypeID, to match the category and the component type.
tblLinkComponentCosts: Provides the link between the ComponentID column and
CostID, to deliver cost information related to the components.
For example, according to the source file below, the first table in the Data XML file, “tblAction,”
stores retrofit measure action data, such as “Seal to 60% Leakage Reduction,” for which the
attributes are composed of “idActionTypeID,” “ActionID,” and “idComponentTypeID.” In
addition, each action data consists of 3 columns, “sName,” “dEntryDate,” and “sNotes.”
Figure 4.16 explains that the primary key of table “tblAction” is “ActionID,” which performs as
a distinguisher to make each data value unique in “tblAction.” Also, as shown in figure 4.16,
“tblAction” is linked with other tables, such as “tblActionType” and “tblComponentType,” for
which the primary keys are connected as the foreign keys of “tblAction.” When Figure 4.15 is
compared with Figure 4.16, focused on the attributes, it is shown that “ActionID” in the XML
source is the primary key in the “tblAction” table, and “idActionTypeID” and
“idComponentTypeID” are the foreign keys derived from the “tblActionType” table and the
“tblComponentType” table.
Page 122
107
Figure 4.15: Data XML File, Data Example
Figure 4.16: Detailed Database Schema (Modified From: NREL 2010)
The Measure XML file (measure.xml) of the NREM database contains retrofit measure data in
accordance with the constraints of the Measure XSD file (measure.xsd). As explained previously
Page 123
108
in the Measure XSD file section, the Measure XML file consists of the same 8 tables, including
retrofit measure data, with the measure structure displayed on the NREM website.
For example, according to the source file demonstrated in Figure 4.17, the main table in the
Measure XML file, the “measure” table, stores retrofit measure data, beginning with its measure
specification columns: “Clothes Dryer (Electronic) Clothes Dryer (Electronic)” as a measure
name; “Appliances” as a measure group; “Clothes Drying” as a measure category; and “Replace
electronic dryer with electronic” as an action. The measure structure is then combined with the
components (before-component and after-component), their properties, and cost information.
This Measure XML file becomes the basis of the measure information layout on the web
interface.
Figure 4.17: Measure XML File, Data Example
Page 124
109
4.3.5 The Various Software Used for the NREM Database Analysis
The NREM database is the long source code, written in XML. It is not easy to figure out the
structure and data context by reading the XML code, line by line. In order to help achieve a
comprehensive understanding of the NREM XML database, various software applications, such
as Microsoft Office Access, BaseX and XML Spy, were used in this research. This section
provides a brief explanation of each program.
1) Microsoft Office Access
Microsoft Office Access (MS Access) is designed as a database tool to collect and understand
information (Microsoft 2012). The NREM XML files can be downloaded from the NREL
website to a local computer, and the table structure and data can be imported to MS Access.
Once the XML source codes are imported, the data can be viewed and edited in the software, and
when the XML file is edited, MS Access generates the changed XML source automatically for
export to the XML file. In addition, the cell structure, with the columns and rows of MS Access,
presents the data context in a more visually organized way, which makes it easier to understand.
Figure 4.18 and Figure 4.19 show how the XML files are displayed in MS Access. The list of all
tables is shown in the left section, and the cells in the right section show the column names and
data rows, with the tabs indicating the table names. Compared to the XML source codes, it is
much more straightforward and discernible.
Page 125
110
Figure 4.18: Data Access File
Figure 4.19: Measure Access File
Page 126
111
2) BaseX
BaseX is an XML database system, and an XPath and XQuery processor (BaseX 2012). When
Exsys Corvid, the expert system shell program, imports an external XML database, it uses XPath
command to select the target data. BaseX is used to check the XPath syntax on the local host
computer before the XPath commands are applied to the Expert System, to set the variable
values from the external NREL XML database files. It helps to improve understanding of the
structure of the NREL database with its interactive and user-friendly GUI (graphical user
interface).
3) XML Spy
XML Spy is an XML editor that offers schema designer, code generator, chart creator and other
functions related to XML editing (Altova 2012). The NREL database xml files can be retrieved
from the NREL website to local computers. XML Spy is used to read and modify NREL
database xml files.
BaseX and XML Spy were recommended by the NREM database developers at the beginning of
this research (see Appendix 2), and each of these software applications, including MS Access,
was utilized in this research for an effective analysis of the NREM XML database.
4.4 BUILDING ENERGY OPTIMAZATION (BEOPT)
Energy simulation software performs a significant role in prioritizing the retrofit measures by
providing the cost and energy consumption information when the selected measures are applied
in the decision support process for this research. At the beginning of this research, several energy
Page 127
112
simulation applications were reviewed, with BEopt ultimately being selected, since it also uses
the NREM database for its retrofit measure information.
Building Energy Optimization (BEopt) is a software application developed by the NREL to
obtain the optimal conditions for a building design, following the path of a zero net energy (ZNE)
building (NREL 2012). According to the NREL, zero net energy can be defined in several ways.
The most common definitions are net zero site energy, net zero source energy, net zero energy
cost, and net zero energy emission (Torcellini et al. 2006). At the point of net zero site energy, a
ZNE building produces as much energy as it consumes in a year, by means of a photovoltaic (PV)
system and active solar, and it provides information about its minimal energy-related costs
(NREL 2012). BEopt also suggests optimal building design options that consider realistic
construction, and the interactions between different category options (NREL 2012).
4.4.1 Path to Zero Net Energy (BEopt Graph)
Figure 4.20 shows the concept of the path to zero energy for a building. The X-axis represents
the percentage of energy savings and the Y-axis represents the annualized energy costs. On the
path of the curved graph, as the energy saving rate increases, the utility bills decrease, and the
mortgage amount available from implementing the energy saving increases. This graph examines
the minimum annual cost, which is the sum of the annual utility bills and the energy efficiency
measure cost, combined with the mortgage payment in each energy savings percentile point. The
mortgage payment is related to the energy producing cost using photovoltaic electricity.
Page 128
113
In this Figure, Point 1 indicates a reference case that is the beginning point of evaluating energy
efficiency. The reference case can be a user-defined case building or a Building America
Benchmark building automatically generated by BEopt, according to the reference building
option setting on the screen. Point 2 indicates the minimum annual cost point, and, beyond this
point, the total annual cost increase, even though energy can be saved. Point 3 is referred to as a
take-off point, at which the energy saving cost equals the energy producing cost. From this point,
the optimal path goes straight up to Point 4, a Zero Net Energy point, with the slope of
photovoltaic electricity cost per kWh. At the Zero Net Energy point, a photovoltaic system can
produce as much energy as the building consumes, and the annual costs are solely the mortgage
payment, On the other hand, at the reference case point, the annual energy costs are fully covered
by the utility bills (NREL 2012).
Figure 4.20: A Building’s Path to Zero Net Energy (Source: BEopt 2010)
Page 129
114
The fundamental concept to incorporate the utility bills and the mortgage payment is also applied
to prioritizing retrofit measures in this research.
4.4.2 BEopt Running Process
In order to acquire the energy saving information, a user needs to select input options about the
energy retrofit measures. BEopt provides predefined retrofit options in various measure
categories, and runs the system based on the input values the user selected. The energy saving
cost is calculated based on the input options, and is compared with the reference point. BEopt
provides reports related to the input options and the output results for further analysis. In this
research, the user’s current measures and their improvements are set as the BEopt input options,
and the annual utility cost information is derived. The output report of this cost information is
then exported in the form of an Excel file for the prioritizing process. A more specific
explanation is continued in the next section.
Figure 4.21: BEopt Running Process
Page 130
115
4.4.3 Input Setting
BEopt has 3 input types – Geometry Input, Options Input and Site Input – for the specific user’s
cases. Geometry Input is divided into the drawing area, the rendering area and general inputs
(NREL 2012). The user can draw the floor plan of the building with different space types
predefined on the left part of the screen. The floor plan on the drawing area is reflected to the
rendering area as a 3-dimensional model with the openings. The general input area contains the
number of beds and baths, and the total finished area of the building. When BEopt is used for the
DSS, the basic information of the user’s residential buildings will be fed into this area.
Figure 4.22: Geometry Input
Page 131
116
Options Input is directly related to the retrofit measure information of the building. BEopt
provides retrofit options with groups and more specified categories, and users select the
building’s retrofit information from among the predefined options within the category. The
current retrofit measure group includes Building, Operation, Walls, Ceilings/Roofs,
Foundation/Floors, Thermal Mass, Windows & Shading, Airflow, Major Appliances, Lighting,
Space Conditioning, Water Heating, Power Generation, and Include Combinations (NREL 2012).
Most of the groups, such as Appliances, Lighting, and Space Conditioning, are equivalent to the
groups in the NREM database, which helps create a more efficient integration.
Figure 4.23: Option Input
Site Input deals with information related to the location of the building, the mortgage payment,
the utility rates, and so forth.
Page 132
117
Figure 4.24: Site Input
4.4.4 Energy Simulation Output
Based on the input options the user selected, BEopt calculates the energy saving costs and other
energy outputs as a form of graph, and they are divided into the following types:
Cost and Energy Graph: As explained in section 4.4.1, this graph shows the percentage
of source energy savings and the amount of annual energy saving costs for each case,
compared to the reference case points. According to the purpose of users, the annualized
energy related costs can be utility bills only, or combined costs of utility bills and the
mortgage payment. In this example, only the utility bill costs are used.
End Use Graph: This provides the segments of the annual energy costs. It can be
presented with different kinds of energy-consuming segmentation, depending on the
Page 133
118
graph types, which are Source Energy, Utility Bills, Site Energy-Electricity, Site Energy-
Natural Gas, Site Energy-Fuel Oil, Site Energy-Propane, CO2 Emissions, and Loads Not
Met. For the working example in this research, the Utility Bills type cost information is
used.
Input Option Graph: This summarizes the input options that the user selected for each
case. Based on the input options of the reference case, different input options for other
cases are indicated with green bars, and it helps to recognize the special input feature of
each case.
Figure 4.25: Output Graphs
Page 134
119
4.4.5 Creating a Report
The detailed input options and the output energy saving information in BEopt can be exported to
comma-separated value (csv) files for other formats of data use. Though the reports can only
include the text information, the simple and compatible format for report files can easily be
imported to other software applications. This feature makes it possible for the BEopt input and
output information to be connected to other software.
BEopt creates detailed input reports. The input reports give a full account of the input options,
grouped by geometry inputs, site inputs and options inputs. This report includes every existing
case in the file.
BEopt also generates detailed output reports. The output reports encompass very specific levels
of energy saving information, such as option information, cost multipliers, unit costs, lifetimes,
annual simulation results, monthly simulation results, cash flow, and economics.
BEopt can produce reports of data exported from the output screen. According to the user’s
purposes, each of the output graphs’ (cost and energy graph, end use graph, and input option
graph) information can be exported separately. In this research, for the integration of BEopt
output data and the DSS, end use graph information is exported as a utility bills graph type. The
exported comma-separated values (CSV) file is imported to Exsys Corvid, and the cost
information is used to prioritize the user’s retrofit measures.
Page 135
120
4.4.6 BEopt Cost Information
According to the BEopt Library Manager, Cost Selector menu, the majority of cost data are
derived from the NREM database, version 2.0, and RSMeans 2009. Since both BEopt and the
NREM database were developed by the NREL, they share the NREM cost data. In addition to
the cost information, the measure groups of BEopt are similar to the measure groups of the
NREM database. These compatible features led BEopt to be chosen as the energy simulation
software for the integrated intelligent Decision Support System combined with the NREM
database.
Figure 4.26: BEopt Cost Sources
Page 136
121
4.5 CHAPTER SUMMARY
In this chapter, the quantitative information sources for the integrated intelligent Decision
Support System were examined.
The NREM database provides the major cost information for improving the residential retrofit
measures, based on the before-component, the after-component and the action selected for the
implementation. In order to use the NREM measure cost information in the Decision Support
System, the database structure, XML and XPath were explained for effective integration.
BEopt simulates the energy efficiency with the selected measures, and provides the annual
energy utility cost information, which can also be used in the DSS. Both the NREM database and
BEopt were developed by the NREL, and the similarity of their energy retrofit measure
structures and cost information sources helps facilitate the integration process.