The Intel® Xeon® Processor E5 Family Architecture, Power Efficiency, and Performance Jeff Gilbert, Sr PE Mark Rowland, PE August 2012 Agenda 1. Architecting Performance 2. Energy Efficiency from the Load Line to the Data Center 3. Measured Performance
Transcript
The Intel® Xeon® Processor E5 Family
Architecture, Power Efficiency, and Performance
Jeff Gilbert, Sr PE Mark Rowland, PE August 2012
Agenda 1. Architecting Performance 2. Energy Efficiency from the Load Line to the Data Center 3. Measured Performance
Intel® Xeon® Processor E5-2600 Product Family Architecture, Power Efficiency, and Performance
2
Legal Disclaimer - Notice INFORMATION IN THIS DOCUMENT IS PROVIDED IN CONNECTION WITH INTEL PRODUCTS. NO LICENSE, EXPRESS OR IMPLIED, BY ESTOPPEL OR OTHERWISE, TO
ANY INTELLECTUAL PROPERTY RIGHTS IS GRANTED BY THIS DOCUMENT. EXCEPT AS PROVIDED IN INTEL'S TERMS AND CONDITIONS OF SALE FOR SUCH PRODUCTS, INTEL ASSUMES NO LIABILITY WHATSOEVER AND INTEL DISCLAIMS ANY EXPRESS OR IMPLIED WARRANTY, RELATING TO SALE AND/OR USE OF INTEL PRODUCTS INCLUDING LIABILITY OR WARRANTIES RELATING TO FITNESS FOR A PARTICULAR PURPOSE, MERCHANTABILITY, OR INFRINGEMENT OF ANY PATENT, COPYRIGHT OR OTHER INTELLECTUAL PROPERTY RIGHT. UNLESS OTHERWISE AGREED IN WRITING BY INTEL, THE INTEL PRODUCTS ARE NOT DESIGNED NOR INTENDED FOR ANY APPLICATION IN WHICH THE FAILURE OF THE INTEL PRODUCT COULD CREATE A SITUATION WHERE PERSONAL INJURY OR DEATH MAY OCCUR. Intel may make changes to specifications and product descriptions at any time, without notice. Designers must not rely on the absence or characteristics of any features or instructions marked "reserved" or "undefined". Intel reserves these for future definition and shall have no responsibility whatsoever for conflicts or incompatibilities arising from future changes to them. The information here is subject to change without notice. Do not finalize a design with this information. The products described in this document may contain design defects or errors known as errata which may cause the product to deviate from published specifications. Current characterized errata are available on request. Contact your local Intel sales office or your distributor to obtain the latest specifications and before placing your product order. Copies of documents which have an order number and are referenced in this document, or other Intel literature, may be obtained by calling 1-800-548-4725, or go to: http://www.intel.com/design/literature.htm
Intel processor numbers are not a measure of performance. Processor numbers differentiate features within each processor family, not across different processor families: Go to: http://www.intel.com/products/processor_number
Intel® AES-NI requires a computer system with an AES-NI enabled processor, as well as non-Intel software to execute the instructions in the correct sequence. AES-NI is available on select Intel® processors. For availability, consult your reseller or system manufacturer. For more information, see http://software.intel.com/en-us/articles/intel-advanced-encryption-standard-instructions-aes-ni/
No computer system can provide absolute security under all conditions. Intel® Trusted Execution Technology (Intel® TXT) requires a computer with Intel® Virtualization Technology, an Intel TXT-enabled processor, chipset, BIOS, Authenticated Code Modules and an Intel TXT-compatible measured launched environment (MLE). Intel TXT also requires the system to contain a TPM v1.s. For more information, visit http://www.intel.com/technology/security
Intel® Virtualization Technology requires a computer system with an enabled Intel® processor, BIOS, and virtual machine monitor (VMM). Functionality, performance or other benefits will vary depending on hardware and software configurations. Software applications may not be compatible with all operating systems. Consult your PC manufacturer. For more information, visit http://www.intel.com/go/virtualization
Requires a system with Intel® Turbo Boost Technology. Intel Turbo Boost Technology and Intel Turbo Boost Technology 2.0 are only available on select Intel® processors. Consult your PC manufacturer. Performance varies depending on hardware, software, and system configuration. For more information, visit http://www.intel.com/go/turbo
Intel product is manufactured on a lead-free process. Lead is below 1000 PPM per EU RoHS directive (2002/95/EC, Annex A). No exemptions required
Halogen-free: Applies only to halogenated flame retardants and PVC in components. Halogens are below 900ppm bromine and 900ppm chlorine.
Intel® Xeon® Processor E5-2600 Product Family Architecture, Power Efficiency, and Performance
3
Legal Disclaimers - Performance
Software and workloads used in performance tests may have been optimized for performance only on Intel microprocessors. Performance tests, such as SYSmark and MobileMark, are measured using specific computer systems, components, software, operations and functions. Any change to any of those factors may cause the results to vary. You should consult other information and performance tests to assist you in fully evaluating your contemplated purchases, including the performance of that product when combined with other products.
Intel does not control or audit the design or implementation of third party benchmarks or Web sites referenced in this document. Intel encourages all of its customers to visit the referenced Web sites or others where similar performance benchmarks are reported and confirm whether the referenced benchmarks are accurate and reflect performance of systems available for purchase.
Relative performance is calculated by assigning a baseline value of 1.0 to one benchmark result, and then dividing the actual benchmark result for the baseline platform into each of the specific benchmark results of each of the other platforms, and assigning them a relative performance number that correlates with the performance improvements reported.
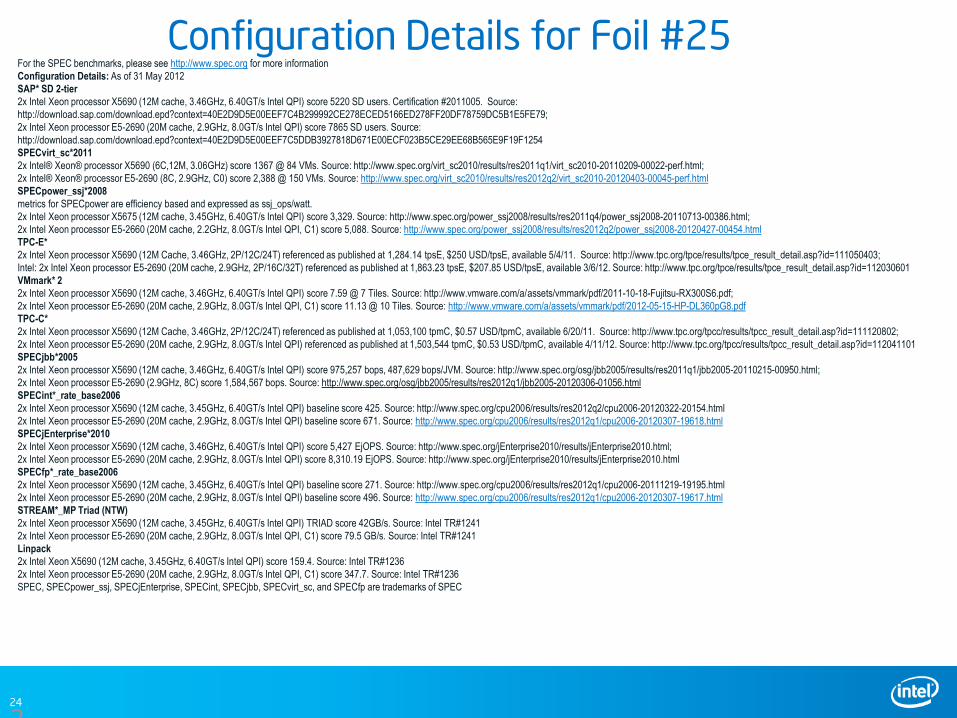
SPEC, SPECint, SPECfp, SPECrate, SPECpower_ssj, SPECjAppServer, SPECjEnterprise, SPECjbb, SPECompM, SPECompL, and SPEC MPI are trademarks of the Standard Performance Evaluation Corporation. See http://www.spec.org for more information.
TPC Benchmark is a trademark of the Transaction Processing Council. See http://www.tpc.org for more information.
SAP and SAP NetWeaver are the registered trademarks of SAP AG in Germany and in several other countries. See http://www.sap.com/benchmark for more information.
3
All Legal Notice slides MUST be included with any slides removed from this presentation
Intel® Xeon® Processor E5-2600 Product Family Architecture, Power Efficiency, and Performance
Optimization Notice
4
Optimization Notice
Intel® compilers, associated libraries and associated development tools may include or utilize options that optimize for instruction sets that are available in both Intel® and non-Intel microprocessors (for example SIMD instruction sets), but do not optimize equally for non-Intel microprocessors. In addition, certain compiler options for Intel compilers, including some that are not specific to Intel micro-architecture, are reserved for Intel microprocessors. For a detailed description of Intel compiler options, including the instruction sets and specific microprocessors they implicate, please refer to the Intel® Compiler User and Reference Guides under Compiler Options." Many library routines that are part of Intel® compiler products are more highly optimized for Intel microprocessors than for other microprocessors. While the compilers and libraries in Intel® compiler products offer optimizations for both Intel and Intel-compatible microprocessors, depending on the options you select, your code and other factors, you likely will get extra performance on Intel microprocessors. Intel® compilers, associated libraries and associated development tools may or may not optimize to the same degree for non-Intel microprocessors for optimizations that are not unique to Intel microprocessors. These optimizations include Intel® Streaming SIMD Extensions 2 (Intel® SSE2), Intel® Streaming SIMD Extensions 3 (Intel® SSE3), and Supplemental Streaming SIMD Extensions 3 (Intel® SSSE3) instruction sets and other optimizations. Intel does not guarantee the availability, functionality, or effectiveness of any optimization on microprocessors not manufactured by Intel. Microprocessor-dependent optimizations in this product are intended for use with Intel microprocessors. While Intel believes our compilers and libraries are excellent choices to assist in obtaining the best performance on Intel® and non-Intel microprocessors, Intel recommends that you evaluate other compilers and libraries to determine which best meet your requirements. We hope to win your business by striving to offer the best performance of any compiler or library; please let us know if you find we do not.
Notice revision #20101101
This slide MUST be used with any slides with performance data removed from this presentation
Intel® Xeon® Processor E5-2600 Product Family Architecture, Power Efficiency, and Performance
5
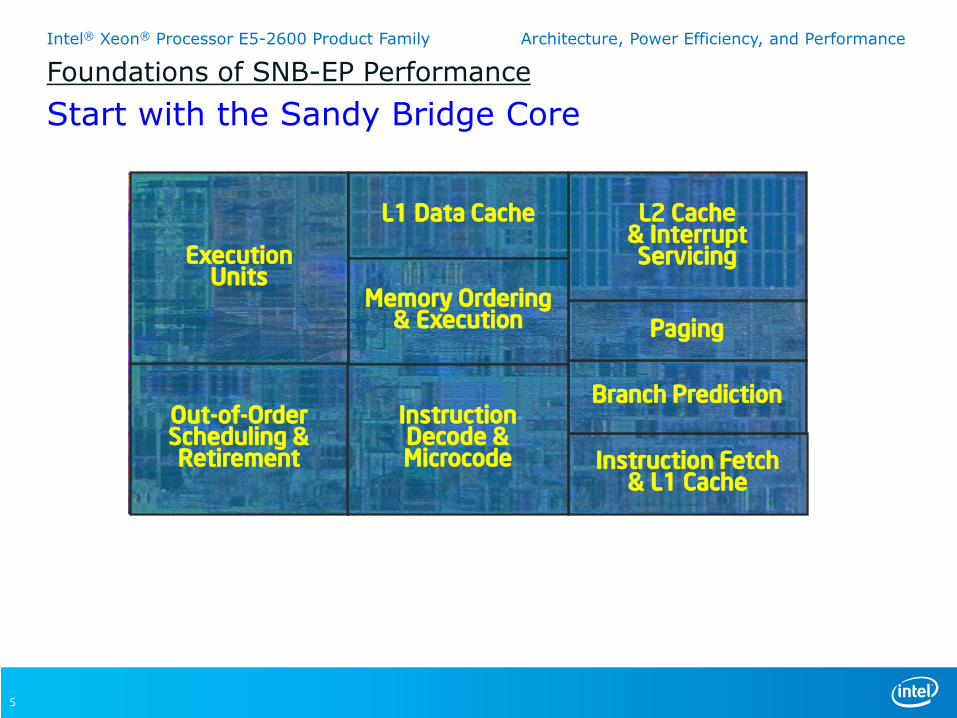
Foundations of SNB-EP Performance
Start with the Sandy Bridge Core
Execution Units
Out-of-Order Scheduling & Retirement
L2 Cache & Interrupt Servicing
Instruction Fetch & L1 Cache
Branch Prediction Instruction Decode & Microcode
Paging
L1 Data Cache
Memory Ordering & Execution
Intel® Xeon® Processor E5-2600 Product Family Architecture, Power Efficiency, and Performance
6
Foundations of SNB-EP Performance
Put Eight Cores on a High BW Interconnect: The Ring
Peak Ring BW Math ____ bytes data bus x ____ directions x ____ active stops x ____ GHz = ____ GBy/s
Intel® Xeon® Processor E5-2600 Product Family Architecture, Power Efficiency, and Performance
7
Last Level Cache
Last Level Cache
Last Level Cache
Last Level Cache
Last Level Cache
Last Level Cache
Last Level Cache
Last Level Cache
Home Agent Memory
Controller
Intel® QuickPath
Interconnect (QPI) Agent
Integrated I/O
Power Control
Unit
SNB Core
SNB Core
SNB Core
SNB Core
SNB Core
SNB Core
SNB Core
SNB Core
Foundations of SNB-EP Performance
Add an LLC, System Agents, and Power Management
iMC
___ GBy/sec
PCIe
__ GBy/sec
QPI
__ GBy/sec
Unit Peak Rates
not sustainable
LLC
___ GBy/sec
Intel® Xeon® Processor E5-2600 Product Family Architecture, Power Efficiency, and Performance
8
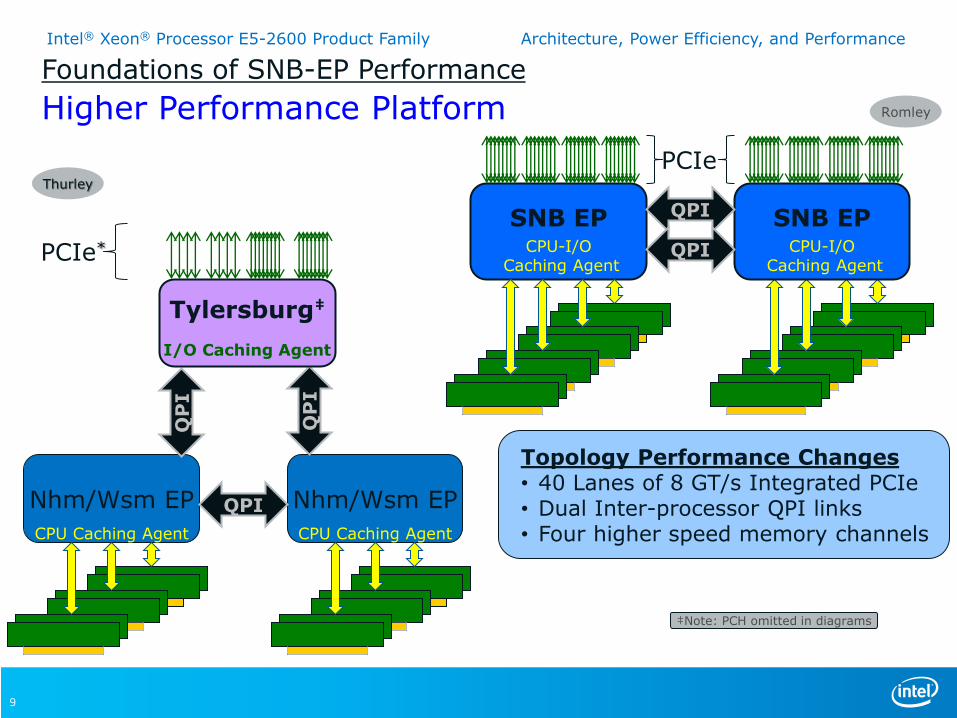
Thurley Platform Review
Nhm/Wsm EP Nhm/Wsm EP QPI
QP
I
QP
I
CPU Caching Agent CPU Caching Agent
PCIe*
Tylersburg‡
I/O Caching Agent
Single IOH
‡Note: PCH omitted in diagrams
Nhm/Wsm EP Nhm/Wsm EP QPI
CPU Caching Agent CPU Caching Agent
QPI
PCIe
Tylersburg
I/O Caching Agent
Tylersburg
I/O Caching Agent
Dual IOH
QP
I
QP
I
Intel® Xeon® Processor E5-2600 Product Family Architecture, Power Efficiency, and Performance
Intel® Xeon® Processor E5-2600 Product Family Architecture, Power Efficiency, and Performance
10
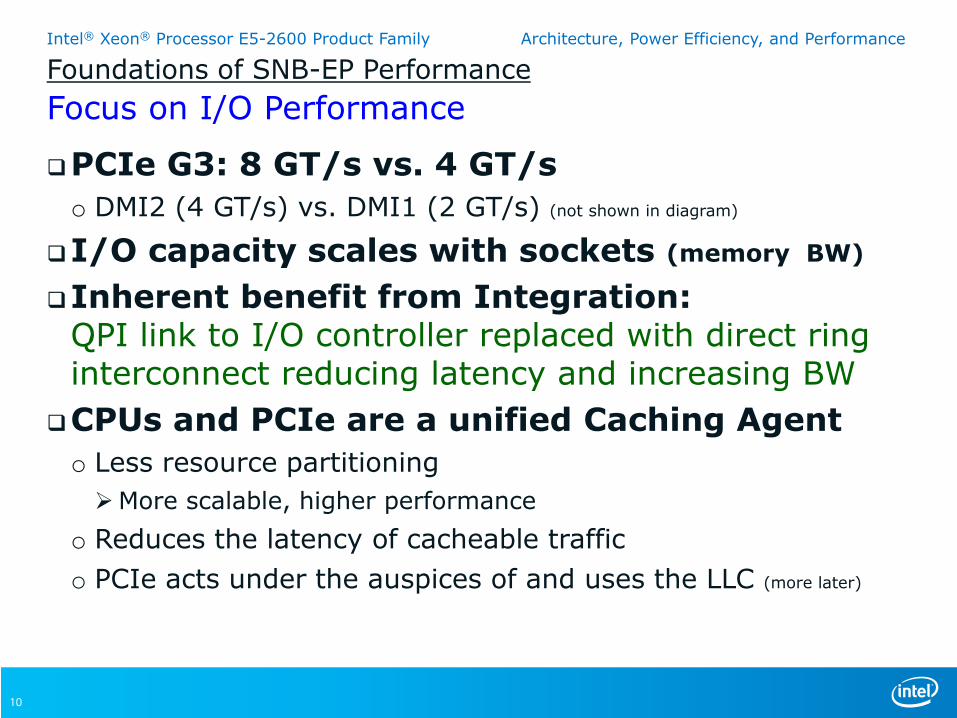
Foundations of SNB-EP Performance
Focus on I/O Performance
PCIe G3: 8 GT/s vs. 4 GT/s
o DMI2 (4 GT/s) vs. DMI1 (2 GT/s) (not shown in diagram)
I/O capacity scales with sockets (memory BW)
Inherent benefit from Integration: QPI link to I/O controller replaced with direct ring interconnect reducing latency and increasing BW
CPUs and PCIe are a unified Caching Agent
o Less resource partitioning
More scalable, higher performance
o Reduces the latency of cacheable traffic
o PCIe acts under the auspices of and uses the LLC (more later)
Intel® Xeon® Processor E5-2600 Product Family Architecture, Power Efficiency, and Performance
11
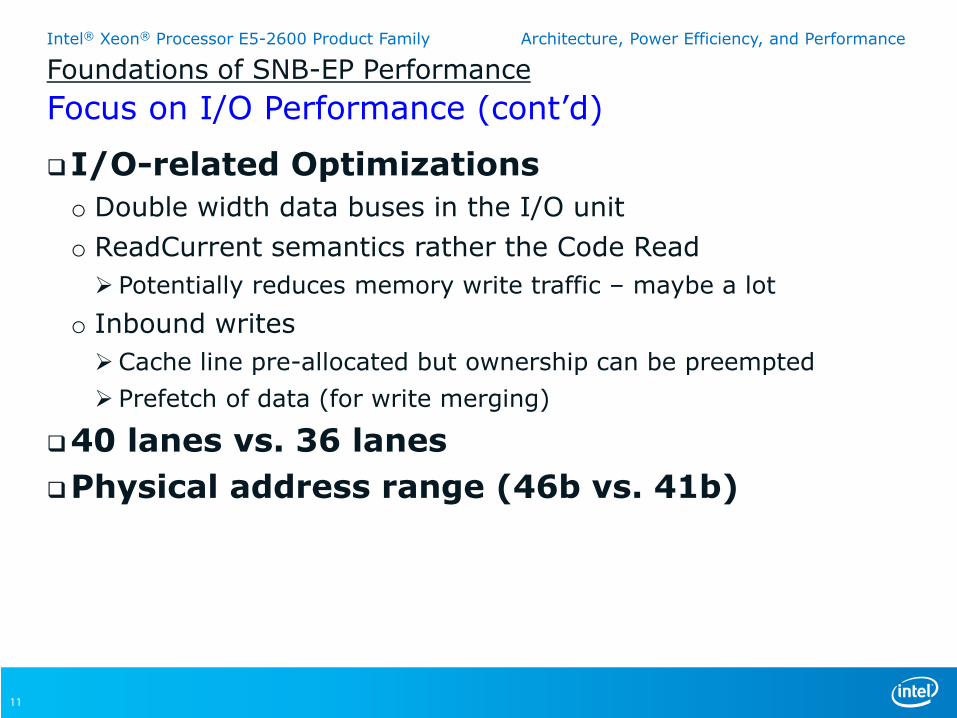
Foundations of SNB-EP Performance
Focus on I/O Performance (cont’d)
I/O-related Optimizations
o Double width data buses in the I/O unit
o ReadCurrent semantics rather the Code Read
Potentially reduces memory write traffic – maybe a lot
o Inbound writes
Cache line pre-allocated but ownership can be preempted
Prefetch of data (for write merging)
40 lanes vs. 36 lanes
Physical address range (46b vs. 41b)
Intel® Xeon® Processor E5-2600 Product Family Architecture, Power Efficiency, and Performance
12
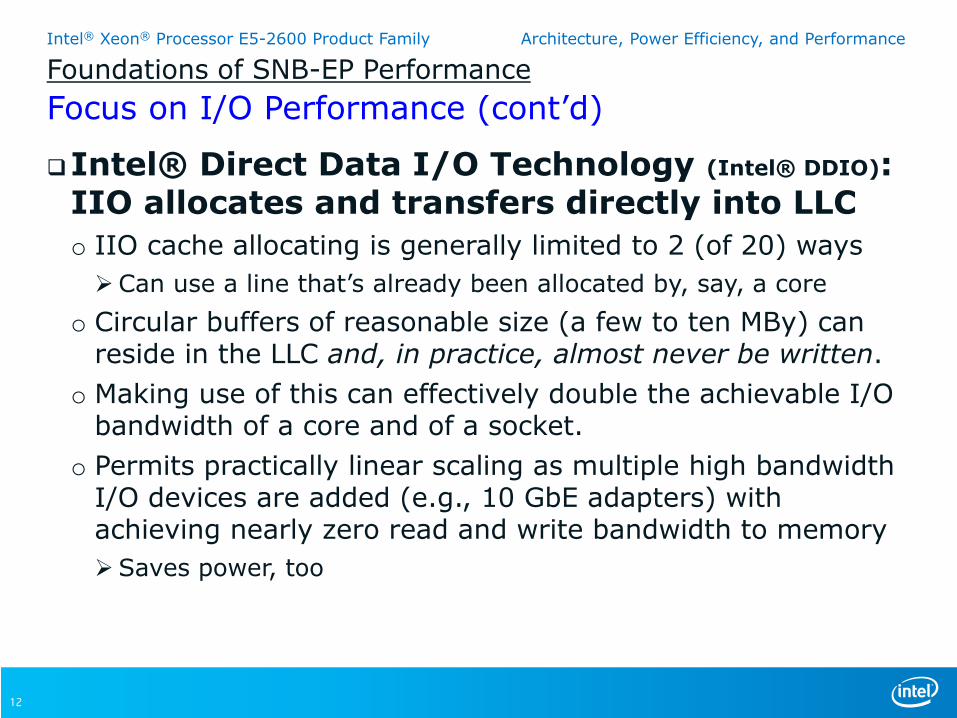
Foundations of SNB-EP Performance
Focus on I/O Performance (cont’d)
Intel® Direct Data I/O Technology (Intel® DDIO): IIO allocates and transfers directly into LLC
o IIO cache allocating is generally limited to 2 (of 20) ways
Can use a line that’s already been allocated by, say, a core
o Circular buffers of reasonable size (a few to ten MBy) can reside in the LLC and, in practice, almost never be written.
o Making use of this can effectively double the achievable I/O bandwidth of a core and of a socket.
o Permits practically linear scaling as multiple high bandwidth I/O devices are added (e.g., 10 GbE adapters) with achieving nearly zero read and write bandwidth to memory
Saves power, too
Intel® Xeon® Processor E5-2600 Product Family Architecture, Power Efficiency, and Performance
13
Mid-Game Summary
Improved performance by improving the parts
o Sandy Bridge core
o On-die interconnect (“Ring”) o More and faster memory channels with improved scheduling
o Faster inter-socket communication (Intel® QPI)
o Integrating and accelerating I/O
Coming Up in the Next Half:
Performance with Power Efficiency
Energy Efficient Load Line
14
15
Energy Efficient Load Line
2010 Intel® Xeon®
X5670
2009 Intel® Xeon®
X5570
2008 Intel® Xeon®
E5450
2006 Intel® Xeon®
5160
2012 Intel® Xeon®
E5-2660
Software and workloads used in performance tests may have been optimized for performance only on Intel microprocessors. Performance tests, such as SYSmark* and MobileMark*, are measured using specific computer systems, components, software, operations and functions. Any change to any of those factors may cause the results to vary. You should consult other information and performance tests to assist you in fully evaluating your contemplated purchases, including the performance of that product when combined with other products. Configurations: Dual Socket Server. For full configuration information, please see backup. For more information go to
http://www.intel.com/performance
Data from spec.org
Performance: 45% CAGR
Energy Efficiency: 60% CAGR
LOW
ER
is B
ET
TE
R
Server Platform Power versus Workload
HIGHER ENERGY EFFICIENCY
HIGHER PERFORMANCE
Significant Improvement to Proportional Energy
• Processor Power
• Energy Perf BIAS, Dynamic Switching
• I/O Power management
• QPI L0p/L1, PCIE ASPM L1
• Platform efficiency at low Power • CPU and DRAM VR Phase shedding
• Scalable Uncore Power • Uncore voltage frequency scaling
Software and workloads used in performance tests may have been optimized for performance only on Intel microprocessors. Performance tests, such as SYSmark* and MobileMark*, are measured using specific computer systems, components, software, operations and functions. Any change to any of those factors may cause the results to vary. You should consult other information and performance tests to assist you in fully evaluating your contemplated purchases, including the performance of that product when combined with other products. Configurations: Dual Socket Server. For full configuration information, please see backup. For more information go to
http://www.intel.com/performance
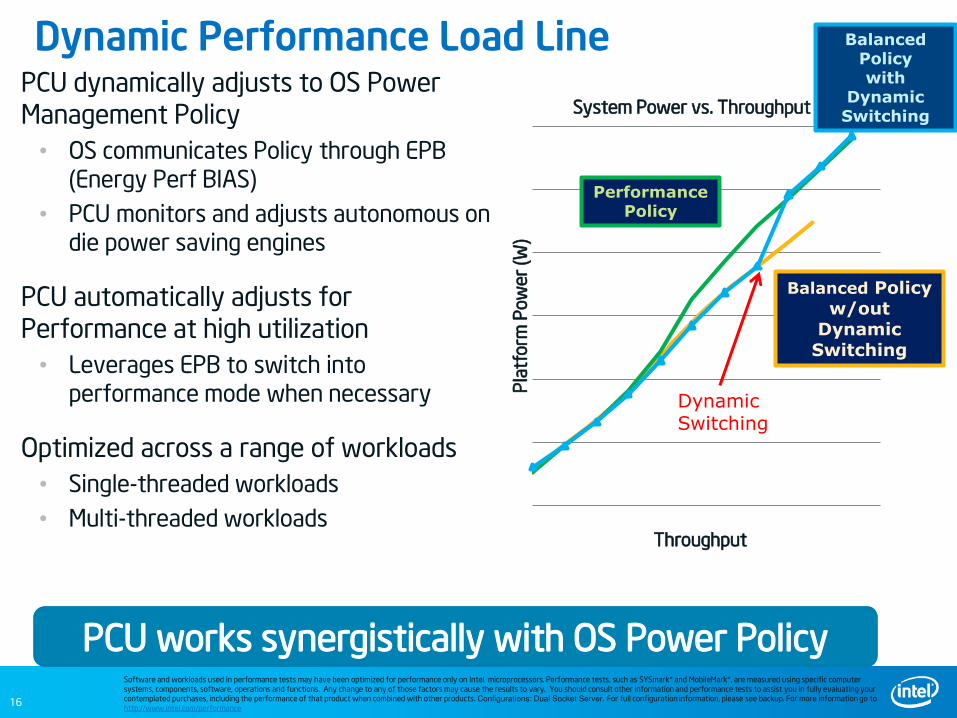
PCU works synergistically with OS Power Policy
PCU dynamically adjusts to OS Power Management Policy
• OS communicates Policy through EPB (Energy Perf BIAS)
• PCU monitors and adjusts autonomous on die power saving engines
PCU automatically adjusts for Performance at high utilization
• Leverages EPB to switch into performance mode when necessary
Intel® Xeon® Processor E5-2600 Product Family Architecture, Power Efficiency, and Performance
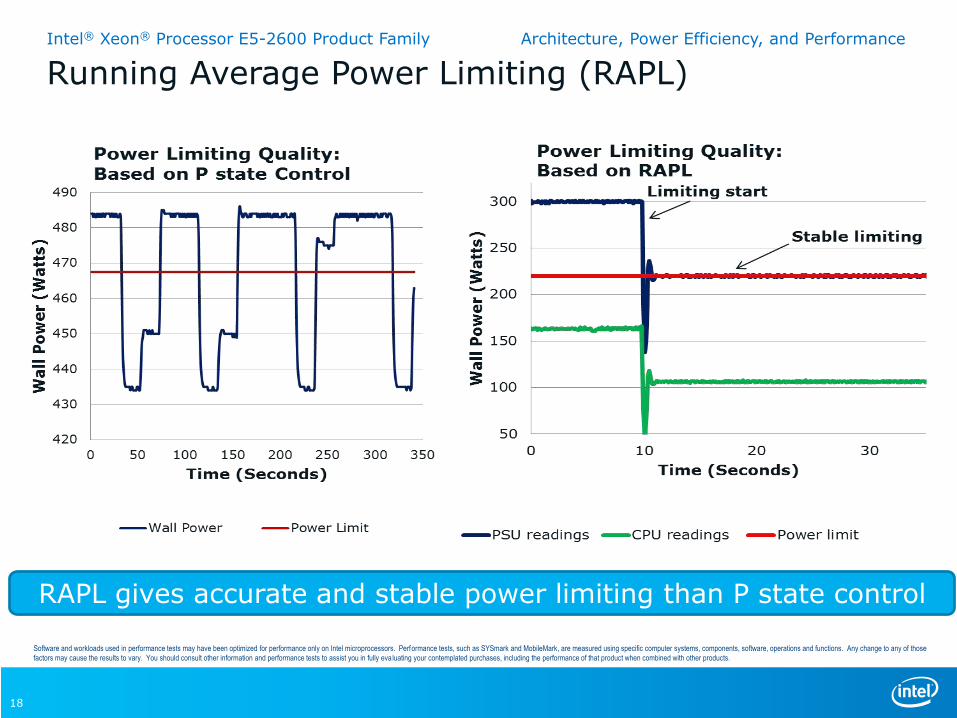
Running Average Power Limiting (RAPL)
18
Software and workloads used in performance tests may have been optimized for performance only on Intel microprocessors. Performance tests, such as SYSmark and MobileMark, are measured using specific computer systems, components, software, operations and functions. Any change to any of those factors may cause the results to vary. You should consult other information and performance tests to assist you in fully eva luating your contemplated purchases, including the performance of that product when combined with other products.
RAPL gives accurate and stable power limiting than P state control
Intel® Xeon® Processor E5-2600 Product Family Architecture, Power Efficiency, and Performance
19
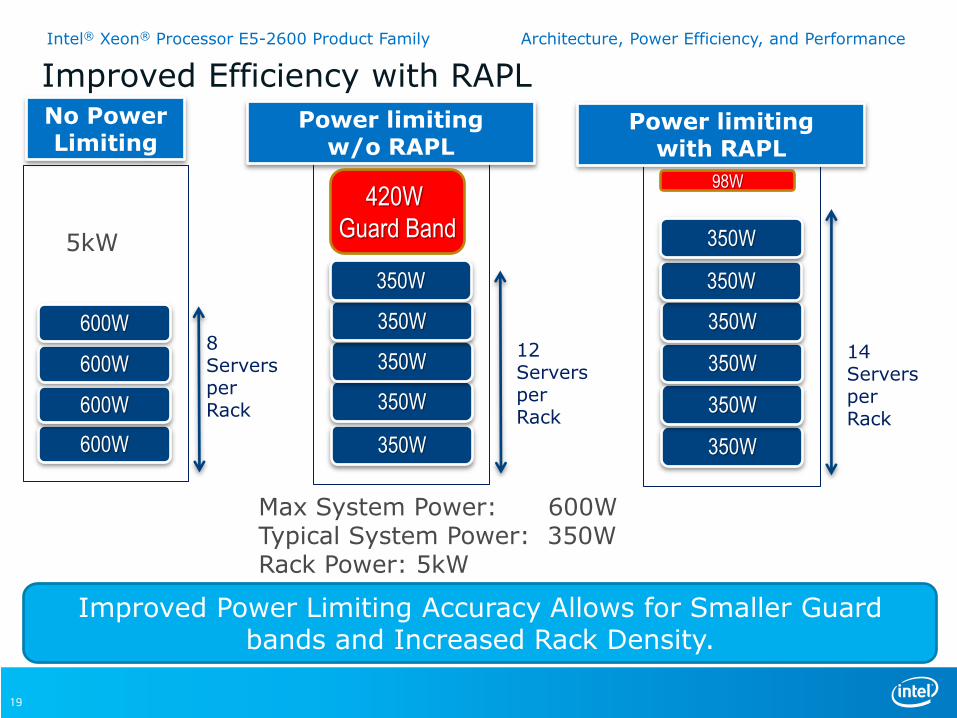
Improved Efficiency with RAPL
350W
350W
350W
350W 12 Servers per Rack
350W
8 Servers per Rack
600W
600W
600W
600W
No Power Limiting
Power limiting w/o RAPL
420W Guard Band
350W
350W
350W
350W
14 Servers per Rack
350W
Power limiting with RAPL
98W
350W
Improved Power Limiting Accuracy Allows for Smaller Guard bands and Increased Rack Density.
5kW
Max System Power: 600W Typical System Power: 350W Rack Power: 5kW
Intel® Xeon® Processor E5-2600 Product Family Architecture, Power Efficiency, and Performance
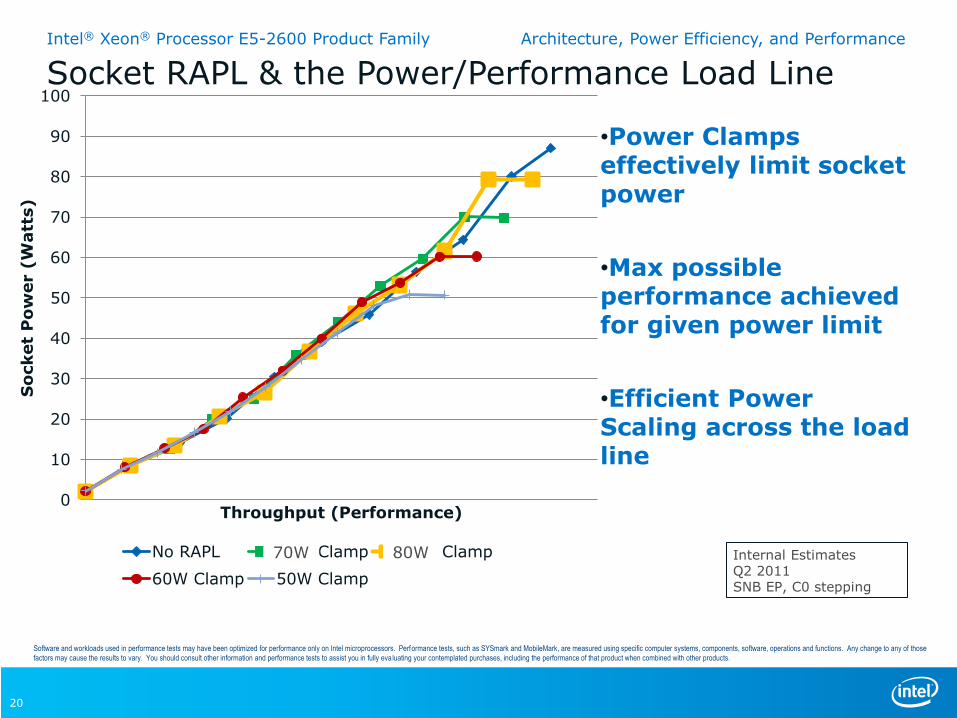
Socket RAPL & the Power/Performance Load Line
•Power Clamps effectively limit socket power
•Max possible performance achieved for given power limit
•Efficient Power Scaling across the load line
20
0
10
20
30
40
50
60
70
80
90
100
So
cket
Po
wer (
Watt
s)
Throughput (Performance)
No RAPL 80W Clamp 70W Clamp
60W Clamp 50W Clamp
Internal Estimates Q2 2011 SNB EP, C0 stepping
Software and workloads used in performance tests may have been optimized for performance only on Intel microprocessors. Performance tests, such as SYSmark and MobileMark, are measured using specific computer systems, components, software, operations and functions. Any change to any of those factors may cause the results to vary. You should consult other information and performance tests to assist you in fully eva luating your contemplated purchases, including the performance of that product when combined with other products.
70W 80W
Maximum Performance
21
Intel® Xeon® Processor E5-2600 Product Family Architecture, Power Efficiency, and Performance
Software and workloads used in performance tests may have been optimized for performance only on Intel microprocessors. Performance tests, such as SYSmark and MobileMark, are measured using specific computer systems, components, software, operations and functions. Any change to any of those factors may cause the results to vary. You should consult other information and performance tests to assist you in fully eva luating your contemplated purchases, including the performance of that product when combined with other products.
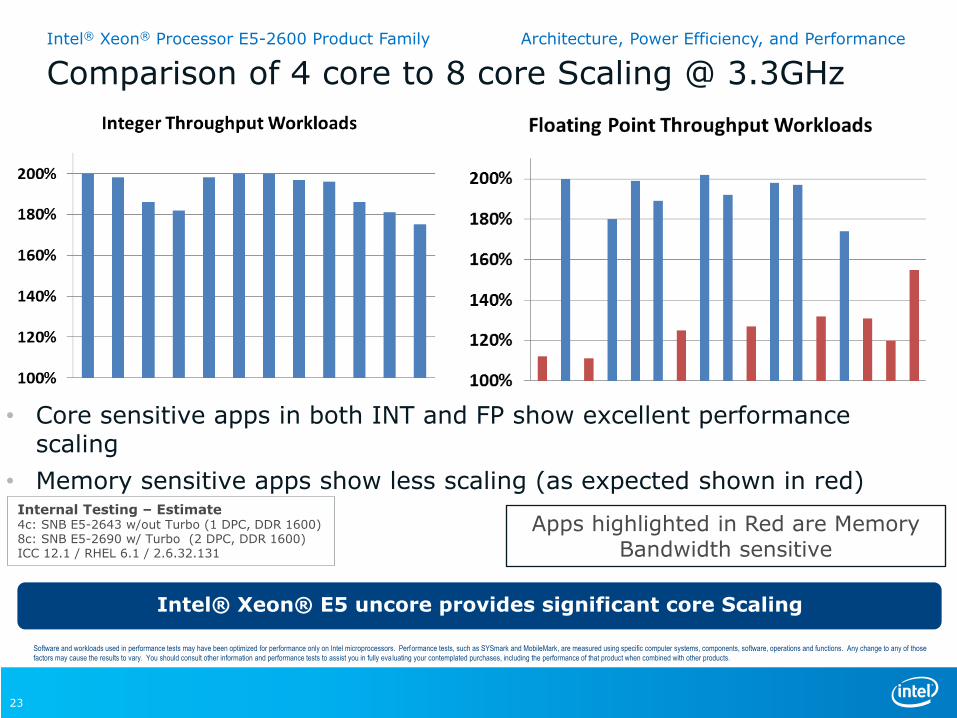
Apps highlighted in Red are Memory Bandwidth sensitive
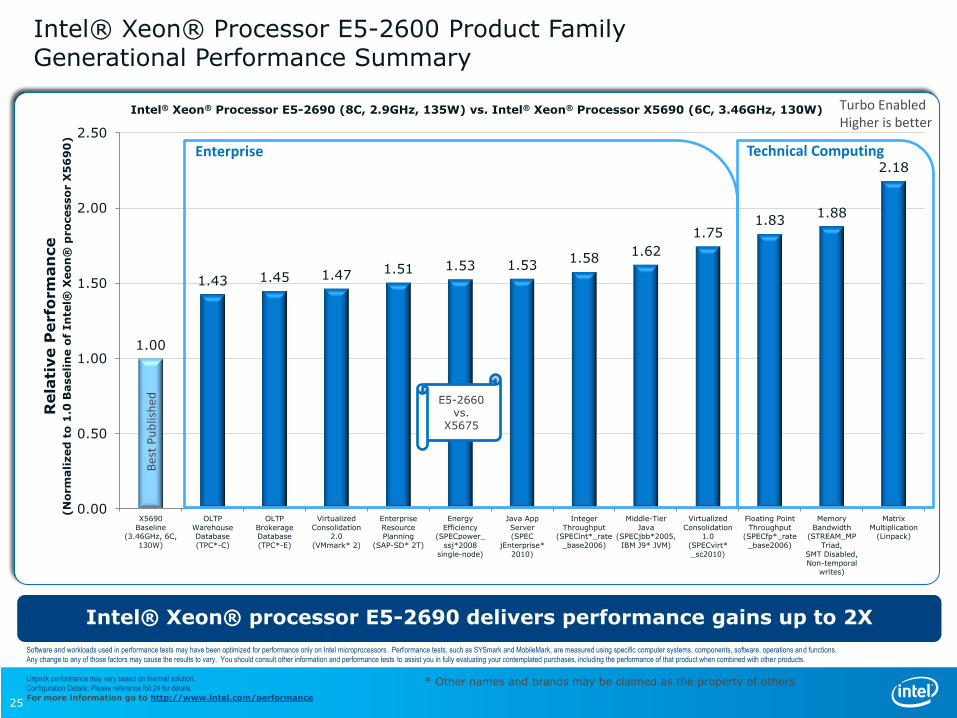
Intel® Xeon® Processor E5-2600 Product Family Architecture, Power Efficiency, and Performance Intel® Xeon® Processor E5-2600 Product Family Generational Performance Summary
Intel® Xeon® processor E5-2690 delivers performance gains up to 2X
25
Enterprise Technical Computing B
est
Pu
bli
she
d
Software and workloads used in performance tests may have been optimized for performance only on Intel microprocessors. Performance tests, such as SYSmark and MobileMark, are measured using specific computer systems, components, software, operations and functions. Any change to any of those factors may cause the results to vary. You should consult other information and performance tests to assist you in fully evaluating your contemplated purchases, including the performance of that product when combined with other products. Linpack performance may vary based on thermal solution. Configuration Details: Please reference foil 24 for details. For more information go to http://www.intel.com/performance
E5-2660 vs.
X5675
* Other names and brands may be claimed as the property of others