THE IRON and STEEL INDUSTRY October 2007 Policy Research and Strategic Planning A State Affiliate of the U.S. Census Bureau Ted Strickland, Governor of Ohio Lee Fisher, Lt. Governor of Ohio Director, Ohio Department of Development
Transcript
THE IRON and STEEL INDUSTRY
October 2007
Policy Research and Strategic Planning
A State Affiliate of the U.S. Census Bureau
Ted Strickland, Governor of Ohio Lee Fisher, Lt. Governor of Ohio Director, Ohio Department of Development
THE OHIO IRON AND STEEL INDUSTRY
OCTOBER 2007
BA8 Don Larrick, Principal Analyst Policy Research and Strategic Planning, Ohio Department of Development
P.O. Box 1001, Columbus, Oh. 43216-1001 Production Support:
James Kell and Steve Kelley, Editors Robert Schmidley, GIS Specialist
Table A1: Notable Iron and Steel Industry Companies in Ohio, 2007 45 Table A2: Expansion and Attraction Announcements in Ohio’s Iron and Steel Industry, 2004-2006 - - - - - 49 Table A3a: Distribution of Iron and Steel Value-Added in Ohio, 2002 51 Table A3b: Value-Added in the Iron and Steel Industry by Group, 2005- - - - - - - - - - - - - - - - - - - - - - - - - - 52 Table A4: Iron and Steel Industry Establishments and Employment, 2005 Means and Percentages 53 Table A5: Iron and Steel Industry Employment and Payroll, 2005 Means and Ratios - - - - - - - - - - - - - - - 54 Table A6: Iron and Steel Industry Establishments and Employment by County, 2005 55 Table A7: Iron and Steel Industry Establishment Trends, Ohio and the U.S.: 1998-2005- - - - - - - - - - - - - 56 Table A8: Iron and Steel Industry Employment Trends, Ohio and the U.S.: 1998-2005 57 Table A9: Raw Steel Production in Ohio and the U.S., 1969-2006 - - - - - - - - - - - - - - - - - - - - - - - - - - - - 58 Table A10: Value-Added by Group in Ohio and the U.S., 1997-2005 59 Table A11: Capital Expenditures by Group in Ohio and the U.S., 1997-2005- - - - - - - - - - - - - - - - - - - - - - 60 Table A12: U.S. Exports and Imports and Apparent Supply of Steel Mill Products, 1969-2006 61 Table A13: Projections of Iron and Steel Industry Employment by Group, Ohio and the U.S.: 2004-2014- - 62
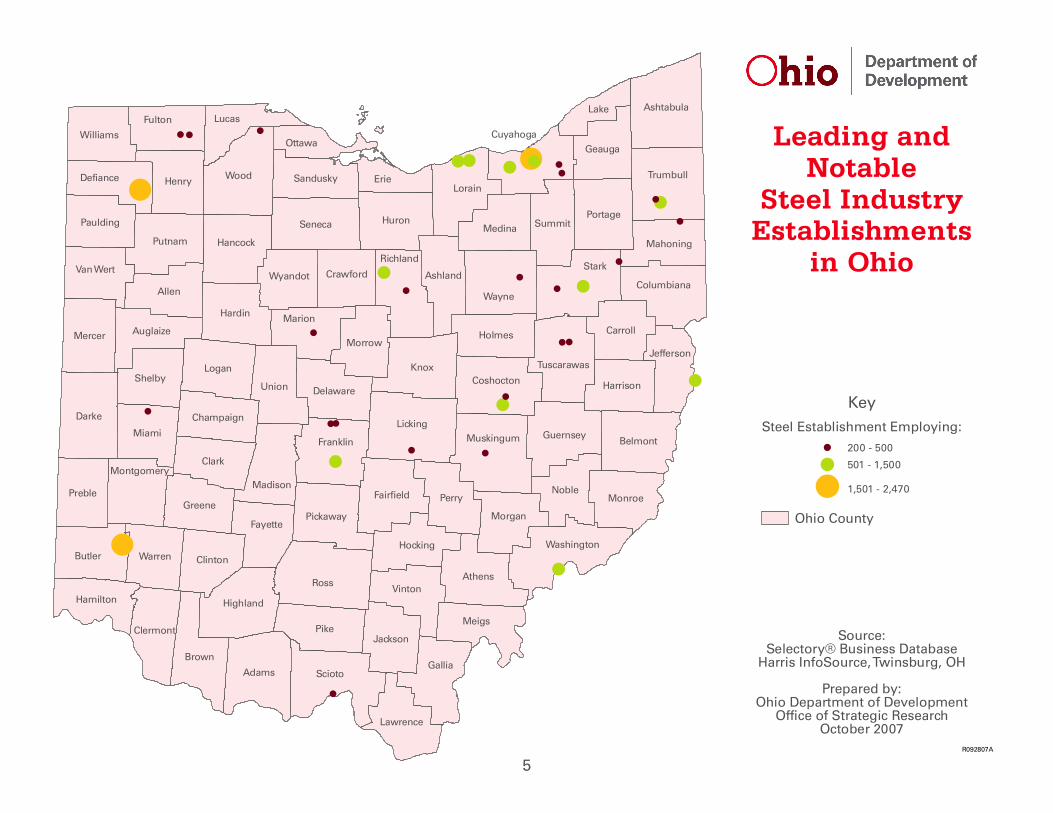
NOTABLE IRON AND STEEL INDUSTRY MANUFACTURERS Thirteen companies on Fortune magazine’s U.S.-1,000 or Global-500 lists have iron and steel industry establishments in Ohio. Three of them maintain their world headquarters in Ohio: AK Steel, Timken, and Worthington Industries. AK Steel is the largest industry employer in Ohio with over 4,000, followed by ArcelorMittal with 2,500-plus, and Industrias’ Republic Engineered Products with over 2,000. Other companies with between 1,000 and 2,000 industry workers in the state in-clude Charter Manufacturing, Ford Motor Co., General Motors (GM), Renco’s WCI Steel, Timken, Esmark’s Wheeling-Pittsburgh Steel, and Worthington Industries. Ford and GM have the state’s largest foundry operations.1 The map above shows the locations of the 35 establishments with at least 200 employees. The list below includes the Fortune companies with at least 50 people at a site as well as other companies employing 200 or more people in Ohio and having at least 50 people at a site.2 It is organized by NAICS code and includes the location city of the site. Iron and steel manufacturing is not the principal business of some companies on the list. However, the sites of such companies are included because the primary NAICS codes of the specific establishments define them as part of the industry. Primary Location Jobs# Industry Group/Company/Subsidiary NAICS City at Site 3311: Iron & Steel Mills & Ferroalloys AK Steel Corp.* 331111 Coshocton 584 AK Steel Corp.* 331111 Dover 218 AK Steel Corp.*1 331111 Mansfield 389 AK Steel Corp.*2 331111 Middletown 2,200 AK Steel Corp.*3 331111 West Chester 150 AK Steel Corp.*1 331111 Zanesville 218 Allegheny Technologies, Inc.*/Allegheny Ludlum Corp. 331111 Louisville 145 Apollo Advisors, LP/Metals USA, Inc.*/Metals USA Carbon Flat Rolled 331111 Wooster 112 ArcelorMittal Steel Co. NV*/International Steel Group 331111 Warren 135 ArcelorMittal Steel Co. NV* 331111 Cleveland 1,600 Asahi Tec Corp./Metaldyne Corp. 331111 Cleveland 200 BlueScope Steel Ltd.-Cargill, Inc./North Star BlueScope Steel LLC 331111 Delta 330 Charter Manufacturing Co., Inc./Charter Steel – Cleveland, Inc. 331111 Cleveland 992 Industrias CH/Republic Engineered Products6 331111 Canton 644 Industrias CH/Republic Engineered Products 331111 Fairlawn 150
6
pevans
dodlogocolor
Primary Location Jobs# Industry Group/Company/Subsidiary NAICS City at Site 3311: Iron & Steel Mills & Ferroalloys (continued) Industrias CH/Republic Engineered Products7 331111 Lorain 1,200 Industrias CH/Republic Engineered Products – Central Fabrication8 331111 Massillon 215 Nucor Corp.*/Nucor Steel Marion, Inc.4 331111 Marion 405 Renco Group, Inc./WCI Steel, Inc. 331111 Warren 1,280 Shiloh Industries, Inc./Liverpool Coil Processing, Inc. 331111 Valley City 101 Timken Co.* - Faircrest and Harrison plants10 331111 Canton n.a. United States Steel Corp.*/Lorain Pipe Mill 331111 Lorain 550 Wheeling-Pittsburgh Steel Corp.*1, 11 331111 Mingo Junction 1,140 Worthington Industries, Inc.*/Dietrich Industries, Inc. 331111 Warren 180 Eramet SA/Marietta Eramet, Inc. 331112 Marietta 550 3312: Steel Products from Purchased Steel AK Steel Corp.*/AK Tube LLC 33121 Walbridge 300 ArcelorMittal Steel Co. NV*/Dofasco Tubular Products Corp.1 33121 Shelby 666 ArcelorMittal Steel Co. NV*/Marion Dofasco, Inc.4 33121 Marion 125 Jackson Tube Service, Inc.1 33121 Piqua 313 PTC Alliance Corp./Alliance Tubular Products Co.14 33121 Alliance 250 Salzgitter AG/V & M Star LP 33121 Youngstown 430 TI Group plc/TI Group Automotive Systems13 33121 Hebron 195 TI Group plc/TI Group Automotive Systems 33121 Washington CH 68 Timken Co.* - Gambrinus plant10 33121 Canton n.a. Welded Tube of Canada, Inc. 33121 Delta 350 Greer Industries, Inc./Greer Steel Co. 331221 Dover 250 Mitsubishi Corp.*-Sojitz Corp./Coilplus-Ohio, Inc. 331221 Springfield 55 Tata Group/Corus Group*/Thomas Strip Steel Corp.9 331221 Warren 500 Wheeling-Pittsburgh Steel Corp.*1, 11 331221 Yorkville n.a. Worthington Industries, Inc.*12 331221 Columbus 400 Worthington Industries, Inc.* 331221 Worthington 250 American Spring Wire Corp.1 331222 Cleveland 238
7
pevans
dodlogocolor
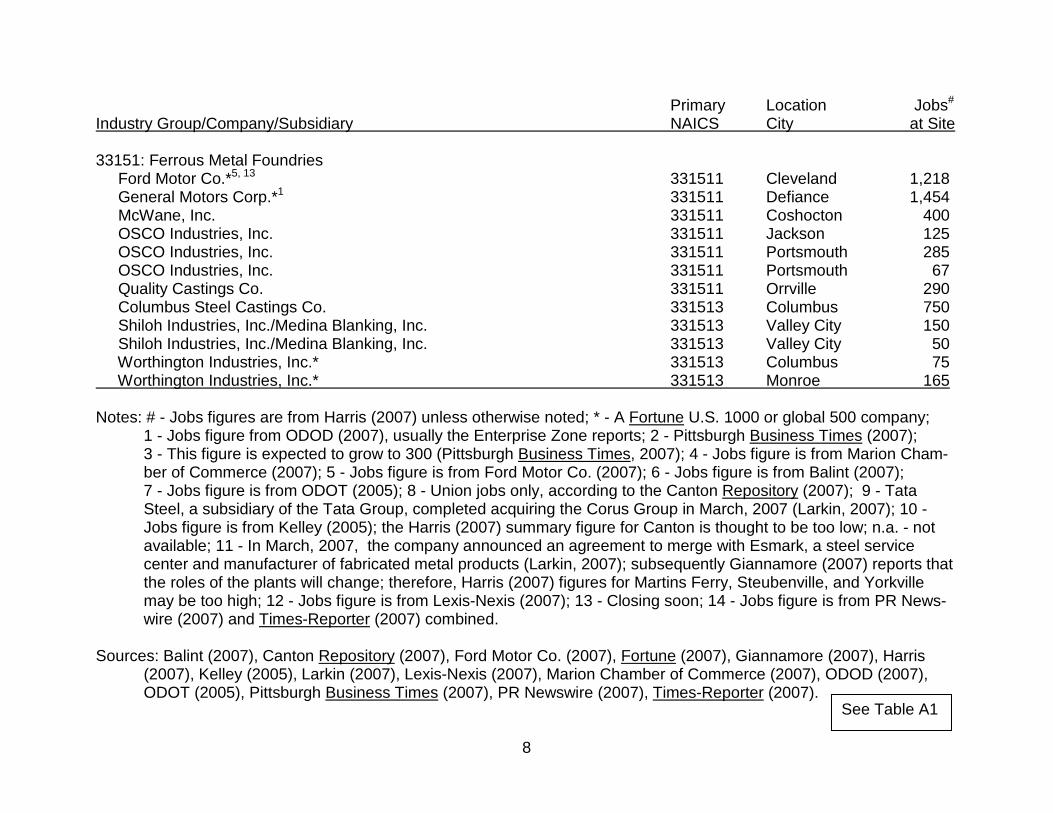
Primary Location Jobs# Industry Group/Company/Subsidiary NAICS City at Site 33151: Ferrous Metal Foundries Ford Motor Co.*5, 13 331511 Cleveland 1,218 General Motors Corp.*1 331511 Defiance 1,454 McWane, Inc. 331511 Coshocton 400 OSCO Industries, Inc. 331511 Jackson 125 OSCO Industries, Inc. 331511 Portsmouth 285 OSCO Industries, Inc. 331511 Portsmouth 67 Quality Castings Co. 331511 Orrville 290 Columbus Steel Castings Co. 331513 Columbus 750 Shiloh Industries, Inc./Medina Blanking, Inc. 331513 Valley City 150 Shiloh Industries, Inc./Medina Blanking, Inc. 331513 Valley City 50 Worthington Industries, Inc.* 331513 Columbus 75 Worthington Industries, Inc.* 331513 Monroe 165 Notes: # - Jobs figures are from Harris (2007) unless otherwise noted; * - A Fortune U.S. 1000 or global 500 company;
1 - Jobs figure from ODOD (2007), usually the Enterprise Zone reports; 2 - Pittsburgh Business Times (2007); 3 - This figure is expected to grow to 300 (Pittsburgh Business Times, 2007); 4 - Jobs figure is from Marion Cham-ber of Commerce (2007); 5 - Jobs figure is from Ford Motor Co. (2007); 6 - Jobs figure is from Balint (2007); 7 - Jobs figure is from ODOT (2005); 8 - Union jobs only, according to the Canton Repository (2007); 9 - Tata Steel, a subsidiary of the Tata Group, completed acquiring the Corus Group in March, 2007 (Larkin, 2007); 10 - Jobs figure is from Kelley (2005); the Harris (2007) summary figure for Canton is thought to be too low; n.a. - not available; 11 - In March, 2007, the company announced an agreement to merge with Esmark, a steel service center and manufacturer of fabricated metal products (Larkin, 2007); subsequently Giannamore (2007) reports that the roles of the plants will change; therefore, Harris (2007) figures for Martins Ferry, Steubenville, and Yorkville may be too high; 12 - Jobs figure is from Lexis-Nexis (2007); 13 - Closing soon; 14 - Jobs figure is from PR News-wire (2007) and Times-Reporter (2007) combined.
Sources: Balint (2007), Canton Repository (2007), Ford Motor Co. (2007), Fortune (2007), Giannamore (2007), Harris (2007), Kelley (2005), Larkin (2007), Lexis-Nexis (2007), Marion Chamber of Commerce (2007), ODOD (2007), ODOT (2005), Pittsburgh Business Times (2007), PR Newswire (2007), Times-Reporter (2007).
8
See Table A1
pevans
dodlogocolor
Expansion/Attraction Announcements in Ohio's Iron & Steel Industryby Group: 2004-2006
$0.0
$100.0
$200.0
$300.0
$400.0
$500.0
$600.0
Agg
rega
te V
alue
s(in
Mill
ions
)
0
50
100
150
200
250
300
350
400
450
Ant
icip
ated
New
Job
s
Aggregate Value of Announced Investments $541.6 $18.6 $186.8
Anticipated New Jobs 393 49 121
3311: Iron & Steel Mills & Ferroalloys 3312: Steel Products from Purchased Steel 33151: Ferrous Foundries
Source: Ohio Dept. of Development
9
RECENT EXPANSION AND ATTRACTION ANNOUNCEMENTS Thirty-four major iron and steel industry investments in Ohio were announced by 28 companies during the 2004-2006 period (Office of Strategic Research, 2007). The value of the projects totaled $747.0 million (M), and 563 new jobs were anticipated with the completion of all projects. The largest number of projects – 13, as well as possible new jobs – 316, was announced in 2004. 2004 also saw the largest anticipated investment amount – a $341.1M.3 The chart above shows that $541.6M was intended for iron, steel, and ferroalloy products (NAICS 3311) during the 2004-2006 period. This is followed by $186.8M for ferrous foundries (33151), with GM’s investments in its Defiance plant com-prising about almost 90% of that. The remaining funds – $18.6M – are earmarked for plants making products from pur-chased steel (3312). While no one company dominated investment activity, several companies made notably large investments during these years. These include General Motors – $167.9M, Warren Steel Fabricating – $130M, Charter Steel – $102.8M, AK Steel – $73.5, Renco’s WCI Steel – $66.0M, ArcelorMittal – $55.2M, and Republic Engineered Products – $54.0M. Other com-panies investing at least $10.0M include Allegheny Ludlum and Wheeling-Pittsburgh Steel. ArcelorMittal also anticipates adding 190 new jobs when their projects are completed – the largest number by any company. These counts are derived from a list of major investments compiled by OSR (2007). To be included, a major investment must meet at least one of the following criteria: 20,000 square feet of new space; $1M to be spent for land, building(s), or equipment; or 50 new jobs. Many of the major investments are phased in over a two-to-three year cycle, with production and employee counts phased in after project completion. The data are not comparable with the Census data on capital expenditures.
10
See Table A2
pevans
dodlogocolor
Value Added in Ohio's Iron & Steel Industry, 2002Total: $4,412.9 Million--100.0%
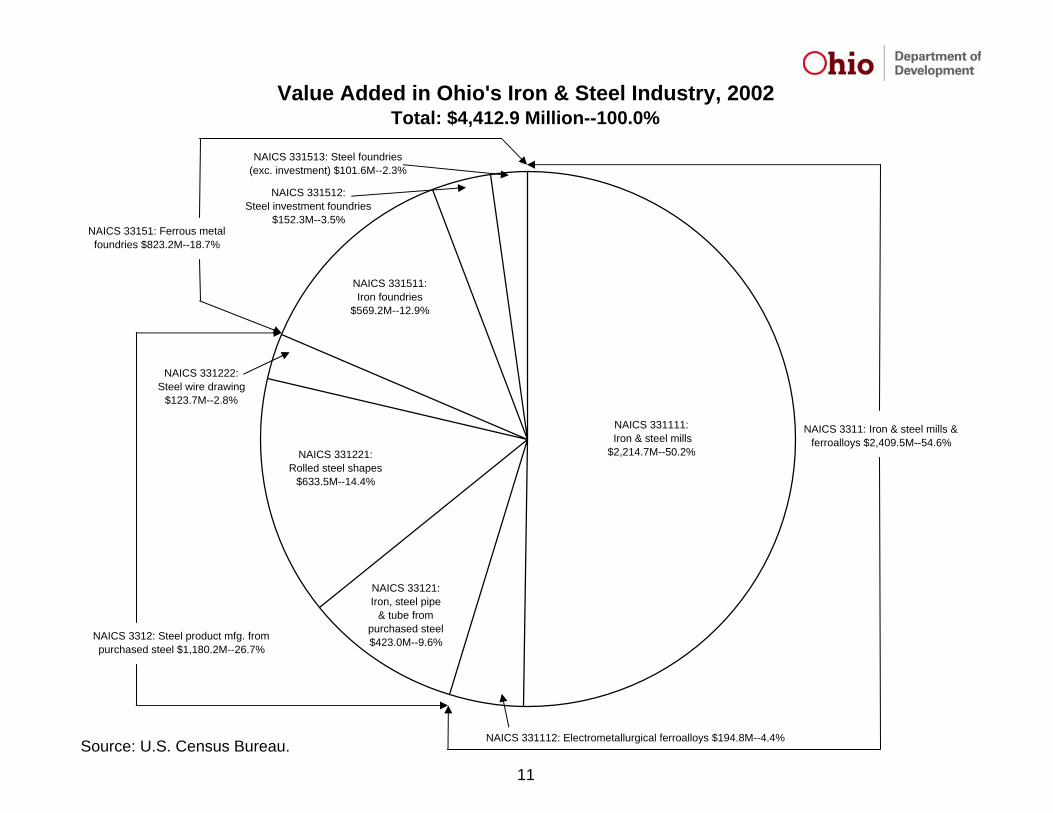
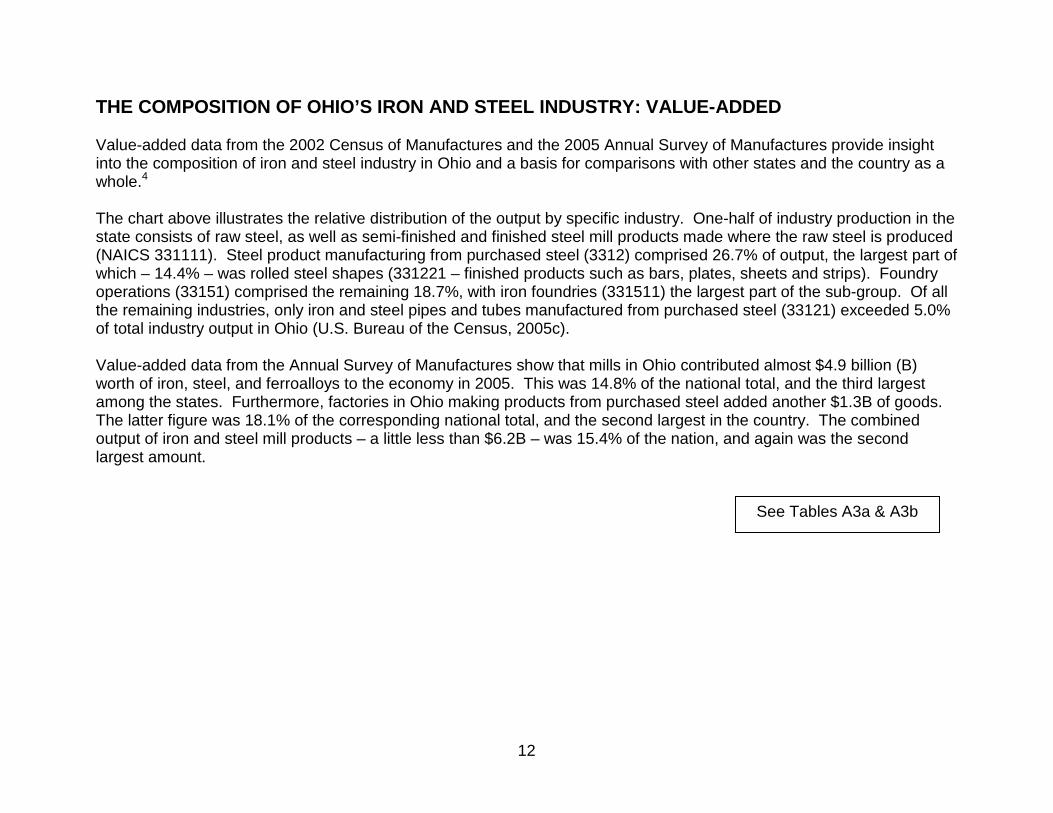
THE COMPOSITION OF OHIO’S IRON AND STEEL INDUSTRY: VALUE-ADDED Value-added data from the 2002 Census of Manufactures and the 2005 Annual Survey of Manufactures provide insight into the composition of iron and steel industry in Ohio and a basis for comparisons with other states and the country as a whole.4 The chart above illustrates the relative distribution of the output by specific industry. One-half of industry production in the state consists of raw steel, as well as semi-finished and finished steel mill products made where the raw steel is produced (NAICS 331111). Steel product manufacturing from purchased steel (3312) comprised 26.7% of output, the largest part of which – 14.4% – was rolled steel shapes (331221 – finished products such as bars, plates, sheets and strips). Foundry operations (33151) comprised the remaining 18.7%, with iron foundries (331511) the largest part of the sub-group. Of all the remaining industries, only iron and steel pipes and tubes manufactured from purchased steel (33121) exceeded 5.0% of total industry output in Ohio (U.S. Bureau of the Census, 2005c). Value-added data from the Annual Survey of Manufactures show that mills in Ohio contributed almost $4.9 billion (B) worth of iron, steel, and ferroalloys to the economy in 2005. This was 14.8% of the national total, and the third largest among the states. Furthermore, factories in Ohio making products from purchased steel added another $1.3B of goods. The latter figure was 18.1% of the corresponding national total, and the second largest in the country. The combined output of iron and steel mill products – a little less than $6.2B – was 15.4% of the nation, and again was the second largest amount.
12
See Tables A3a & A3b
pevans
dodlogocolor
Employment in Ohio's Iron and Steel Industry, 2005
THE COMPOSITION OF OHIO’S IRON AND STEEL INDUSTRY: EMPLOYMENT 234 establishments employed 34,000 people in Ohio’s iron and steel industry in 2005. The chart above shows that the industry was dominated by the iron and steel mills and ferroalloys group (NAICS 3311), which had 50.2% of the industry’s employment in the state. The 15,300-plus iron and steel workers (331111) at 67 plants were the largest portion of indus-try employment: 45.1%. The production of metals used in making alloy steel (331112) occupied 1,700-plus people – 5.1% of industry employment at six plants. Ferrous metal foundry work (33151) was the second largest segment of the industry with 10,300-plus employees, or 30.4% of the industry total; 7,800-plus – 23.0% – worked in iron foundries (331511). Although there were 62 iron found-ries, most of the jobs probably were located at just two: the motor vehicle engine block casting plants of Ford in Cleveland and General Motors in Defiance. Employment in steel foundries (331512 and 331513) amounted to just over 2,500 jobs – 7.4% of industry employment – at 28 plants. The vast majority of workers making products from purchased steel (3312) were producing either pipes-and-tubes (33121 – 3,200-plus jobs at 28 plants) or rolling steel shapes (331221 – 2,900 jobs at 30 plants). Steel wire drawing (331222) employed less than 500 people at 13 plants. All told, the 6,600 employees in this group held 19.4% of all iron and steel industry jobs. Comparisons with national figures are also instructive. Appendix table A4 shows that Ohio’s portion of all U.S. private non-farm establishments with employees amounted to 3.6%. Similarly, Ohio’s portion of all employees at such establish-ments was 4.1%. The table also shows that 9.5% of the nation’s iron and steel industry establishments and 13.6% of its jobs are located in Ohio, indicating the concentration of the industry here. Some specific industries are particularly con-centrated in the state. These include making iron and steel pipes and tubes from purchased steel – 12.2% and 15.7% of such plants and jobs in the country; rolled steel shapes – 15.9% and 28.1% of corresponding plants and jobs; and electro-metallurgical ferroalloy products – an astounding 24.0% and 69.7% of plants and jobs.
Ohio as Percent of U.S. 91.7% 111.9% 101.7% 104.0% 98.4% 114.8% 102.8% 126.4% 110.3% 136.0% 124.0% 130.5% 93.3% 100.8%
Ttl. Cvrd. Emplymnt.
Iron & steel industry
3311: I. & S. mills, F-alloys
331111: Iron & steel mills
331112: Elctrmtllrgcl.
F-alloy
3312: Stl. Prdcts. frm Prchsd. Stl.
33121: I. & S. pipe &
tube
33122: Rllng. & Drwng.
Prchsd. Stl.
331221: Rlld. Stl. Shps.
331222: Stl. Wr.Drwng.
33151: Frrs. Mtl. Fndrs.
331511: I. Fndrs.
331512: Stl. Invstmnt Fndrs.
331513: Stl. Fndrs. (Exc.
Invstmnt)
15
Source: U.S. Census Bureau.
INDUSTRY WAGES The average annual wage for an Ohio iron and steel industry worker was $59,686 in 2005. This is far greater than the overall average for non-farm employees here – $35,348. Annual averages vary among the specific industries. The highest paying industries were iron and steel mills (331111 – $67,262) and iron foundries (331511 – $60,808). This contrasts with the pay in steel foundries (NAICS 331512-3), which averaged between $36,400 and $43,300. Other industries ranged in pay from a little less than $48,000 to a little over $55,000. The graph above also shows that average pay in Ohio’s iron and steel industry was greater than the national average: $59,686 vs. $53,352. It was much higher in some industries – over 130% of the national averages in steel wire drawing and iron foundries. However, pay was not uniformly higher in every specific industry. The exceptions were steel invest-ment foundries (33152) and electrometallurgical ferroalloys (331112), where pay in Ohio was 93.3% and 98.4% of the corresponding national averages.
16
See Table A5
pevans
dodlogocolor
Ross
Darke
Pike
GalliaBrown
Athens
Union
Meigs
Preble Noble
Belmont
Highland
Vinton
Carroll
Monroe
FayettePickaway Morgan
Hocking
Ashland
Morrow
Harrison
Lawrence
Van WertCrawford
Champaign
Huron
Clermont
Paulding
Stark15
Wood2
Licking1
Knox2
Scioto2
Adams1
Wayne5
Lorain4
Butler6
Perry1
Seneca2
Allen2
Ashtabula2
Trumbull11
Hardin2
Franklin9
Henry1
Portage1
Mercer1
Hancock3
Fairfield2
Fulton5
Miami5
Putnam1
Erie2
Richland5
Lucas5
Clinton1
Medina5
Marion3
Guernsey1
Warren1
Holmes2
Madison2
Jackson2
Geauga1
Summit10
Delaware2
Williams2
Defiance1
Auglaize1
Cuyahoga34
Hamilton5
Sandusky1
Mahoning8
Ottawa1
Clark1
Logan1Shelby
1
Muskingum2
Greene1
Coshocton3
Tuscarawas4
Lake7
Columbiana11
Wyandot1
Jefferson3
Montgomery11
Washington7
R092807A
Steel IndustryEstablishments
in Ohioby County
2005
17
Source:2005 County Business Patterns
U.S. Census Bureau
Prepared by:Ohio Department of Development
Office of Strategic ResearchOctober 2007
Number ofEstablishments
in County
13 - 34
6 - 12
3 - 5
1 - 2
None
THE DISTRIBUTION OF INDUSTRY ESTABLISHMENTS IN OHIO The map above illustrates the distribution of 234 iron and steel industry establishments across Ohio in 2005. Fifty-nine counties have at least one industry establishment. However, the majority were located in 10 counties: Cuyahoga – 34, Stark – 15, Columbiana, Montgomery and Trumbull –11 each, Summit – 10, Franklin – nine, Mahoning – eight, and Lake and Washington – seven each. Eight counties had five or six establishments, and 41 counties had from one to four estab-lishments. The map above also illustrates the concentration of industry establishments in Northeastern Ohio. In particular, nine counties – Columbiana, Cuyahoga, Lake, Lorain, Mahoning, Stark, Summit, Trumbull, and Wayne – form a contiguous area with 105 establishments, or 44.9% of the industry in Ohio. The other counties with relatively large numbers of estab-lishments – Butler, Franklin, Montgomery, and Washington – are scattered across the state.
18
See Table A6
pevans
dodlogocolor
Ross
Pike
Gallia
Huron
Brown
Athens
Meigs
Vinton
Highland
Fayette
Ashland
Clermont
Paulding
Lawrence
Van WertCrawford
Darke
Union
PrebleNoble
Belmont
Carroll
Monroe
PickawayMorgan
Hocking
Morrow
Harrison
Champaign
Stark4,003
Wood158
Licking7
Knox81
Scioto209
Adams7
Wayne478
Lorain1,333
Butler3,953
Perry333
Clark28
Seneca43
Allen115
Logan66
Ashtabula115
Trumbull2,761
Hardin70
Franklin809
Henry28
Portage15
Mercer28
Hancock60
Fairfield5
Fulton383
Miami518
Putnam66
Erie285
Richland971
Shelby15
Muskingum476
Lucas202
Clinton15
Greene28
Medina222
Marion491
Guernsey143
Warren28
Washington809
Holmes10
Coshocton1,250
Madison31
Jackson120
Geauga3
Summit67
Tuscarawas165
Delaware143
Williams73
Defiance4,000
Auglaize143
Cuyahoga5,376
Columbiana284
Hamilton628
Wyandot66
Sandusky7
Mahoning405
Ottawa666
Jefferson1,166
Lake1,114
Montgomery498
R092807A
Steel IndustryEmployment
in Ohioby County
2005
19
Source:2005 County Business Patterns
U.S. Census Bureau
Prepared by:Ohio Department of Development
Office of Strategic ResearchOctober 2007
Employmentin County
2,000 - 5,376
500 - 1,999
100 - 499
1 - 99
None
THE DISTRIBUTION OF INDUSTRY EMPLOYMENT IN OHIO The map above illustrates the distribution of 34,000 iron and steel industry jobs across Ohio in 2005. Industry employ-ment was more concentrated than the distribution of establishments. Just five counties accounted for 56.4% of the indus-try jobs: Cuyahoga – well over 5,300, Stark and Defiance – 4,000 each, Butler – between 3,900 and 4,000, and Trumbull – well over 2,700.5 Four more counties appear to have had between 1,100 and 1,400 jobs each: Coshocton, Jefferson, Lake and Lorain. Six counties had between 500 and 999 jobs, 20 had at least 100 but less than 500, and 24 had less than 100. The 15,800-plus industry jobs in the same nine contiguous Northeastern Ohio counties – Columbiana, Cuyahoga, Lake, Lorain, Mahoning, Stark, Summit, Trumbull, and Wayne – also comprised about 46.5% of the state total, but there are notable exceptions to the generalization that the concentration of jobs follows the concentration of establishments. Coun-ties with smaller numbers of establishments but larger numbers of jobs include Butler, Coshocton, Defiance, and Jeffer-son. These counties have large steel making and/or foundry operations. Butler is home to AK Steel. AK and McWane have steel making operations in Coshocton. General Motors has an engine block foundry in Defiance, and Wheeling-Pittsburgh Steel has a primary production facility in Jefferson.
20
See Table A6
pevans
dodlogocolor
FOREIGN INVESTMENT IN OHIO Seventeen foreign-based companies have subsidiaries and/or joint ventures in Ohio’s iron and steel industry; three are on Fortune’s Global 500 list. All of the companies are listed below, along with the countries where the ultimate parent(s) is (are) located, their Ohio subsidiaries, and the total number of employees here. Foreign Parent(s) / Country & Partner(s) Ohio Subsidiary(ies) Jobs Altana AG / Germany Eckart America LP 100 ArcelorMittal Steel Co. NV* / Luxembourg-Netherlands Dofasco, International Steel Group, Mittal, Skyline 2,546 Asahi Tec Corp. / Japan Metaldyne Corp. 200 BlueScope Steel Ltd.-Cargill, Inc. / Australia-U.S. North Star BlueScope Steel LLC 330 Eramet SA / France Marietta Eramet, Inc. 550 Industrias CH, S.A. de C.V. / Mexico Republic Engineered Products 2,225 Marubeni Corp.-Itochu Corp. / Japan SOS Leveling Co. 14 Metalurgica Gerdau SA / Brazil Ameristeel Bright Bar, Inc. 37 Mitsubishi Corp.*-Sojitz Corp. / Japan Coilplus-Ohio, Inc. 55 N.V. Bekaert SA / Belgium Bekaert Corp. (f.k.a. Contours) 170 Salzgitter AG / Germany V & M Star LP 430 Shinagawa Refractories Co., Ltd. / Japan Shinagawa Advanced Materials 28 Tata Group/Tata Steel/Corus Group* / India Thomas Strip Steel Corp. 500 Techint Compagnia Tecnica Internazionale SpA / Italy Tenaris (f.k.a. Maverick Tube Corp.) 100 TI Group PLC / United Kingdom TI Group Automotive Systems Corp.^ 263 Welded Tube of Canada, Inc. / Canada Welded Tube of Canada, Inc. 350 Notes: *– A Fortune Global 500 company; f.k.a. – formerly known as; ^ - one of the plants is closing soon. Sources: See table A1, Harris (2007), and PRSP (2006). The foreign parent companies or joint venture partners have headquarters in 13 nations. Six are located in Japan and two in Germany. Australia, Belgium, Brazil, Canada, France, India, Italy, Mexico and the United Kingdom are home to one each. The newly formed ArcelorMittal lists Luxembourg and the Netherlands as its home countries. Altogether, the 17 companies employ approximately 7,900 people – perhaps one-fifth to one-fourth of industry jobs. ArcelorMittal and Indus-trias CH are the largest employers with over 4,700. Most of the companies are either making steel or making steel pro-ducts from purchased steel. Eramet is the only ferroalloy producer. None of the subsidiaries appears to run a foundry.
21
FOREIGN INVESTMENT IN OHIO Seventeen foreign-based companies have subsidiaries and/or joint ventures in Ohio’s iron and steel industry; three are on Fortune’s Global 500 list. All of the companies are listed below, along with the countries where the ultimate parent(s) is (are) located, their Ohio subsidiaries, and the total number of employees here. Foreign Parent(s) / Country & Partner(s) Ohio Subsidiary(ies) Jobs Altana AG / Germany Eckart America LP 100 ArcelorMittal Steel Co. NV* / Luxembourg-Netherlands Dofasco, International Steel Group, Mittal, Skyline 2,546 Asahi Tec Corp. / Japan Metaldyne Corp. 200 BlueScope Steel Ltd.-Cargill, Inc. / Australia-U.S. North Star BlueScope Steel LLC 330 Eramet SA / France Marietta Eramet, Inc. 550 Industrias CH, S.A. de C.V. / Mexico Republic Engineered Products 2,225 Marubeni Corp.-Itochu Corp. / Japan SOS Leveling Co. 14 Metalurgica Gerdau SA / Brazil Ameristeel Bright Bar, Inc. 37 Mitsubishi Corp.*-Sojitz Corp. / Japan Coilplus-Ohio, Inc. 55 N.V. Bekaert SA / Belgium Bekaert Corp. (f.k.a. Contours) 170 Salzgitter AG / Germany V & M Star LP 430 Shinagawa Refractories Co., Ltd. / Japan Shinagawa Advanced Materials 28 Tata Group/Tata Steel/Corus Group* / India Thomas Strip Steel Corp. 500 Techint Compagnia Tecnica Internazionale SpA / Italy Tenaris (f.k.a. Maverick Tube Corp.) 100 TI Group PLC / United Kingdom TI Group Automotive Systems Corp.^ 263 Welded Tube of Canada, Inc. / Canada Welded Tube of Canada, Inc. 350 Notes: *– A Fortune Global 500 company; f.k.a. – formerly known as; ^ - one of the plants is closing soon. Sources: See table A1, Harris (2007), and OSR (2006). The foreign parent companies or joint venture partners have headquarters in 13 nations. Six are located in Japan and two in Germany. Australia, Belgium, Brazil, Canada, France, India, Italy, Mexico and the United Kingdom are home to one each. The newly formed ArcelorMittal lists Luxembourg and the Netherlands as its home countries. Altogether, the 17 companies employ approximately 7,900 people – perhaps one-fifth to one-fourth of industry jobs. ArcelorMittal and Indus-trias CH are the largest employers with over 4,700. Most of the companies are either making steel or making steel pro-ducts from purchased steel. Eramet is the only ferroalloy producer. None of the subsidiaries appears to run a foundry.