Astron. Nachr./AN 324, No. S1, 591– 596 (2003) / DOI 10.1002/asna.200385089 The ISM and Stellar Distributions Near Sgr A ∗ Nick Scoville ∗1 , Susan R. Stolovy 2 , and Micol Christopher 1 1 Astronomy 105-24, Caltech, Pasadena, CA 91125, USA 2 SIRTF Science Center, MS 220-6, Caltech, Pasadena, CA 91125 Key words Galaxy: center,dust, extinction, infrared: ISM and ionized hydrogen Abstract. HST-NICMOS imaging in the 1.87µmPα line and 1.90µm continuum and OVRO interferometry of the 3mm HCN line provide maps of the ionized and molecular gas at 0.2 and 3 resolution, respectively. Comparison of the observed Pα emission with the 6-cm radio continuum yields a map of the foreground extinction. High apparent extinction is seen along the periphery of the ionized disk and is well-correlated with the molecular torus. The median extinction is A V = 31.1 mag. This extinction distribution is then used to correct the observed Pα emission map to yield an ’extinction-corrected’ image of the ionized gas at 0.2 resolution. The stellar distribution near SgrA ∗ is also analyzed from the 1.9µm continuum image – indicating a drop in the surface brightness distribution of star light within 1 radius of SgrA ∗ . This could be the result of stellar collisions which deplete giant stars within this radius or indicate the presence of a secondary lower mass black hole. 1 Introduction Within the central few parsecs of our Galaxy, radio, infrared and x-ray observations have revealed a massive black hole lying within a region of ionized ’spiral’ arms, encompassed by a ring of dense molecular clouds. The black hole is identified with the non-thermal radio source Sgr A ∗ , and its mass is estimated to be 2.6×10 6 M from the motions of nearby stars and the neighboring ionized gas (Eckart & Genzel 1996, Genzel et al. 2000, Ghez et al. 2000). At a projected radius of approximately 2 pc from Sgr A ∗ , lies the circumnuclear disk/ring (CND) of dense molecular gas and dust clouds (Genzel et al. 1985, G¨ usten et al. 1987), and within this ring, ionized gas streams extend down to a few arcsec from Sgr A ∗ (Lo & Claussen 1983; Lacy et al. 1991). The molecular cloud ring/arms can be modelled as a torus (0.5 pc thick) inclined at 70 ◦ to the line of sight (Jackson et al. 1993). Although clearly much less energetic and massive than the luminous AGN seen in many galactic nuclei, this region probably provides our best opportunity to observe in detail the processes associated with buildup of massive black holes and their accretion processes. We have recently undertaken two investigations aimed at providing the highest resolution imaging of both the ionized and molecular gas in the circumnuclear disk. The molecular gas clouds were imaged in HCN at 3 resolution by Christopher et al. (2002) using the Owens Valley mm-Array; here we present HST-NICMOS imaging at 0.2 resolution of the 1.87µmPα (HI) emission line. 2 Molecular (HCN) and Ionized (Pα) Gas The reduction of the NICMOS images are described in detail in Scoville et al. (2003). The major difficulty in imaging the Pα line was the subtraction of the stellar continuum – in the 1% bandwidth filters available on NICMOS, there are over 1500 stars with continuum emission exceeding the brightest pixel in Pα. Moreover, the reddening over this region is spatially variable and the intrinsic stellar colors are not all ∗ Corresponding author: e-mail: [email protected], Phone: +00 626 395 4979, Fax: +00 626 568 9352 c 2003 WILEY-VCH Verlag GmbH & Co. KGaA, Weinheim
Nick Scoville∗1, Susan R. Stolovy2, and Micol Christopher1
1 Astronomy 105-24, Caltech, Pasadena, CA 91125, USA2 SIRTF Science Center, MS 220-6, Caltech, Pasadena, CA 91125
Key words Galaxy: center,dust, extinction, infrared: ISM and ionized hydrogen
Abstract. HST-NICMOS imaging in the 1.87µm Pα line and 1.90µm continuum and OVRO interferometryof the 3mm HCN line provide maps of the ionized and molecular gas at 0.2 and 3′′ resolution, respectively.Comparison of the observed Pα emission with the 6-cm radio continuum yields a map of the foregroundextinction. High apparent extinction is seen along the periphery of the ionized disk and is well-correlatedwith the molecular torus. The median extinction is AV = 31.1 mag. This extinction distribution is thenused to correct the observed Pα emission map to yield an ’extinction-corrected’ image of the ionized gasat 0.2′′resolution. The stellar distribution near SgrA∗ is also analyzed from the 1.9µm continuum image –indicating a drop in the surface brightness distribution of star light within 1′′ radius of SgrA∗. This couldbe the result of stellar collisions which deplete giant stars within this radius or indicate the presence of asecondary lower mass black hole.
1 Introduction
Within the central few parsecs of our Galaxy, radio, infrared and x-ray observations have revealed a massiveblack hole lying within a region of ionized ’spiral’ arms, encompassed by a ring of dense molecular clouds.The black hole is identified with the non-thermal radio source Sgr A∗, and its mass is estimated to be2.6×106 M� from the motions of nearby stars and the neighboring ionized gas (Eckart & Genzel 1996,Genzel et al. 2000, Ghez et al. 2000). At a projected radius of approximately 2 pc from Sgr A∗, liesthe circumnuclear disk/ring (CND) of dense molecular gas and dust clouds (Genzel et al. 1985, Gustenet al. 1987), and within this ring, ionized gas streams extend down to a few arcsec from Sgr A∗ (Lo &Claussen 1983; Lacy et al. 1991). The molecular cloud ring/arms can be modelled as a torus (0.5 pc thick)inclined at 70◦ to the line of sight (Jackson et al. 1993). Although clearly much less energetic and massivethan the luminous AGN seen in many galactic nuclei, this region probably provides our best opportunity toobserve in detail the processes associated with buildup of massive black holes and their accretion processes.
We have recently undertaken two investigations aimed at providing the highest resolution imaging ofboth the ionized and molecular gas in the circumnuclear disk. The molecular gas clouds were imaged inHCN at 3′′ resolution by Christopher et al. (2002) using the Owens Valley mm-Array; here we presentHST-NICMOS imaging at 0.2′′ resolution of the 1.87µm Pα (HI) emission line.
2 Molecular (HCN) and Ionized (Pα) Gas
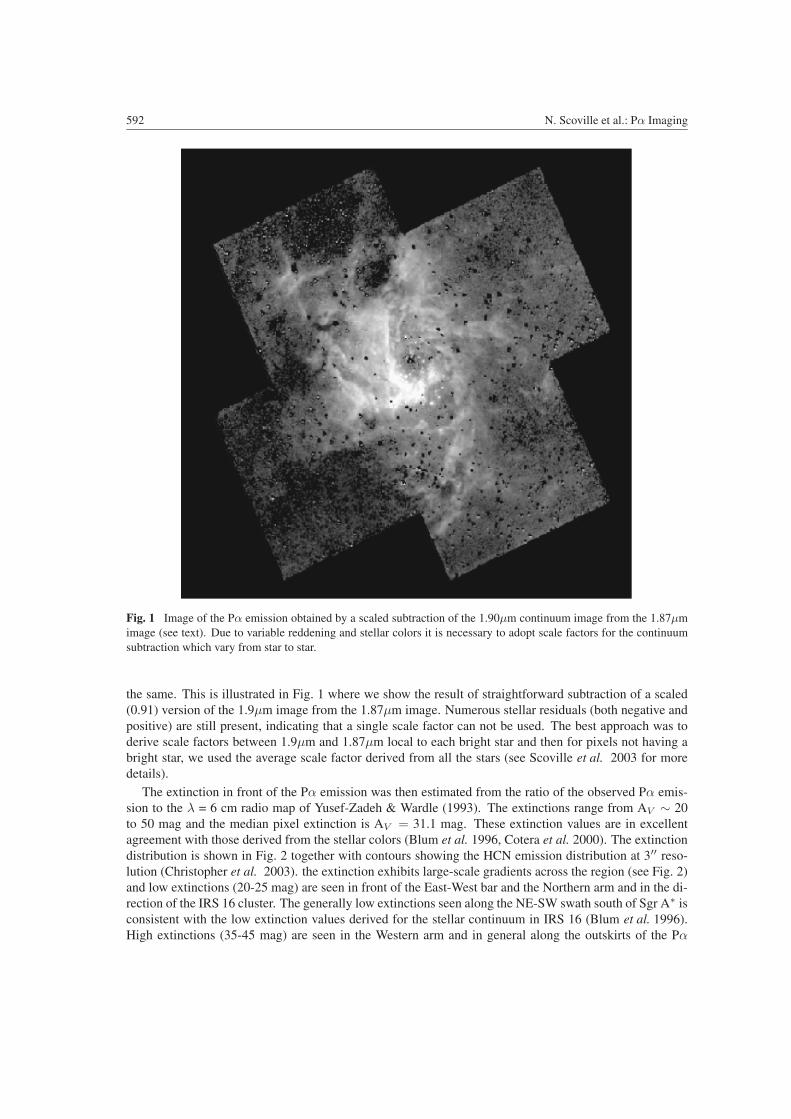
The reduction of the NICMOS images are described in detail in Scoville et al. (2003). The major difficultyin imaging the Pα line was the subtraction of the stellar continuum – in the 1% bandwidth filters availableon NICMOS, there are over 1500 stars with continuum emission exceeding the brightest pixel in Pα.Moreover, the reddening over this region is spatially variable and the intrinsic stellar colors are not all
Fig. 1 Image of the Pα emission obtained by a scaled subtraction of the 1.90µm continuum image from the 1.87µmimage (see text). Due to variable reddening and stellar colors it is necessary to adopt scale factors for the continuumsubtraction which vary from star to star.
the same. This is illustrated in Fig. 1 where we show the result of straightforward subtraction of a scaled(0.91) version of the 1.9µm image from the 1.87µm image. Numerous stellar residuals (both negative andpositive) are still present, indicating that a single scale factor can not be used. The best approach was toderive scale factors between 1.9µm and 1.87µm local to each bright star and then for pixels not having abright star, we used the average scale factor derived from all the stars (see Scoville et al. 2003 for moredetails).
The extinction in front of the Pα emission was then estimated from the ratio of the observed Pα emis-sion to the λ = 6 cm radio map of Yusef-Zadeh & Wardle (1993). The extinctions range from AV ∼ 20to 50 mag and the median pixel extinction is AV = 31.1 mag. These extinction values are in excellentagreement with those derived from the stellar colors (Blum et al. 1996, Cotera et al. 2000). The extinctiondistribution is shown in Fig. 2 together with contours showing the HCN emission distribution at 3′′ reso-lution (Christopher et al. 2003). the extinction exhibits large-scale gradients across the region (see Fig. 2)and low extinctions (20-25 mag) are seen in front of the East-West bar and the Northern arm and in the di-rection of the IRS 16 cluster. The generally low extinctions seen along the NE-SW swath south of Sgr A∗ isconsistent with the low extinction values derived for the stellar continuum in IRS 16 (Blum et al. 1996).High extinctions (35-45 mag) are seen in the Western arm and in general along the outskirts of the Pα
Astron. Nachr./AN 324, No. S1 (2003) 593
Fig. 2 The extinction distribution derived from the observed ratio of Pα to 6-cm radio continuum emission. ThePα emission was convolved to the same spatial resolution as the radio and we assume the radio continuum is entirelyfree-free except on Sgr A∗. The contours are for the HCN emission at 3′′ resolution (Christopher et al. 2003). A broadminimum in the extinction is seen in the IRS 16 cluster and the extinctions increase at the periphery of the ionized gasin the molecular features. (The dashed contours in the HCN indicate locations where the HCN appears in absorptionof the radio free-free (from the ionized gas) and nonthermal (Sgr A∗) continuum.) The apparently high extinction onSgr A∗is due to the strong non-thermal contribution which yields spuriously large extinction estimates.
emission. This may be due to the increased extinction associated with dust in the molecular gas along theperiphery of the ionized region. The apparently high extinctions shown on Sgr A∗ and a few arcsec tothe north are spurious, due to the prescense of non-thermal radio emission there; the AV derived from theH92α line (Roberts & Goss 1993) shows no anomaly on Sgr A∗ . On the emission line stars the extinctionsare also likely to be underestimated.
The molecular gas, shown as contours of HCN (1-0) emission in Fig. 2 – 3, encircles the ionized gas at20 – 40′′ radius from Sgr A∗. With the high resolution OVRO observations, the HCN emission is resolvedinto over 20 clouds or clumps with masses of a 3×10² – 2×10³ M� . The mean internal densities of theseclouds are ∼ 3×106 cm−3 (Christopher et al. 2003). These densities are approximately equal to the Rochecritical densities for tidal stability in the presence of the central black hole and the interior mass of stars.
Fig. 3 shows the extinction-corrected Pα emission within 40′′ of Sgr A∗ together with contours of 3mmHCN emission mapped with the OVRO array at 3′′ resolution (Christopher et al. 2003). The prominent
594 N. Scoville et al.: Pα Imaging
Fig. 3 The Pα emission corrected for extinction using the extinction derived from the ratio of Pα to radio continuumemission . The color scale units are 10−16 ergs cm−2 sec−1 per 0.0753′′ pixel and spatial offsets are relative to SgrA∗. The contours are for the HCN emission at 3′′ resolution (Christopher et al. 2003).
ionized emission features in Fig. 3 correspond to: the east-west ’bar’ structure approximately 7′′ southof Sgr A∗, the northern arm which extends from -2′′ to over 25′′ north of Sgr A∗, and the western armapproximately 14′′ west of Sgr A∗. With the high resolution and sensitivity of the Pα images these large-scale features break up into numerous filaments/arcs which are presumably density enhancements in theionized gas or individual ionization fronts at the edges of neutral clouds. Smaller scale emission peaks areseen on the 38 emission line stars identified in Scoville et al. (2003). The ’mini-cavity’ appears as a clearlyevacuated spherical hole in the emission of diameter 2.7′′ at -1.7′′ , -2.8′′ from Sgr A∗ (Yusef-Zadeh,Morris & Ekers 1990).
The total flux (within 40′′ radius of Sgr A∗) in the extinction-corrected Pα image is 2.4×10⁻⁹ ergs cm−2
sec−1; the luminosity is therefore 1.8×1037 ergs sec−1 or 1.7×1049 Pα photons per sec. The total Lymancontinuum emission rate required for the Pα emission is 3.94×1050 sec−1 or 2.70×10⁶ L� (assuming1.2 Rydbergs per Lyman continuum photon). Within 20′′ radius of Sgr A∗, the Pα flux is 50% of thatgiven above; thus 50% of the ionizing photons are absorbed within 20′′ or 0.8 pc. All of the emissionline stars are within this region. The derived Lyman continuum production rates are minimum estimatessince we assume Case B recombination with no Lyman continuum escaping the region. Given the apparentgeometry of a tilted ring in the neutral gas, it is, in fact, very likely that the actual production rate could be
Astron. Nachr./AN 324, No. S1 (2003) 595
several times higher. The eight emission line stars studied by Najarro et al. (1997) have a combined Lymancontinuum emission rate of 3×1050 sec−1 and thus they can probably account for the ionization withoutany extra input from Sgr A∗. The Lyman continuum emission rate obtained from Pα is consistent with thatderived directly from the radio continuum (∼ 3× 1050 sec−1, Genzel et al. 1994) and avoids uncertaintieswith respect to the radio non-thermal contributions.
Correlation (or lack of correlation) between the molecular gas mapped by the HCN contours in Fig. 2and the derived extinctions in front of the ionized gas might be used to infer the relative placement of theH2 and HII gas along the line of sight. The strong increase in extinction at the edge of the Western armsuggests that some of the ionized gas is behind or mixed with the neutral gas and dust in the molecularWestern arm. Increased extinction in front of the ionized gas is also apparent where two filaments ofmolecular gas (traced by the HCN contours in Fig. 2) extend southward into the northern boundary of theionized gas (∆α = -5′′ , ∆δ = 15′′ , see Fig. 2).
However, Christopher et al. (2003) estimate volume densities nH2 ≥ 106 cm−3 for the HCN molecularclouds. Their typical sizes (∼ 5′′ or 7×1017 cm) then imply column densities ∼ 7 × 10²³ H2 cm−2 orAV ∼ 700 mag for a standard Galactic dust-to-gas ratio. Clearly, the extinctions in front of the the Westernarm and northern Pα emission are not nearly this high. We therefore conclude that Pα emission on thewest and northern border of the region (∆α = -10′′ , ∆δ = 10′′ ) must be on the front face of the moleculargas (unless the dust is severely depleted or the molecular gas is extremely clumpy on scales << 1′′ ).
3 Stellar Distribution
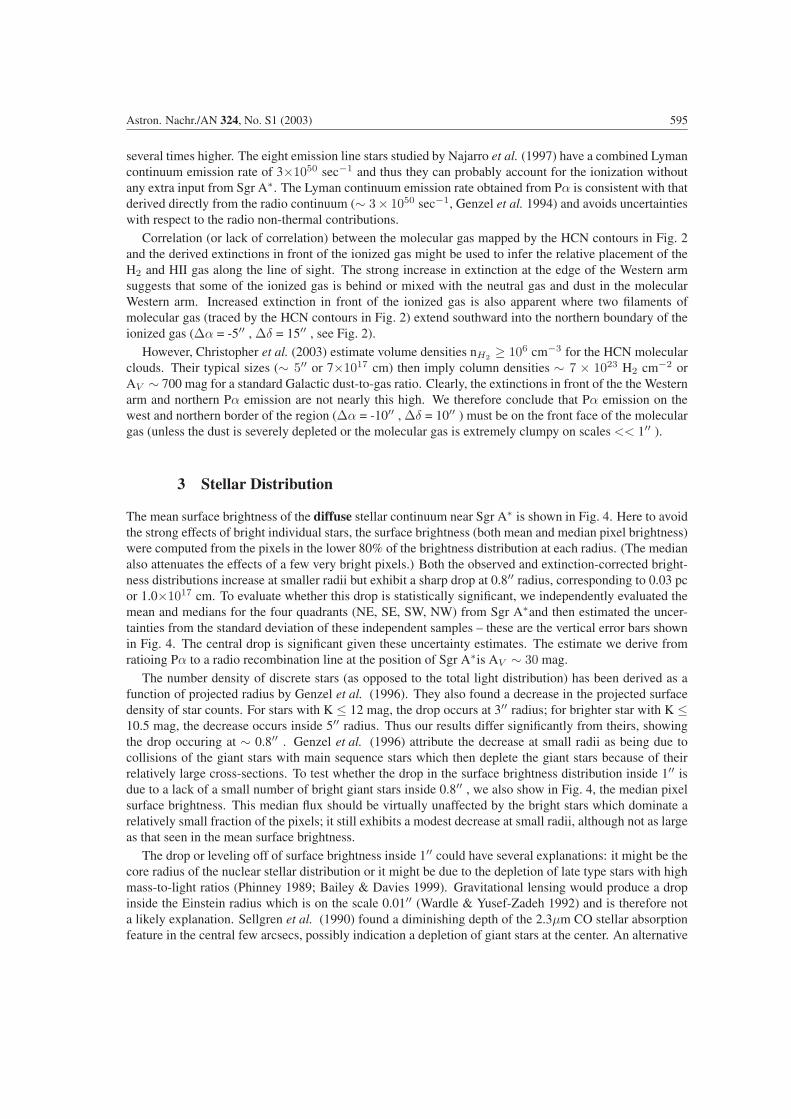
The mean surface brightness of the diffuse stellar continuum near Sgr A∗ is shown in Fig. 4. Here to avoidthe strong effects of bright individual stars, the surface brightness (both mean and median pixel brightness)were computed from the pixels in the lower 80% of the brightness distribution at each radius. (The medianalso attenuates the effects of a few very bright pixels.) Both the observed and extinction-corrected bright-ness distributions increase at smaller radii but exhibit a sharp drop at 0.8′′ radius, corresponding to 0.03 pcor 1.0×1017 cm. To evaluate whether this drop is statistically significant, we independently evaluated themean and medians for the four quadrants (NE, SE, SW, NW) from Sgr A∗and then estimated the uncer-tainties from the standard deviation of these independent samples – these are the vertical error bars shownin Fig. 4. The central drop is significant given these uncertainty estimates. The estimate we derive fromratioing Pα to a radio recombination line at the position of Sgr A∗is AV ∼ 30 mag.
The number density of discrete stars (as opposed to the total light distribution) has been derived as afunction of projected radius by Genzel et al. (1996). They also found a decrease in the projected surfacedensity of star counts. For stars with K ≤ 12 mag, the drop occurs at 3′′ radius; for brighter star with K ≤10.5 mag, the decrease occurs inside 5′′ radius. Thus our results differ significantly from theirs, showingthe drop occuring at ∼ 0.8′′ . Genzel et al. (1996) attribute the decrease at small radii as being due tocollisions of the giant stars with main sequence stars which then deplete the giant stars because of theirrelatively large cross-sections. To test whether the drop in the surface brightness distribution inside 1′′ isdue to a lack of a small number of bright giant stars inside 0.8′′ , we also show in Fig. 4, the median pixelsurface brightness. This median flux should be virtually unaffected by the bright stars which dominate arelatively small fraction of the pixels; it still exhibits a modest decrease at small radii, although not as largeas that seen in the mean surface brightness.
The drop or leveling off of surface brightness inside 1′′ could have several explanations: it might be thecore radius of the nuclear stellar distribution or it might be due to the depletion of late type stars with highmass-to-light ratios (Phinney 1989; Bailey & Davies 1999). Gravitational lensing would produce a dropinside the Einstein radius which is on the scale 0.01′′ (Wardle & Yusef-Zadeh 1992) and is therefore nota likely explanation. Sellgren et al. (1990) found a diminishing depth of the 2.3µm CO stellar absorptionfeature in the central few arcsecs, possibly indication a depletion of giant stars at the center. An alternative
596 N. Scoville et al.: Pα Imaging
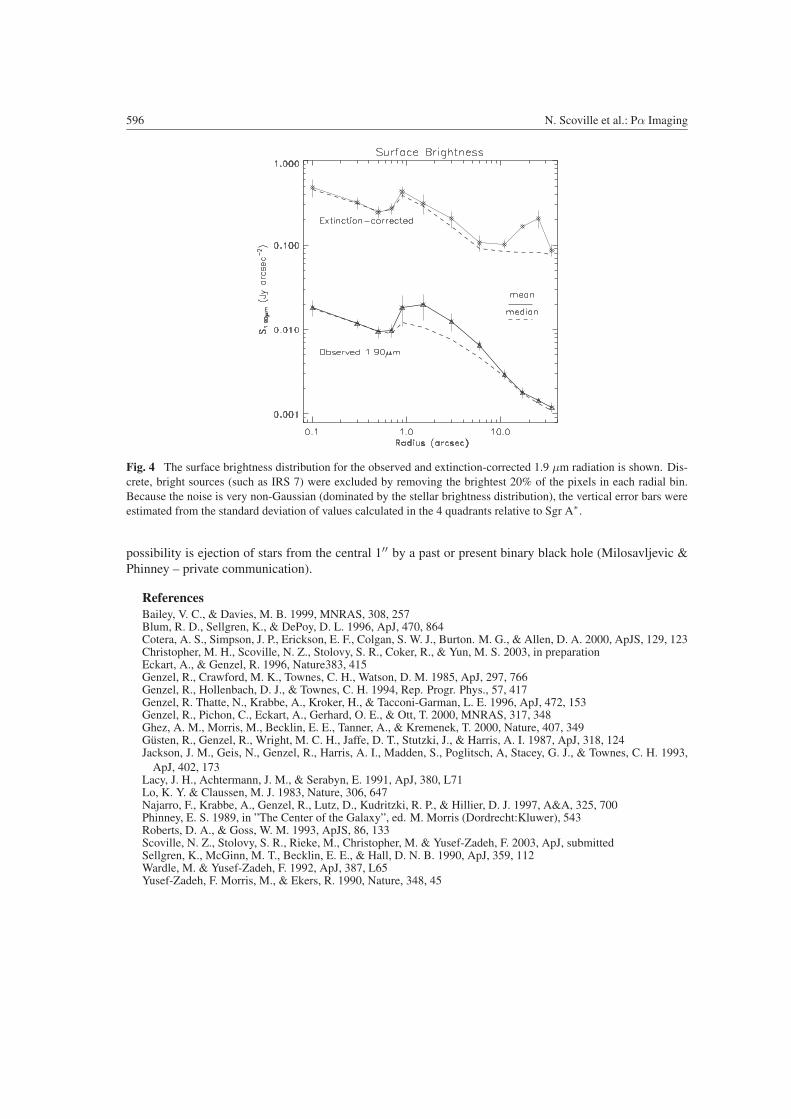
Fig. 4 The surface brightness distribution for the observed and extinction-corrected 1.9 µm radiation is shown. Dis-crete, bright sources (such as IRS 7) were excluded by removing the brightest 20% of the pixels in each radial bin.Because the noise is very non-Gaussian (dominated by the stellar brightness distribution), the vertical error bars wereestimated from the standard deviation of values calculated in the 4 quadrants relative to Sgr A∗.
possibility is ejection of stars from the central 1′′ by a past or present binary black hole (Milosavljevic &Phinney – private communication).
ReferencesBailey, V. C., & Davies, M. B. 1999, MNRAS, 308, 257Blum, R. D., Sellgren, K., & DePoy, D. L. 1996, ApJ, 470, 864Cotera, A. S., Simpson, J. P., Erickson, E. F., Colgan, S. W. J., Burton. M. G., & Allen, D. A. 2000, ApJS, 129, 123Christopher, M. H., Scoville, N. Z., Stolovy, S. R., Coker, R., & Yun, M. S. 2003, in preparationEckart, A., & Genzel, R. 1996, Nature383, 415Genzel, R., Crawford, M. K., Townes, C. H., Watson, D. M. 1985, ApJ, 297, 766Genzel, R., Hollenbach, D. J., & Townes, C. H. 1994, Rep. Progr. Phys., 57, 417Genzel, R. Thatte, N., Krabbe, A., Kroker, H., & Tacconi-Garman, L. E. 1996, ApJ, 472, 153Genzel, R., Pichon, C., Eckart, A., Gerhard, O. E., & Ott, T. 2000, MNRAS, 317, 348Ghez, A. M., Morris, M., Becklin, E. E., Tanner, A., & Kremenek, T. 2000, Nature, 407, 349Gusten, R., Genzel, R., Wright, M. C. H., Jaffe, D. T., Stutzki, J., & Harris, A. I. 1987, ApJ, 318, 124Jackson, J. M., Geis, N., Genzel, R., Harris, A. I., Madden, S., Poglitsch, A, Stacey, G. J., & Townes, C. H. 1993,
ApJ, 402, 173Lacy, J. H., Achtermann, J. M., & Serabyn, E. 1991, ApJ, 380, L71Lo, K. Y. & Claussen, M. J. 1983, Nature, 306, 647Najarro, F., Krabbe, A., Genzel, R., Lutz, D., Kudritzki, R. P., & Hillier, D. J. 1997, A&A, 325, 700Phinney, E. S. 1989, in ”The Center of the Galaxy”, ed. M. Morris (Dordrecht:Kluwer), 543Roberts, D. A., & Goss, W. M. 1993, ApJS, 86, 133Scoville, N. Z., Stolovy, S. R., Rieke, M., Christopher, M. & Yusef-Zadeh, F. 2003, ApJ, submittedSellgren, K., McGinn, M. T., Becklin, E. E., & Hall, D. N. B. 1990, ApJ, 359, 112Wardle, M. & Yusef-Zadeh, F. 1992, ApJ, 387, L65Yusef-Zadeh, F. Morris, M., & Ekers, R. 1990, Nature, 348, 45