38
WP/06/187 The Jordanian Stock Market—Should You Invest in It for Risk Diversification or Performance? Tahsin Saadi-Sedik and Martin Petri

WP/06/187
The Jordanian Stock Market—Should You Invest in It for Risk Diversification or
Performance?
Tahsin Saadi-Sedik and Martin Petri


© 2006 International Monetary Fund WP/06/187
IMF Working Paper
Middle East and Central Asia Department
The Jordanian Stock Market—
Should You Invest in It for Risk Diversification or Performance?
Prepared by Tahsin Saadi-Sedik and Martin Petri1
Authorized for distribution by Zubair Iqbal
August 2006
Abstract
This Working Paper should not be reported as representing the views of the IMF. The views expressed in this Working Paper are those of the author(s) and do not necessarily represent those of the IMF or IMF policy. Working Papers describe research in progress by the author(s) and are published to elicit comments and to further debate.
We analyze the performance of the Amman Stock Exchange (ASE) and its integration with other markets. Using cointegration techniques, we find that the ASE and other Arab stock markets are cointegrated, which implies little long-run risk diversification. However, there is no cointegrating relationship between the ASE and other emerging or developed stock markets. Two of the main regional stock markets—Kuwait and Saudi Arabia—Granger-cause the Jordanian stock market. The paper finds that there may have been some overvaluation at end-2005, but that the market correction in early 2006 and strong recent earnings growth have reduced overvaluation concerns. JEL Classification Numbers: G11, G12, G15, C32, F30 Keywords: Jordan, stock market integration, cointegration, common trends Author(s) E-Mail Address: [email protected], [email protected]
1 The authors would like to thank Mohsin Khan, David Owen, Zubair Iqbal, Ed Gardner, Samya Beidas, Fernando Delgado, Maher Hasan, Joseph Ntamatungiro, Effie Psalida, Randa Sab, Axel Schimmelpfennig, Helaway Tadesse, Roman Zytek, and the participants in the seminar presented at the IMF Middle East and Central Asia Department for helpful comments. Luisa LaFleur provided useful editorial comments. The authors are also grateful to Professor Jean-Louis Combes and the Research Department of the Central Bank of Jordan for their useful comments. The usual disclaimer applies.

- 2 -
Contents Page
I. Introduction ........................................................................................................................... 3
II. Major Developments of the Jordanian Capital Market ........................................................ 4
III. Linkages of the ASE to Major Arab, Emerging, and Developed Stock Markets ............. 10
A. Descriptive Statistics...................................................................................................... 11
B. Risk and Returns ............................................................................................................ 12
C. Short-Run Correlations .................................................................................................. 13
D. Long-Run Relationship Between the ASE and Other Stock Markets ........................... 15
IV. Strengths, Vulnerabilities, and Macroeconomic Linkages of the ASE ............................ 24
A. Strengths—Factors Supporting Current Valuations ...................................................... 24
B. Vulnerabilities—Factors Threatening Current Valuations ............................................ 26
C. Macroeconomic Linkages .............................................................................................. 30
V. Conclusions........................................................................................................................ 31
References............................................................................................................................... 35

- 3 -
I. INTRODUCTION
A vibrant and efficient stock market helps channel savings to investment, provides opportunities for foreign investment, and creates instruments for personal investment with higher returns and greater diversification possibilities than otherwise available. Given the Jordanian authorities’ strategy of generating economic growth through the private sector, it is important that the stock market is well developed and properly regulated to allow for an effective mobilization and efficient allocation of resources. This would contribute to mobilizing domestic financial resources and attracting funds from overseas. Additional investments, both domestic and foreign, should contribute to economic growth and would tend to reduce unemployment and poverty.
This paper analyzes recent developments in the Amman Stock Exchange (ASE) and its linkages to other Arab, emerging, and developed stock markets. For an emerging market economy like Jordan, the ASE is unusually large in terms of market capitalization (almost 300 percent of GDP). The ASE plays an important role in channeling and intermediating capital in the Jordanian economy, which currently depends to a significant extent on foreign capital inflows. It is thus important to understand what determines the performance of the ASE, to what extent the ASE is integrated with other stock markets in the world or in the region, and if it is overvalued. The question of whether the ASE is integrated with other stock markets is important from a portfolio diversification point of view but also with respect to potential contagion from developments in other stock markets. The valuation question is important for the individual investor but also from a macroeconomic point of view since a large correction in the stock market affects wealth, consumption, and potentially capital flows. This paper attempts to answer these questions.
We use cointegration techniques to test the integration of the ASE with other Arab, emerging, and developed stock markets. We use Johansen’s (1991 and 1995) maximum likelihood estimator, which relies on the fact that a linear combination of two or more nonstationary time series may be stationary. If such a stationary linear combination exists, the nonstationary time series are said to be cointegrated, and this stationary linear combination—the cointegrating equation—may be interpreted as a long-run equilibrium relationship among the variables. Following recent work on stock market integration,2 if, in a system of k integrated and nonstationary time series—stock market indices—there exist r cointegrating relationships, that link the k stock markets together linearly, then the nonstationary behavior of the k stock markets is driven by a reduced number of n common stochastic trends.3 In the extreme case of only one common stochastic trend (k – r = 1), the
2 Kasa (1992), Chen et al. (2002), and Click and Plummer (2005). 3 The number of r cointegrating relationships has to be smaller than the number of nonstationary variables k: (0 < r < k); moreover, the number of n common stochastic trends is given by n = k─r, which is the number of nonstationary variables k minus r cointegrating relationships.

- 4 -
stock markets are driven by the same common stochastic trend and there would be no diversification potential in the long-run.4 In economic terms, this implies that the national stock markets are completely and perfectly integrated. Regarding the analysis of the potential overvaluation of the ASE, we use simple warning signals based on the existing literature. The following indicators are used: (i) weak correlation between price and economic fundamentals; (ii) acceleration in money and credit expansion; (iii) rapid increase in the price index; and (iv) high price volatility.
The results show that Arab stock markets are cointegrated as a group, thus from a diversification point of view, over the long run there is little difference between investing in Jordan or any other Arab stock market. The results of bilateral cointegration tests show that most Arab stock markets are also bilaterally cointegrated. However, there appears to be no cointegrating relationship between the ASE and other emerging and developed stock markets. This suggests the existence of diversification opportunities for investors from emerging and developed countries. The results of Granger causality tests show that two of the main stock markets in the region—Saudi Arabia and Kuwait —Granger-cause the Jordanian stock market. The indicators for overvaluation suggest speculative factors may have contributed to stock valuations at end-2005, although the correction in prices in early 2006 has removed some of these concerns.
The remainder of this paper is organized as follows. Section II explains the major developments of the Jordanian capital market since its establishment in 1978, focusing on recent performance. Section III presents the linkages of the ASE to major Arab, emerging, and developed stock markets. Section IV analyzes the strengths and vulnerabilities of the Jordanian stock market, and Section V concludes.
II. MAJOR DEVELOPMENTS OF THE JORDANIAN CAPITAL MARKET
The recent performance of the ASE has been exceptional, partly reflecting long-standing domestic efforts to promote financial equity markets. The average annual increase of the ASE index since 2000 has been 36 percent compared with the historical average of 13 percent. Since the establishment of the Jordanian capital market in 1978, its legal foundations have been strengthened and its products and liquidity improved. The ASE has matured through a gradual process; it has diversified the types of financial instruments available to investors and has removed most restrictions on foreign participation in listed companies.
4 This was the result for five developed stock markets investigated in Kasa (1992).

- 5 -
The performance of the ASE during 2005 was exceptional and unprecedented (Appendix Table 1). All stock market indicators for 2005 showed the best performance since the market was established in 1978:5
• The ASE share price index peaked at its all time high on November 8, 2005, when it reached 9,348 points. It closed the year at 8,192 points, which still implied a 93 percent rise compared with end-2004 (Figure 1). The banking index went up by 134 percent, insurance by 98 percent, services by 78 percent, and industry by 15 percent.
Figure 1. Price index, weighted by market capitalization (Percentage change, 1978-2005)
-40-20
020406080
100
1978 1981 1984 1987 1990 1993 1996 1999 2002 2005
Source: Amman Stock Exchange.
• The trading volume increased by 345 percent to reach JD 16.9 billion, and 2.6 billion shares were traded—an increase of 93 percent compared with 2004. The value traded reached 185 percent of GDP compared with 46 percent in 2004 (Figure 2), and the turnover ratio increased to 94 percent compared with 58 percent for the previous year.
5 The Amman Financial Market (AFM) was created in 1978. It served as the precursor to the ASE, into which it was merged in 1999. The AFM first constructed an unweighted price index in 1980, which was supplemented by sub-indices for the four sectors: banking and finance, insurance, services and industry. Originally, 38 stocks were covered. In 1992, the AFM began calculating a market-capitalization weighted index covering 50 stocks. The coverage was extended to 60 stocks in 1994, and to 70 stocks in 2001.

- 6 -
Figure 2. Value traded (Percent of GDP, 1978-2005)
0
50
100
150
200
1978 1981 1984 1987 1990 1993 1996 1999 2002 2005
Source: Amman Stock Exchange.
• The ASE market capitalization jumped to JD 26.7 billion, an increase of 83 percent over 2004. Total market capitalization was 292 percent of the GDP at end-2005, which is very high by international standards. Among the Arab stock markets Jordan has the largest market capitalization in terms of percent of GDP (Figure 3).6 However, in absolute value—in U.S. dollars—Jordan has a medium size market in the region.
Figure 3. Middle East: Market Capitalization (As of December 2005)
0
50
100
150
200
250
300
350
JORDAN SAUDI ARABIA KUWAIT EGYPT MOROCCO LEBANON TUNISIA0
100
200
300
400
500
600
700
Tho
usan
ds
Millions U.S. dollars(right axis)
Percent of GDP(left axis)
Source: Arab Monetary Fund.
6 This is very high compared with those of the emerging market economies. In 2005 the average market capitalization for emerging Asia was 39.8 percent of GDP, emerging Europe was 54.7 percent, and Latin America was 49.5 percent (see World Economic Outlook, April 2006).

- 7 -
• During 2005, the net investment of non-Jordanians in the ASE increased to JD 413 million, compared with JD 69 million during 2004. As a result, non-Jordanians ownership in the ASE increased to 45 percent compared with 41 percent in 2004.
• The number of listed companies—covering a wide range in terms of size and sector—increased from 192 in 2004 to 201 in 2005. Compared with other stock markets in the region, Jordan has the second largest number of listed companies (Figure 4).
0
100
200
300
400
500
600
700
800
EGYPT JORDAN KUWAIT SAUDI ARABIA MOROCCO TUNISIA LEBANON
Figure 4. Middle East: Listed companies(As of December 2005)
Source: Arab Monetary Fund.
• Despite the increasing number of listed companies, the market is dominated by the banking sector, which represents 62.3 percent of market capitalization as of end-2005, followed by service (19.8 percent), industry (15.7 percent) and insurance 2.2 percent (Figure 5). The banking sector is itself dominated by Arab Bank, which represent 41 percent of the total market capitalization.7 The top 10 companies in terms of market capitalization at the ASE represent about 70 percent of market capitalization (Figure 6), which has been stable over the past few years.8
7 Arab Bank is a large international bank that has most of its operations outside Jordan, which partly explains Jordan’s relatively large capitalization-to-GDP ratio. 8 The top 10 companies by market capitalization at the ASE represented 70.1 percent of market capitalization in January 2000.

- 8 -
Figure 5. Market Capitalization of ASE Distributed by Sector
(December 2005)
Insurance2%
Banks62%
Industry16% Services
20%
Source: Amman Stock Exchange.
Figure 6. Top 10 companies by market capitalization at the ASE (Cumulative December 2005)
41.8
49.354.4
58.561.0
63.2 64.9 66.5 68.1 69.5
0
10
20
30
40
50
60
70
80
ARAB BANK THE HOUSINGBANK FOR
TRADE ANDFINANCE
JORDANTELECOM
ARABPOTASH
THE JORDANCEMENT
FACTORIES
UNITEDARAB
INVESTORS*
CAIROAMMAN
BANK
JORDANKUWAIT
BANK
BANK OFJORDAN
UNION BANKFOR SAVING &INVESTMENT
Source: Amman Stock Exchange.
The Jordanian capital market is mature by regional standards and has been in operation for 30 years. A major reform was implemented in 1997 to improve the market’s structure and

- 9 -
regulation.9 Three new institutions replaced the Amman Financial Market (AFM), namely: (i) the Jordan Securities Commission (JSC); (ii) the Amman Stock Exchange (which started its operations on March 11, 1999); and (iii) the Securities Depository Commission (SDC). The central feature of this restructuring effort was the separation of the supervisory and legislative role from the executive role of the capital market. The Amman Stock Exchange and the Securities Depository Center (SDC) are now in charge of the executive functions, and the Jordan Securities Commission (JSC) was entrusted with the supervisory and legislative functions.
The ASE includes a diverse set of financial instruments, though its focus is on equity. The market is organized into the First and Second Market for the trading of listed securities. The First Market is governed by more stringent listing rules (e.g., publication of quarterly data), but otherwise differs little from the Second Market. Most securities trading involves equities, and most of the trading is conducted on the First Market.
Debt securities are also listed on the ASE, but are not traded actively. For the public sector, Treasury Bonds with maturities of between three and seven years are listed. No Treasury Bills are currently listed, although a number have been in the past. In addition, development bonds issued by the Central Bank on behalf of the ministry of finance and “Public Entities” Bonds, issued by entities such as the Water Authority of Jordan are also quoted on the ASE. All these bonds are guaranteed by the government. Some bonds issued by private sector corporations are also traded, but the market value of corporate bonds issued in 2005 was only about JD 1 million (Appendix Table 2). Trading of fixed income securities is limited by the fact that most fixed income investors are of the buy-and-hold type, and that the Central Bank of Jordan (CBJ) does not use any of these instruments for monetary policy purposes, which reduces their liquidity.
The ASE allows foreign investors to hold majority stakes in all sectors except construction, mining and commercial service companies. By end-2005, about 55 percent of the stock market’s wealth was held by Jordanian entities, including Jordanian individual and corporate investors (39 percent), the Social Security Corporation (11 percent), and the Jordanian government through the Jordan Investment Corporation (5 percent). The remaining 45 percent was owned by non-Jordanians, mainly from the neighboring Arab countries (36 percent). Non-Jordanians invest mostly in the banking sector (51 percent), industry (36 percent), services (23 percent) and insurance (16 percent).
9 The reforms were included in a temporary securities law (No. 23 of 1997). The AFM had originally been established by a temporary law (No. 31 of 1976). A Cabinet resolution of March 16, 1977 set up the AFM Administration Committee and operations on the AFM started on January 1, 1978.

- 10 -
III. LINKAGES OF THE ASE TO MAJOR ARAB, EMERGING, AND DEVELOPED STOCK MARKETS
The purpose of this section is to examine ASE linkages to Arab, other emerging and developed country stock markets. In, particular, we investigate the extent to which stock market indices are independent of one another. First, we present the descriptive statistics of stock market returns series. Second, we present short-run correlations. Third, we present long-run relationships, that is, we investigate whether Middle East and other stock markets are integrated with each other. Finally, we perform weak exogeneity tests and pairwise Granger causality tests to identify the direction of causality between the stock markets.
The recent boom in stock markets is a regional phenomenon. Most stock markets in the Middle East have seen heavy inflows recently, which have pushed the key indices to levels suggesting a bubble to some observers (Figure 7).10 All regional stock market performed similarly during the last few years and they registered a noticeable improvement in their performance in 2004. The Arab Monetary Fund (AMF) composite index valued in U.S. dollars went up by 52 percent compared with 2003. This increase continued in 2005 when the AMF Composite Index increased by about 91.6 percent.
The stock market performance could be explained by the increased liquidity and improved economic fundamentals in the region due to high international oil prices. Oil prices averaged $53.4 per barrel in 2005, 41 percent higher than in 2004, which was already 30 percent higher than in 2003.11 This has contributed to the large accumulation of reserves by oil exporting countries, and appears to have contributed significantly to asset price appreciation in the Middle East. The relative reluctance of the Arab nationals to invest in overseas markets after the events of September 11, 2001 may have amplified this phenomenon. Although Jordan is not a net oil exporter, it has been affected by the evolution of oil prices mainly through three indirect channels: (i) external demand; (ii) remittances (Jordan receives a large amount of remittances from expatriates working in neighboring Arab countries); and (iii) foreign investment, mainly from the region.
10 Many regional stock markets have seen significant corrections during the first half of 2006. 11 Defined as the simple average of three spot prices: Dated Brent, West Texas Intermediate, and the Dubai Fateh.

- 11 -
50
150
250
350
450
550
650
1/2000 1/2001 1/2002 1/2003 1/2004 1/2005 1/2006
Figure 7. Shuaa Capital Arab Composite Index and ASE (January 2000=100)
Shuaa Capital Arab Composite Index
Jordan ASE
Source: Shuaa Capital; Amman Stock Exchange; and IMF staff estimates.
A. Descriptive Statistics
This section considers the empirical characteristics of the ASE index together with those of selected Arab, other emerging and developed markets. The data were obtained from Datastream International and consist of weekly stock indices over the eight-year period from Tuesday, March 17, 1998 to Tuesday, December 27, 2005 representing 406 observations. We use weekly indices instead of daily indices to avoid biases that could result from non-trading days, non-synchronous trading hours and days, and to avoid the noise commonly associated with daily data. In addition, we use Tuesday indices to avoid day-of-the-week effects for stock returns—mainly Friday and Monday.12 In addition, in the Middle East most stock markets are closed Friday and Saturday as opposed to Saturday and Sunday in most other countries. Thus, using Tuesday data appears to be best for comparability and to avoid any day-of-the-week effect.
There are several possible variants of stock indices for the region (e.g., MSCI, IFC, national indices). However, the use of a single provider for the indices is generally recommended for cross-market comparisons since it provides a homogenized framework. Our dataset relies on the S&P IFC index measured in both local currencies and U.S. dollars.13 In this study, we
12 For example, French (1980) observed that Friday returns were greater on average while Monday returns were less than the average. 13 We use national indices for countries that are not included in the S&P database (e.g., Tunisia, Lebanon). For the United Kingdom, we use the SPGI BMI price index, and the S&P 500 composite index for the U.S. As a proxy for other advanced economies, we use the AMEX International Market. This is a capitalization-weighted index of 50 American Depositary Receipts (ADRs) from Europe and the Pacific Rim.

- 12 -
analyze both indices in local currency and indices converted into U.S. dollars. As pointed out by Click and Plummer (2005), there are pros and cons for using the stock indices measured in local currency terms or in a common currency (U.S. dollars).
From the perspective of most investors, the common currency performance is what matters, and a foreign stock is precisely an asset containing both the local currency stock index and the dollar/local currency exchange rate. This combination thus accounts for any stock market changes that are in fact induced by exchange rate changes, which would be important to outside investors. In other words, some of the movements in the stock price index might reflect the foreign exchange exposure of listed firms. Indices in local currencies are comparisons of dissimilar units, and the units may behave differently. Using a common currency is preferable for comparisons, since it allows the researcher to control for exchange rate variation and inflation trends.
Local currency indices are preferred for analyzing the behavior of the local currency indices themselves. The common currency series implicitly represent the sum of the returns on two assets: the domestic stock index and the domestic currency. Thus, the behavior of the exchange rate could offset variations in the domestic stock market and thus mask the underlying behavior of the domestic market. The conversion to a common currency also raises the possibility that the converted indices may uncover some behavior (i.e., interdependence) because of the behavior of the common currency, such as a depreciation of the dollar against all other currencies, although this concern is less significant for a stable currency.14
B. Risk and Returns
We compute weekly returns as the natural logarithmic difference of the weekly prices times 100, that is 100*Ln (Pt/Pt-1). Table 1 presents summary statistics of the weekly stock index returns in U.S. dollar terms. The data show little evidence of risk-return hypothesis (that is, high risks imply high returns) in selected stock markets, although perhaps the sample period is not long enough to test this hypothesis. The average weekly return for the ASE is 0.43 percent, which is high compared with other countries—only Saudi Arabia had higher returns (0.53 percent) over the period covered by this study. However, in terms of risk, Jordan’s average standard deviation of returns (2.52) is close to the average of other Arab markets (2.50) and developed markets (2.56) but lower than the average of emerging markets (4.29).15 This indicates that on a risk-adjusted basis, the ASE outperformed most other markets, with the exception of the Saudi Arabian market.
14 It might be better to compare the real returns in domestic currency terms although this creates the additional problem of choosing the appropriate deflator. Dimson et al. (2006) analyze the real return in domestic and common currency terms for 17 stock markets covering 106 years of data. 15 The Jordanian market has a circuit breaker that interrupts trading if prices move by more than 5 percent. This may have contributed to the relatively low standard deviation.

- 13 -
Mean Median Maximum Minimum Standard Mean/ Std. Dev.Deviation (Sharpe Ratio)
JORDAN 0.43 0.12 12.66 -8.06 2.52 0.17
Arab Markets 0.20 0.14 13.31 -11.46 2.50 0.08
SAUDI ARABIA 0.53 0.47 8.78 -10.34 2.42 0.22 KUWAIT 0.31 0.29 26.26 -23.02 2.58 0.12 OMAN 0.03 0.00 10.16 -8.81 2.36 0.01 EGYPT 0.30 0.22 13.95 -12.52 3.49 0.09 LEBANON 0.07 0.00 15.77 -15.11 3.15 0.02 TUNISIA 0.12 0.03 8.65 -4.20 1.37 0.08 MOROCCO 0.02 -0.05 9.59 -6.21 2.10 0.01
Emerging Markets 0.33 0.59 14.75 -15.99 4.29 0.08
TURKEY 0.58 0.58 24.20 -25.92 6.89 0.08 ISRAEL 0.24 0.45 7.41 -7.20 2.70 0.09 BRAZIL 0.31 0.58 17.15 -15.03 4.07 0.08 INDIA 0.28 0.60 13.57 -14.30 3.80 0.07 MEXICO 0.30 0.48 11.42 -11.83 3.36 0.09 PAKISTAN 0.28 0.86 14.74 -21.67 4.91 0.06
Developed Markets 0.03 0.17 9.77 -10.87 2.56 0.01
UNITED KINGDOM 0.01 0.17 9.36 -11.82 2.38 0.00 S&P 500 0.04 0.24 12.37 -12.18 2.63 0.01 AMEX 0.04 0.10 7.57 -8.62 2.66 0.01
Source: Authors' calculation.
Table 1. Descriptive Statistics-Weekly Stock Index Returns in U.S. dollars, (March 17, 1998-December 27, 2005)
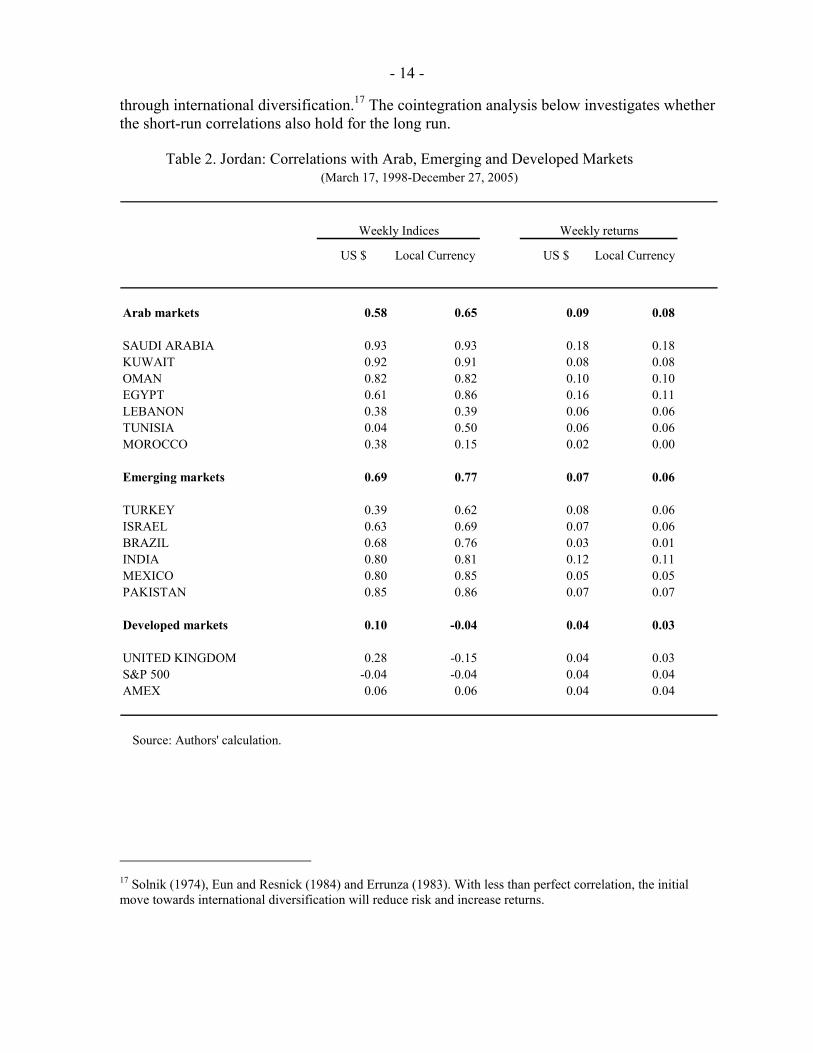
C. Short-Run Correlations
The ASE index is highly correlated with the other Arab stock markets and emerging markets.16 The correlation is also high by conventional standards for the weekly stock market returns. However, the ASE is weakly correlated with the developed stock markets (Table 2).
These results show that Arab and emerging stock markets are moving together somewhat in the short run suggesting that they may be driven by common factors. Modern portfolio theory recommends that stock portfolios be diversified internationally to reduce systematic local risk because the correlation between markets is not perfect. Thus, as long as the returns of different stock markets do not move together investors can reduce risk or increase returns
16 All indices are presented in logs.
- 14 -
through international diversification.17 The cointegration analysis below investigates whether the short-run correlations also hold for the long run.
Table 2. Jordan: Correlations with Arab, Emerging and Developed Markets(March 17, 1998-December 27, 2005)
Weekly Indices Weekly returns
US $ Local Currency US $ Local Currency
Arab markets 0.58 0.65 0.09 0.08
SAUDI ARABIA 0.93 0.93 0.18 0.18KUWAIT 0.92 0.91 0.08 0.08OMAN 0.82 0.82 0.10 0.10EGYPT 0.61 0.86 0.16 0.11LEBANON 0.38 0.39 0.06 0.06TUNISIA 0.04 0.50 0.06 0.06MOROCCO 0.38 0.15 0.02 0.00
Emerging markets 0.69 0.77 0.07 0.06
TURKEY 0.39 0.62 0.08 0.06ISRAEL 0.63 0.69 0.07 0.06BRAZIL 0.68 0.76 0.03 0.01INDIA 0.80 0.81 0.12 0.11MEXICO 0.80 0.85 0.05 0.05PAKISTAN 0.85 0.86 0.07 0.07
Developed markets 0.10 -0.04 0.04 0.03
UNITED KINGDOM 0.28 -0.15 0.04 0.03S&P 500 -0.04 -0.04 0.04 0.04AMEX 0.06 0.06 0.04 0.04
Source: Authors' calculation.
17 Solnik (1974), Eun and Resnick (1984) and Errunza (1983). With less than perfect correlation, the initial move towards international diversification will reduce risk and increase returns.

- 15 -
D. Long-Run Relationship Between the ASE and Other Stock Markets
We use cointegration techniques—Johansen’s (1991 and 1995) maximum likelihood estimator—to test the integration of the ASE with Arab, emerging, and developed stock markets. We find that Arab stock markets are cointegrated, and the results of bilateral cointegration tests show that most Arab stock markets are also bilaterally cointegrated. Moreover, two of the main regional stock markets—Kuwait and Saudi Arabia—Granger-cause the Jordanian stock market. However, there is no cointegrating relationship between the ASE and emerging and developed stock markets.
Methodology
We use cointegration techniques proposed by Johansen to identify potential long-run relationships between Arab, emerging, and developed stock markets. We interpret the cointegrating relationship as the long-run relationship between the stock market prices. In simple terms, this methodology can be described as follows. Define a k-vector of nonstationary I(1) variables tX (stock market price indices); and assume the vector has a VAR representation of the form:
1 1 ...t t p t p tX A X A X ε− −= + + + (1)
Where tε is a vector of innovations. The above equation can be reparameterized as follows:
1
11
p
t t i t i ti
X X X ε−
− −=
∆ =Π + Γ ∆ +∑ (2)
Where :
1 1,
p p
i i ji j i
A I A= = +
Π = − Γ =−∑ ∑
The presence of cointegrating relationships is indicated by the rank of Π (that is, the number of cointegrating relationships). Following Kasa (1992), Chen et al. (2002), and Click and Plummer (2005), if k variables have r cointegrating relationships, which determine the long-run equilibrium relationship between the variables, then they have k-r = n common stochastic trends. Theoretically, there are three scenarios depending on the rank of Π:
(i) Π could have rank zero (r=0), which implies there is no stationary long-run relationship among the elements of Xt, and thus equation (2) reduces to a standard VAR in first differences. In this case, the stock markets are not cointegrated. In an economic sense, this implies that the stock markets are segmented; that is, they are behaving quite differently and diversification amongst these markets would be beneficial.
(ii) Π could be of full rank (r=k). In this case, the assumed stationarity of the error terms requires that the levels of the Xt process themselves be stationary, implying the absence of any stochastic trends whatsoever in the data, and contrary to the original nonstationary

- 16 -
I(1) specification. This implies that the technique of cointegration is inappropriate. Such a result would be highly unusual for financial variables, which tend to be nonstationary.
(iii) Π could be of rank r (0 < r < k), then there exist (kxr) matrices α and β each with rank r such that 'αβΠ = and ' tXβ is I(0). The number of cointegrating relationships is r (the cointegration rank) and each column of β is the cointegrating vector.18 The elements of α are known as the adjustment parameters in the vector error correction model. If the number of common stochastic trends is more than one (1 < n < k), we will conclude that there is a degree of interdependence somewhat short of complete convergence. If the number of common trends is exactly one (n = 1 or r = k - 1), we will conclude that the stock markets are integrated completely and perfectly. In this case, the stock markets are driven by the same common stochastic trend.19
Johansen’s method consists in estimating the matrix Π from an unrestricted VAR and testing whether we can reject the restrictions implied by the reduced rank of Π. The existence of cointegrating relationships among the variables can be determined by two tests proposed by Johansen: the trace and the maximum-eigenvalue tests.20 In practice, the tests are implemented by first testing the null hypothesis of r = 0 (no cointegration), and then if it is rejected, testing r = 1, and so on.
Econometric Results
Unit root tests
The unit root tests for the stock market indices suggest that the series have one unit root. We performed both augmented Dickey-Fuller (ADF) and Phillips-Perron (PP) tests for nonstationarity. Both the ADF and PP test statistics yield high probability values, providing strong evidence that we cannot reject the null hypothesis of a unit root (Table 3). However,
18 Rangvid (2001) points out that an increasing number of cointegrating relationships indicates that stock markets become more integrated over time because they are being increasingly driven by the same common stochastic trends. However, cointegration is not a necessary condition for the economic integration. For example, transaction costs between the markets could be nonstationary and thus no cointegrating relationship might be detectable. However, it would seem reasonable to assume that during the period of study transaction costs were constant over the entire sample period or that their evolution was captured by a deterministic trend. We are indebted to Jean-Louis Combes for this point. 19 Kasa (1992) found that the price indices for the equity markets of five major industrial countries (U.S.A., Japan, England, Germany, and Canada) are all cointegrated. Moreover, he found that the five stock markets are driven by a single common stochastic trend, that is n=1. As Richards (1995) points out, this unusual result may have been the result of an inadequate lag structure, however (details below). 20 Full details are given in Johansen (1988) and Johansen and Juselius (1990).

- 17 -
we can reject the null hypothesis that any of the series is I(2), and hence we conclude that the series have one unit root I(1). 21
t-statistic Lag Adjusted Bandwidth 3/ t-statistic Lag Adjusted Bandwidth 3/length 2/ t-statistic length 2/ t-statistic
Arab marketsJORDAN 0.16 1 0.32 5 -17.60 0 -17.50 4SAUDI ARABIA 0.35 0 0.28 9 -18.59 0 -18.55 11KUWAIT -2.41 1 -2.40 3 -24.93 0 -25.01 2OMAN -2.58 1 -2.29 3 -17.87 0 -17.93 3EGYPT 0.62 1 0.77 4 -17.68 0 -17.62 6LEBANON 0.97 0 0.94 2 -18.47 0 -18.47 0TUNISIA -1.64 0 -1.65 1 -20.15 0 -20.15 3MOROCCO -0.41 -0.48 1 -18.09 0 -18.11 2
Emerging marketsTURKEY -1.39 0 -1.57 6 -20.62 0 -20.66 6ISRAEL -1.43 0 -1.65 4 -19.45 0 -19.51 3BRAZIL -1.53 0 -1.72 7 -19.73 0 -19.83 7INDIA -0.96 0 -1.02 4 -21.00 0 -20.98 3MEXICO -1.60 0 -1.83 6 -19.77 0 -19.80 5PAKISTAN -2.66 -2.72 5 -18.81 0 -18.84 7
Developed marketsUNITED KINGDOM -0.96 1 -1.08 1 -23.32 0 -23.34 3S&P 500 -1.61 1 -1.76 3 -23.41 0 -23.47 4AMEX -0.83 1 -0.91 2 -23.46 0 -23.41 3
Table 3. Unit Root Tests 1/
ADF PPFirst differences
ADF PPLevels
Source: Authors' calculation.
1/ All variables are in US dollar. Null Hypothesis: the series has a unit root. A constant and a linear time trend are included in the test equation. Test critical values are: -3.98 at 1 percent level; -3.42 (5 percent); and -3.13 (10 percent). 2/ Automatic based on SIC, MAXLAG=17. 3/ Newey-West using Bartlett kernel.
Lag length tests
The number of lags in the vector autoregression (VAR) used to estimate the cointegrating relationship is important. Gregory (1994) shows that the frequency of rejection of the null (r=0) of the Johansen tests increases when the sample size is small and the number of explanatory variables, including lags, is high. Richards (1995) points out that a major reason for the findings in Kasa (1992) is an inappropriately long lag length used in the estimation
21 The series should be I(1), that is, there should be one unit root. A difference stationary series is said to be integrated and is denoted as I(d) where d is the order of integration. The order of integration is the number of unit roots contained in the series, or the number of differencing operations it takes to make the series stationary. Here the differences of the variables are stationary I(0), that is, the series are I(1). The stock market indices expressed in local currencies also have one unit root.

- 18 -
process. With shorter lags, Richards finds that the five developed-country stock indices that were studied are not cointegrated, leaving a full set of five (n=5) common trends.
We performed several lag length tests, including the Akaike information criterion (AIC) and the Schwarz information criterion (CIC), to select the appropriate number of lags to be used in the VAR. The results are reported in Appendix Table 3. The tests suggest that only a small number of lags—ranging from one to four—are necessary in the VAR. Thereafter, we use four lags in the VARs.
Bivariate cointegration
Our results indicate that Jordan is bilaterally cointegrated with most Arab markets. We first ran bilateral cointegration tests to determine if the ASE is cointegrated with other stock markets on a bilateral basis. We performed two tests to detect a cointegrating relation: the trace and the maximum-eigenvalue tests. We rejected the null-hypothesis of no cointegration only if both tests reject the null, which is a more stringent criterion than normally applied. The results for bilateral cointegration are reported in Table 4, and show some evidence of cointegration among Arab markets with the exception of Tunisia and Morocco.22 In addition, the results show that the ASE is not cointegrated with the selected emerging and developed stock markets.23
22 We also performed a trivariate cointegration test (Jordan, Tunisia, and Morocco). The purpose of this test is to see if the two countries are cointegrated with ASE as a group. The data reject the cointegration hypothesis. Mexico, Brazil, and Pakistan show bivariate cointegration using the trace statistic, but not using the maximum eigenvalue statistic. 23 Similar results are obtained by using 1, 2, or 3 lags. Thus, the results are robust to the use of different lag lengths.

- 19 -
Table 4. Bilateral Cointegration Results 1/
U.S. dollars
Local currency
U.S. dollars
Local currency
Arab markets Emerging marketsSAUDI ARABIA TURKEY Trace statistic 0.03 0.03 Trace statistic 0.08 0.20 Max eigenvalue statistic 0.04 0.04 Max eigenvalue statistic 0.10 0.46KUWAIT ISRAEL Trace statistic 0.05 0.05 Trace statistic 0.21 0.18 Max eigenvalue statistic 0.03 0.04 Max eigenvalue statistic 0.51 0.40OMAN BRAZIL Trace statistic 0.00 0.00 Trace statistic 0.05 0.14 Max eigenvalue statistic 0.01 0.01 Max eigenvalue statistic 0.17 0.25EGYPT INDIA Trace statistic 0.00 0.01 Trace statistic 0.12 0.12 Max eigenvalue statistic 0.00 0.01 Max eigenvalue statistic 0.16 0.17LEBANON MEXICO Trace statistic 0.00 0.00 Trace statistic 0.06 0.06 Max eigenvalue statistic 0.00 0.00 Max eigenvalue statistic 0.21 0.25TUNISIA PAKISTAN Trace statistic 0.12 0.31 Trace statistic 0.05 0.09 Max eigenvalue statistic 0.13 0.51 Max eigenvalue statistic 0.33 0.31MOROCCO Trace statistic 0.25 0.13 Max eigenvalue statistic 0.25 0.10
Developed marketsUNITED KINGDOM Trace statistic 0.17 0.13 Max eigenvalue statistic 0.15 0.09S&P 500 Trace statistic 0.22 0.22 Max eigenvalue statistic 0.20 0.19AMEX Trace statistic 0.14 0.14 Max eigenvalue statistic 0.10 0.09
Source: Authors' calculations.
1/ The table reports MacKinnon-Haug-Michelis (1999) p-values. The null hypothesis that there is no cointegration relationship is tested against the alternative of one cointegration equation. The test equation uses four lags.
Multivariate cointegration
We then run the Johansen cointegration test and determine the number of cointegrating relationships in Arab stock markets (excluding Morocco and Tunisia). Both the trace and the maximum-Eigenvalue tests indicate one cointegrating equation at the 1 percent level (Table 5).

- 20 -
Cointegration tests 1/ Trace Max-eigenH0 (r) statistic Prob. 2/ statistic Prob. 2/
None (r=0) 112.527 0.002 49.716 0.003At most 1 (r≤1) 62.811 0.159 25.549 0.349At most 2 (r≤2) 37.262 0.335 21.243 0.262At most 3 (r≤3) 16.019 0.711 8.570 0.866At most 4 (r≤4) 7.449 0.526 7.305 0.454At most 5 (r≤5) 0.144 0.704 0.144 0.704
Maximum eigenvalue test
Table 5. Multivariate Cointegration Results
Trace test
Source: Authors' calculations.
1/ Linear trend in the data, and an intercept, but no trend in the cointegrating equation. The test equation uses lags of up to order four. 2/ MacKinnon-Haug-Michelis (1999) p-values
The results allow us to confidently reach the conclusion that the six Middle East stock markets are integrated, which means that these markets long-run comovements are determined by common factors. From the individual investor’s point of view, it implies that there is little risk diversification to be gained in investing in more than one of these markets, since they are all driven by the same factors.
However, the data indicate that there is only one cointegrating vector (r=1) leaving five common stochastic trends (n=5) among the six variables. This implies that these Middle East stock markets are integrated but the integration is not complete.
Our results contradict those of Kasa (1992) in the context of five developed countries who find that n=1. However, our results are consistent with those of Chen et al. (2002), and Click and Plummer (2005) in the context of emerging economies. Chen et al. (2002) examine the stock market indices of Argentina, Brazil, Chile, Colombia, Mexico, and Venezuela. They find that there is only one cointegrating relationship. Click and Plummer (2005) analyze the five stock markets in the original Association of Southeast Asian Nations countries (ASEAN-5), and find that these markets are cointegrated; there is also one cointegrating relationship, leaving four common trends among the five variables.
These results are not surprising because—in an economic sense—perfect cross-market integration is a strong assumption. This could arise in a situation in which there are no barriers of any kind to cross-border financial transactions, such as tariffs, taxes, restrictions on the trading of foreign assets, home bias, information costs or any other cost that make it more difficult to trade across countries than within each market. With perfect cross-market integration, there are no cross-market arbitrage opportunities—portfolios with the same
- 21 -
payoffs should have the same price in different markets—and the law of one price should hold. Perfect stock market integration implies that stocks in all markets are exposed to the same risk factors and the risk premium on each factor is the same in all markets.
The results of Rangvid (2001) point towards a decreasing number of common stochastic trends influencing the European stock markets, that is, the degree of convergence among European stock markets has increased during the 1980s and 1990s. Thus, as cooperation among the Arab countries increases, it is likely that the number of common trends will decrease and that the stock markets will become more integrated.
Weak exogeneity
We analyze the possibility that some stock market price indices do not respond to perturbations (disequilibrium errors) in the cointegrating vector (β). In other words, we test if any stock market price index is weakly exogenous vis-à-vis the long-run equilibrium. If a stock market price index is weakly exogenous, it can be taken as given, that is, it is determined outside the model under consideration.24
We performed weak exogeneity tests for both the bivariate and multivariate cointegrating relationships. The results are reported in table 6. For the bivariate cointegrating relationships, only Oman was weakly exogenous with statistical significance at conventional levels.25 For the multivariate cointegrating relationship, Oman and Kuwait would be weakly exogenous.
A weakly exogenous variable does not react to disequilibrium errors but still could be Granger-caused by other variables in the model (Johansen, 1992). If other variables do not granger-cause the weakly exogenous variable, then the latter is said to be strongly exogenous for β.
24 Technically speaking, if the i-th row of the α matrix—representing the adjustment parameters in the vector error correction model—contains only zeros, then the i-th endogenous variable is said to be weakly exogenous with respect to the β parameters (see Johansen (1992) and Engle, Hendry, and Richard (1983) for the definition and implications of weak exogeneity). 25 We can reject the null hypothesis of weak exogeneity for Kuwait only at about the 10 percent level.

- 22 -
Chi-square(1) Probability
Bivariate weak exogeneity
SAUDI ARABIA 5.46 0.02 JORDAN 10.16 0.00
KUWAIT 2.61 0.11 JORDAN 13.56 0.00
OMAN 0.12 0.73 JORDAN 12.61 0.00
EGYPT 19.73 0.00 JORDAN 6.44 0.01
LEBANON 9.04 0.00 JORDAN 23.38 0.00
Multivariate weak exogeneity Chi-square(1) Probability
JORDAN 6.76 0.01 SAUDI ARABIA 15.43 0.00 KUWAIT 1.5 0.22 OMAN 2.21 0.14 EGYPT 8.16 0.00 LEBANON 14.71 0.00
Source: Authors' calculations.
1/ Null Hypothesis: Appropriate row of the matrix α=0: (i.e. variable is weaklyexogenous). Calculations in U.S. dollars.
Table 6. Weak Exogeneity Tests 1/
Granger causality
Engle and Granger (1987), show that if two series are individually I(1), and cointegrated, a causal relationship will exist in at least one direction. Using Granger causality tests, we can analyze which stock markets among the six Middle Eastern countries help in the prediction of the ASE. Without cointegration this causality test—variables are in levels—may yield spurious results. In the case of cointegrated data, Granger causality tests may use the I(1) data because of the superconsistency properties of estimation (Stock, 1987). Given two series x and y, x is said to Granger cause y if x helps in the prediction of y. A two-way causation occurs frequently; series x Granger causes series y and series y Granger causes series x. This causality test could be presented as follows:

- 23 -
1 1 1 1... ...t t p t p t p t p tX A X A X B Y B Y uδ − − − −= + + + + + + +
1 1 1 1... ...t p t q p t q tt tY C Y C Y D X D X vλ − −− −= + + + + + + + Where tu and tv are zero-mean, serially uncorrelated, random disturbances and the lag length p and q are determined as in the previous section (using lag length tests). This is equivalent to testing if the coefficients on the lagged values of x or y are statistically significant.
Our results show that the two main stock markets in the region—Saudi Arabia and Kuwait— Granger-cause the Jordanian ASE index (Table 7). However, the ASE index does not Granger-cause these two markets. In other words, the Granger causality runs one-way from Saudi Arabia and Kuwait to Jordan and not the other way.26 This result is intuitive and consistent with the observed reality since the Saudi and Kuwaiti markets are, respectively, 17 and 3 times larger than the Jordanian market. In addition, it is consistent with the interpretation that once investment opportunities are exploited in the Saudi and Kuwaiti markets due to improved fundamentals related to oil, investors then diversify further into other regional markets. Thus, there could be a positive expectational spillover effect for nonoil-producing regional neighbors. Similarly, in the case of a stock market decline in Saudi Arabia or Kuwait, margin calls in those countries may force investors to withdraw money from Jordan in order to meet these calls.27
26 In the bivariate relationships only Oman is strongly exogenous, because it weakly exogenous and not granger-caused by Jordan. 27 We tested whether this relationship also holds for the most recent time period using data until May 23, 2006. Since the cointegrating relationship does not hold for such a short time period, Granger-causality needs to be specified in first-differences rather than in levels. However, the data do not show any Granger-type relationship over a 6 or 12 month period until May 2006, which might reflect the market turmoil in the most recent period.

- 24 -
Table 7. Granger-Causality Tests 1/
U.S. do llars Local currency Null Hypothes is (Lags : 4 ): Obs F-Statis tic Probability F-Statis tic Probability
SA UDI A RA BIA does not Granger Caus e JORDA N 403 2.10 0.08 2.11 0.08 JORDA N does not Granger Caus e SA UDI A RA BIA 1.46 0.21 1.44 0.22
KUW A IT does no t Granger Caus e JORDA N 403 3.74 0.01 3.79 0.00 JORDA N does not Granger Caus e KUW A IT 0.94 0.44 0.93 0.45
OM A N does no t Granger Caus e JORDA N 403 0.43 0.79 0.47 0.76 JORDA N does not Granger Caus e OM A N 4.40 0.00 4.43 0.00
EGYPT does no t Granger Caus e JORDA N 403 1.37 0.24 1.35 0.25 JORDA N does not Granger Caus e EGYPT 5.38 0.00 4.28 0.00
LEBA NON does not Granger Caus e JORDA N 403 1.27 0.28 1.33 0.26 JORDA N does not Granger Caus e LEBA NON 6.94 0.00 7.09 0.00
Source: A uthors ' calculations .
1/ Given two s eries x and y , x is s aid Granger-caus es y if x helps in the pred iction of y , o r equivalently if the coefficients on the lagged values of x are s tatis tically s ign ifican t. The two-way caus ation is frequently the cas e; x Granger-caus es y
IV. STRENGTHS, VULNERABILITIES, AND MACROECONOMIC LINKAGES OF THE ASE
The purpose of this section is to analyze strengths and vulnerabilities of the ASE and the macroeconomic effects of the stock market for Jordan. The ASE index has increased by over 400 percent since 2003, which dramatically exceeds the growth in economic activity. If the boom reflects improvements in economic fundamentals, it would imply a valuation of Jordan’s firms corresponding to the new economic reality. However, if the price increase stems mainly from speculative demand, an eventual correction of the ASE prices could have negative macroeconomic consequences. Similarly, the recent strong performance is likely to have had a positive effect on the Jordanian economy.
A. Strengths—Factors Supporting Current Valuations
Many econometric studies show weak support for the influence of macroeconomic factors on the stock market. In addition, the previous section has shown that the recent strong performance of the ASE is probably due more to regional than Jordan-specific developments. We attempted to model the performance of the ASE as a function of real GDP growth, CPI inflation, interest rates, and a proxy for the regional stock market.28 The first three variables are standard in econometric studies on stock market performance. However, the results were not robust and are not reported. Moreover, in the case of Jordan, none of the macroeconomic
28 We used quarterly data over 1990:Q1-2005:Q4.

- 25 -
variables was significant once the proxy for the regional stock market was included in the model. 29
Nevertheless, the performance of the ASE was helped by strong Jordanian economic fundamentals. Key factors supporting the current valuation of stocks are (i) exceptionally strong economic growth and improved corporate profitability; (ii) low interest rates and a benign and highly liquid international environment; (iii) foreign capital inflows; (iv) regulatory and supervisory changes; and (v) privatization of public enterprises.
• Recent strong economic growth has improved the earnings of firms and thus average profits of listed companies increased by 103 percent through the third quarter of 2005 compared with the same period earlier. Growth prospects and thus earnings expectations have also improved, which suggests at least part of the increase in stock prices is justified by economic fundamentals.
• Interest rates have been low domestically and internationally. Normally, low interest rates support higher stock valuations because fixed income instruments are relatively less attractive when compared with equities. Interest rates, particularly long rates, continue to be low in real terms, despite the tightening that took place in 2005 internationally and in Jordan.
• Portfolio inflows have been stronger than usual. Starting in 2002 net portfolio inflows became significantly positive reflecting the favorable economic conditions in Jordan and in the world economy. Moreover, because of higher oil prices there were more investible resources in the region, which also should have benefited Jordan. In addition, a shift in perceptions in the region after the events of September 11, 2001 in the United States may have increased the preference of Arab investors to invest in Arab countries.
• Important regulatory and supervisory changes aimed at enhancing transparency and oversight of the ASE were implemented. As a result the ASE has become one of the region’s most transparent and efficient stock markets, which has increased its attractiveness for foreign and domestic investors. Although there is still progress to be made in this area, Jordan compares favorably with the rest of the region. The abolishment of most restrictions on the foreign ownership of domestic assets has also contributed to furthering foreign investors’ interest.
• The government’s privatization program has transformed many public enterprises into listed companies. The most important privatization was that of Jordan Telecom,
29 The interest rate was significant individually and in a model without the regional stock market. A simple regression of quarterly returns of the ASE over 1990-2005 on the nominal interest rate shows that the interest rate has a significant and negative effect on the ASE. The coefficient on the interest rate was minus 1.58, which was significant at the one percent level. However, the equation has a relatively low adjusted R2 of 0.09.

- 26 -
which is now the fourth-largest listed company by market capitalization. The increase in the number of listed companies was facilitated by good market conditions.
B. Vulnerabilities—Factors Threatening Current Valuations
We analyze several indicators to assess a potential overvaluation in the Jordan stock market. Four standard indicators are analyzed (i) the correlation between price and economic value of stocks; (ii) the acceleration in money and credit expansion; (iii) the speed of the price index increase; and (iv) price volatility.30 The indicators suggest some overvaluation in the market as of end-2005, although the recent market correction indicates that the risk of a bubble has now decreased.
Correlation Between Price and Economic Value of Stocks
The ASE index has increased at a rate far exceeding economic activity and is now valued above the historical average for most valuation indicators. The most commonly used stock valuation indicators are the price to earnings ratio (PER), price to book value (PBR), and dividend yield (DY). The PER is related to the economic concept that the fundamental value of a stock should be equal to the net-present value of the future earnings stream. It measures how much one has to pay for one dollar of current earnings. Similarly, the PBR measures the replacement cost of the physical assets valued at book value. In the same way, the dividend yield is an important component of total return. The increases in these valuation indicators appear greater than warranted by economic fundamentals alone and thus may reflect some overvaluation.
At the end of 2005, the trailing PER ratio reached 45 and exceeded its historical averages of about 17 by three times (Figure 7). While earning prospects are good, and earnings have increased very rapidly during the past few years, prices have increased even more and thus valuations were high at end-2005. As of end-March 2006, the recent correction in stock prices and new strong earnings figures have brought down the PER to a more reasonable ratio of 26, although this is still above the historical average (see Figure 8).
30 These warning signals are country and time sensitive, that is, their values could be affected by factors other than speculative demand.

- 27 -
Figure 8. Price to earning ratio(The ASE, 1978-2006 (March))
0
5
10
15
20
25
30
35
40
45
50
1978 1980 1982 1984 1986 1988 1990 1992 1994 1996 1998 2000 2002 2004 2006 *
P/E Ratio (times)
P/E RatioHistorical Average
Source: Amman Stock Exchange.
Similarly, the PBR reached 5 at the end of 2005—about triple the historical average (Figure 9). This implies either that the companies on average are so efficient that they are worth five times the physical assets that they represent or that they are overvalued. Such high valuations provide a large incentive for similar companies to go public, which could reduce valuations. By March 2006, the PBR had declined to slightly over 4, which is still more than twice the historical average.
Figure 9. Dividend yield ratio and P/BV(The ASE, 1978-2006 (March))
0
1
2
3
4
5
6
1978 1980 1982 1984 1986 1988 1990 1992 1994 1996 1998 2000 2002 2004 2006 *
P/BV (times)
Dividend Yield Ratio (percentage)
Dividend Yield Ratio (%) (Historical Average)
P/BV(Historical Average)
Source: Amman Stock Exchange.

- 28 -
Finally, the dividend yield at the end of 2005 was only 1.0 percent, which is a third of the historical average of almost 3 percent. In many markets the dividend yield is a very important component of total return. In Jordan, the dividend yield accounted for about 3 percent of the total return for the 1978–2005 period. However, by March 2006, the dividend yield had again increased to 1.6 percent, although this is still only half the historical average.
Acceleration in Money and Credit Growth
The increase in broad money growth may have contributed to the increase in the ASE index during 2004–05. Broad money increased by 17 percent in 2005, substantially higher than the 12 percent recorded in 2004 (Figure 10). More importantly, domestic credit grew sharply by 30 percent despite the increase in domestic policy interest rates, and some of the credit was probably channeled to the stock market. The CBJ monitors margin loans, which increased during 2005 to reach JD 220 million. However, a part of personal loans, which accounted for almost half of all new private sector credit in 2005, was probably channeled to the stock market as well, although it is not possible to say how significant this factor was. In any case, there has been a correlation between the stock market index and broad money growth since September 2004, and the relatively strong money growth in 2005 could suggest that there may have been elements of overvaluation in the stock market as of end-2005 (Figure 10).
Figure 10. Broad money (y-to-y growth) and the ASE general index
5
7
9
11
13
15
17
19
21
Jan-03
Mar-03
May-03Jul-0
3
Sep-03
Nov-03
Jan-04
Mar-04
May-04Jul-0
4
Sep-04
Nov-04
Jan-05
Mar-05
May-05Jul-0
5
Sep-05
Nov-05
0
100
200
300
400
500
600
ASE General Index (100 January 2003, right axis)
Broad money (left axis)
Sources: Amman Stock Exchange; and Central Bank of Jordan.
Rapid Increase in Stock Prices
The ASE index has increased by over 400 percent since 2003. A very rapid increase in stock prices is sometimes associated with a bubble. The increase in the ASE has been larger than the price hike observed during the Nikkei bubble of the late 1980s, the Omani (MSM) bubble of 1998, and the NASDAQ dot.com bubble of the second half of the 1990s. This increase was driven by the banking sector, whose index went up by 134 percent in 2005. By contrast the insurance index increased by 98 percent, whereas the services index grew less dramatically (78 percent), and the industry index rose only moderately (15 percent). Thus, for end-2005, there was some evidence of overvaluation from this perspective, and also because

- 29 -
the increase was very dissimilar across sectors. The increase would have been more broad-based if stock prices reflected overall improved Jordanian economic growth prospects.31
Price Volatility
The Jordanian market witnessed a substantial increase in price volatility as measured by the monthly standard deviation of daily returns (Figure 11). The increase in volatility was particularly pronounced after March 2005. Empirically, price volatility tends to increase substantially in the period immediately before the bursting of a price bubble, and financial observers often use it as an important warning signal.32
Figure 11. ASE Index: Standard Deviation of the Index and Its Daily Return
0
50
100
150
200
250
300
350
400
450
500
Jan-03
Mar-03
May-03
Jul-03
Sep-03
Nov-03
Jan-04
Mar-04
May-04
Jul-04
Sep-04
Nov-04
Jan-05
Mar-05
May-05
Jul-05
Sep-05
Nov-05
Jan-06
Mar-06
0
0.5
1
1.5
2
2.5
3
Standard deviation of the daily return of the ASE
Index (right axis)
Standard deviation of ASE Index (left axis)
Sources: Amman Stock Exchange; and authors’ calculations.
31 Sectoral differences are normal, but they tend to be smaller than observed in Jordan. 32 See Topol (1991) on the relationship between price volatility and bubbles. Technically, the concept of a standard deviation of a nonstationary variable such as the index is not defined. Therefore, we use the standard deviation of the daily returns, which is stationary. The standard deviation of the index increased even more. We are indebted to Jean-Louis Combes for this point.

- 30 -
Valuation Assessment
The above indicators provide some evidence that the ASE was overvalued as of end-2005. However, since then a correction has taken place; as of end-March 2006, the ASE general index had decreased by about 25 percent from its peak on November 8, 2005, which could be taken as ex-post evidence of a bubble in 2005. After the correction and with the recent strong earnings growth, the ASE appears to be more reasonably valued, although valuations are still above historical norms. Since stock prices reflect future expectations, investors appear to expect that earnings will continue to grow at high levels and that future prospects are good, which would support higher than historical valuations.33
C. Macroeconomic Linkages
The strong performance of the ASE over the past few years likely had a positive effect on the macroeconomy. The standard transmission channels from the stock market to the real economy are through the wealth effect, savings and investment generation, improved intermediation and effects on expectations. With increased wealth in stocks, investors increase their consumption, which tends to increase domestic demand.34 Similarly, with stock prices increasing, more companies go public and raise money for investment through public offerings, which was the case in Jordan. Moreover, the good stock market performance attracted capital to Jordan, which helped finance the current account deficit, and, ceteris paribus, allowed interest rates to be somewhat lower. Finally, the good performance of the stock market might have improved overall expectations, which might increase growth through higher investment as part of a positive feedback effect. All these factors probably contributed to Jordan’s strong economic growth over the past few years, although it would be hard to quantify the impact.
Conversely, a significant downturn in stock prices could have negative macroeconomic effects. An abrupt correction in stock prices could be prompted by a shift in investors’ confidence, and could be associated with significant capital outflows causing a “sudden stop” with likely negative consequences for growth. Such a correction would also adversely affect households’ balance sheets with a negative wealth effect that would lower consumption. A decline in consumption would reduce aggregate demand and output. In addition, bank balance sheets would be affected by a likely increase in non-performing loans. Finally, a stock market correction could adversely affect investment by increasing the cost and
33 As of end-March, 2006, the price-to-earnings ratio had declined from almost 50 at end-2005 to 26.2, while the dividend ratio increased from 1.0 to 1.6 percent. Higher earnings and dividend payouts contributed more to this development than lower prices. 34 In Jordan, the wealth effect is probably modest, because non-Jordanians hold almost half of the market, and because the Social Security Corporation and the government hold about 16 percent of the market. Both non-Jordanians and the government have a lower tendency to consume out of wealth, which will reduce the wealth effect. With increased privatization and larger ownership of Jordanian citizens, the wealth effect could increase over time.

- 31 -
availability of capital, reinforcing the decline in aggregate demand and output. It is thus important to assess the valuations in the Jordanian stock market and the options for increasing its resilience. In this respect, it might be possible to conduct some macroeconomic stress testing exercises using information on foreign participation in the stock market and the free float to test how the capital account and official foreign reserves might be affected by a significant drop in market indices.35
V. CONCLUSIONS
This study finds that the Amman Stock Exchange is integrated with Arab markets but not with other emerging and developed stock markets. We used both bivariate and multivariate cointegration approaches in our analysis. The multivariate approach shows that Arab stock markets are cointegrated and that they share one long-term equilibrium relationship. The bivariate approach shows that the Jordanian market is individually cointegrated with most Arab markets with the exception of Tunisia and Morocco. However, the results also show that the ASE is not cointegrated with other emerging and developed stock markets.
From this, we conclude that the Arab stock markets are integrated in an economic sense but that the integration is incomplete. The analysis found that there are five common stochastic trends driving the six stock markets. The five common stochastic trends could be attributed to outside factors determining the stock markets or to barriers to investment and trading among the countries. The countries in the study have common cultural characteristics; they also have implemented several deregulation and privatization projects, and have intensified trade and financial relations. All of these factors may have contributed to existing market integration. As cooperation among these countries increases, it is likely that the number of outside common trends will decrease and that the stock markets will become even more integrated.
Our findings have some implications for international portfolio diversification. Overall, the results suggest that investing in several Arab stock markets may offer limited opportunity for further long-term risk diversification. Investors desiring to diversify their portfolios vis-à-vis developed and other non-Arab emerging stock markets may be able to achieve additional diversification by investing in Jordan. The ASE compares favorably with many other Arab markets in terms of investment restrictions, transparency, and the regulatory environment, and has had relatively low historical price volatility. The study also shows that the Jordanian market is Granger-caused by the markets in Saudi Arabia and Kuwait. Thus, outside investors could get indirect exposure to these markets by investing in Jordan.
Our results also have important policy implications for Jordan. The fact that the ASE is cointegrated with the other Arab markets could be due to the fact that global investors see
35 The free float of individual stocks or in the aggregate is not publicly available at present but could be easily calculated by the ASE. It could also be useful in calculating a performance index for the free float only.

- 32 -
these markets as close substitutes, and the analysis shows that they are. Jordan should thus continue enhancing the transparency and the effectiveness of regulation and supervision of its capital markets so as to distinguish itself further from other markets. This would be important, as Jordan will likely rely on foreign capital inflows in the foreseeable future. Moreover, it would tend to reduce any potential contagion from adverse regional developments.
Finally, there are areas where future research might be useful. One issue that could be investigated is when the Jordanian stock market became integrated with Arab markets under study and why. Another topic could be the role of banks in the Jordanian market, and Arab Bank, in particular.

- 33 -
2000 2001 2002 2003 2004 2005
Number of Listed Companies 163 161 158 161 192 201
Market Capitalization (JD million) 3510 4477 5029 7773 13034 26667
Value Traded (JD million) 335 669 950 1855 3793 16871
Turnover Ratio (%) 12 20 27 49 58 94
ASE General Weighted Price Index (point) 1331 1727 1700 2615 4246 8192ASE General Weighted Price Index (%) 29.8 -1.6 53.8 62.4 92.9
Value of Traded Bonds (JD million) 7.2 7.2 9.7 11.7 6.0 3.1
P/E Ratio (times) 14.8 15.3 13.0 21.7 31.1 44.2
P/BV (times) 1.1 1.4 1.2 1.9 2.7 3.2
Dividend Yield Ratio (%) 3.6 2.7 3.2 2.4 1.7 1.6
Non-Jordanian Ownership of Market Cap. (%) 42 39 37 39 41 45
Net Investment of Non-Jordanian (JD million) -11.8 -107.5 0.9 81.8 69.0 413.0
Market Capitalization / GDP (%) 59 70 74 108 160 292
Source: Amman Stock Exchange.
Appendix Table 1. Key Statistics of the ASE, 2000–2005
CORP. BONDS TREAS. BONDS DEV'T BONDS
2000 5,169,150 0 2,065,632
2001 6,299,148 0 924,066
2002 9,204,934 0 483,967
2003 10,490,050 153,504 733,375
2004 5,936,392 0 95,494
2005 1,008,799 2,116,250 10,656
Source: Amman Stock Exchange.
Appendix Table 2. Bonds Market Trading Value (Market Value in JD)

- 34 -
FPE AIC SC HQArab markets
SAUDI ARABIA 2 2 1 1KUWAIT 2 2 2 2OMAN 2 2 1 2EGYPT 2 2 1 1LEBANON 1 1 1 1TUNISIA 1 1 1 1MOROCCO 2 2 1 1
Arab markets as a group 1/ 2 2 1 1
Emerging markets
TURKEY 1 1 1 1ISRAEL 2 2 1 1BRAZIL 1 1 1 1INDIA 3 3 1 1MEXICO 1 1 1 1PAKISTAN 3 3 1 1
Developed markets
UK 2 2 1 2SP500 4 4 1 2AMEX 2 2 1 2
FPE: Final prediction error AIC: Akaike information criterion SC: Schwarz information criterion HQ: Hannan-Quinn information criterion
Source: Authors' calculations.
1/ Excluding Morocco and Tunisia
Appendix Table 3. Lag length tests(Selected lags by the criterion)

- 35 -
REFERENCES
Chen, G.-M., M, Firth, and Meng Rui, O, 2002, “Stock Market Linkages: Evidence from Latin America,” Journal of Banking and Finance, Vol. 26, pp. 1113–41.
Click, Reid W. and Michael G. Plummer, 2005, “Stock Market Integration in ASEAN after the Asian Financial Crisis,” Journal of Asian Economics, Vol. 16, pp. 5–28.
Dimson, Elroy, Paul, Marsh, and Mike, Staunton, 2006, ”The Worldwide Equity Premium: A Smaller Puzzle”, SSRN working paper series (April 7, 2006). Available via the Internet: http://ssrn.com/abstract=896169.
Engle, Robert F. and C.W.J. Granger, 1987,. “Co-integration and Error Correction: Representation, Estimation, and Testing,” Econometrica, Vol. 55, 251–76.
Engle, Robert F. David F., Hendry, and, Jean-Francois, Richard, 1983, “Exogeneity,” Econometrica, Vol. 51, pp. 277─304.
Errunza, V., 1983, “Emerging Markets: A New Opportunity for Improving Global Portfolio Performance,” Financial Analysts Journal, Vol. 39, pp. 51–8.
Eun, C., and B, Resnick, 1984, “Estimating the Correlation Structure of International Share Prices,” Journal of Finance, Vol. 39, 1311–24.
French, KR., 1980, “Stock Returns and the Weekend Effect,” Journal of Financial Economics, Vol. 8, pp. 55─69.
Gregory, A.W., 1994, Testing for Cointegration in Linear Quadratic Models, Journal of Business and Economic Statistics, Vol. 12, pp. 347─60.
International Monetary Fund, 2006, World Economic Outlook, April Washington.
Johansen, Søren, 1988, Statistical Analysis of Cointegrating Vectors, Journal of Economic Dynamics and Control, Vol. 12, pp. 231─54.
——— 1991, “Estimation and Hypothesis Testing of Cointegrating vectors in Gaussian Vector Autoregressive Models,” Econometrica, Vol. 59, pp. 1551–80.
——— 1992, “Testing Weak Exogeneity and the Order of Cointegration in UK Money Demand Data,” Journal of Policy Modeling, Vol. 14(3),pp. 313─34.
——— 1995, Likelihood-Based Inference in Cointegrated Autoregressive Vectors, Oxford: Oxford University Press.

- 36 -
——— and Katarina Juselius, 1990, “Maximum Likelihood Estimation and Inferences on Cointegration—with Applications to the Demand for Money,” Oxford Bulletin of Economics and Statistics, Vol. 52, pp 169–210.
Kasa, K., 1992, “Common Stochastic Trends in International Stock Markets,” Journal of Monetary Economics, Vol. 29, pp. 95–124.
Rangvid, J., 2001, “Increasing Convergence Among European Stock Markets?, “A Recursive Common Stochastic Trends Analysis,” Economics Letters, Vol. 71, 383–89.
Richards, A.J., 1995, “Comovements in National Stock Market Returns: Evidence of Predictability But Not Cointegration,” Journal of Monetary Economics, Vol. 36, pp. 631–54.
Solnik, B., 1974, “Why Not Diversify Internationally Rather than Domestically?” Financial Analysts Journal” Vol. 30, pp. 48–54.
Stock, James H., 1987, Asymptotic Properties of Least Squares Estimators of Cointegrating Vectors, Econometrica, Vol. 55, 1035–56.
Topol, Richard, 1991, “Bubbles and Volatility of Stock Prices: Effect of Mimetic Contagion,” The Economic Journal, Vol. 101, pp. 786–800.


