23
Robert Armstrong / Cameron Kayter Agri-Environment Services Branch The Land & Infrastructure Resiliency Assessment (LIRA) Project Economic Flood Hazard Assessment

Robert Armstrong / Cameron KayterAgri-Environment Services Branch
The Land & Infrastructure Resiliency Assessment (LIRA) Project
Economic Flood Hazard Assessment

LIRA Background• Subcomponent of Climate Adaptation for Resilience in Agriculture project
(Harvey Hill, AESB)
– Goal: provide decision makers at the watershed scale with support tools required for climate change/variability vulnerability and adaptation assessments.
– Support tools: “How to” guide for future pilot/watershed studies containing detailed methodologies and lessons learned from the research (version 1.0 available)
– Consists of 5 phases:• Phase 3 (Past) – first pilot study (RM of Corman Park, SK and area);
economics ☺, flood mapping methods • Phase 4 (Present) – refining methodologies, identifying further challenges• Phase 5 (Future) – transition to operational environments

• At the heart LIRA is an Economic Study that requires a flood hazard assessment
• The final product which supports decision making is a COST-BENEFIT ANALYSIS
– Damage Costs estimated for a Base Case (Status Quo) – Potential Benefits and Cost Savings due to various adaptation options– Cost – Benefit analysis requires numerous inputs to feed the economic
model
Automated tools being developed For economic assessment (i.e. contract)
LIRA is an Economic Study

1. Map the landscape
2. Get extremes information
3. Model/Predict the impacts
“Flood Maps” Damage Costs
4. Identify, Develop and rank adaptation options
- Ag-Sector responses (riparian areas, BMP’s?)
- Infrastructure?- Policy/zoning? Other?* 25 year planning window
5. Reach informed decisions
Steps 1-4 provides information in supportof decision making
<
Cost savings
GIS
Climate, Hydrology
Modeling & Economics
Cost-BenefitAnalysis
How Does LIRA Assess Flood Risk?
- Vital economic, social and environmental infrastructure
- Topography
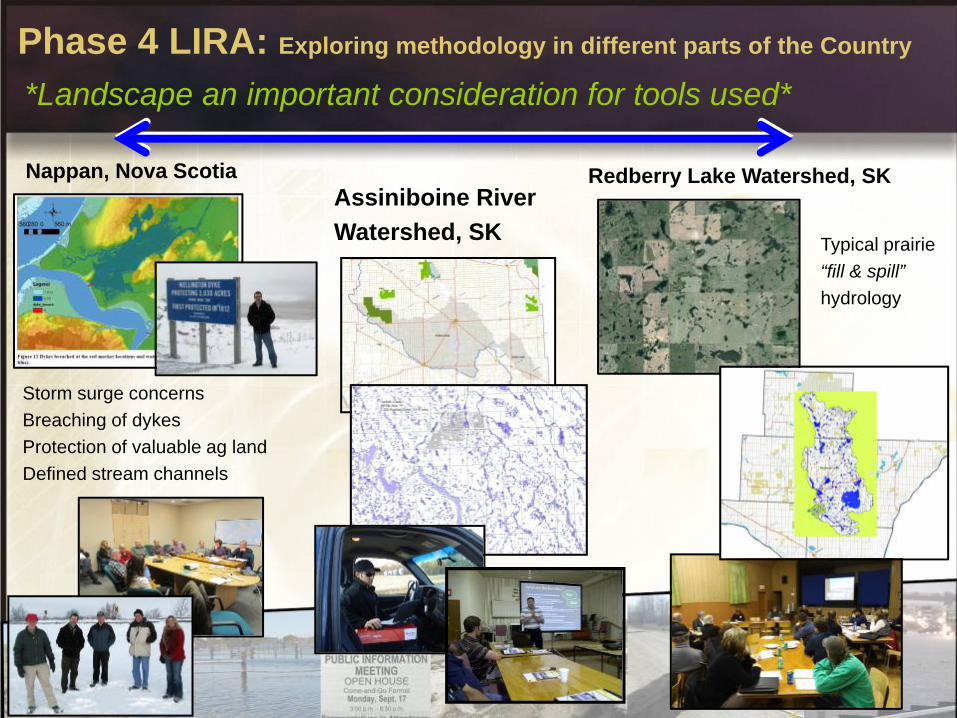
Phase 4 LIRA: Exploring methodology in different parts of the Country
Typical prairie “fill & spill” hydrology
Redberry Lake Watershed, SKNappan, Nova Scotia
Storm surge concernsBreaching of dykesProtection of valuable ag landDefined stream channels
Assiniboine River Watershed, SK
*Landscape an important consideration for tools used*

Primary Modeling Challenge
• Primary Challenge:
Cost–Benefit analysis requires a spatial input of run-off/flooding extent – Connectivity and associations between real world features matters– Need to derive potential intersections of water with vital landscape components– Driven by landscape characteristics; not just locations of permanent channels
• Solution:
Can we identify vulnerable areas (i.e. hot spots) within the landscape using a simple modeling approach that can provide the spatial input?– For Base Case?– For Benefits/Cost savings with changes due to adaptation options?

Available Modeling Methods *Caution: need to generate spatial output*
• Standard run-off/flood modeling approaches considered: tied to theory and landscape characteristics; time and economic constraints?
– Hydrology (flow rates, peak flows, timing hydrographs at points along channels, at outlets); limited scope
– Free surface flows (1D - 3D models to simulate extent, depth, velocity, duration inundation areas associated with channels, dykes and dams); very complex tools
– Design flows (Culvert hydraulics within a drainage system); strict engineering
• Alternative landscape spatial run-off/flood modeling approach
– Consider characteristics of entire topography (ALL drainage paths and potholes)– Directly model the FATE of spatial runoff over entire landscape– Not a standard hydrological model

Possible Methodological Flow Chart
Economic Analysis
Spatial Modeling
Hydrological Modeling
1D – 3D Free Surface Flow
Modeling
Drainage design;Culvert
Hydraulics
GISReceptors
Water extent
Ground WaterModeling???
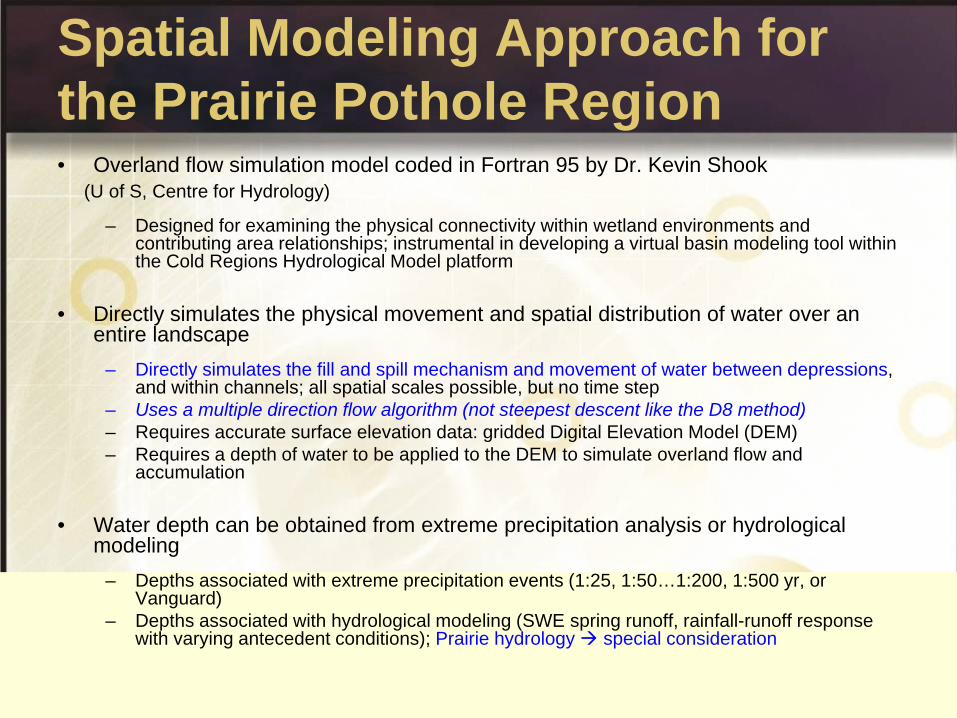
Spatial Modeling Approach for the Prairie Pothole Region • Overland flow simulation model coded in Fortran 95 by Dr. Kevin Shook
(U of S, Centre for Hydrology)
– Designed for examining the physical connectivity within wetland environments and contributing area relationships; instrumental in developing a virtual basin modeling tool within the Cold Regions Hydrological Model platform
• Directly simulates the physical movement and spatial distribution of water over an entire landscape
– Directly simulates the fill and spill mechanism and movement of water between depressions, and within channels; all spatial scales possible, but no time step
– Uses a multiple direction flow algorithm (not steepest descent like the D8 method)– Requires accurate surface elevation data: gridded Digital Elevation Model (DEM)– Requires a depth of water to be applied to the DEM to simulate overland flow and
accumulation
• Water depth can be obtained from extreme precipitation analysis or hydrological modeling
– Depths associated with extreme precipitation events (1:25, 1:50…1:200, 1:500 yr, or Vanguard)
– Depths associated with hydrological modeling (SWE spring runoff, rainfall-runoff response with varying antecedent conditions); Prairie hydrology special consideration

Value of Spatial Modeling Approach
Provides a practical (simple), fast, and focused analysis of surface runoff and storage capacity within a landscape
1. Detailed elevation data can provide realistic landscape drainage patterns & identify any zones of water accumulation
2. Can produce snapshots of evolving water distribution during entire simulation
3. Can identify vulnerable locations (hot spots) that intersect with vital economic infrastructure or future planning initiatives etc.
4. Provides a required input for an economic assessment of damage cost estimates in vulnerable areas compared with costs of adaptation options

Value depends on data quality and scale

Drainage paths and water bodies represented well
Uncertainty in flat areas?
Validation Important
Lower quality data can still be useful if there is sufficient topography & local knowledge & professional expertise is utilized
Example: 30 m SRTM V3 “void-free”, “floating point” (NASA, JPL)

Limitations
• Quality of elevation data determines realism of water distribution– Poor quality or coarse data produces unreliable spatial patterns– DEM array size determines total simulation time; seconds to several days
• Not a standard hydrological or hydraulic model– Does not include a time step, or directly consider hydrological processes– Focuses on distribution of water and depth (where applicable), does not provide
discharge rates, peak flows, duration or strictly modeled channel inundation– Not designed for examining culvert hydraulics
• Workload increases with level of DEM detail (< 10 m scale)– Road networks impound water (i.e. act as dams) – Some DEM conditioning may be required to correct FATE of drainage– need to know location of drainage structures (e.g. culverts and bridges)

Example of DEM Conditioning: drainage correction at culvert location

Example of Surface Runoff Modeling
Yorkton Creek - Moderate quality data – 30 m SRTMSmith Creek - High quality elevation data – 10 m LIDAR

Value of Local Knowledge
Do model outputs offlooding “hotspots”make sense to localstakeholders?
Are “flood maps” A realistic representation?

Adaptation Scenario Considerations
• Base case used as a comparative reference for exploring potential adaptation strategies
• Examples– Currently being considered in Assiniboine and for future - Zoning,
wetland restoration, retention ponds; regulated/sustainable drainage
– Redberry Lake development policy guidelines (Zoning for future growth)
– Nappan (Reducing vulnerability to flood damages on adjacent Ag land -Testing dyke configurations and capacities)
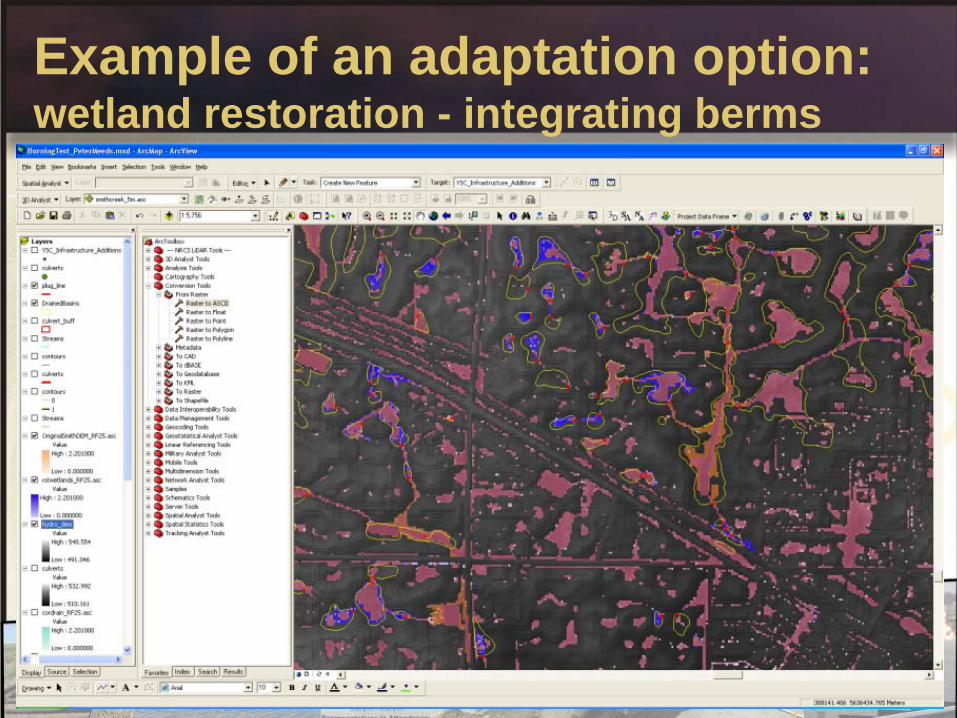
Example of an adaptation option: wetland restoration - integrating berms
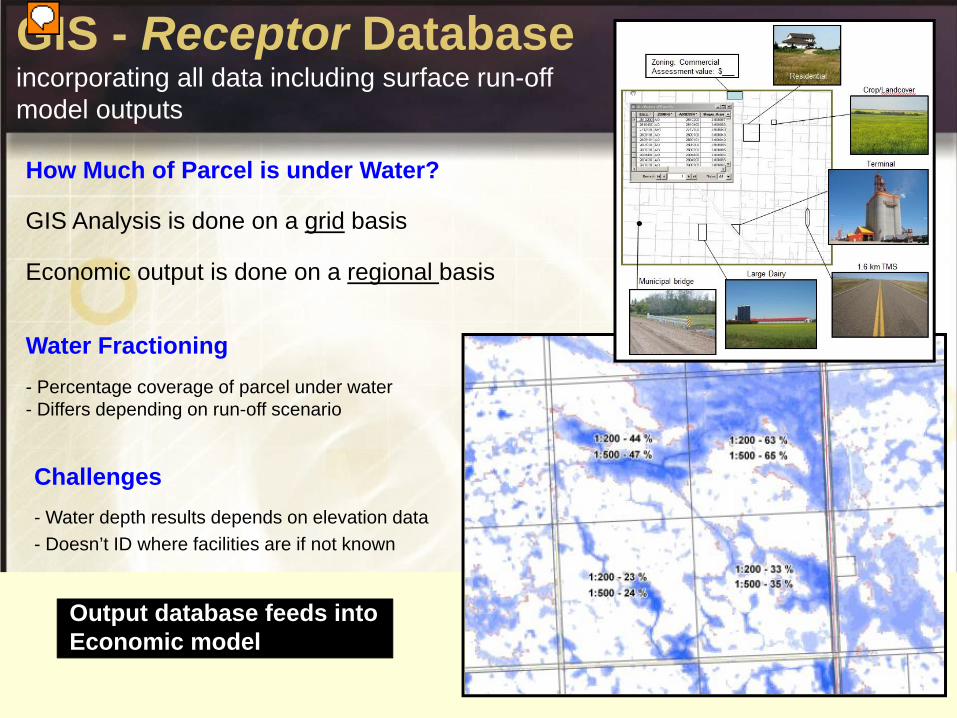
GIS - Receptor Database incorporating all data including surface run-off model outputs
- Water depth results depends on elevation data- Doesn’t ID where facilities are if not known
Water Fractioning- Percentage coverage of parcel under water- Differs depending on run-off scenario
Challenges
GIS Analysis is done on a grid basis
Economic output is done on a regional basis
How Much of Parcel is under Water?
Output database feeds into Economic model

Future Improvement/Challenge
Integrate various modeling approaches to provide a comprehensiveunderstanding of adaptation impacts
1. Spatial Component (LIRA)
2. Hydrology Component (hydrographs, processes)
3. Free Surface Flow Component (channel inundation)
4. Culvert Hydraulics (design capacity)
5. Big picture externalities
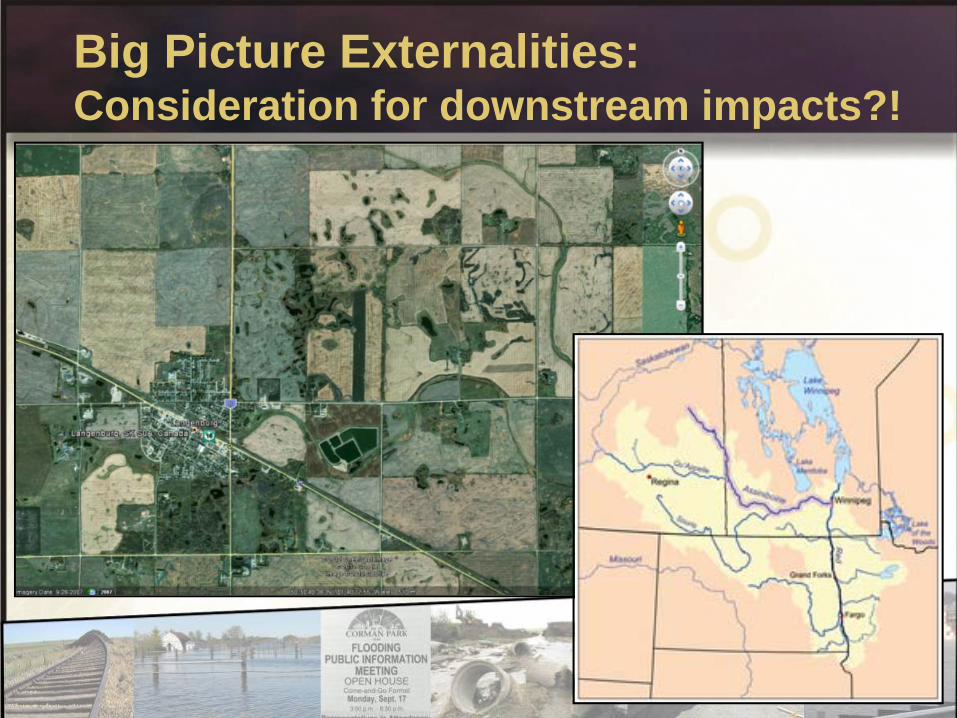
Big Picture Externalities: Consideration for downstream impacts?!
Summary
• LIRA is a methodology for decision makers that outlines steps for an economic flood hazard and adaptation assessment (potential implications for drought mitigation)
– Decision trees for cases where information is limited or detailed – Landscape an important consideration for modeling strategy taken– Requires spatial outputs for base case and adaptation options– Exploring spatial runoff simulation model approach; positive feedback from
end users– More technical rigor possible by integrating hydrological information as input
and combining modeling approaches
• Increased capacity needed to address complex modeling needs
– Increasing demand from watershed groups for comprehensive information– No single tool capable of addressing complex flood modeling problems– Need to consider capacity building and promotion of “Community of Practice”
to address multi-dimensional modeling issues

Contact Information
Photo Credit: AWSA
Flooding in the Assiniboine Watershed
Dr. Robert ArmstrongVisiting FellowNational Agroclimate Information Service, AESB Agriculture and Agri-Food Canada Telephone: 306-975-5382
robert. [email protected]
Cameron Kayter A/LIRA CoordinatorAgri-Environment Services Agriculture and Agri-Food Canada Telephone - 306 975-4076
Acknowledgements
Cam KennyErl SvendsenAron HershmillerJesse NielsonLyle BoychukDr. Kevin ShookDr. Gordon SparksDr. Paul ChristensenTom HarrisonJohn Kindrachuk


