Page 1
1
ThelegacyofauthoritarianregimesondemocraticcitizenshipAglobalanalysisofauthoritarianindoctrinationandrepression1
AnjaNeundorf(UniversityofNottingham)
NatashaEzrow(UniversityofEssex)
JohannesGerschewski(HumboldtUniversity,Berlin)
Roman-GabrielOlar(UniversityofEssex)
RosalindShorrocks(UniversityofOxford)
June15,2017
To be presented at the 7th Annual Meeting of the European Political ScienceAssociation,Milan,June22-24,2017.
1Draftversion1.Pleasedonotcirculate.Thisversionwasalsopresentedatthe2017AnnualMeetingof theMidwest Political Science Association, Chicago, April 6-9, 2017 and the ECPR Joint Sessions,Nottingham,April26-29,2017.
Page 2
2
Abstract
Thisresearchaddressesimportantandunresolvedquestionsofdemocratization,byusing a new methodological approach of cohort analysis to examine the lastinglegacyofauthoritariandictatorships.Weareconductingacomprehensiveanalysisofpost-authoritariancountriesfromdifferentpartsoftheworldduringtheentire20thcentury that experienced different types and durations of suppression. We showthat the extent to which an authoritarian regime indoctrinates its people andrepresses dissent has a lasting impact on their citizens that goes beyond theirexistence. Totestanewlydevelopedtheoryofauthoritariansocialization,existingsurvey data from numerous post-authoritarian countries is harmonized andcombined with the data of Varieties of Democracy. The data is analyzed usinghierarchicalage,period,cohortanalysistoestimatethegenerationaldifferences indemocratic support. The results show that there are distinct cohort differences insatisfactionwithdemocracythatareduetothepastexperienceofgrowing-upundernon-democratic system.This researchhas important implication forunderstandingdemocratizationfromamicroperspective,asthelegacyofauthoritarianregimecanunderminethedevelopmentofademocraticpoliticalculture.
Briefoverview:Aglobalanalysisofpost-authoritarianregimesandthelastingimpactontheircitizens’democraticsupport.Keywords:Authoritarianregimes,indoctrination,democraticsupport,nostalgia,cohortanalysis.
Page 3
3
Introduction
In2015,SouthKorea’sGallupInstituteconductedarepresentativeopinionpolland
askedtheircitizenswhohasbeenthebestleaderofthecountrysince1945.44%of
all and 71%of the respondents in their 60s voted for the formermilitary dictator
Park Chung-hee, being followed with wide margin by the democratically elected
presidentsRohMoo-hyunandKimDae-jung.Afterthreedecadesofdemocraticrule,
particularly those people who experienced dictatorship voted for the dictator as
havingbeenthebestleadertheyeverhad(YonhapNews2015).
Such favorable attitudes towards authoritarianism are no South Korean
exceptions.2On the contrary, nostalgia about the authoritarianpast hasbecomea
majorobstacle for the consolidationof democracy tobe “theonly game in town”
(Przeworski 1991, 26). Nolens volens, we should concede that these nostalgic
feelings donot comeout of thin air. Instead, theydemonstrate that authoritarian
regimesleaveanimprintontheirsocietiesthathindersdemocratizationprocesses.
Barrington Moore (1966: 23) famously stated: “no citizens, no true
democracy”.Thisisthehallmarkofamicro-foundationalperspectiveofdemocracy.
But:howdocitizensbecomedemocratictobethisbedrockofdemocracy?Weknow
from research mainly conducted in advanced democracies that democratic
citizenship and political engagement develop early in life during the so-called
formativeyearsandthenremainrelativelyunchangedinlaterlife.Thisimpliesthatif
we do not become democrats when we are young, we might never be fully
2Wetreat“authoritarianism”,“autocracy”,and“dictatorship"asinterchangeable.
Page 4
4
democraticcitizens.This isan importantproblem ifweconsider thatmanypeople
didnotgrow-upindemocracies,butautocraciesinstead.
In this light, the article poses two questions: how do autocratic regimes
createsuchafollowingamongitsnormalcitizens?And,subsequently,howdoesthis
authoritarianimprintaffectthecitizens’beliefsaboutdemocracyaftertheautocracy
broke down? In order to answer these questions, we are using a novel
methodological approach of cohort analysis, which allows us to study the distinct
politicalpreferencesofdiversegenerations that livedeitherunderdictatorshipsor
democracies. For this we are applying a large-N approach by including 73
democracies fromaround theglobe.3Historically, theanalysis includesgenerations
thatcameofageduringtheentire20thcentury.Theempiricalanalysiscombinesthe
macrodataofVarietiesofDemocracy(Coppedgeetal.2016a)with individual-level
data using a newly created harmonized public opinion dataset that combines 96
cross-national datasets from eleven different studies (e.g. World Value Survey,
LatinoBarometer,EuropeanSocialSurvey).4
We show that citizens' formative experiences in non-democratic systems
impacttheirpoliticalpreferencesevenaftertheregimedemocratized.Theselegacy
impactshave important implications for thedevelopmentofademocraticpolitical
cultureintransitioningsocieties.Peoplethatgrew-upinautocraciesaremorecritical
withdemocracy,comparedtothosepeoplethatgrewupindemocraticcontexts.We
showempiricallythatthemoreanauthoritarianregimeindoctrinatesandrepresses
its citizens during their formative years, the less satisfied are these people with
3ThelistofcountriesandthenumberofrespondentspercountrycanbefoundintheAppendixA1.4AppendixA2liststhedatasourcesoftheindividual-levelsurveydata.
Page 5
5
democratic principles. Authoritarian regimes cast a long shadow on their citizens
evenaftertheirdownfall.
This paper contributes to the growing literature on authoritarian regimes
puttingcitizensatthecenterofattention.Ourresearchhelpstobetterunderstand
the relationship between dictatorships and their populations. We further make a
contribution to the study of democratization by focusing on the legacy of
authoritarian thinking that persists in post-authoritarian societies and that clashes
with democratic values and principles. Further, we advance the study of public
opinion by testing the well-established theory of political socialization outside
advanceddemocracies.
Howautocraciescreateamassfollowingamongtheircitizens?
Inthelastyears,anewwaveofscholarshiphasincreasedourunderstandingofinner
dynamics of autocratic regimes. The “institutional turn” (Pepinsky 2014) has
provided uswith insights about the role that formal and informal institutions like
parties, parliaments, and power-sharing arrangements play in sustaining
authoritarian rule (Gandhi 2008; Magaloni 2006; Smith 2005; Svolik 2012). These
institutionsshouldfacilitateco-optationeffortsandsecureintra-elitecohesion.
However, inordertotargetbroadersegmentsofsociety,dictatorshipshave
twoinstrumentsintheirtoolbox.Inordertocreateafollowingamongtheircitizens,
autocracies rely on repression and legitimation. Dictators almost by definition
repressdissentandusecoercivemeans to securecompliancewith theestablished
Page 6
6
rules (Davenport 2007; Earl 2011; Escribà Folch 2013). Dictators either violate the
personal integrityof thepeoplebyusingkillings, torture,or forceddisappearances
or they suppress civil liberties like the freedom of religion and the freedom of
domesticandforeignmovement(Henderson1991,121–22;MitchellandMcCormick
1988, 482–86, Møller and Skaaning 2013; Poe and Tate 1994). In general, these
repressivemeasures aim at instilling fear among the citizens. Using physical force
andpsychological threat, theycontrol thebehaviorofpeople.Unwanteddemands
to the political system are curtailed, and compliance with the regime’s rules is
enforced.
But repression is not the only way in which regimes control their citizens.
Even the most brutish regimes do not have the capacities to keep their whole
population “in check”. The alternative route that autocrats can take in order to
secure their grip to power is to achieve a legitimacy belief among its citizen (Linz
1975).Forachievingsuchabelief,dictatorshipsindoctrinatetheircitizens.
Wedefineindoctrinationasthedeliberateinculcationofadoctrine,ideology,
and political values (Brandenberger, 2014). This goes beyond merely fostering a
mentalityofobedience. Indoctrinationisaprocessbywhichasubject irreversibly
learns an attachment (Eibl-Eibesfeldt and Salter, 1998, 422). Autocracies
indoctrinatetheircitizensinordertojustifywhytheyareactuallyentitledtorule.Be
itpoliticalideologies,nationalisticslogans,ethnicexclusions,orreligiousideas,they
allhaveincommonthattheyshouldprovidethe“normal”peoplewithanarrativeof
whytheincumbentshouldbeseenaslegitimate(Gerschewski2013).Regimesmay
Page 7
7
also indoctrinate toconvince individuals that there isaneed for somesuffering to
achievethemissionoftheregime(Adler,2012).
We propose three mechanisms through which indoctrination takes place:
education, media, and organizations. Firstly, indoctrination via education is a
particularly effective and insidious tool. Schools and kindergartens are places in
which the belief of citizens can be shaped already at an early age. Teaching pro-
regime formulas and ideas and prescribing correct curricula at schools and
universities are common features of autocratic regimes. Ritual praise and
expressionsof loveisdirectedbyteachers,fellowstudents,andtextbookstowards
theleaders(Eibl-EibesfeldtandSalter,1998,432;Lott1999,1990).Amongthemany
empiricalexamples,Cantonietal.(forthcoming)hasrecentlyshownhowintroducing
new pro-regime contents in the curriculum in China led to higher trust in
governmentofficials anda re-alignmentof viewsonpoliticalparticipationand the
Chinese understanding of democracy. Indoctrinating in the schools can have a
particularly strong effect on attitudes towards the regime. Therefore, autocratic
regimeshaveahighinterestinprovidingwidespreadstate-controllededucation.
Secondly,autocraciesintendtocontrolthemedia.Fromtotalitarianexcesses
that incorporatemedia control among itsmajor features (Friedrich and Brzezinski
1956) to modern forms of authoritarian rule, autocracies have always sought to
control the information that citizens receive (Lott, 1999).5Weknow froma recent
5Democratizationresearchalmostunanimouslyagreesthatthelessalternativesourcesareavailablethemorestabletheautocraticregimeis.Theideaisstraightforward:Thelessinformationthatneedstobecontained,thebetterfortheautocracy.Foreignmediaisusuallyequaledwithunderminingandpotentially dangerous content. However, under certain circumstance blocking of foreign media issometimes counterproductive. Kern andHainmueller (2009)have shown that exposure toWesterntelevisionhadindeedastabilizingeffectinEasternGermany.Westerntelevisionwas“opiumforthe
Page 8
8
study of Adena et al. (2015) that media exposure, here to radio, increased the
support for the Nazis in Germany. Della Vigna et al. (2014) find that exposure to
Serbian media increases nationalistic sentiments among Croatians and voting for
extremenationalisticCroatianparties. IntheirclassicstudyonBrazil’sdictatorship,
GeddesandZaller(1989)haveshownthatwhiletheintellectualelitesmightbeable
to resist government-led propaganda, it is the middle class that is the most
susceptibletopropagandachannels.
The third mechanism of indoctrination that we propose refers to the
organizational strength of the regime. Mussolini’s famous dictum that the party
should penetrate society like the capillaries the body resonates here. The idea is
straightforward: the higher the density of regime-loyal associations and
organizations throughout the country, the higher is the likelihood that the
indoctrination content is transmitted to citizens. These organizations cover all
aspects of private and public life and range from interest groups to all kinds of
businessandprofessionalorganizationsaswellaslaborunions.Besidesschoolsand
media, this is a third effective route of fostering a legitimacy belief among the
citizensinanautocraticregime.
To sumup,autocracies cancreateamass followingvia twoways: fearand
support.While the usage of repression is by and large a well-researched topic in
comparative authoritarianism, the research in terms of the latter is in its infancy.
However,wearguethatautocratsneedto legitimatetheirruleaswell.Theroleof
the“ordinary”peopleshouldnotbeunderestimated.
masses”andwasprimarilyusedasasourceofentertainmentratherthaninformation.Itdidnotsparkprotest,butinsteaddemobilizedthepeople.Assuch,itwastoleratedbytheGDRofficials.
Page 9
9
Authoritarianimprinting
Repressionandlegitimationaretheprimarymeanstocreateafollowingamongthe
masses. They provide key anchors for autocratic stability. Yet, they have even a
lasting influence beyond the existence of the autocratic regime (Bernhard and
Karakoç 2007; Pop-Eleches and Tucker 2011). After the downfall of the autocratic
regime,itisthesamepeoplethataregoverned.Thepoliticalstructuremightchange
rapidly,buttheattitudesandvaluesofthepeopledonot.
We introduce the concept of authoritarian imprinting to capture this
phenomenon. In analogy to the mechanical understanding of leaving a mark, we
defineauthoritarian imprintingasprocessofmental coining.Howpeoplegrowup
has a lasting influence. If people live under dictatorship, repression and
indoctrination is part of their every-day life experience. Yet, we know from social
psychologythatbasicvaluesandidentitiesofapersonarerelativelystableandthat
thesefundamentalvaluesareacquiredtoa largeextentalreadyinearlyadulthood
(Krosnick and Alwin 1989; Sears 1999;Miller and Sears 1986). This research very
muchemphasizesthetimeofadolescence,whenpoliticalattitudesandpreferences
areformed(BartelsandJackman2014).Youngcitizens,itisbelieved,arenotyetset
in their political ways and are subsequently more easily influenced by external
factorssuchastheindoctrinationattemptsofthepoliticalregimeinwhichtheylive
(Jennings1989;AlwinandKrosnick1991;SearsandValentino1997).
Mattes,DenemarkandNiemi (2016:4–15)recentlysummarizedthedebate
about “impressionable years”. Theyput forth that it is empiricallywell-established
thattheeffectofearlylearningisadurableandlong-lastingone.Already,theclassic
Page 10
10
workofKarlMannheiminthe1920ssuggestedadolescenceandearlyadulthoodasa
generation’smostimpressionableyears.Whilethereissomedebateabouttheexact
upper and lower bound – Mannheim himself arguing in favor of 17 to 25 while
recentresearchtendstofavoranagespanbetween15and20(BartelsandJackman
2014) – it is safe to say that the formative years for political values are in early
adulthoodinwhichthe“’attitudinalcement’beginstoharden”(Mattesetal.2016:
13).
Withthisinmind,thetimingofauthoritarianimprintiscrucial.Ifweassume
that basic values are persistent and if these basic values are learned in early
adulthood, this has important consequences for the crystallization process of
politicalvaluesandattitudesinpost-authoritariansocieties.Authoritarianimprinting
is then particularly strong when people experience dictatorship during their
impressionable years. It would then have a lasting legacy even after a possible
regime transition to democracy. The common experience of repression and
indoctrinationcastitsshadowindemocratictimes.Ontheonehand,weexpectthat
citizens who have been exposed to widespread indoctrination in their early
adulthood remain undemocratic in their beliefs. Having been socialized in an
authoritarianfashion,leavesadurablemarkonthem.Ontheotherhand,weexpect
that people who have experienced a repressive regime in their early adulthood
always feltalienatedby this typeof rule.As such, they should long fordemocracy
afterthebreakdownoftheancientregimeandshouldvaluedemocraticprinciples,
particularlytherespectforhumanrights,higher.
Page 11
11
Hypotheses
Wehavedefinedauthoritarianimprintingastheprocessofmentalcoiningthattakes
place inearlyadulthood.Duringthisphase,politicalvaluesareshapedandremain
persistent. Authoritarian imprinting therefore results from political socialization
underagivenpoliticalregime,whetherautocraticordemocratic.Wehavealsoset
forththatautocraticregimescreateamassfollowingbyrepressingcivillibertiesand
physical integrity rights as well as by employing different mechanisms of
indoctrination.Forthelatter,widespreadeducationefforts,mediapropaganda,and
organizationaldensityhavebeenthemajormechanismsthatweproposed.
Assuming authoritarian imprinting, we could expect the direction of this
coiningtobetwofold.Firstly,repressionhasbeendiscussedasinstillingfearamong
citizens in order to control their behavior. After the downfall of the ancient
autocracies,we expect to find that those autocratic regimes that havemade high
usageofrepressionshouldhave lessnostalgicfeelingswith itscitizens.Thisshould
beparticularlytrueforviolationsofpersonalintegrityrights.Ifanautocraticregime
has been very repressive, people that lived under such a regime should value
democracy and its respect for human rights higher. People should embrace
democracyafterhavingexperienceddespoticyears.Assuch,weexpectaliberation
effectfromtheoldrepressor.
H1 (repression hypothesis): The more repression is used in an autocratic
predecessorregime,thelessnostalgiawiththeformerregimeandhencethehigher
publicsupportfordemocracy.
Page 12
12
Secondly,autocratsrelyonanotherinstrumentforcreatingamassfollowing:
legitimation efforts.Wehypothesize that the success of thesemeasures increases
nostalgia with the ancient regime in post-authoritarian societies and hence
undermine support for democracy. If a cohort has been successfully indoctrinated
viaschooling,media,andregime-loyalorganizations,andifthishasbeendoneinthe
impressionable years, we expect to find more nostalgia in the post-authoritarian
society.Withthisinmind,theindoctrinationhypothesiscanbestated.
H2 (indoctrination hypothesis): The stronger the indoctrination by the
autocratic regime (viamedia, education, and civic organization channels), the less
supportiveofdemocracypeopleareafterthedemocratictransition.
Hypotheses1and2pointtodifferentoutcomesofauthoritarianimprinting.
Thegoalofourempiricalanalysisistotestwhichofthetwoinstruments-repression
or indoctrination- isstronger in leavinganendurablemarkoncitizens’supportfor
democracy.Inthenextsectionweoutlineourresearchdesigninmoredetail.
ResearchDesign
We test our hypotheses using existing survey data as well as macro data that
measure characteristics of the political regime in power during respondents’
formativeyears.Herewefirstoutlinethemethodologyused,beforedescribingthe
dataandturningtothestatisticalestimationprocedure.
Page 13
13
Methodology-IntroducingCohortAnalysis
In order to test our new theory of authoritarian socialization, we conduct a
comprehensive analysis of post-authoritarian countries during the entire 20th
century(i.e.LatinAmerica,Africa,Europe,andCentral&EastAsia)thatexperienced
differenttypesofrepressionandindoctrination.Forthispurpose,weneedtwotypes
ofdata:individualsurveydataontheonehandandmacroregimedataontheother
hand. To be explicit, we do not rely on survey data that was collected during
authoritarian rule, butafter the regime ended. This is largely due to the fact that
representativepublicopinionresearchisnotpossibleduringauthoritarianregimes.
Weargueherethatitisnotnecessary.Insteadweusethemethodologicalapproach
ofcohortanalysis(Neundorf2010;MuellerandNeundorf2012;SmetsandNeundorf
2014) that allows the identification of distinct characteristics of those generations
thatweresocializedunderdifferentpoliticalregimes.
Studying the imprinted socialization effect beyond the existence of these
regimesmakesitpossibletoinvestigatewhethertheydifferintheirimpactontheir
citizens. We expect to find clear generational differences in terms of political
preferences of people who grew-up under different political regimes within the
samecountry.Forexample,theNazigenerationinGermanyisexpectedtodevelop
distinct characteristics, which should be different from the 1960s West German
generationandthe1960sEastGermangeneration,asallthreegroupsexperienced
different types of political regimes. This empirical phenomenon of varying
socializationexperienceswithinthesamecountrygivesustheopportunitytostudy
the lasting imprint of political regimes, even after their existence.We are further
Page 14
14
abletocomparegroupsofgenerationsthatgrewupunderdictatorshipsandthose
thatcameofageunderdemocracy.
Forthisweneedtodistinguishthreeco-lineartimetrends:age,period,and
cohort (APC)effects.Apersoncouldhavepositiveornegativeviewsofdemocracy
becausesheisyoung-theso-calledlife-cycleorageingeffect,orbecauseshelivesin
a country that faces a big political corruption scandal - the so-called period effect
that affects everyone no matter their age or birth year - or because she was
socialized at a certain point in history - the cohort effect. Here we are mainly
interested in thecohorteffect,whichwearguecontains the socializationeffectof
politicalregimes.
Table1givesanexampleofthisapproach,takingGermanyasanillustration,
distinguishingpeoplewholivedunderthesocialistregimeintheEastbetween1949
and 1990. We measure cohorts using five-year groupings of people that were
socializedat thesame time.Forexample, the first cohort inourGermandatawas
socializedbetween1915and1919,thefinalyearsofWorldWarI.Weoperationalize
socialization cohorts as the year of birth plus 15 years. Hence the first cohort
comprisesrespondentsthatwerebornbetween1900and1904andturned15inthe
period1915to1919.Weassumethatthisisthecrucialageofsocialization.Forthis
group, we can now calculate the average level of democracy at the time of
socialization.ThevaluebasedontheV-Demdata,introducedinmoredetailbelow,
is0.279,whichisaprettyun-democratictimeperiod.
Page 15
15
Table1:CohortsandtheirSocializationContext:ExampleGermany
(WEST)GERMANS EASTGERMANSSocializationCohorts Nof Macro: Micro: Nof Macro: Micro:
obs Democracy Sat.Democ. obs Democracy Sat.Democ.1) 1915-1919 449 0.279 60.134
2) 1920-1924 1,124 0.521 59.991
3) 1925-1929 1,974 0.588 58.740
4) 1930-1934 2,488 0.410 58.398
5) 1935-1939 4,573 0.089 55.379 6) 1940-1944 5,953 0.079 54.923 7) 1945-1949 4,078 57.509 2,362 0.176 43.5288) 1950-1954 5,706 0.728 58.246 3,189 0.174 43.9029) 1955-1959 5,936 0.744 57.707 3,329 0.172 43.48310) 1960-1964 5,417 0.742 57.956 2,619 0.173 43.45411) 1965-1969 5,961 0.742 56.654 3,357 0.173 43.42512) 1970-1974 6,407 0.753 56.315 3,395 0.171 43.64813) 1975-1979 6,759 0.756 55.976 3,627 0.170 43.16314) 1980-1984 6,052 0.764 55.545 3,222 0.172 44.72815) 1985-1989 3,744 0.763 56.032 2,306 0.179 45.05316) 1990-1994 2,008 0.792 55.428 1,793 0.780 47.57817) 1995-1999 2,639 0.794 51.410 18) 2000-2004 1,787 0.794 54.003 19) 2005-2009 873 0.795 59.763
20) 2010-2015 347 0.784 65.264
Note:Cohortsareclusteredin5-yeargroupscalculatedasthebirthyearplus15,whichcorrespondstothetimingoftheformativeyears.Entriesformacroandmicrodemocracyareaveragedacrossthefive-yeargroupings.MacrodemocracyisdefinedaselectoraldemocracymeasuredusingthedatabyVarietiesofDemocracy(seebelowforamoredetaileddefinition).Theindicatorrangesfrom0to1,whereas higher values indicate higher levels of democracy. Themicromeasure is using the surveyindicator satisfactionwith democracy,which ranges from0 to 100,whereas higher values indicatehighersatisfactionwiththewaydemocracyworksinGermany.
We measure democracy support using satisfaction with the democratic
system(moreonthemeasureinthenextsection).Thedatawascollectedinpublic
opinionsurveysbetween1973to2014intheWest(andunifiedGermany)and1990
to 2014 in the East, so during democracy. Respondents are asked to evaluate the
performanceofthedemocraticsystemtoday.Table1thenreportshoweachcohort
evaluatestheworkingoftheGermandemocraticsystemonaverageacrossalltime
points for which each cohort was included in a survey. InWest/unified Germany
Page 16
16
satisfactionwithdemocracyvariesbetween51and65ona0to100scale,whereas
highervaluesindicatemorepositiveviews.
Turning to the German respondents that lived in the German Democratic
Republic (GDR), the socialist East, Table 1 confirms that the period between 1949
and1990wasautocratic(averagedemocracyscoreisaround0.17). It is interesting
tonotethatEastGermanrespondentsareonaveragemuchlesspositiveaboutthe
democratic systemnowadayswithanaverage scoreof45. There is alsonotmuch
variationbetweencohortsintheEast,whichmightbeduetoverysimilarexposure
to the socialist regime,which in theGDRdidnot changemuchduring its40years
existence.
This illustrates the basic idea of themethodological approach used in this
paper. Here we are mainly interested whether there is a systematic relationship
between a person’s socialization context and her support for democracy. In the
example, presented in Table 1, we illustrate this by looking at the average
satisfactionwithdemocracyfor20differentcohorts inonecountryonly.Belowwe
presentstatisticalanalysisfor73countriesandonaverage15cohortspercountry.
Individual-leveldata
To achieve our methodological and empirical contribution, we merge existing,
publiclyavailablesurveydatafromnumerouscountriesfromaroundtheglobe-both
well-established democracies as well as former dictatorships. This substantially
expands the country coverage included in our study.We chose the datasets that
havebeendesignedtobefieldedinseveralcountries,whichensuresthatquestions
arelesscountry-specificbutrathertotravelacrossborders.Furthermore,allstudies
Page 17
17
havebeenconductedasacademicstudiesandhenceadheretoacertainstandard.
Moreover, we only chose studies that included questions related to democratic
attitudesandpoliticalengagement.Weharmonizedthedataofthefollowingpublic
opinionsurveys(includingtheyearsthattheywerefielded):6
• WorldValueSurvey(WVS),1981-2014• Latinobarometer(LB),1995-2015• AsianBarometer(ANB),2001-2014• Afrobarometer(AFB),1999-2015• AmericasBarometer(AB),2004-2014• EuropeanValuesStudy(EVS),1981-2010• EuropeanSocialSurvey(ESS),2002-2014• Eurobarometer(EB),1970-2002• Central&EasternEuropeanBarometer(CEEB),1990-97• ComparativeStudyofElectoralSystems(CSES),1996-2015
Poolingallthesedatasetstogethergivesusabout1.5Millionrespondentsfor
whichwehavevaliddataon thedependentvariableandall control variables.The
differentsurveyquestionsincludedinthediversedatasetswereharmonizedsothat
ajointanalysisispossible.Moredetailsonthequestionofharmonizationdecisions
canbefoundinAppendices3and4.
Dependentvariable:Satisfactionwithdemocracy
Political support is one of the key factors in the development of a democratic
politicalculture(AlmondandVerba1963;Easton1965;Norris1999).Theaim is to
measure the extent to which citizens support the democratic system using the
satisfactionwiththewaydemocracyworks.Wetherebyassumethattheexpression
6In order to account for possible effects of the survey data harmonization process, we include adummyvariableforeachofthedatasets(usingtheWorldValueSurveyasareference).Theestimatesofthesearenotreportedintheresultstables,butareavailableuponrequestfromtheauthors.ThefulllistofallwavesthatwasfieldedperstudycanbefoundinAppendixA2.
Page 18
18
ofsatisfactionasksrespondentstoevaluatetheperformanceofthepoliticalsystem
(Hoffbert and Klingemann 2001: 366; cf. Rose,Mishler, andHaerpfer 1998;Norris
1999). ‘‘Satisfaction with democracy’’ is generally described as an indicator of
supportforthewaythedemocraticregimeworksinpractice,notasanindicatorfor
democracyinprinciple(Canache,Mondak,andSeligson2001;Neundorf2010),since
thisitemmeasuresthe‘‘supportfortheperformanceoftheregime,whichhastodo
withwhattheregimedeliverstoitscitizensandhowthegovernmentofthedayis
capable of dealing with important issues’’ (Linde and Ekman 2003, 396). Asking
citizensaboutthe‘‘satisfactionwithdemocracy’’ isthereforelessabstractthanthe
usualquestionofsupportfor‘‘democracyasthebestwayofgovernment.’’Onthe
otherhand,itisalsolessbiasedthanthesupportforthecurrentgovernment,which
is influencedbypartisan feelingsandotherpoliticalattitudesaswell (Clarke,Dutt,
andKornberg1993;Norris1999).
Inthedatasetsthatwereharmonizedforthisstudy,respondentswereasked
uniformly“howsatisfiedtheyarewiththewaydemocracyworksintheircountry”.7
Responsecategorieshowevervariedfrom4to11.Thevariablewasstandardizedto
0to100,whereas lowervaluesmean lesssatisfactionwithdemocracy.Toaccount
forthespecificeffectsduetostudydesignorquestionnairedesign,weincludethe
datasetasacontrolvariableintothemodel,whichalsoaccountsforthedifference
inresponsecategories.
Figure1plotstheaveragesatisfactionwithdemocracyforthecountries for
which we have data, where darker shades indicate higher satisfaction. It is not
7ThequestionwordingandresponsecategoriesineachstudyarelistedinAppendix3.
Page 19
19
surprising that citizens living advanced democracies in North America, Western
Europe and theOceania evaluate the performance of their political systemsmore
positively.
Figure1:Averagesatisfactionwithdemocracyaroundtheglobe
However, there are also some surprises. For example, satisfaction with
democracy is quite high in Egypt and Syria, which are of course usually not
consideredtohaveademocraticsystem.Aswecannotbesurewhattheresponse
tellsus in thesecases,countries thatarenotdemocraticat thetimeof thesurvey
arethereforeexcludedfromempiricalanalysispresentedbelow.
Theseaveragescoresacrossallsurveywavesthatwehaveforeachcountry
show that there might be some systematic biases in responding to this survey
question.We account for this, by including country fixed effects in our statistical
model,whichonlyconsiderswithin-countrydifferencesinrespondingtothissurvey
item.Themain focus forus iswhethergenerationswithin a countrydiffer in their
evaluationofthepoliticalsystemthatsystematicallycorrespondstotheirformative
experiences.
Page 20
20
Individual-levelcontrolvariables
We control for the gender of respondents, the education level (primary or less,
secondary,post-secondary)8andadummyvariablewhetherarespondentisworking
opposedtobeingunemployed,retiredoranyotherreasonwhypeopledonotwork.
Unfortunately,itisnotpossibletocontrolaperson’sincomeoreconomicwell-being
beyondworking,asthemeasuresweretoodiversetobeharmonized.
Macroregime-leveldata
Themacro-level data on political institutions and regime characteristics are culled
fromtheVarietiesofDemocracy(V-Dem)project(Coppedgeetal.2016).TheV-Dem
projectcollectsdataonpoliticalinstitutionsthatexisted“withinlargeandfairlywell-
defined political units and which enjoy a modicum of sovereignty or serve as
operationalunitsofgovernance (e.g.,coloniesofoverseasempires)” (Coppedgeet
al. 2016b: 15). The data is collected with the help of more than 2,600 country-
experts that code the data with a specially designed online survey. The V-Dem
projectusesaBayesianitemresponsemodeltoincreasethereliabilityofthecoding
andeliminateasmuchofthebias.Theunitofobservationinoursampleiscountry-
year,for177countriesthatcovertheperiod1900-2015.
8For this we use the categorical variable thatmeasures a person’s highest educational degree. Insomedatasetseducationwasmeasuredas yearsof educationor ageof leaving school. The codingschemetoclassifyrespondentsintothethreeeducationgroupsbasedonthisisexplainedinAppendix3. Combing the education variables (categorical and measured from years) leaves only 2% stillmissing.
Page 21
21
Measuringautocracyversusdemocracy
Thefirstvariablethatweusetoevaluatethelegacyofauthoritarianregimesisthe
electoral democracy index fromV-Dem that tries to capture the ideal of electoral
democracy in its fullest sense, whereby the absence of democracy measures
autocracy.The index is calculatedusingBaysian ItemResponseTheory (IRT)based
on the following indicators (Teorell et al. 2016; Marquardt and Pemstein 2017):
freedom of association, clean elections, freedom of expression, elected executive
and suffrage.9The final index is continuous and rangesbetween0 and1,whereas
highervaluesindicatedemocracy.
Inorder todifferentiatebetweenademocracyandanauthoritarian regime
weuseacategoricalvariableapproachproposedbyLindberg(2016),whichtakesthe
electoral democracy index (described above) to generate categorical variables
capturing the level of democracy. We consider a country to be a “minimally
democratic” if the electoral democracy index is equal or above 0.67 and an
autocracyotherwise.Basedonthisclassificationwegeneratedummyvariable that
takes a value of 1 for each country-year in which a regime is not “minimally
democratic”,and0otherwise.10
9More precisely, this is the principle that ”seeks to embody the core values of making rulersresponsive to citizens, achieved through electoral competition for the electorate’s approval undercircumstanceswhensuffrageisextensive;politicalandcivilsocietyorganizationscanoperatefreely;elections are clean and not marred by fraud or systematic irregularities; and elections affect thecomposition of the chief executive of the country. In between elections, there is freedom ofexpressionandanindependentmediacapableofpresentingalternativeviewsonmattersofpoliticalrelevance”(Coppedgeetal.2016a:44).10This variable is also used to restrict countries to be included in the study to only those that areclassifiedasminimalisticdemocraticatthetimeofthesurvey.
Page 22
22
Figure2:OvertimedevelopmentofdemocracyandautocracyinLatinAmerica
Figure 2 plots the development of the electoral democracy index in 19
different LatinAmericancountriesand theUSbetween1900and2015.The figure
clearly highlights the autocratic periods, for example, in Chile under Pinochet
between1973and1990ortheruleofChavezfrom1999onwardsthatsawlevelsof
democracy sliding downwards in Venezuela. This figure demonstrates that the
socialization experience under varying political regimes varies starkly between
different generations of Latin Americans living in the same country. Here we are
interesting in this over-time variation of political experiences within the same
countriesandwhetherthiscorrespondstovaryinglevelsofdemocraticsupport.
Page 23
23
Measuringrepression
Inordertotestthelegacyleftbyauthoritarianregimes,wedistinguishbetweentwo
formsofrepression.11Wedistinguishbetweentheviolationsofthephysicalintegrity
ofapersonontheonehandandtheviolationofprivatelibertiesontheotherhand.
We use the respective physical integrity and private liberties indices from V-Dem
that both range from 0 to 1 whereby lower valuesmean less respect for human
rights(morerepression)andhighervaluesmeanmorerespectforhumanrights(less
repression).
Figure 3.E and F. illustrate the distribution of the two types of repression,
distinguishing between autocracies (solid line) and democracies (dashed line). As
expected, repression is very rare in democracies. However,we also note that the
extentofrepressionvariesgreatlyinautocracies.
Measuringindoctrination
We measure indoctrination using a composite index that captures the three
mechanisms through which we expect autocracies to indoctrinate: education,
politicalpropagandaandcontrolovermasscivilorganizations.Allthreeitemswere
measuredusingdatafromVarietiesofDemocracy.Figure3plotsthedistributionof
thesevariables,distinguishingbetweendemocraciesandautocracies.
Firstly, education equality measures the extent that high quality basic
educationisguaranteedtoall,sufficienttoenablethemtoexercisetheirbasicrights
asadultcitizen.V-Demdefinesbasiceducationtorefertoagestypicallybetween6
11RefertoAppendixA5toseetheexactoperationalizationofallmacroindicators.
Page 24
24
and16yearsofagebutthisvariesslightlyamongcountries(Coppedgeetal.2016:
252).Thevariablerangesfrom0to1,where0denotesthateducationalprovisionis
extremelyunequalandat least75percentofchildrenreceiveeducationthat isof
such low-quality that it undermines their ability to exercise their rights as adult
citizens.
It is regrettably impossible to quantitatively measure educational
indoctrination through curriculum design, content of school textbooks or teacher
trainingforsuchalarge-Nstudy.Usingthisindicatorofeducationequalityisthebest
measure that we could find. The rationale for using this to measure autocratic
indoctrinationisbasedonacapacityargumentandresourceallocation.Dictatorships
can only successfully use the education system as a tool for indoctrination if they
havesufficientcapacitytodoso.Givenresourceconstraints,regimeshavetomakea
decision on how to allocate resources. We assume that if an autocracy has the
capacityandthewillingnesstoprioritizeschooleducationtoextendbasicprovision
tothewholepopulationthattheywilluseeducationforextensiveindoctrination.
Wefurthermaketheassumptionthateducationiscontrolledbythestatein
autocracies.Thestateisexpectedtomakeimportantdecisionsoncurriculumdesign
(e.g. when and how much political education pupils have to take, content of
material),textbooks(e.g.doesschoolmaterialpromoteaspecificview,mentalityor
ideology?), learning methods (e.g. are students taught to memorize or engage in
criticalthinking?)andteachertraining(e.g.howautonomousareteachers?Howare
theytrained?).
Page 25
25
Figure 3.B plots the distribution of education equality in autocracies (solid
line) and democracies (dashed line). Most autocracies do not provide equal
education.However,thereisvariationandabout20percentofdictatorshipsscoring
above0.5oneducationequality.Figure3.Balsorevealsthatthereissomevariation
ineducationequalityamongdemocracies.
Second,wemeasurepoliticalpropagandausingthestandardizedfactorscore
formed of the following indicators from V-Dem: government censorship effort,
critical print/broadcast media, perspectives of the print/broadcast media,
harassmentofjournalists,mediaself-censorship,accesstocriticalmedia,mediabias
andcorruptionofmedia.Thefinalindexrangesfrom0to1,whereashighervalues
meanmorepressfreedomandlesspoliticalpropaganda.Weassumethatthemore
themediaiscontrolledbythestate,indicatedbylowvaluesonthisindex,thehigher
theindoctrinationoftheregime,asitcontrolsthecontentofnewsinformation.As
Figure3.Cshows,thereisquiteabitofvariationamongauthoritarianregimesofthe
extenttowhichmediaiscensored.
Thirdly, we measure the extent to which civil society is controlled by the
authoritarian regimeusing three itemsthat tapat theextent towhichcivil society
organizations(CSOs)canoperatefreelywithouttheinterferenceofthestate.Firstly,
we includeameasureoftheextenttowhichthegovernmentachievecontrolover
entry and exit by CSOs. If the state has full control over civil society, government
exercisesanexplicitmonopolyoverCSOs.Second,weincludetheCSOstructurethat
measures whether the government and CSOs are linked formally through a
corporatist system of interest intermediation. Lastly, we measure the CSO
Page 26
26
participatoryenvironmentandwhethermostassociationsarestate-sponsored,and
althoughalargenumberofpeoplemaybeactiveinthem,theirparticipationisnot
purelyvoluntary.Togethertheseitemsfromastandardizedfactorthatrangesfrom
0to1,whereaslowervaluesindicatemorestatecontrolovercivilsociety.AsFigure
3.Dshows,thereisquiteabitofvariationamongauthoritarianregimesoftheextent
towhichthestateinterferesintocivilsociety.
To sum up, we assume that authoritarian regimes that control media and
civic organizations on the one hand and that equally distribute the resources for
education are themost successful in indoctrinating their people.More specifically
wecalculatetheindoctrinationindexforautocraciesas:
Indoctrination(autocracies)=freemedia+freeCSOenvironment-equaleducation
Here low values in freemedia and CSO environment togetherwith high equal
educationcreatesahighautocraticenvironment.Wefurthercalculateindoctrination
in democracy by assuming high values in freemedia, CSO environmentand equal
education.Theindexfordemocraciesishencecalculatedas:
Indoctrination(democracies)=freemedia+freeCSOenvironment+equaleducation
This combined indoctrination index fordemocraciesandautocracies ranges
from0 to1,whereas lower valuesmeanautocratic indoctrinationandhighvalues
mean democratic, free indoctrination.As Figure 3.A shows, there is a very clear
Page 27
27
distinctionofindoctrinationindemocraciesandautocraciesthatisasexpected.12In
theempiricalanalysis,wearehoweverleveragingthevariationwithinthetwotypes
ifregimesandtheirlong-termeffectontheircitizensthatwereindoctrinatedinthe
respectiveregimesduringtheirformativeyears.
Figure3:DistributionofIndoctrinationIndex,itsSub-ComponentsandRepression
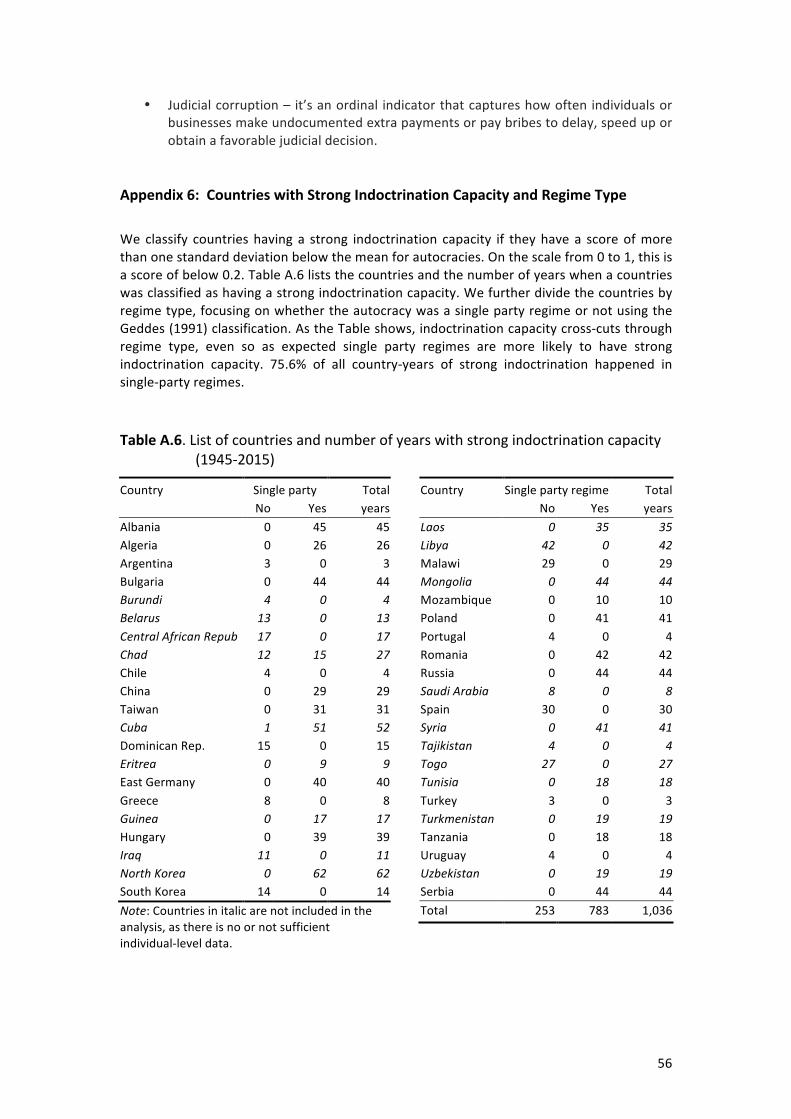
12Onecouldarguethatourmeasureofindoctrinationsimplycapturesthedifferencebetweensinglepartyregimesandtheothertypes(Geddes1999).Itisexpectedthatsinglepartyregimesaretheonesthatverystronglyindoctrinate.WeexplorethisinAppendix6byclassifyingcountrieshavingastrongindoctrinationcapacityiftheyhaveascoreofmorethanonestandarddeviationbelowthemeanforautocracies.Onthescalefrom0to1,thisisascoreofbelow0.2.TableA.6liststhecountriesandthenumberofyearswhenacountrywasclassifiedashavingastrongindoctrinationcapacity.Wefurtherdividethecountriesbyregimetype,focusingonwhethertheautocracywasasinglepartyregimeornot using the Geddes (1999) classification. As the Table shows, indoctrination capacity crosscutsthroughregimetype,evensoasexpectedsinglepartyregimesareindeedmorelikelytohavestrongindoctrination capacity. We see this as a confirmation that our measure captures the theoreticalconcept of indoctrination well, while still giving us enough variation to go beyond existingclassifications.
Page 28
28
Allregimevariables-electoraldemocracy,violationsofpersonalintegrityand
privateliberties,andpoliticalindoctrinationviaeducation,media,andcivilsociety-
are averaged across five-year intervals and are matched to each countries’
socializationcohorts.
Macrocontrolvariables
Several cohortandperiod control variablesare included in the statisticalmodel in
order to account for alternative explanations about the legacy of authoritarian
regimesand the formationofdemocratic support. Firstly,we createda composite
measureformodernizationtomeasuregeneralsocietalchangesthatgobeyondthe
political regime of the time of socialization.Modernization is calculated using the
following items:13 proportion of literate population (based on Vanhanen 2003),
urbanization rate, proportion of non-agricultural population (both based on
Coppedge et al. 2016a and Clio Infra), infant mortality rate, life expectancy rates
(bothbasedonGapminderandClio-Infra),aswellasprimary,secondary,andtertiary
schoolenrolment(basedonWorldBankEducationStatisticsDatabaseandBarroand
Lee2015).
Further,weincludelevelsofpoliticalcorruption(Coppedgeetal.2016a)asa
potentialalternativeexplanationforcohortdifferences insupportfordemocracy.14
Ifpeoplegrowupwithadysfunctionalandcorruptstate, theymightdevelopanti-
13Weestimatedthemodernizationindexusingprinciplecomponentfactoranalysisusingeightitemsthattapatthemodernizationlevelofacountry.Someofthevariableshavemissingvalues.Wehencere-ranthefactoranalysisnumeroustimestocombinetheeightvariablesindifferentways,droppingvariables, to maximize the number of country-year observations. A minimum of two items wasrequired. The final score was calculated as average standardized factor score from the differentiterationsofthefactoranalyses.Seeappendix5.4formoredetails.14ThedetailsofhowpoliticalcorruptionismeasuredintheV-DemdatacanbefoundinAppendix5.5.
Page 29
29
politicssentimentsthataffecttheirevaluationofthedemocraticpoliticalsystemin
general. The corruption index that runs between 0 (no corruption) to 1 (highly
corrupt)andcaptureshowpervasivecorruptionisinacountry.
Several variables are included in themodels to ruleout thepossibility that
citizens’democraticsupport isnotexplainedbythecurrentstateofaffairs intheir
polity andeconomy (Karpel al. 2003;Wagneret al. 2009; Lühiste2014). First,we
includetheeconomicdevelopmentlevelbyincludingGDPpercapitaatthe2011PPP
valueof thedollar (source:WorldBank). Secondly,we include thecurrent levelof
democracyusingtheelectoraldemocracyindexasintroducedabove.Butinsteadof
usingthedemocraticlevelattheageof15ofarespondent,weusethecurrentlevel
as measured in the survey year. This gives us a measure for the quality of the
democratic institutions, which could vary between 0.67 and 1 on the electoral
democracyindex.15Thirdly,weincludetheageofthedemocraticsystem,whichwas
calculatedtoaccountforhowthetimelivinginademocracyaffectsacitizen’sview
onit.16
ThemodelWe estimate an age, period, cohort model. The most important covariates are
therefore, firstly, the age of the respondents, which we include as age in years.
Secondly,wemeasure cohorts in five-year groupings, as introduced above. Lastly,
15Aswerestrictoursampletoonlythosecountriesthatareminimalisticdemocratic,theindexcannotbebelow0.67,whichisthecut-offpoint.16In order to generate this variable we use the autocracy/democracy dummy variable introducedabove to generate a count of years for which a country has been a democracy. To minimize thepotentialforerrorincountingtheyearsofdemocracywerelyonthebtscsStataadd-onfromBeck,KatzandTucker(1998).
Page 30
30
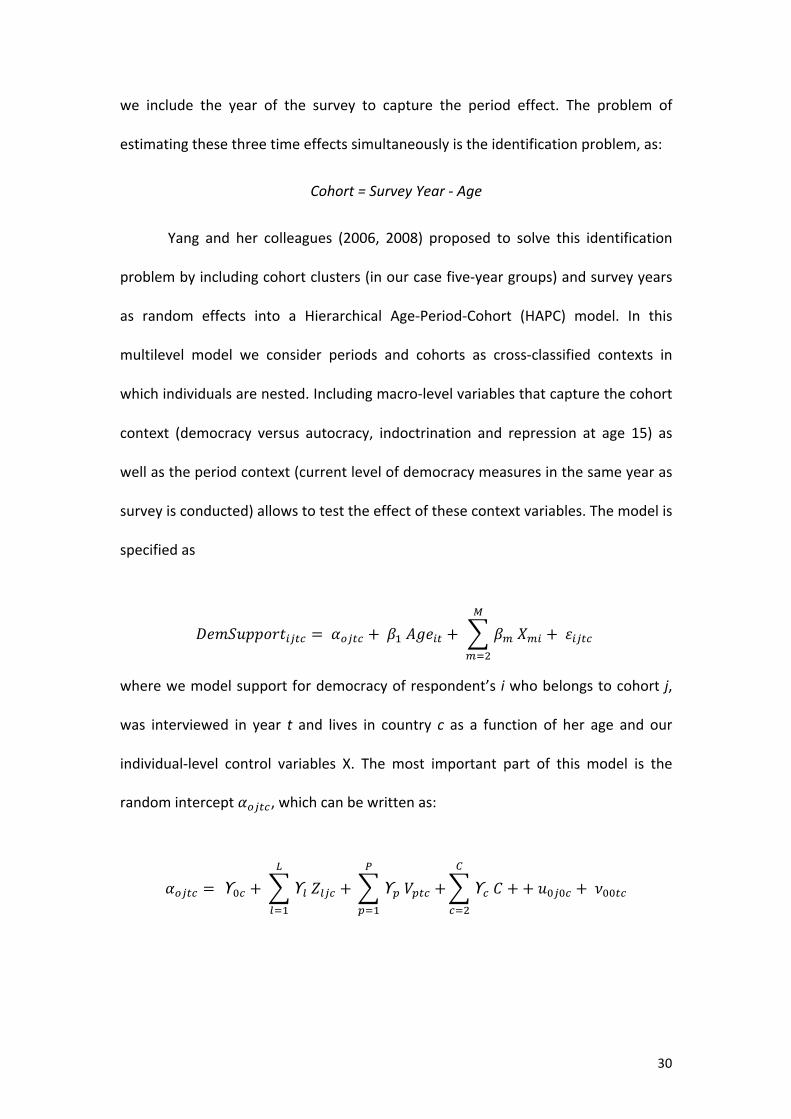
we include the year of the survey to capture the period effect. The problem of
estimatingthesethreetimeeffectssimultaneouslyistheidentificationproblem,as:
Cohort=SurveyYear-Age
Yang and her colleagues (2006, 2008) proposed to solve this identification
problembyincludingcohortclusters(inourcasefive-yeargroups)andsurveyyears
as random effects into a Hierarchical Age-Period-Cohort (HAPC) model. In this
multilevel model we consider periods and cohorts as cross-classified contexts in
whichindividualsarenested.Includingmacro-levelvariablesthatcapturethecohort
context (democracy versus autocracy, indoctrination and repression at age 15) as
wellastheperiodcontext(currentlevelofdemocracymeasuresinthesameyearas
surveyisconducted)allowstotesttheeffectofthesecontextvariables.Themodelis
specifiedas
𝐷𝑒𝑚𝑆𝑢𝑝𝑝𝑜𝑟𝑡!"#$ = 𝛼!"#$ + 𝛽! 𝐴𝑔𝑒!" + 𝛽! 𝑋!"
!
!!!
+ 𝜀!"#$
wherewemodelsupportfordemocracyofrespondent’s iwhobelongstocohort j,
was interviewed in year t and lives in country c as a function of her age and our
individual-level control variables X. The most important part of this model is the
randomintercept𝛼!"#$,whichcanbewrittenas:
𝛼!"#$ = ϒ!! + ϒ! 𝑍!"# +!
!!!
ϒ! 𝑉!"# +!
!!!
ϒ! 𝐶 +!
!!!
+ 𝑢!!!! + 𝜈!!!"
Page 31
31
whereϒ!! measures thegrandmean, Zmeasure the contextof the cohortsandV
measurethecurrentperiodeffects.Wealsoincludecountryfixed-effectsC.Herewe
treatourdependentvariablesascontinues,estimatinglinearHAPCmodels.
Results
As a first step we turn to the random effects for generations in some selected
EuropeanandLatinAmericancountriesand theUS.The randomeffectsplotted in
Figure4.AandB.arebasedonModel1ofTable2,whichonlyincludeindividual-level
control variables. These estimated random effects show us how the cohort effect
looks like for each country for each of the socialization cohorts (birth year + 15).
Estimates below the line of 0 indicate that this cohort is more critical with
democracy,whilepositiverandomeffectsindicatepositiveevaluationofthepolitical
system.
TurningfirsttotherandomcohorteffectsinEurope,wenotethattheHAPC
models confirm the curve-linear cohort effects alreadydemonstratedbyNeundorf
(2010). Eastern European generations that were socialized during the socialist
regimesaremorecritical than theyoungerpost-ColdWargenerations. In someof
thewell-establisheddemocraciessuchastheUKandSwedenwedonotfindcohort
differencesinregardstodemocraticsupport,whileforexampleinFrancethereare
quite big cohort differences, with younger generations being more positive. This
seemstogenerallythecaseacrosstheselectedEuropeancountriesandtheUSand
iscontradictorywhatFaoandMounk(2016)havearguedintheirrecentpaper.
Page 32
32
Figure4:Predictedcohorteffectsondemocraticsatisfaction
Notes:TheresultsarebasedonModel1inTable2foraselectednumberofcountries.
Turning to Latin America we firstly note that the cohort effects are much
smallerthaninEurope,ascanbeseeninthesizeoftherandomeffects.Tohighlight
Page 33
33
however a few interesting findings, it appears that there are no generational
differences in Chile, as the random effects are very close to 0. In Argentina, we
clearly see the post-Military junta generation that came of age in the 1980s and
1990stobeparticularlypositive,whilethegenerationthatmostsufferedunderthe
juntastobemorenegative.WefindasimilarpatterninParaguay,whichsawoneof
the longest lasting autocracies in Latin America.Mexico on the other hand saw a
slow democratization, which is also visible in the V-Dem data plotted in Figure 2
above. The cohort effect inMexico seems to follow this slow upward trend,with
morerecentgenerationstobemostpositiveabouttheMexicandemocraticsystem.
From thesedescriptive analyses of the cohort effects in a fewexamples, it
appearsthatgenerationwhichexperienceautocraciesduringtheiryouthtobemore
negativethanthosethatgrew-upindemocratictimes.Thenextstepistoincludeour
measures for socialization context to test whether we can explain the cohort
variation with these the type of political regime - democratic vs. autocratic,
indoctrinationandrepression.Theresultsofthesemodelsarereported inTable2.
Model2.Aincludesonlythesocializationcontext.Inadditiontotheregimevariables,
we also include the control variablesmodernization levels and political corruption
when respondentswere 15 years old.Model 2.B additionally includes the control
variablesthataccountforpotentialperiodeffectsthataremeasuredatthetimeof
thesurvey.
Firstwe test the general direction of authoritarian imprinting andwhether
peoplewhogrowupunderanauthoritarianregimedidlearntobedemocratic
Page 34
34
Table2:HAPClinearregression,predictingsatisfactionwithdemocracy
M1 M2.A M2.B M3:Autocracyx(socializationcontext)
Indiv. Socializ. Period A.Indoc- B.Physic. C.Private
Controls Context Controls trination Integrety liberties
Age 0.036*** 0.103*** 0.092*** 0.069*** 0.071*** 0.087***
(0.003) (0.008) (0.008) (0.007) (0.008) (0.008)
Individual-levelcontrols(att) Female -0.397*** -0.387*** -0.393*** -0.393*** -0.391*** -0.393***
(0.045) (0.045) (0.045) (0.045) (0.045) (0.045)
Education(ref=primary) Secondary 0.101* 0.112* 0.111* 0.130** 0.112* 0.116*
(0.061) (0.061) (0.062) (0.062) (0.062) (0.062)
Post-secondary 2.012*** 2.056*** 2.076*** 2.090*** 2.077*** 2.080***
(0.073) (0.073) (0.074) (0.074) (0.074) (0.074)
Working 1.299*** 1.320*** 1.326*** 1.313*** 1.325*** 1.323***
(0.050) (0.051) (0.051) (0.051) (0.051) (0.051)
Socializationcontext(atc) ElectoralDemocracy 9.727*** 10.651***
(0.426) (0.432) Autocracy(dummy) -0.866 3.226*** 5.621***
(1.274) (0.903) (1.303)
Soc.Context 7.990*** 11.772*** 15.119***
(1.494) (1.006) (1.472)
Soc.Contextxautocracy 8.833*** -6.730*** -7.682***
(2.140) (1.175) (1.662)
Modernization 1.069 -1.763 1.264 -2.592** -0.486
(1.229) (1.250) (1.135) (1.236) (1.209)
Pol.Corruption -7.451*** -3.287*** -1.889** -2.522*** -4.220***
(0.809) (0.886) (0.801) (0.873) (0.870)
Currentcontext(att) ElectoralDemocracy -4.160 -2.309 -3.933 -4.685
(4.277) (4.262) (4.328) (4.308)
Ageofdemocracy 0.044*** 0.059*** 0.053*** 0.056***
(0.016) (0.016) (0.016) (0.016)
LogGDP(perCapita) 0.071 0.164 0.118 -0.019
(0.482) (0.482) (0.488) (0.486)
Pol.Corruption -14.284*** -16.323*** -14.119*** -14.003***
(2.382) (2.347) (2.397) (2.389)
DataFE Yes Yes Yes Yes Yes YesCountryFE Yes Yes Yes Yes Yes YesIntercept 46.687*** 39.785*** 45.383*** 42.182*** 43.266*** 40.412***
(0.543) (1.287) (5.513) (5.619) (5.630) (5.659)
VarianceComponents Cohorts(1900-2010) 1.800*** 2.645*** 2.534*** 2.020*** 2.439*** 2.339***
(0.059) (0.088) (0.087) (0.068) (0.081) (0.078)
Periods(1973-2015) 10.637*** 8.592*** 8.059*** 8.161*** 8.186*** 8.166***
(0.263) (0.223) (0.206) (0.205) (0.209) (0.208)
N 1,380,869 1,366,540 1,354,047 1,353,927 1,354,657 1,354,657Nofcountries 73 73 73 73 73 73Significance:*p<0.1;**p<0.05;***P<0.01.Data:Harmonizedsurveydatafrom96singlecross-nationaldatasets.ListofdatasetsinAppendix2.V-Dem,1900-2015.Note:EntriesareregressioncoefficientsandtheirstandarderrorsofaHAPCmodel.Thedependentvariableissatisfactionwithdemocracywhere0=”notsatisfiedatall”and100=”completelysatisfied”.
Page 35
35
citizensandholdsimilardemocraticpoliticalvaluescomparedtothosethatgrewup
underdemocracy.Wetestthisbyincludingthelevelofelectoraldemocracywhena
respondentwas15yearsold.TheresultspresentedinTable2confirmthatthereis
strong significant effect of the regime socialization context. The difference in
democratic satisfaction between those that grew-up under a democracy (score=1)
versusanautocracy(score=0)isabout10.5pointshigher.Thispointsinthedirection
that the indoctrination hypothesis might be true, as the direction of the
authoritarian socialization is in theexpectednegativedirection. This effect is even
stronger thanpoliticalcorruption.Thedifference for thosegrowing-up in themost
corrupt systems (score=1) compared to those in non-corrupt systems are only 3
points.
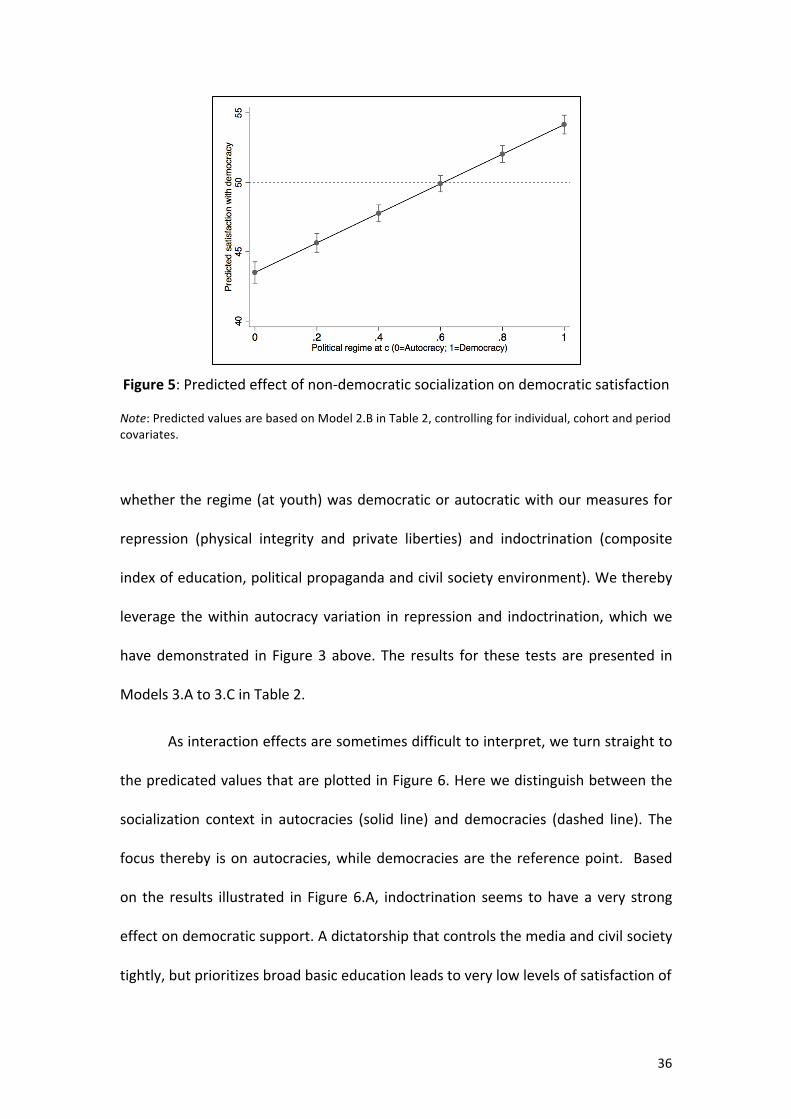
TheeffectofthepoliticalregimeisillustratedfurtherinFigure5,whichplots
the predicted satisfaction with democracy depending on the level of electoral
democracyduringone’sformativeyearsacrossallcountriesinoursample.Ifwetake
50astheneutralpoint,Figure5confirmsthatthosethatgrew-upinanautocracyto
evaluatetheperformanceof theirpoliticalsystemmuchmorenegativethanthose
thatgrew-upinademocracy.Interestingly,itappearsthatjustatthecut-offpointof
0.67 that Lindberg (2016) established as the “minimal democracy” point, we find
thatdemocraticsatisfactionpassestheneutral50.
Next we turn to the question what drives the socialization effect of the
political regime. Above we hypothesized that repression should have a positive
effect on democratic support (H1), while indoctrination should lead to long-term
negativedemocraticattitudes(H2).Wetestthesehypothesesbyinteracting
Page 36
36
Figure5:Predictedeffectofnon-democraticsocializationondemocraticsatisfaction
Note:PredictedvaluesarebasedonModel2.BinTable2,controllingforindividual,cohortandperiodcovariates.
whethertheregime(atyouth)wasdemocraticorautocraticwithourmeasuresfor
repression (physical integrity and private liberties) and indoctrination (composite
indexofeducation,politicalpropagandaandcivilsocietyenvironment).Wethereby
leverage thewithinautocracyvariation in repressionand indoctrination,whichwe
havedemonstrated in Figure3 above. The results for these tests arepresented in
Models3.Ato3.CinTable2.
Asinteractioneffectsaresometimesdifficulttointerpret,weturnstraightto
thepredicatedvaluesthatareplottedinFigure6.Herewedistinguishbetweenthe
socialization context in autocracies (solid line) and democracies (dashed line). The
focusthereby isonautocracies,whiledemocraciesarethereferencepoint. Based
on the results illustrated in Figure6.A, indoctrination seems tohavea very strong
effectondemocraticsupport.Adictatorshipthatcontrolsthemediaandcivilsociety
tightly,butprioritizesbroadbasiceducationleadstoverylowlevelsofsatisfactionof
Page 37
37
Figure6:Predictedinteractioneffectofregimetypeandregimecharacteristicsondemocraticsatisfaction
Note:PredictedvaluesarebasedonModel3.Ato3.CinTable2,controllingforindividual,cohortandperiodcovariates.
Page 38
38
democracyamongcitizensthatgrew-upundersuchademocracy.Thelistofregimes
that fallunder thiscategorycanbe found inAppendix6.However, ifanautocracy
would not use such tools of indoctrination, democratic support would be
considerablyhigheramongthosecohortsintheir laterlife.Thedifferencebetween
complete authoritarian indoctrination and low indoctrination capacity (freemedia
and civil society environment at low levels of broad education) is a staggering 17
points on democratic satisfaction. Given that autocracies very much rely on
indoctrination (seeFigure3.A), the results inFigure6.A suggests that thenegative
socialization effect of authoritarian regimes is driven by these indoctrination
measures.
We can compare this effect to the impact of repression on democratic
satisfaction,whichisillustratedinFigure6.Bforviolationsofpersonalintegrityrights
and6.Cforprivate liberties.Firstofall it isstrikingthattheeffect ismuchweaker,
which we see by the slopes of the repression effect among those that were
socialized in autocracies. The difference in democratic satisfaction is only 5 points
betweenthosethathadtoendureregimesthattargetthepersonalintegrity(score
0)comparedtothosethatlivedindictatorshipsthatdidnotuseanysuchviolence.
Themagnitudeof7points is similar forprivate liberties.This is incontradictionof
what we expected based on Hypothesis 2. It seems that repression under
autocraciesdoesnotleadtoafeelingofliberationoncetheregimeisabolishedand
consequently toanembracementofdemocracy. If thatwouldhavebeen true,we
should have found a negative interaction between the severity of repression and
socializationinadictatorship.
Page 39
39
Figure6revealsageneralexplanationwhyweseelowerlevelsofdemocratic
support among generations that experienced autocracies during their formative
years.Comparingtheeffectsofindoctrinationandrepressionbetweendemocracies
(dashedlines)andautocracies(solidlines),itisstrikingthattheeffectdirectionisthe
same. Growing-up in a hypothetical democracy that represses physical integrity
rights and private liberties, also leads this generation (compared to other
generationsinthesamecountry)tobemorecriticalwithdemocracytoday,evenif
we control for current levels of democracy and the economic and political
performanceofthecurrentsystem.
The reasonwhywe see very different levels of democratic satisfaction for
generations growing-up in these two different systems is that the context under
autocracies ischaracterizedbystrong indoctrination (seFigure3.A)andrepression
(seeFigures3.EandF),whiledemocraciesareguaranteeingamuchmorepluralistic
environment, physical integrity and private liberties. Given the predicted values
presentedinFigure6,itisnotsurprisingthatlevelsofdemocraticsatisfactiondiffer
verymuchbetweenthesetwocontrastingexperiences.
ConclusionandDiscussion
Autocracieshavetwoinstrumentsthattheyuseinordertocreateafollowingamong
theircitizens.Theycanrepresstheirpeopleandtheycantrytolegitimatetheirrule
by indoctrinatingthepeople.Theseinstrumentsstabilizetheirgriptopower.What
hasnotbeenstudiedyetinacomparativefashionisthattheseinstrumentsdonot
onlyworkoncetheautocracyisinpower,butthattheyhavealastinglegacy.
Page 40
40
Inourglobalanalysis,wedemonstratethatautocracies leavean imprinton
theircitizens.Evenwhentheautocracyalreadybrokedown,wecanseeitsinfluence
onthepeople’smindset.Peoplethatgrewupunderauthoritarianismremainmore
skepticalaboutdemocraticvalues.Beremindedthatthisholdstruewhenwecontrol
forageeffectsandthepoliticalcircumstances inwhichthesurveysareconducted.
That is to say thatwe can identify a cohort effect: Thepredicted satisfactionwith
democracyisanastonishingtenpointslowerforpeoplethathavebeensocializedin
anautocracycomparedtoademocracy.Inotherwords,whatyouexperienceduring
yourformativeyearsislikelytobeasteadycompanionthroughoutlife.
We found very strong empirical evidence that indoctrination matters. An
autocracythatspendsmuchtimeandefforttoindoctrinateitscitizensbycontrolling
the schools, themedia, and the civil organizationswill leave its citizenswith a 17
point lower predicted satisfactionwith democracy compared to an autocracy that
does not so. This has important implications for the academic research on the
politicalcultureofapost-authoritariancountry.Yet, ithassimilarrepercussionsfor
the praxis of political education. The experience that people make during their
formativeyearsneedstobeemphasizedmorethoroughly.Ouranalysisshowsthat
thelessonforpoliticaleducationcouldbethatitneedstocontextualizeexperiences
thatwemakeinearlyadulthood.
Surprisingly,wedidnotfindaliberationeffect.WeexpectedthatapersonA
thatexperiencedarepressiveregimewouldbeembracingdemocracymoreopenly.
S/he would long for a political regime that respects human rights. Instead, this
person A – when s/he has experienced a regime that violated personal integrity
Page 41
41
rightsandprivateliberties–remainsmoreskepticalwithdemocracy.S/hedoesnot
develop the same satisfaction with democracy compared to her/his hypothetical
alter ego that grew up under a non-repressive regime. Experiencing a political
regime thatoversteps red linesand intervenes inyourprivate life leavespersonA
more alienated with politics in general – even when the environments drastically
change. We speculate that s/he views politics as a nasty business irrespective of
democratic or autocratic signs. Person A remains therefore decoupled and
disappointedfrompoliticalprocesseswhens/hehasexperiencedrepressivepolitics.
This isthesecondimportant lessonthatbothacademiaandpraxisneedtokeepin
mind: Experience with repression, as well as with indoctrination, survives regime
change.
References
Adena, Maja, Ruben Enikoplov, Maria Ptrova, Veronica Santarosa, and Ekaterian
Zhuravskaya.2015.RadioandtheRiseoftheNazis inPrewarGermany.The
QuarterlyJournalofEconomics130(4):1885-1939.
Adler,N.,2012.Keeping faithwith theParty:Communistbelievers return from the
Gulag.IndianaUniversityPress.
Almond,Gabriel,andVerbaSindey.1963.TheCivicCulture:PoliticalAttitudesand
DemocracyinFiveNations.Princeton,NJ:PrincetonUniversityPress.
Alwin,D.F.andJ.A.Krosnick.1991.Aging,CohortsandtheStabilityofSociopolitical
Orientations over the Life Span.American Journal of Sociology97(1): 169–
195.
Barro,RobertandJong-WhaLee.2013."ANewDataSetofEducationalAttainment
intheWorld,1950-2010."JournalofDevelopmentEconomics104:184-198.
Page 42
42
Bartels,L.,andS.Jackman.2014.Agenerationalmodelofpoliticallearning.Electoral
Studies33,7–18.
Bernhard,M.,Karakoç.2007. Civil Societyand the LegaciesofDictatorship.World
Politics59,539-567.
Brandenberger,D.2014.Propagandastate incrisis:Soviet ideology, indoctrination,
andterrorunderStalin,1927-1941.YaleUniversityPress.
Canache, Damarys, Mondak Jeffery, and Mitchell Seligson. 2001. ‘‘Meaning and
Measurement in Cross-National Research on SatisfactionwithDemocracy.’’
PublicOpinionQuarterly65(4):506–28.
Cantoni,Davide, Chen, Yuyu, Yang,David Y., Yuchtman,NoamandY. Jane Zhang.
forthcoming."CurriculumandIdeology".JournalofPoliticalEconomy.
Clarke,HaroldD.,NitishDutt,andAllanKornberg.1993. ‘‘ThePoliticalEconomyof
Attitudes toward Polity and Society in Western European Democracies.’’
JournalofPolitics55(4):998–1021.
Clio-Infra.AccessedFebruary27,2017.http://www.clio-infra.eu/.
Coppedge, Michael, John Gerring, Staffan I. Lindberg, Svend-ErikSkaaning, Jan
Teorell, David Altman,Frida Andersson,Michael Bernhard, M. Steven Fish,
AdamGlynn, Allen Hicken, Carl Henrik Knutsen, Kelly McMann,Valeriya
Mechkova, Farhad Miri,Pamela Paxton, DanielPemstein,Rachel
Sigman,Jeffrey Staton,andBrigitte Zimmerman. 2016. “V-Dem Codebook
v6.”VarietiesofDemocracy(V-Dem)Project.
Davenport,Christian.2007.“StateRepressionandPoliticalOrder.”AnnualReviewof
PoliticalScience10:1–23.
DellaVigna,S.,Enikolopov,R.,Mironova,V.,Petrova,M.andZhuravskaya,E.,2014.
Cross-bordermediaandnationalism:EvidencefromSerbianradioinCroatia.
AmericanEconomicJournal:AppliedEconomics,6(3),pp.103-132.
Earl, Jennifer. 2011. “Political Repression: Iron Fists, Velvet Gloves, and Diffuse
Control.”AnnualReviewofSociology37:261–84.
Easton,D.1965.Asystemsanalysisofpoliticallife.NewYork,J.Wiley.
Page 43
43
Eibl-Eibesfeldt, I.andSalter,F.K.eds.,1998. Indoctrinability, ideology,andwarfare:
Evolutionaryperspectives.BerghahnBooks.
Escribà Folch, Abel. 2013. “Repression, Political Threats, and Survival under
Autocracy.”InternationalPoliticalScienceReview:forthcoming.
Foa , Roberto S. and YaschaMounk. 2016.TheDemocratic Disconnect. Journal of
Democracy.27(3):2-17.
Friedrich, Carl J., and Zbigniew Brzezinski. 1956. Totalitarian dictatorship and
autocracy.NewYork:Praeger.
Gandhi, Jennifer. 2008. Political Institutions under Dictatorships. Cambridge:
CambridgeUniversityPress.
Gapminder.AccessedFebruary24,2017.http://www.gapminder.org/data/
García-Ponce,O.,&Pasquale,B.(2015,September).HowPoliticalRepressionShapes
Attitudes Toward the StateEvidence from Zimbabwe. In The 2013
International Political Economy Seminar (IPES) at Claremont Graduate
University.
Geddes, Barbara, and John Zaller. 1989. “Sources of Popular Support for
AuthoritarianRegimes.”AmericanJournalofPoliticalScience33(2):319–47.
Geddes, Barbara. 1999. "What DoWe Know About Democratization After Twenty
Years."AnnualReviewofPoliticalScience,2:115–144.
Gerschewski, Johannes. 2013. “The Three Pillars of Stability: Legitimation,
Repression,andCo-optationinAutocraticRegimes.”Democratization20(1):
13–38.
Henderson,ConwayW.1991.“ConditionsAffectingtheUseofPoliticalRepression.”
JournalofConflictResolution35(1):120–42.
Hofferbert, Richard I. and Hans-Dieter Klingemann. 2001. Democracy and Its
DiscontentsinPost-WallGermany.InternationalPoliticalScienceReview.22(
4):363-378.
Page 44
44
Jennings,M.K. 1989. The Crystallization of Orientations. InContinuities in political
action,SamuelH.Barnes,JanW.vanDeth,andM.KentJennings,eds.,Berlin
andNewYork:deGruyter.
Kern,H. L., and J.Hainmueller. 2009. “Opium for theMasses:HowForeignMedia
CanStabilizeAuthoritarianRegimes.”PoliticalAnalysis17(4):377–99.
Kinnvall, C., & Jönsson, K. (2002).Globalization and Democratization in Asia: The
constructionofidentity.PsychologyPress.
Krosnick, Jon A and Alwin, Duane F. 1989. "Aging and susceptibility to attitude
change."Journalofpersonalityandsocialpsychology57(3):416-425.
Lindberg, Staffan I. 2016.“Ordinal Versions of V-Dem’s Indices: When Interval
Measures Are Not Useful for Classification, Description, and Sequencing
AnalysisPurposes,”Geopolitics,History,andInternationalRelations8(2):76–
111.
Linde, Jonas,and JoakimEkman.2003. ‘‘SatisfactionwithDemocracy:ANoteona
frequently used Indicator in Comparative Politics.’’ European Journal of
PoliticalResearch42(3):391–408.
Linz,JuanJ.1975.“TotalitarianandAuthoritarianRegimes.”InHandbookonPolitical
Science [ca]. III, eds. Fred I. Greenstein and Nelson W. Polsby. Reading:
AddisonWesley,175–411.
LottJr,J.R.,1990.Anexplanationforpublicprovisionofschooling:theimportanceof
indoctrination.TheJournalofLawandEconomics,33(1),pp.199-231.
Lott, Jr, J.R., 1999. Public schooling, indoctrination, and totalitarianism. Journal of
PoliticalEconomy,107(S6),pp.S127-S157.
Lühiste, Kadri. 2014. "Social protection and satisfaction with democracy: A multi-
levelanalysis."PoliticalStudies62(4):784-803.
Magaloni, Beatriz. 2006. Voting for Autocracy: Hegemonic Party Survival and its
DemiseinMexico.NewYork:CambridgeUniversityPress.
Page 45
45
Marquardt,Kyle L. andDanielPemstein.2017. IRTmodels forexpert-codedpanel
data. University of Gothenburg,Varieties of Democracy Institute: Working
PaperNo.41.
Mattes, Robert, David Denemark, and Richard G. Niemi. 2016. “Growing Up
Democratic?” InGrowing Up Democratic: Does itMake a Difference?, eds.
DavidDenemark, RobertMattes andRichardG.Niemi. Boulder, Co.: Lynne
Rienner,1–22.
Mitchell, Neil J., and James M. McCormick. 1988. “Economc and Political
ExplanationsofHumanRightsViolations.”WorldPolitics40(4):476–98.
Møller, Jørgen,andSvend-ErikSkaaning.2013. “Autocracies,democracies, and the
violationofcivilliberties.”Democratization20(1):82–106.
Moore,Barrington.1966.SocialOriginsofDictatorshipsandDemocracy.: Lordand
PeasantintheMakingoftheModernWorld.Boston:Beacon.
Neundorf,A.2010.Democracyintransition:Amicroperspectiveonsystemchange
inpost-Sovietsocieties.JournalofPolitics,72(4):1096-1108.
Norris, Pippa. 1999. Critical Citizens: Global Support for Democratic Government.
Oxford:OxfordUniversityPress.
Pepinsky, Thomas. 2014. “The Institutional Turn inComparativeAuthoritarianism.”
BritishJournalofPoliticalScience44(03):631–53.
Poe,StevenC.,andC.N.Tate.1994.“RepressionofHumanRights to thePersonal
Integrityinthe1980s:AGlobalAnalsis.”AmericanPoliticalScienceReview88
(4):853–72.
Pop-Eleches,Grigore, and JoshuaTucker.2011. “Communist Legacies, andPolitical
Values and Behavior: A Theoretical Framework with an Application to
PoliticalPartyTrust.”ComparativePolitics43(4):379–408.
Przeworski,Adam.1991.DemocracyandtheMarket:PoliticalandEconomicReforms
inEasternEuropeandLatinAmerica.NewYork:CambridgeUniversityPress.
Page 46
46
Rose, Richard, William Mishler, and Christian Haerpfer. 1998. Democracy and its
Alternatives:UnderstandingPost-CommunistSocieties.Baltimore,MD:Johns
HopkinsUniversityPress.
Schedler, Andreas. 2013. The Politics of Uncertainty: Sustaining and Subverting
ElectoralAuthoritarianism.Oxford:OxfordUniversityPress.
Sears,D.O.andN.A.Valentino.1997.PoliticsMatters:PoliticalEventsasCatalystsfor
PreadultSocialization.AmericanPoliticalScienceReview91(1):45–65.
Sears, D.O. and C.L. Funk. 1999. Evidence of the Long-TermPersistence of Adults’
PoliticalPredispositions.JournalofPolitics61(1):1-28.
Shue,Vivienne.2002. ‘Global Imaginings, theState’sQuest forHegemony,andthe
Pursuit of Phantom Freedom in China: From Heshang to Falun Gong’, in
Catarina Kinnvall and Kristina Jonsson, eds,. Globalization and
DemocratizationinAsia:TheConstruction
Smith, Benjamin. 2005. “Life of the Party.: The Origins of Regime Breakdown and
PersistenceunderSingle-PartyRule.”WorldPolitics57(3):421–51.
Svolik,MilanW.2012.ThePoliticsofAuthoritarianRule.NewYork,NY:Cambridge
UniversityPress.
Teorell, Jan, Michael Coppedge, Sven-Erik Skaaning,Staffan I. Lindberg. 2016.
Measuring Electoral Democracy with V-Dem Data:Introducing a New
Polyarchy Index.UniversityofGothenburg,VarietiesofDemocracy Institute:
WorkingPaperNo.
Vanhanen,Tatu.2003.DemocratizationandPowerResources1850-2000[computer
file].FSD1216,version1.0(2003-03-10).Tampere:FinishSocialScienceData
Archive
(http://www.fsd.uta.fi/en/data/catalogue/FSD1216/meF1216e.html).
Wantchekon, L., & Yehoue, E. (2002). Crime in New Democracies. Unpublished
manuscript.
Page 47
47
Wagner,Alexander F., Friedrich Schneider, andMartinHalla. 2009. "Thequalityof
institutions and satisfaction with democracy in Western Europe—A panel
analysis".EuropeanJournalofPoliticalEconomy25(1):30-41.
Wang, Z. (2005). Before the emergenceof critical citizens: Economic development
andpoliticaltrustinChina.InternationalReviewofSociology,15(1),155-171.
World Bank. 2013.World Development Indicators 2013. Washington, DC: World
Bank.
Yang,Y.&K.C.Land.2006.AMixedModelsApproachtoAge-Period-CohortAnalysis
ofRepeatedCross-SectionSurveys:TrendsinVerbalTestScores.Sociological
Methodology36:75–97.
YonhapNews.2015.ParkChung-heethebestleadersince1945:poll.
Page 48
48
Appendix
Appendix1:Geographiccoverage
The inclusion into thestudywas restrictedas follows:Thereareat least threedatapointspercountrythatcoveratleast10yearsoftime.ThelistednumberofobservationsinTableA1 below lists the number of observations, which corresponds to the number of surveyrespondents thatgaveavalidresponsetothequestionshowmuchtheyaresatisfiedwiththewaydemocracyworksintheircountriestoday.
TableA1:Listofcountriesandnumberofobservations
Country N Country N Country NAlbania 4,662 Ghana 6,325 Norway 28,036Argentina 23,802 Greece 51,570 Panama 20,338Australia 7,932 Guatemala 18,688 Paraguay 21,507Austria 17,506 Honduras 16,670 Peru 24,665Belgium 63,744 Hungary 14,224 Poland 22,244Bolivia 26,611 Iceland 8,421 Portugal 50,372Botswana 5,466 Indonesia 3,822 Romania 8,493Brazil 31,758 Ireland 60,889 Russia 3,904Bulgaria 12,292 Israel 11,024 Slovakia 12,139Canada 15,196 Italy 53,419 Slovenia 15,995Chile 23,610 Japan 9,137 SouthAfrica 10,757Colombia 14,520 Kenya 5,142 Spain 49,368CostaRica 23,616 SouthKorea 5,593 Sweden 25,898Croatia 5,337 Lesotho 4,151 Switzerland 23,974CzechRep. 19,314 Latvia 5,992 Thailand 1,197Denmark 60,519 Lithuania 9,683 Turkey 8,207DominicanRep. 19,395 Malawi 4,207 Ukraine 11,697Ecuador 29,135 Mali 2,341 Macedonia 1,467ElSalvador 23,797 Mexico 38,392 GreatBritain 76,203Estonia 14,774 Moldova 1,890 UnitedStates 8,113Finland 25,999 Namibia 5,657 Uruguay 26,924France 61,821 Netherlands 66,159 Venezuela 14,164Georgia 1,348 NewZealand 7,589 Serbia 3,963Germany 87,213 Nicaragua 18,907 Zambia 5,343 Nigeria 4,568 Total 1,528,795
Page 49
49
Appendix2:Listofindividual-leveldatasets
• WorldValueSurvey(WVS),1981-2014o 6waves(1981-84;1990-94;1995-98;1999-2004;2005-09;2010-14)
• Latinobarometer(LB),1995-2015o 17 waves (1995; 1996; 1997; 1998; 2000; 2001; 2002; 2003; 2004; 2005;
2006;2007;2008;2009;2010;2011;2013;2015)• AsianBarometer(ANB),2001-2014
o 4waves(2001-03;2005-08;2010-12;2014)• Afrobarometer(AFB),1999-2015
o 6waves(1999-2001;2004;2005;2008;2015)• AmericasBarometer(AB),2004-2014
o 8waves(2004;2006;2007;2008;2009;2010;2012;2014)• EuropeanValuesStudy(EVS),1981-2010
o 4waves(1981-84;1990-93;1999-2001;2008-10)• EuropeanSocialSurvey(ESS),2002-2014
o 7waves(2002;2004;2006;2008;2010;2012;2014)• Eurobarometer-MannheimTrendfile(EB),1970-2002
o 32waves(1970-2002,excluding1972)• Central&EasternEuropeanBarometer(CEEB),1990-97
o 8waves(1990;1991;1992;1993;1994;1995;1996;1997)• ComparativeStudyofElectoralSystems(CSES),1996-2015
o 4waves(1996-2001;2001-06;2006-11;2011-15)
Page 50
50
AppendixA3:CodingofdependentvariablesA3:SatisfactionwithDemocracyThevariablewasrecodedto0“notatallsatisfied/nondemocratic”to100“verysatisfied”withthewaydemocracyworks.Dataset #Cat Questionwording
Latino-barometer 4-R
Ingeneral,wouldyousayyouareverysatisfied,1verysatisfied,2quitesatisfied,3notverysatisfied,or4notatallsatisfiedwiththeworkingofthedemocracyin[country]?-4notasked,-2noanswer,-1don'tknow
WVS 4-ROnthewholeareyouverysatisfied(1),rathersatisfied(2),notverysatisfied(3),ornotatallsatisfied(4)withthewaydemocracyisdevelopinginourcountry?
AmericasBarometer 4-R
Ingeneral,wouldyousaythatyouareverysatisfied(1),satisfied(2),dissatisfied(3),orverydissatisfied(4)withthewaydemocracyworksin(country)?
AsianBarometer 4-R
Onthewhole,howsatisfiedordissatisfiedareyouwiththewaydemocracyworksinourcountry.Areyou1verysatisfied;2fairlysatisfied;3notverysatisfied;4notatallsatisfied
Afro-barometer
5
Overall,howsatisfiedareyouwiththewaydemocracyworksin[country]?0thiscountryisnotademocracy;1verydissatisfied;2somewhatdissatisfied;3neutral;4somewhatsatisfied;5verysatisfied;9don'tknow
4
Wave2&3:Overall,howsatisfiedareyouwiththewaydemocracyworksin[countryname]?Areyou:0[country]isnotademocracy;1notatallsatisfied;2notverysatisfied;3fairlysatisfied;4verysatisfied.
EVS 4-R
Onethewholeareyouverysatisfied,rathersatisfied,notverysatisfied,ornotatallsatisfiedwiththewaydemocracyisdevelopinginourcountry?1verysatisfied;2rathersatisfied;3notverysatisfied;4notatallsatisfied
ESS 11 Andonthewhole,howsatisfiedareyouwiththewaydemocracyworksin[country]?0Extremelydissatisfied-10extremelysatisfied
Euro-barometer 4-R
Onthewhole,areyouverysatisfied,fairlysatisfied,notverysatisfiedornotatallsatisfiedwiththewaydemocracyworksin(country)?Wouldyousayyouare…?1verysatisfied;2fairlysatisfied;3notverysatisfied;4notatallsatisfied
CSES 4-R
Onthewhole,areyouverysatisfied,fairlysatisfied,notverysatisfied,ornotatallsatisfiedwiththewaydemocracyworksin[country]?1verysatisfied;2fairlysatisfied;3notverysatisfied;4notatallsatisfied
CEEB 4-R
Onthewhole,areyousatisfied,fairlysatisfied,notverysatisfiedornotsatisfiedatallwiththewaydemocracyisdevelopingin(ourcountry)?1verysatisfied;2fairlysatisfied;3notverysatisfied;4notsatisfiedatall1997-splitballotbetweendemocracyisdevelopinganddemocracyisworking.
Page 51
51
Notes:Variablesthatarereversedintheirorderhavean-Rbehindthenumberofcategories.CEEB:In1997,theCEEBusedasplitsampletochangethequestionwordingslightly.Onequestionaskedaboutthesatisfactionwiththedevelopment(V18)andonewiththeworkings(V19)ofdemocracy.Themeanvalueforthelatterissignificantlylowerwith2.23(peoplearemoresatisfiedwithworkings)thanforthedevelopmentofdemocracywithmeanof2.75(lesssatisfied).Afrobarometer:Thereis1.7%ofrespondentsthatsaidthattheircountryisnodemocratic.22%ofthosearefromZimbabwe.Thoserespondingthatcountryisnotdemocraticweresetto“verydissatisfied”.
Page 52
52
Appendix4:HarmonizingeducationlevelsAssumption:Kidsstartschoolwith6
• Primary:6yearsold+8ofschool=14yearsold• Secondary:6yearsold+14yearsofschool(max)=20yearsold• Post-Secondary:Secondary:6yearsold+15yearsofschool(min)=21+yearsold
Eurobarometer
• Var=Whatagedidcompleteyoureducation[1-22+]• Recoding
o Primary=upto14o Secondary=14/20o Tertiary=21+
• NocategoricalquestionaskedWVS
• Var=Whatagedidcompleteyoureducation[1-99]• Recoding
o Primary=1-12o Secondary=13/20o Tertiary=21+
• This is used to replace10,482missing on categorical variable. Hardly anymissingleft.
EVS
• Var=Whatagedidcompleteyoureducation[1-99]• Recoding
◦ Primary=1-12◦ Secondary=13/20◦ Tertiary=21+
• This is used to replace10,482missing on categorical variable. Hardly anymissingleft.
ESS
• Var=YearsofFull-Timeeducation[0-56]• Recoding
◦ Primary=0-8◦ Secondary=9/14.5◦ Tertiary=15+
• This is used to replace 73,184missing on categorical variable. Hardly anymissingleft.
Page 53
53
A5:MacrovariablesA5.1.Hardrepression-Physicalintegrity
• Tortureisconceptualizedasthepurposefulinflictionofextremephysicalormentalpain,withtheaimtoextractinformationorintimidatevictims,whoareinastateofincarceration.
• Political killings are killings by state agents without due process of law with thepurposeofeliminatingpoliticalopponentsandasaresultofdeliberateuseofforce.
• This physical integrity index is formed by point estimates from a Bayesian factoranalysismodelincludingthetwoindicatorsfortortureandpoliticalkillings.Itrangesbetween0and1sothatlowervaluesindicatelessrespectforfreedomfromtortureandpoliticalkillings(morerepression)andhighervaluesrepresentmorerespectfortheserights(lessrepression).
A5.2.Softrepression-Privateliberties
• Theprivate liberties index is formedfrompointsestimatesdrawnfromaBayesianfactor analysis model including sub-indicators for property rights for men andwomen, forced labor for men and women, freedom of religion, religiousorganization repression, freedom of foreignmovement, and freedom of domesticmovementformenandwomen.
A5.3.PoliticalPropagandaIndex
• Governmentcensorshipeffortisanordinalmeasurethatcapturesindirectformsofcensorship such as political motivated awarding of broadcast frequencies,withdrawal of financial support, influence over printing facilities and distributionnetworks, selected distribution of advertising, onerous registration requirements,prohibitivetariffs,andbribery.
• Criticalprint/broadcastmediacaptureshowmanyofthemajorprintandbroadcastoutletsroutinelycriticizethegovernment.
• Perspectives of the print/broadcast media captures whether major print andbroadcastmediarepresentawiderangeofpoliticalperspectives.
• Harassment of journalists variable captures whether individual journalists areharassed (threatened with libel, arrested, imprisoned, beaten or killed) bygovernmentalornon-governmentalactorswhileengagedinjournalism.
• Media self-censorship variable capture whether journalists self-censor whenreportingonissuesthatareconsideredpoliticalsensitivebythegovernment.
• Accesstocriticalmediameasuresthe%ofthepopulationthathasaccesstomediathatsometimescriticizesthegovernment.
• Mediabias captureswhether there ismediabias againstopposition candidatesororganizations.
• Corruption of media measures the extent to which journalists, publishers and/or
Page 54
54
broadcastersacceptpaymentsinexchangeofalteringtheirnewscoverage.
A5.4.CSOenvironmentIndex
• CSOentryandexit:Towhatextentdoesthegovernmentachievecontroloverentryandexitbycivilsocietyorganizations(CSOs)intopubliclife?Rangingfrom
o 0: Monopolistic control. The government exercises an explicit monopolyoverCSOs.Theonlyorganizationsallowedtoengageinpoliticalactivitysuchas endorsing parties or politicians, sponsoring public issues forums,organizing rallies or demonstrations, engaging in strikes, or publiclycommenting on public officials and policies are government-sponsoredorganizations. The government actively represses those who attempt todefyitsmonopolyonpoliticalactivity.
o 4: Unconstrained. Whether or not the government licenses CSOs, thegovernmentdoesnotimpedetheirformationandoperationunlesstheyareengagedinactivitiestoviolentlyoverthrowthegovernment.
• CSO structure: Civil societies inevitably involve a mix of larger and smallerorganizations.Pleasecharacterize therelative influenceof largemassconstituencycivil societyorganizations (CSOs)versussmaller,more local,ornarrowlyconstruedCSOs.
o Largeencompassingorganizationsdominate.ThegovernmentandCSOsarelinked formally throughacorporatist systemof interest intermediation;or,due tohistorical circumstances,particular largeCSOsarehighly influential.The voice of such organizations is recognized by the government and isaccordedspecialweightbypolicymakers.
• CSOparticipatory environment:Which of these best describes the involvement ofpeopleincivilsocietyorganizations(CSOs)?Rangingfrom:
o 0:Most associations are state-sponsored, and although a large number ofpeoplemaybeactiveinthem,theirparticipationisnotpurelyvoluntary.
o 3:TherearemanydiverseCSOsanditisconsiderednormalforpeopletobeatleastoccasionallyactiveinatleastoneofthem.
A5.4:Modernizationindex
Weestimatedthemodernizationindexusingprinciplecomponentfactoranalysisusingeightitemsthattapatthemodernization levelofacountry.Someofthevariableshavemissingvalues.Wehencere-ranthefactoranalysisnumeroustimestocombinetheeightvariablesindifferentways,droppingvariables,tomaximizethenumberofcountry-yearobservations.A minimum of two items was required. The final score was calculated as averagestandardizedfactorscorefromthedifferentiterationsofthefactoranalyses.Theitemsusedareasfollows:
• Literatepopulation(%)basedonVanhanen(2003)• UrbanizationbasedonV-DemcodebookandClioInfra(clio-infra.eu)• Infantmortalityrate:measuredasthenumberofdeathspriortoage1per1000live
birthsinayear.Thebasevariableisdrawnfrom(a)Gapminder,withadditionaldataimputedfrom(b)Clio-Infra.Interpolationsandimputationsemploylinearmodels.
• Lifeexpectancyreferstoexpected longevityatbirthbasedoncurrentage-specificmortalityrates.Thebasevariableisdrawnfrom(a)Gapminder,withadditionaldata
Page 55
55
drawn from (b) Clio-Infra. Missing data within a time-series is interpolated andimputedusinglinearmodels,asfollows.
• Non-agricultural population %: What percentage of the population work in non-agriculturaloccupations?
• Primary/secondary/tertiary school enrollment: What percentage of the primaryschool-aged population is enrolled in primary school? Clarification: The basevariablesareUNESCO’sadjustednetprimaryenrollmentrate(availableintheWorldBank Education Statistics Database) and Barro and Lee’s (2015) long-run data onprimaryenrollment (available in5-year intervals). These twovariables correlate at.94.Thiscompiledtimeseriesisinterpolatedincreasingthenumberofobservationsfrom 5,181 to 11,927. Missing data for the base variable is then imputed fromUNESCO’stotalprimaryenrollmentpercentage,which includesthoseenrolledwhoare not of primary-school age. The linear imputation increases the number ofobservationsfrom11,927to12,840.
TableA5:Correlationbetweenmeasuresofmodernization
Literacy Urban. Inf.Mort. Lifeexp. Non-
agri. Prim. Seco. Terti.
Literacy 1 Urbanization 0.66 1 Infantmortality -0.69 -0.62 1 Lifeexpectancy 0.74 0.68 -0.89 1 Non-agriculturalpop. 0.79 0.84 -0.68 0.73 1 Primaryschoolenroll. 0.81 0.56 -0.64 0.74 0.65 1 Secondaryenrollment 0.56 0.60 -0.75 0.78 0.67 0.56 1Tertiaryenrollment 0.47 0.60 -0.61 0.65 0.60 0.42 0.82 1
Table A5 reports the correlation matrix of the eight items used to estimate themodernizationindex.Asisclear,theseitemsareverymuchtappingatthesameunderlyingconstruct.
A5.5.Politicalcorruptionindex
• Executivecorruptionindex–itcaptureshowroutinelymembersoftheexecutive,ortheir agents, grant favors in exchange for bribes, kickback, or other materialincentives,andhowoftentheysteal,embezzleormisappropriatestateresourcesforpersonalorfamilyuse.
• Legislativecorruption–itisanordinalmeasurethatcaptureshowcommonitisthatmembersofthelegislatureabusetheirpositiontoobtainfinancialgains(e.g.bribes,facilitating government contracts for the legislator’s connections, doing favors forcompanies in exchange of employment after leaving the legislature, and stealingmoneyfromthestateorcampaigndonations).
• Public sector corruption index – it captures the extent to which public sectoremployeesfavorsinexchangeforbribes,kickback,orothermaterialincentives,andhow often they steal, embezzle ormisappropriate state resources for personal orfamilyuse.
Page 56
56
• Judicialcorruption–it’sanordinal indicatorthatcaptureshowoftenindividualsorbusinessesmakeundocumentedextrapaymentsorpaybribestodelay,speeduporobtainafavorablejudicialdecision.
Appendix6:CountrieswithStrongIndoctrinationCapacityandRegimeType
We classify countrieshaving a strong indoctrination capacity if theyhave a scoreofmorethanonestandarddeviationbelowthemeanforautocracies.Onthescalefrom0to1,thisisascoreofbelow0.2.TableA.6liststhecountriesandthenumberofyearswhenacountrieswasclassifiedashavingastrongindoctrinationcapacity.Wefurtherdividethecountriesbyregimetype,focusingonwhethertheautocracywasasinglepartyregimeornotusingtheGeddes(1991)classification.AstheTableshows,indoctrinationcapacitycross-cutsthroughregime type, even so as expected single party regimes are more likely to have strongindoctrination capacity. 75.6% of all country-years of strong indoctrination happened insingle-partyregimes.TableA.6.Listofcountriesandnumberofyearswithstrongindoctrinationcapacity
(1945-2015)
Country Singleparty Total
No Yes years Albania 0 45 45 Algeria 0 26 26 Argentina 3 0 3 Bulgaria 0 44 44 Burundi 4 0 4 Belarus 13 0 13 CentralAfricanRepub 17 0 17 Chad 12 15 27 Chile 4 0 4 China 0 29 29 Taiwan 0 31 31 Cuba 1 51 52 DominicanRep. 15 0 15 Eritrea 0 9 9 EastGermany 0 40 40 Greece 8 0 8 Guinea 0 17 17 Hungary 0 39 39 Iraq 11 0 11 NorthKorea 0 62 62 SouthKorea 14 0 14 Note:Countriesinitalicarenotincludedintheanalysis,asthereisnoornotsufficientindividual-leveldata.
Country Singlepartyregime Total
No Yes years Laos 0 35 35 Libya 42 0 42 Malawi 29 0 29 Mongolia 0 44 44 Mozambique 0 10 10 Poland 0 41 41 Portugal 4 0 4 Romania 0 42 42 Russia 0 44 44 SaudiArabia 8 0 8 Spain 30 0 30 Syria 0 41 41 Tajikistan 4 0 4 Togo 27 0 27 Tunisia 0 18 18 Turkey 3 0 3 Turkmenistan 0 19 19 Tanzania 0 18 18 Uruguay 4 0 4 Uzbekistan 0 19 19 Serbia 0 44 44 Total 253 783 1,036