35
Joseph Von Nessen, Ph.D. Research Economist September 8, 2020 [email protected] The Lifeblood of State Commerce The Economic Impact of S.C. Logistics on South Carolina
Joseph Von Nessen, Ph.D.Research EconomistSeptember 8, 2020
The Lifeblood of State CommerceThe Economic Impact of S.C. Logistics on South Carolina

-50.0%-45.0%-40.0%-35.0%-30.0%-25.0%-20.0%-15.0%-10.0%
-5.0%0.0%5.0%
South C
arolin
a
Min
ing & Lo
gging
Constructio
n
Manufa
cturin
gTTU
Info
.Svs.
Financial S
vs.
PBS
Educ.&Health
Svs.
Leis.
&Hosp.
Other S
vs.Gov't
-5.1% -6.7%-0.6% -2.6% -4.1% -2.9% -1.3%
-2.4% -4.6%
-19.6%
2.5%
-3.6%
April July
S.C. Employment Growth by IndustryListed Growth Rates: July 2020 vs. July 2019
Source: U.S. Bureau of Labor Statistics

S.C. Employment Growth Trends
-14.0%-12.0%-10.0%
-8.0%-6.0%-4.0%-2.0%0.0%2.0%4.0%6.0%8.0%
Jan.'18 Jul.'18 Jan.'19 Jul.'19 Jan.'20 Jul.'20
South Carolina Trans. & Warehousing
Source: U.S. Bureau of Labor Statistics
+2.4%
-5.1%

South Carolina Employment Changes
Time Period Job Losses/Gains
March 2020 to April 2020 -275,900
April 2020 to July 2020 +149,700
--------------------------------------------------------
Pct. of Jobs Recovered +54.3% for S.C. (vs. +44.6% for U.S.)
Source: U.S. Bureau of Labor Statistics
2020 Job recovery in S.C. is outpacing the
U.S.
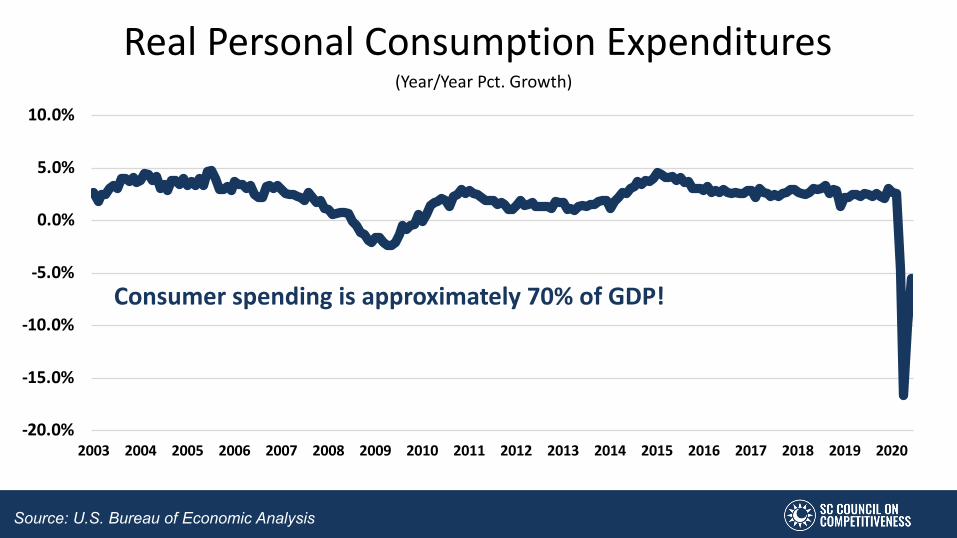
(Year/Year Pct. Growth)
Real Personal Consumption Expenditures
-20.0%
-15.0%
-10.0%
-5.0%
0.0%
5.0%
10.0%
2003 2004 2005 2006 2007 2008 2009 2010 2011 2012 2013 2014 2015 2016 2017 2018 2019 2020
Consumer spending is approximately 70% of GDP!
Source: U.S. Bureau of Economic Analysis

Goals
(1) Document the current economic impact of SC Logistics on the Palmetto State
(2) Examine the evolution of SC Logistics over time given ongoing changes in market dynamics

Defining Logistics…
The processes associated with the flow of goods and services from a point of origin to the point of consumption
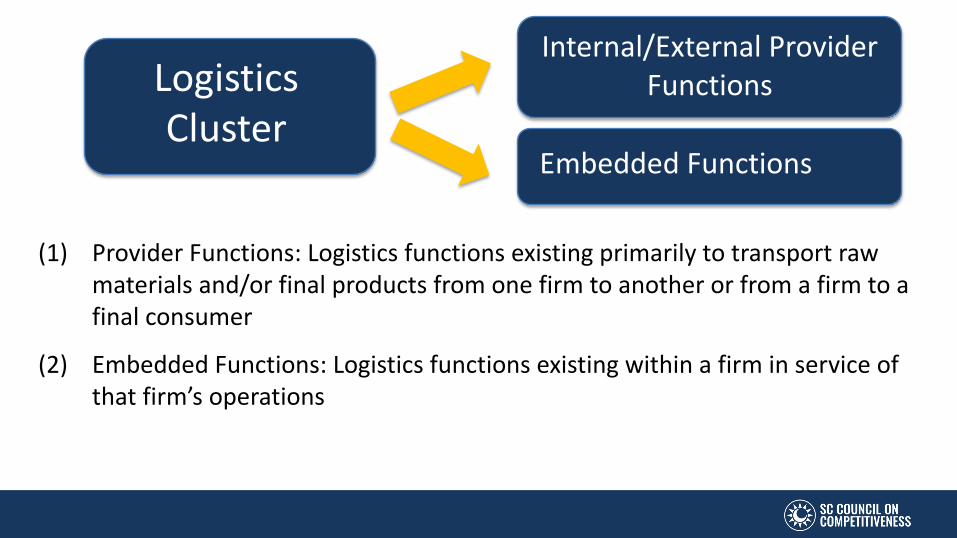
Internal/External Provider Functions
(1) Provider Functions: Logistics functions existing primarily to transport raw materials and/or final products from one firm to another or from a firm to a final consumer
(2) Embedded Functions: Logistics functions existing within a firm in service of that firm’s operations
LogisticsCluster
Embedded Functions

• Logistics defined as a set of related occupations, not as a set of related industries
• Master occupation listing obtained from U.S. Bureau of Labor Statistics Occupation/Industry Matrix
• Master list customized for South Carolina through data cleansing efforts
• Provider functions span 20 occupations; embedded functions span 2 occupations
S.C. Logistics – Size and Scope

Embedded Functions Int./Ext. Provider Functions
Occupation Description Total Employment Occupation Description Total Employment
Logisticians 2,910 Laborers and Freight, Stock, and Material Movers 64,150
Transportation, Storage, and Distribution Mngrs. 1,250 Heavy and Tractor-Trailer Truck Drivers 29,350
N/A N/A Light Truck Drivers 12,430
N/A N/A Industrial Truck and Tractor Operators 10,030
N/A N/A Packers and Packagers 8,420
Total Direct Employment in S.C. Logistics: 139,650Percentage of Embedded Function Occupations: 3.0%
Source: U.S. Bureau of Labor Statistics, Occupational Industry Matrix

Additional Occupations within S.C. Logistics
Source: U.S. Bureau of Labor Statistics, Occupational Industry Matrix
Int./Ext. Provider Functions
Occupation Description Total Employment
First-line Supervisors of Transportation and Material Moving Workers 6,860
Couriers and Messengers 1,690
Cargo and Freight Agents 1,660
Air Traffic Controllers 190
Airfield Operations Specialists 190
Sailors and Marine Oilers 180
Motor Vehicle Operators 130
Transportation Workers 130
Railroad Brake, Signal, and Switch Operators 80

0
20,000
40,000
60,000
80,000
100,000
120,000
140,000
Breaking Down Components of S.C. Logistics
Internal Providers Total Employment: 87,807
External ProvidersTotal Employment: 47,683
EmbeddedTotal Employment: 4,160
Source: U.S. Bureau of Labor Statistics, Occupational Industry Matrix

Employment Growth Over Time
Category 2017 2020 Ann. Growth Rate
Embedded 4,007 4,160 +1.2%
Internal Provider 74,044 87,807 +5.8%
External Provider 35,814 47,683 +10.0%
Totals 113,865 139,650 +7.0%
Source: U.S. Bureau of Labor Statistics, Occupational Industry Matrix
A majority of logistics-related growth in South Carolina is due to the higher overall demand for transportation-based services.

The Economic Impact of the Logistics Cluster on South Carolina

South Carolina Economic ImpactTotal Employment: 139,650
Total Compensation: $6.8 billion
Total Economic Impact: $37.2 billion
Source: U.S. Bureau of Labor Statistics; S.C. Council on Competitiveness

0
20,000
40,000
60,000
80,000
100,000
120,000
140,000
113,865139,650
2017 2020
A Growing Impact: Employment
Source: U.S. Bureau of Labor Statistics; S.C. Council on Competitiveness
+7.0%annual growth

$4.00
$4.50
$5.00
$5.50
$6.00
$6.50
$7.00
$5.38
$6.76
2017 2020
A Growing Impact: Total Compensation
Source: U.S. Bureau of Labor Statistics; S.C. Council on Competitiveness
+4.4%annual growth
In B
illio
ns

$25.00
$27.00
$29.00
$31.00
$33.00
$35.00
$37.00
$39.00
$32.99
$37.17
2017 2020
A Growing Impact: Total Economic Output
Source: U.S. Bureau of Labor Statistics; S.C. Council on Competitiveness
+4.0%annual growth
In B
illio
ns

U.S. Average Hourly Earnings
Source: U.S. Bureau of Labor Statistics
0.0%
0.5%
1.0%
1.5%
2.0%
2.5%
3.0%
3.5%
4.0%
Jan.'10 Jan.'11 Jan.'12 Jan.'13 Jan.'14 Jan.'15 Jan.'16 Jan.'17 Jan.'18 Jan.'19

U.S. Personal Consumption Expenditures
Source: U.S. Bureau of Economic Analysis
1.1%
1.3%
1.5%
1.7%
1.9%
2.1%
Jan.'13 Jan.'14 Jan.'15 Jan.'16 Jan.'17 Jan.'18 Jan.'19 Jan.'20

Average Annual Wage Comparisons
Source: U.S. Bureau of Labor Statistics; S.C. Council on Competitiveness
$0 $10,000 $20,000 $30,000 $40,000 $50,000 $60,000 $70,000 $80,000
All Jobs in S.C.
All Jobs Supported by S.C. Logistics
Direct Jobs within S.C. Logistics (Provider)
Direct Jobs within S.C. Logistics (Embedded)
$45,189
$48,412
$47,547
$76,592

Evolution of SC Logistics
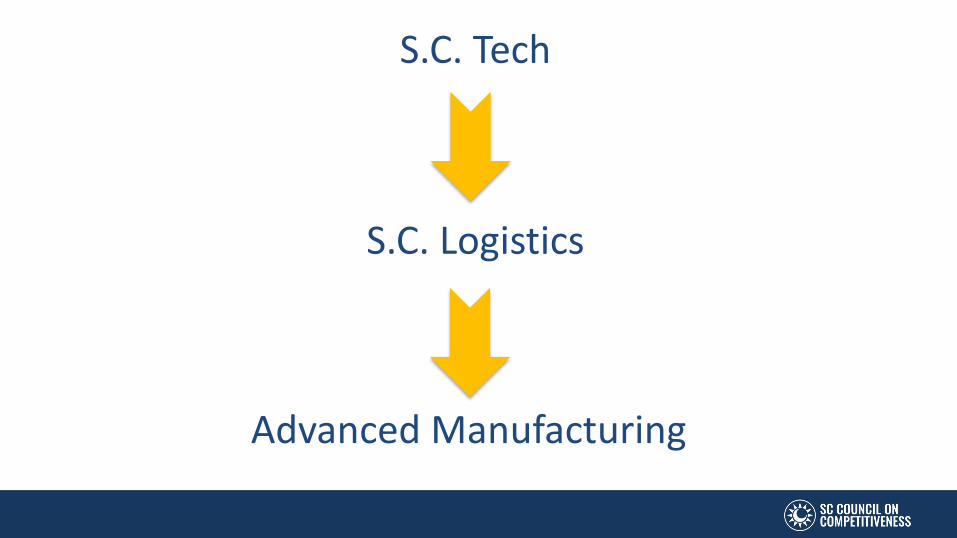
S.C. Tech
S.C. Logistics
Advanced Manufacturing

0.0%1.0%2.0%3.0%4.0%5.0%6.0%
2010 2020
1.7%
5.1%Increased Reliance on SC Tech
à The percentage of total expenditures made with SC Tech by the SC Logistics cluster has tripled over the past decade!
Source: S.C. Council on Competitiveness

Percentage of Business Purchases (inputs) from External Provider Firms
6.6% 3.1%Avg. S.C. BusinessAvg. Business within Advanced
Manufacturing
Source: S.C. Council on Competitiveness

Trends Among S.C. External Provider Firms

Logistics Emp. Growth S.C. Emp. Growth
2005-2007 +2.0% +2.0%2010-2015 +0.7% +2.5%2016-2019 +4.0% +2.2%
Logistics Employment Growth has Gained Momentum in Recent Years
Source: U.S. Bureau of Labor Statistics, QCEW

-12.0%-10.0%
-8.0%-6.0%-4.0%-2.0%0.0%2.0%4.0%6.0%8.0%
2006 2007 2008 2009 2010 2011 2012 2013 2014 2015 2016 2017 2018 2019
South Carolina Southeast
S.C. - 2010-2019: +17.5%Southeast - 2010-2019: +18.0%
Logistics Employment Growth(Graphed: 2-Year Rolling Average)
Source: U.S. Bureau of Labor Statistics, QCEW
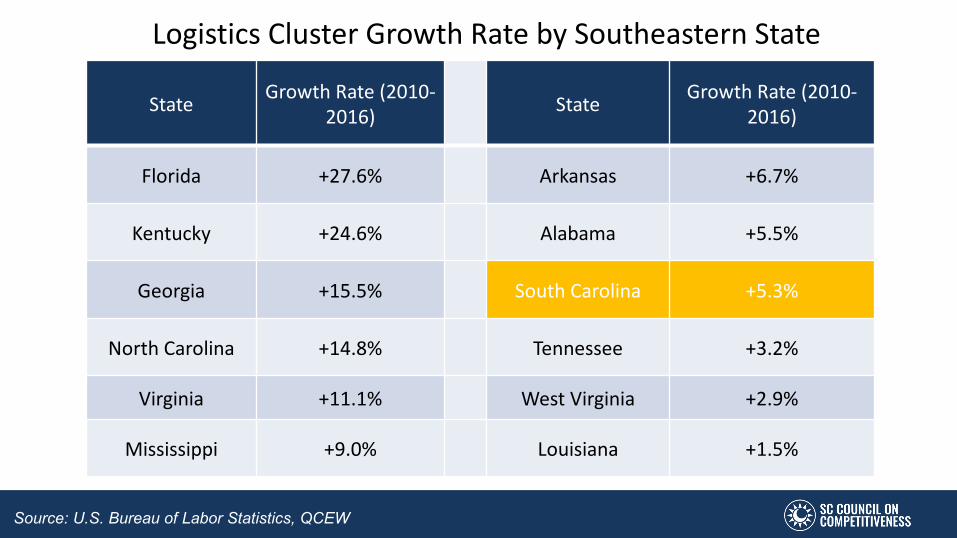
Logistics Cluster Growth Rate by Southeastern State
StateGrowth Rate (2010-
2016)State
Growth Rate (2010-2016)
Florida +27.6% Arkansas +6.7%
Kentucky +24.6% Alabama +5.5%
Georgia +15.5% South Carolina +5.3%
North Carolina +14.8% Tennessee +3.2%
Virginia +11.1% West Virginia +2.9%
Mississippi +9.0% Louisiana +1.5%
Source: U.S. Bureau of Labor Statistics, QCEW
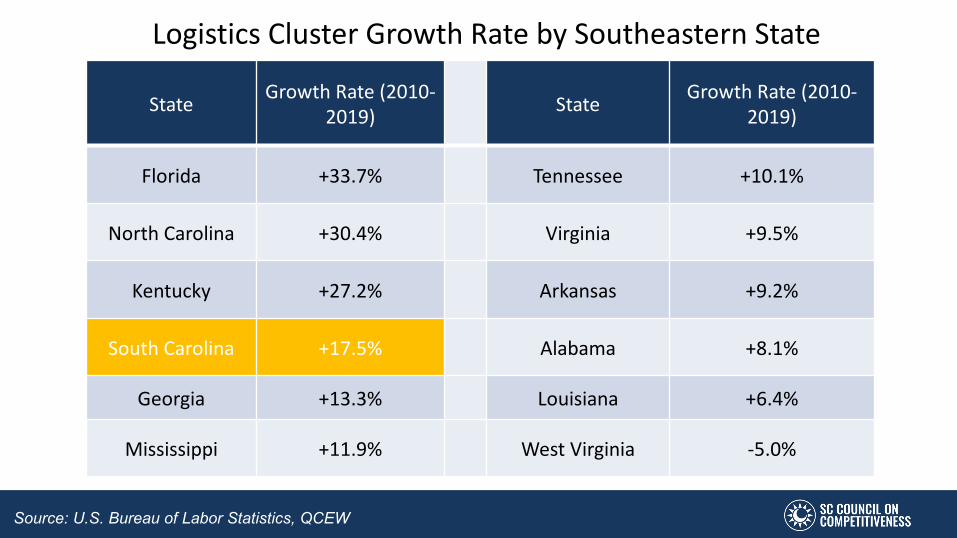
Logistics Cluster Growth Rate by Southeastern State
State Growth Rate (2010-2019) State Growth Rate (2010-
2019)
Florida +33.7% Tennessee +10.1%
North Carolina +30.4% Virginia +9.5%
Kentucky +27.2% Arkansas +9.2%
South Carolina +17.5% Alabama +8.1%
Georgia +13.3% Louisiana +6.4%
Mississippi +11.9% West Virginia -5.0%
Source: U.S. Bureau of Labor Statistics, QCEW
The Future of S.C. Logistics

Embedded Functions as a Pct. of Total Logistics Employment
Source: U.S. Bureau of Labor Statistics, QCEW
State Percentage Ranking
Virginia 5.7% 1Alabama 4.5% 2Georgia 3.7% 3Florida 3.2% 4
Arkansas 3.0% 5South Carolina 3.0% 6North Carolina 2.8% 7
Tennessee 2.7% 8Kentucky 2.3% 9
Mississippi 2.3% 10West Virginia 2.1% 11

Annual Growth in Embedded Functions Employment (2010-2019)
Source: U.S. Bureau of Labor Statistics, QCEW
State Percentage Ranking
Florida 8.6% 2Mississippi 7.8% 3
Georgia 6.0% 4
Tennessee 5.3% 5Kentucky 4.7% 6
Arkansas 4.6% 7North Carolina 4.6% 8
Alabama 2.6% 9Virginia 2.3% 10
West Virginia -0.1% 11
South Carolina 15.7% 1

Embedded
Providervs.

Thank You!


