22.03.2010 1 The Limits of Resource Use and how to deal with them Dr. Friedrich Hinterberger SustainableEurope Research Institute Seminar A Path to Equitable Global Development - Degrowth in the North and Sustainable Growth in the South? SID-Globale Verantwortung Wien, 22nd March 2010 2 F.Hinterberger(SERI) Wien, 22.3.2010 Zur Person: Dr. Friedrich Hinterberger 2 Born 1959 in Schwanenstadt/Oberösterreich Studies 1978-85: economics and statistics, Universität Linz Promotion 1990: public finance, Universität Gießen Wuppertal Institute 1993-2000: group leader/acting director Themes: Stoffströme und Strukturwandel; Ecological Economics Since 1999: Founding president of the Sustainable Europe Research Institute Many other activities(z.B. Club of Rome, Austrian quality of Life research initaitve)
Transcript
22.03.2010
1
The Limits of Resource Useand how to deal with them
Dr. Friedrich HinterbergerSustainable Europe Research Institute
SeminarA Path to Equitable Global Development - Degrowth in the North and Sustainable Growth in the South?
SID-Globale Verantwortung
Wien, 22nd March 2010
2F.Hinterberger (SERI)Wien, 22.3.2010
Zur Person: Dr. Friedrich Hinterberger
2
Born 1959 in Schwanenstadt/Oberösterreich
Studies 1978-85: economics and statistics, Universität Linz
Promotion 1990: public finance, Universität Gießen
Wuppertal Institute 1993-2000: group leader/acting directorThemes: Stoffströme und Strukturwandel; Ecological Economics
Since 1999: Founding president of the Sustainable Europe Research Institute
Many other activities(z.B. Club of Rome, Austrian quality of Life research initaitve)
22.03.2010
2
3F.Hinterberger (SERI)Wien, 22.3.2010
Sustainable Europe Research Institute
3
Europäisches Forschungsnetzwerk: Haupt-Sitz in 1090 Wien mit derzeit 22 Mitarbeiternca. 1 Mio Euro Jahresumsatzweitere Büros in Deutschland, demnächst vielleicht F, GR, ...
Themen: Ecological Economics, Konsum, Produktion, Globalisierung, Europa, Nachhaltige Gesellschaften, Politik, Wissenschaft für
Nachhaltigkeit
Forschung: Europäische und nationale Projekte
Kommunikation: Öffentlichkeit, neue Medien
Beratung: Politik, NGOs, Unternehmen
4F.Hinterberger (SERI)Wien, 22.3.2010
SERI: Team
22.03.2010
3
5F.Hinterberger (SERI)Wien, 22.3.2010
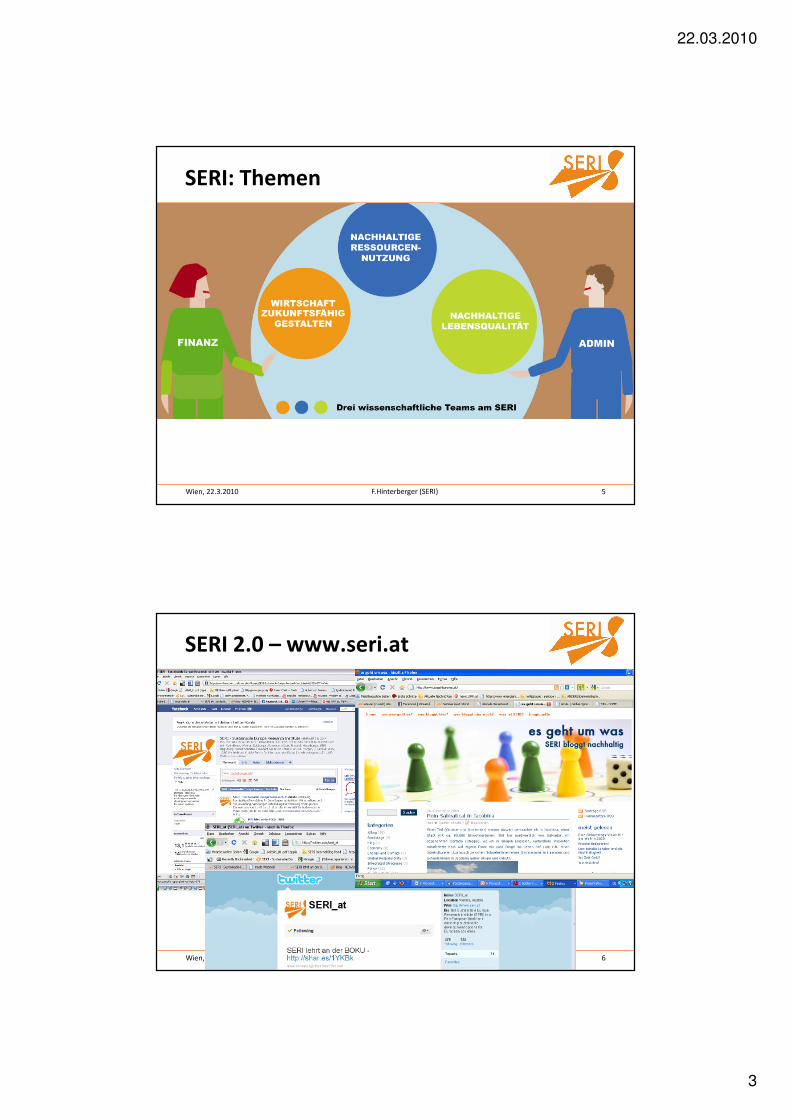
SERI: Themen
6F.Hinterberger (SERI)Wien, 22.3.2010
SERI 2.0 – www.seri.at
22.03.2010
4
7F.Hinterberger (SERI)Wien, 22.3.2010
� Limits! What limits?
� Degrowth in the North and Sustainable Growth in the
South?
� How to communicate OUR responsibility?
OVERVIEW
8F.Hinterberger (SERI)Wien, 22.3.2010
OVERVIEW
� Limits! What limits?
� Degrowth in the North and Sustainable Growth in the
South?
� How to communicate OUR responsibility?
22.03.2010
5
9F.Hinterberger (SERI)Wien, 22.3.2010
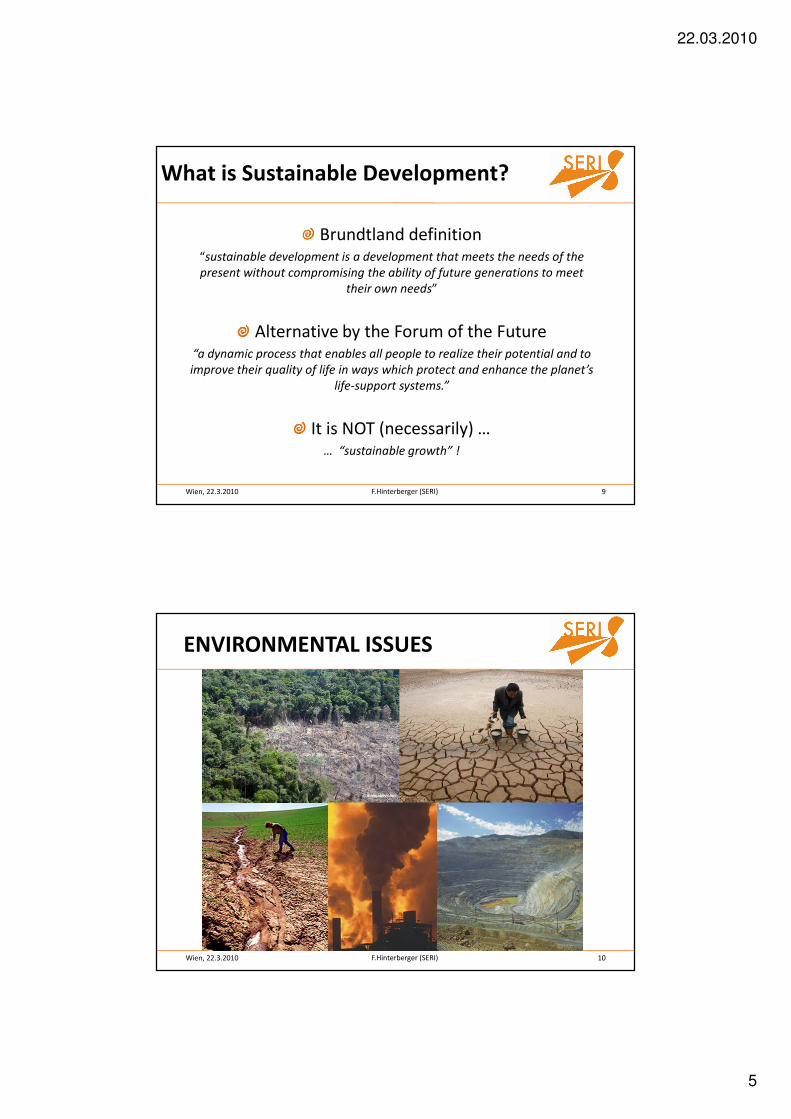
What is Sustainable Development?
Brundtland definition “sustainable development is a development that meets the needs of the
present without compromising the ability of future generations to meet
their own needs”
Alternative by the Forum of the Future“a dynamic process that enables all people to realize their potential and to
improve their quality of life in ways which protect and enhance the planet’s
life-support systems.”
It is NOT (necessarily) …… “sustainable growth” !
10F.Hinterberger (SERI)Wien, 22.3.2010
ENVIRONMENTAL ISSUES
22.03.2010
6
11F.Hinterberger (SERI)Wien, 22.3.2010
ENVIRONMENTAL ISSUES
12F.Hinterberger (SERI)Wien, 22.3.2010
EXTENSIVE RESOURCE USE!
ecospherematerial
water
air
land
InputsInputs
economicsystem
OutputsOutputs
waste water
emissions
waste
22.03.2010
7
13F.Hinterberger (SERI)Wien, 22.3.2010
EXTENSIVE RESOURCE USE!
ecospherematerial
water
air
land
InputsInputs
economicsystem
OutputsOutputs
waste water
emissions
waste
14F.Hinterberger (SERI)Wien, 22.3.2010
Global environmental issues
…caused by extensive resource use related to production and use of products!
Mitigate environmental problems by reducing resource use in absolute terms.
22.03.2010
8
15F.Hinterberger (SERI)Wien, 22.3.2010
• Unsustainable trends of global resource extraction and use
• 80% of world population still live in poverty (< 10 US$ per day) � need to increase consumption
• How to achieve high quality of life for 9-10 billion without overusing ecosystem capacities &
conflicts over scarce non-renewable resources?
• High-consuming countries (incl. Europe) need to reduce their resource use in absolute terms
Global resource use
16F.Hinterberger (SERI)Wien, 22.3.2010
Resource consumption per day in different societies (in kg per day)
Source: Calculations based on Fischer-Kowalski, M., Haberl, H., Hüttler, W., Payer, H., Schandl, H., Winiwarter, V., Zangerl-Weisz, H. (Eds.).1997. Gesellschaftlicher Stoffwechsel und Kolonisierung von Natur. G+B Verlag.
22.03.2010
9
17F.Hinterberger (SERI)Wien, 22.3.2010
EXTRACTION of resources per capita per day
Source: SERI Global Material Flow Database. 2008 Version. See www.materialflows.net.
18F.Hinterberger (SERI)Wien, 22.3.2010
RESOURCE SCARCITY
Various commodities: peaks of extraction reached or
about to be reached
Future decrease of extraction & constricted availability
Peak oil is approaching, about half the world’s
reserves have already been used
LIMITED BIOCAPACITY
= supply of biologically productive area & related
ecosystem services
Demand increases & per capita availability declines
Overshoot & environmental degradation
Scarce biocapacity the limitto future economic
development
ECOLOGICAL LIMITS TO GROWTH
22.03.2010
10
19F.Hinterberger (SERI)Wien, 22.3.2010
Commodity Peak Depletion
Oil 2010-2030 2050-2100
Natural gas 2010-2025 2050-2100
Coal 2100 2160-2210
Copper 2040-2070
Platinum ~ 2020
Indium 2015-2020
Source: European Parliament, 2009: Eco-Innovation Report
RESOURCE SCARCITY (1): PEAKS
20F.Hinterberger (SERI)Wien, 22.3.2010
Sources: BP, 2006 and 2007; USGS, 2006 and 2008; NAE/IAEA, 2008
RESOURCE SCARCITY (2): RESOURCE RESERVES
22.03.2010
11
21F.Hinterberger (SERI)Wien, 22.3.2010
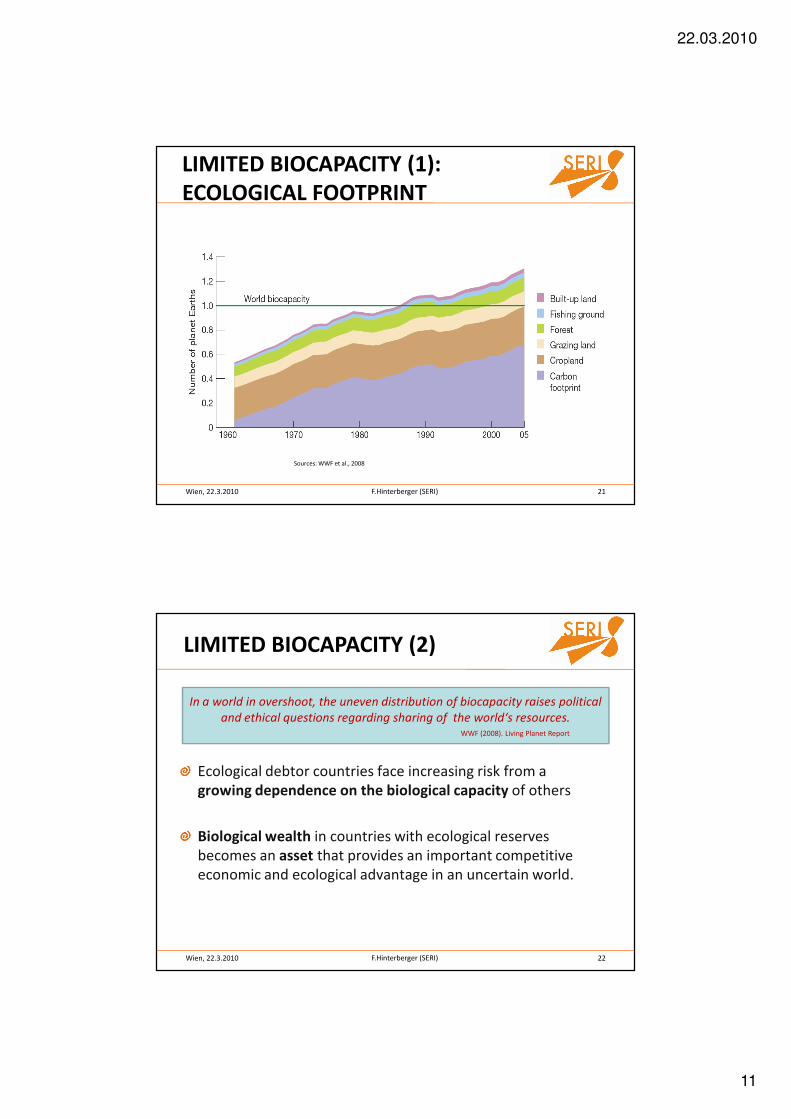
Sources: WWF et al., 2008
LIMITED BIOCAPACITY (1): ECOLOGICAL FOOTPRINT
22F.Hinterberger (SERI)Wien, 22.3.2010
Ecological debtor countries face increasing risk from a growing dependence on the biological capacity of others
Biological wealth in countries with ecological reserves becomes an asset that provides an important competitive economic and ecological advantage in an uncertain world.
In a world in overshoot, the uneven distribution of biocapacity raises political
and ethical questions regarding sharing of the world‘s resources. WWF (2008). Living Planet Report
LIMITED BIOCAPACITY (2)
22.03.2010
12
23F.Hinterberger (SERI)Wien, 22.3.2010
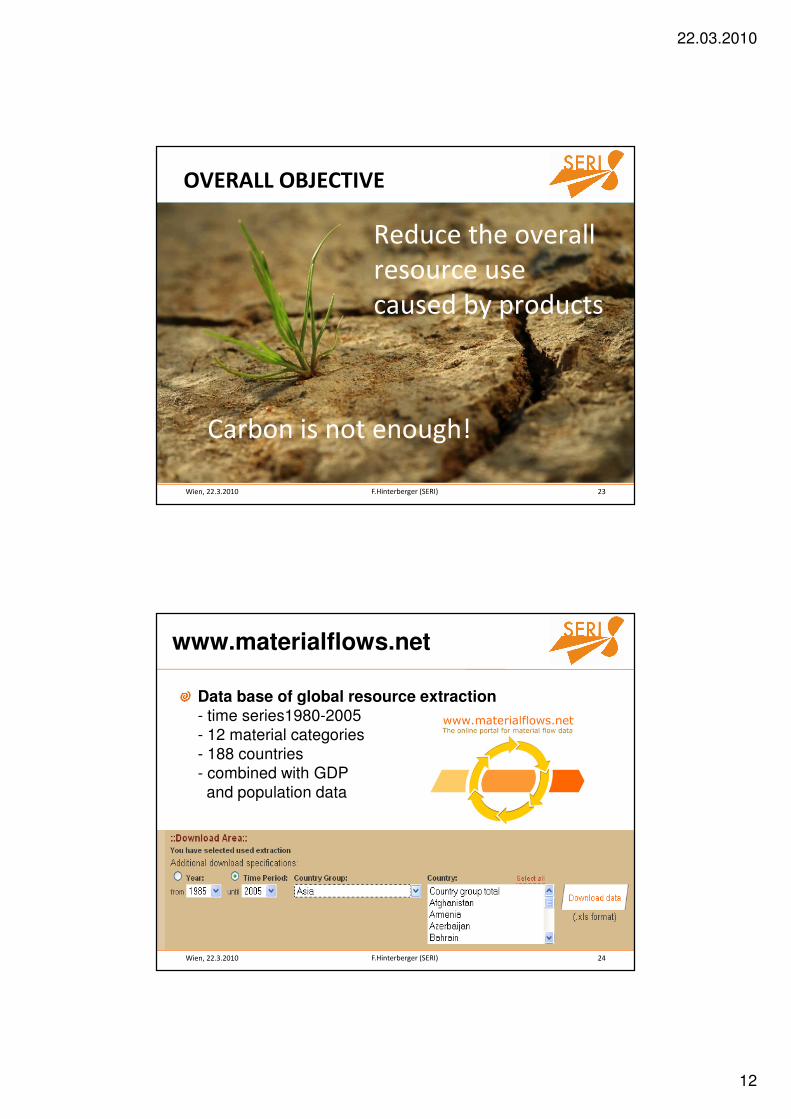
Reduce the overall resource use caused by products
Carbon is not enough!
OVERALL OBJECTIVE
24F.Hinterberger (SERI)Wien, 22.3.2010
www.materialflows.net
Data base of global resource extraction - time series1980-2005- 12 material categories- 188 countries- combined with GDP and population data
22.03.2010
13
25F.Hinterberger (SERI)Wien, 22.3.2010
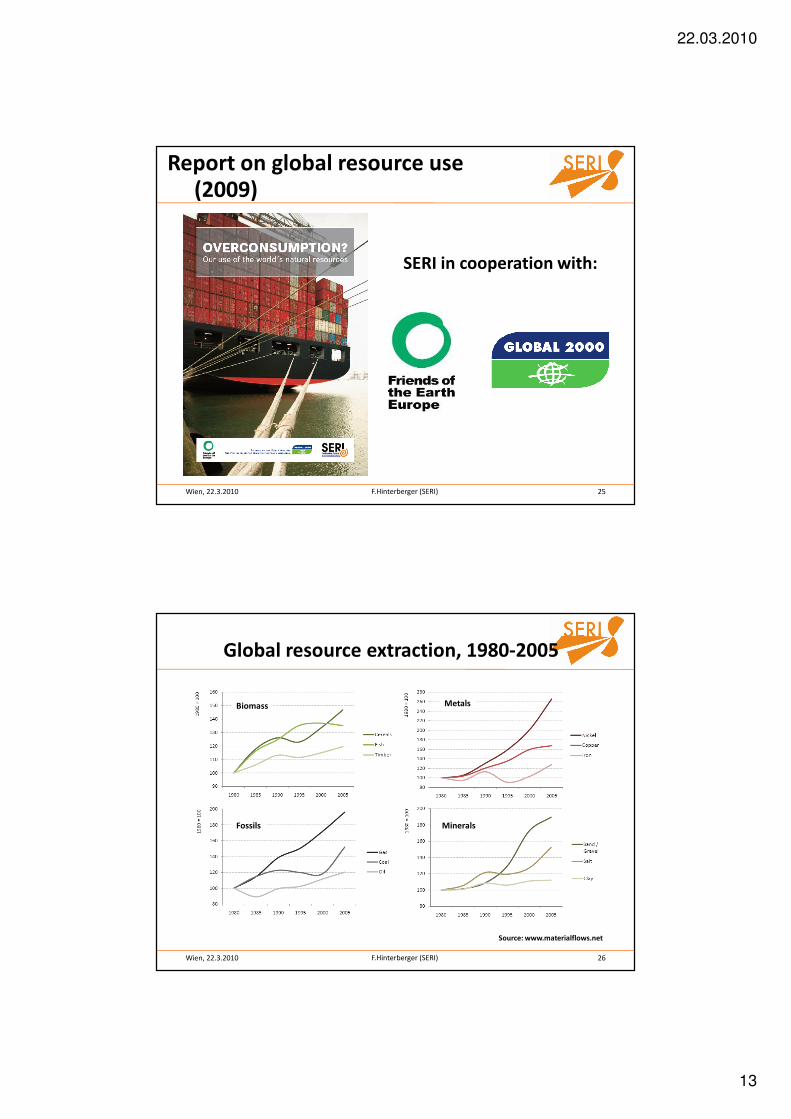
Report on global resource use(2009)
SERI in cooperation with:
26F.Hinterberger (SERI)Wien, 22.3.2010
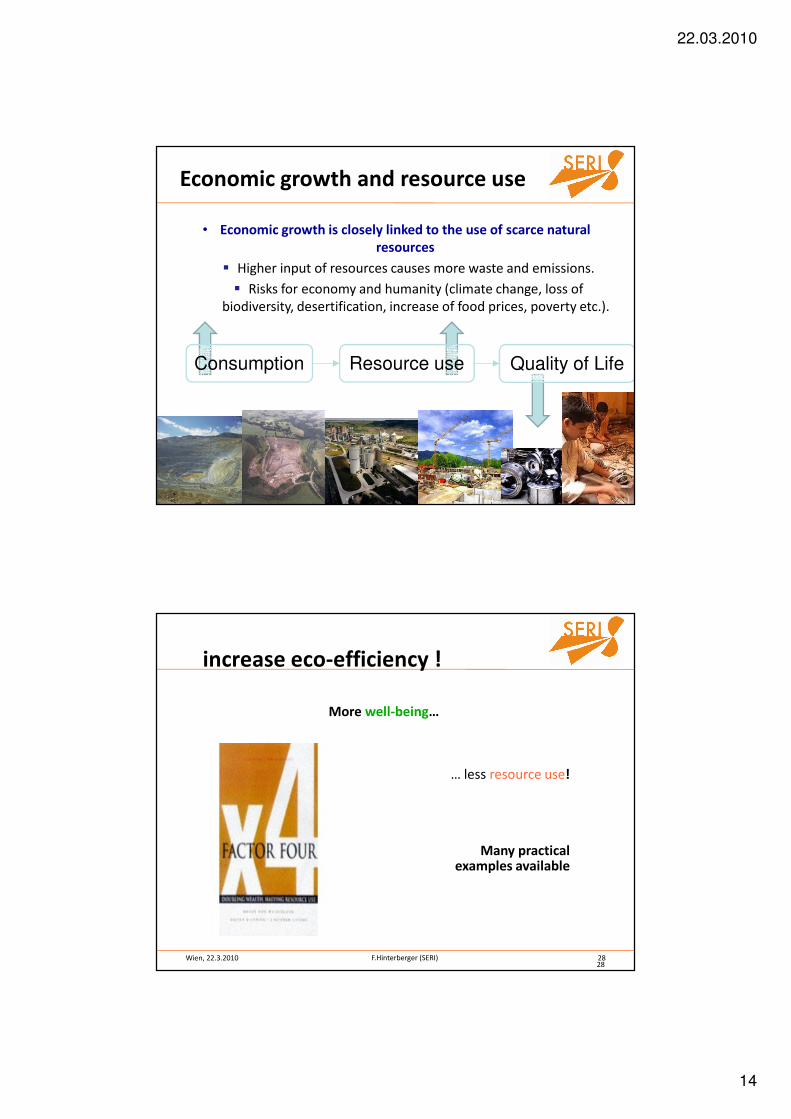
Source: www.materialflows.net
Global resource extraction, 1980-2005
Biomass
Fossils
Metals
Minerals
22.03.2010
14
27F.Hinterberger (SERI)Wien, 22.3.2010
Economic growth and resource use
• Economic growth is closely linked to the use of scarce naturalresources
� Higher input of resources causes more waste and emissions.
� Risks for economy and humanity (climate change, loss ofbiodiversity, desertification, increase of food prices, poverty etc.).
Consumption Quality of LifeResource use
28F.Hinterberger (SERI)Wien, 22.3.201028
More well-being…
… less resource use!
Many practical examples available
increase eco-efficiency !
22.03.2010
15
29F.Hinterberger (SERI)Wien, 22.3.2010
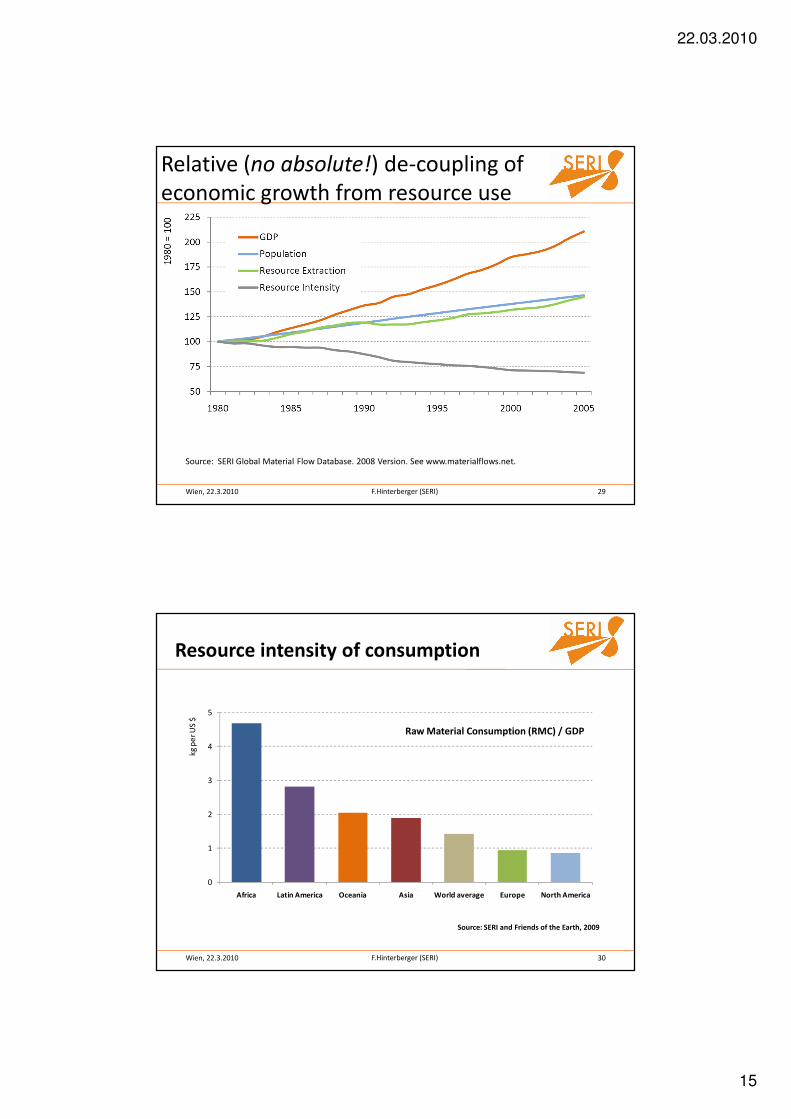
Relative (no absolute!) de-coupling of economic growth from resource use
Source: SERI Global Material Flow Database. 2008 Version. See www.materialflows.net.
30F.Hinterberger (SERI)Wien, 22.3.2010
0
1
2
3
4
5
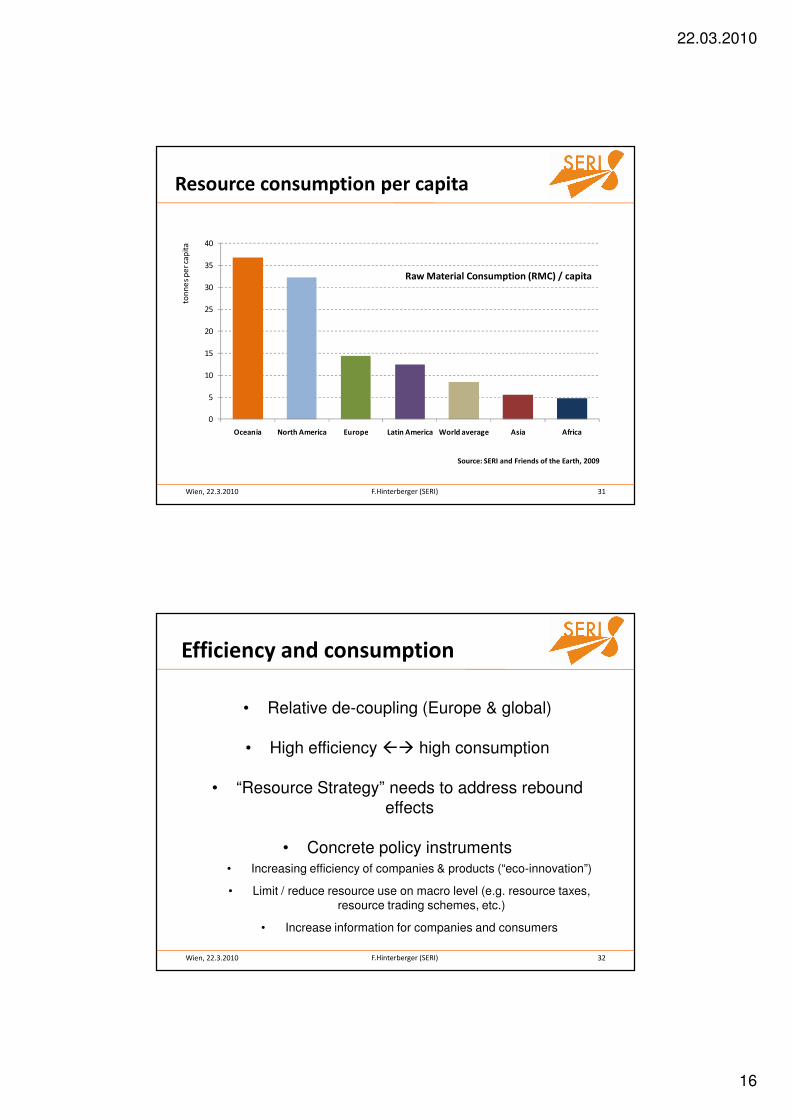
Africa Latin America Oceania Asia World average Europe North America
kg p
er U
S $
Source: SERI and Friends of the Earth, 2009
Resource intensity of consumption
Raw Material Consumption (RMC) / GDP
22.03.2010
16
31F.Hinterberger (SERI)Wien, 22.3.2010
0
5
10
15
20
25
30
35
40
Oceania North America Europe Latin America World average Asia Africa
ton
ne
s p
er c
apit
a
Source: SERI and Friends of the Earth, 2009
Resource consumption per capita
Raw Material Consumption (RMC) / capita
32F.Hinterberger (SERI)Wien, 22.3.2010
• Relative de-coupling (Europe & global)
• High efficiency � high consumption
• “Resource Strategy” needs to address rebound effects
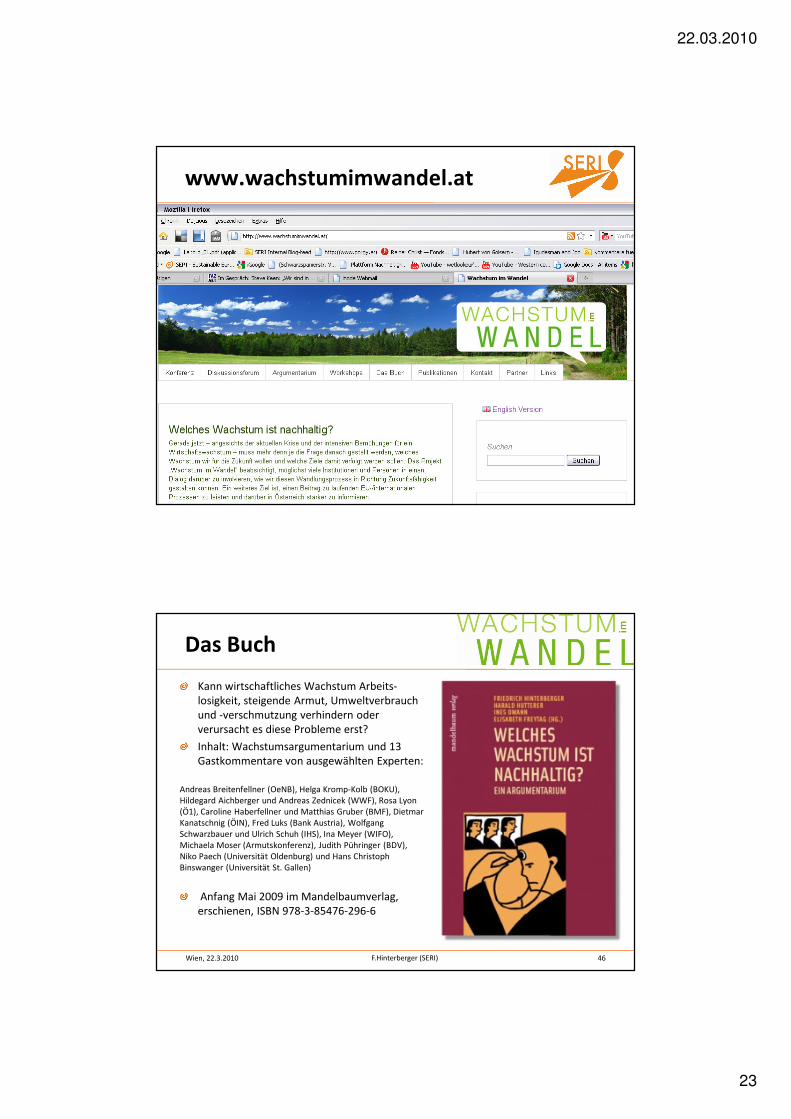
Kann wirtschaftliches Wachstum Arbeits-losigkeit, steigende Armut, Umweltverbrauch und -verschmutzung verhindern oder verursacht es diese Probleme erst?
Inhalt: Wachstumsargumentarium und 13 Gastkommentare von ausgewählten Experten:
Andreas Breitenfellner (OeNB), Helga Kromp-Kolb (BOKU), Hildegard Aichberger und Andreas Zednicek (WWF), Rosa Lyon (Ö1), Caroline Haberfellner und Matthias Gruber (BMF), Dietmar Kanatschnig (ÖIN), Fred Luks (Bank Austria), Wolfgang Schwarzbauer und Ulrich Schuh (IHS), Ina Meyer (WIFO), Michaela Moser (Armutskonferenz), Judith Pühringer (BDV), Niko Paech (Universität Oldenburg) und Hans Christoph Binswanger (Universität St. Gallen)
Anfang Mai 2009 im Mandelbaumverlag, erschienen, ISBN 978-3-85476-296-6
22.03.2010
24
47F.Hinterberger (SERI)Wien, 22.3.2010
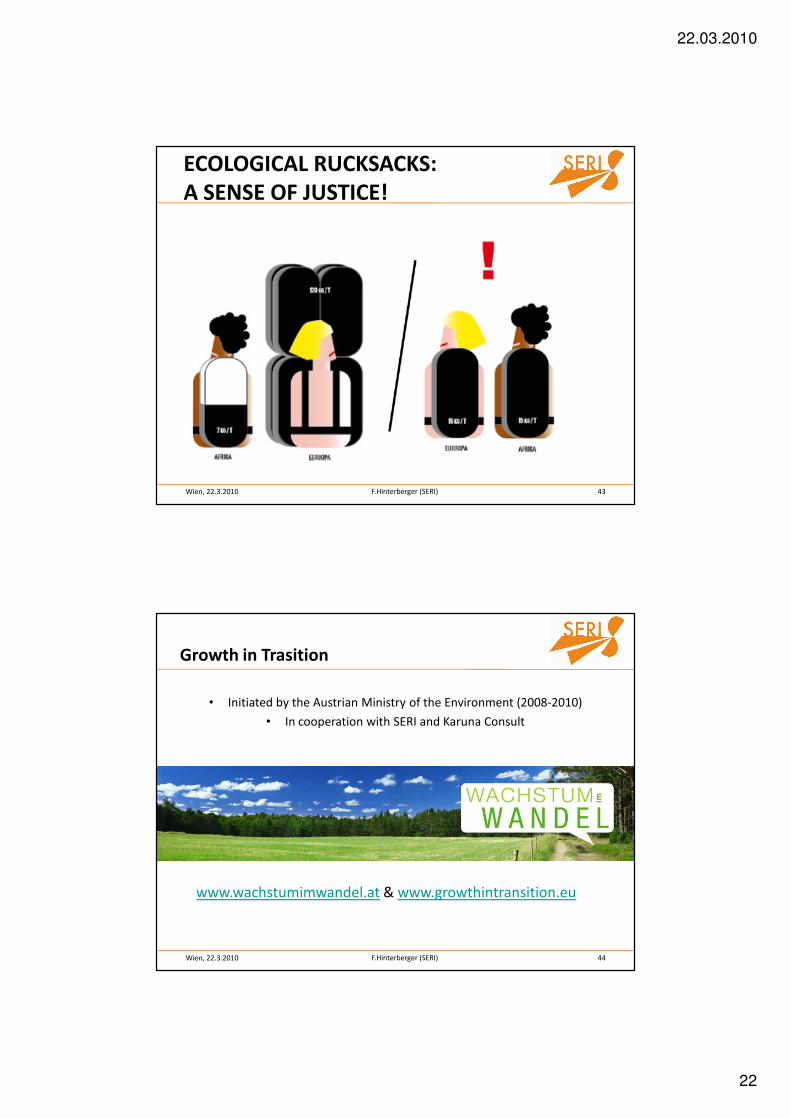
Was bisher geschah
Erarbeitung eines Argumentariums für ein Wachstum, das mit einer
nachhaltigen Entwicklung im Einklang steht (Stakeholderprozess)
Workshops und Konferenz• 16. 3. 2009 “Welches Wachstum? Ökosoziale Marktwirtschaft im Gespräch. Stichwort
Lebensqualität“• 21. 4. 2009 „Redefining Growth and Prosperity“• 13. 5. 2009 Präsentation des Buchs “Welches Wachstum ist nachhaltig? Ein Argumentarium”• 26. 5. 2009 „Wirtschaftswachstum und Ressourcenverbrauch: Entwicklung und Perspektiven“• 10. 6. 2009 „Wachstum zukunftsfähig gestalten – Schauplätze, AkteurInnen, Perspektiven“• 2. 9. 2009 „Wirtschaft gesund schrumpfen?“ – Vortrag von Dennis Meadows• 27. 1. 2010 „SciBarCamp Growth in Transition“• 28./29. 1. 2010 „Growth in Transition“ (internationale Konferenz mit über 550 TN)
Diskussionspapier, online Diskussionsforum
Website www.wachstumimwandel.at und www.growthintransition.eu
48F.Hinterberger (SERI)Wien, 22.3.2010
Partners
22.03.2010
25
49F.Hinterberger (SERI)Wien, 22.3.201049
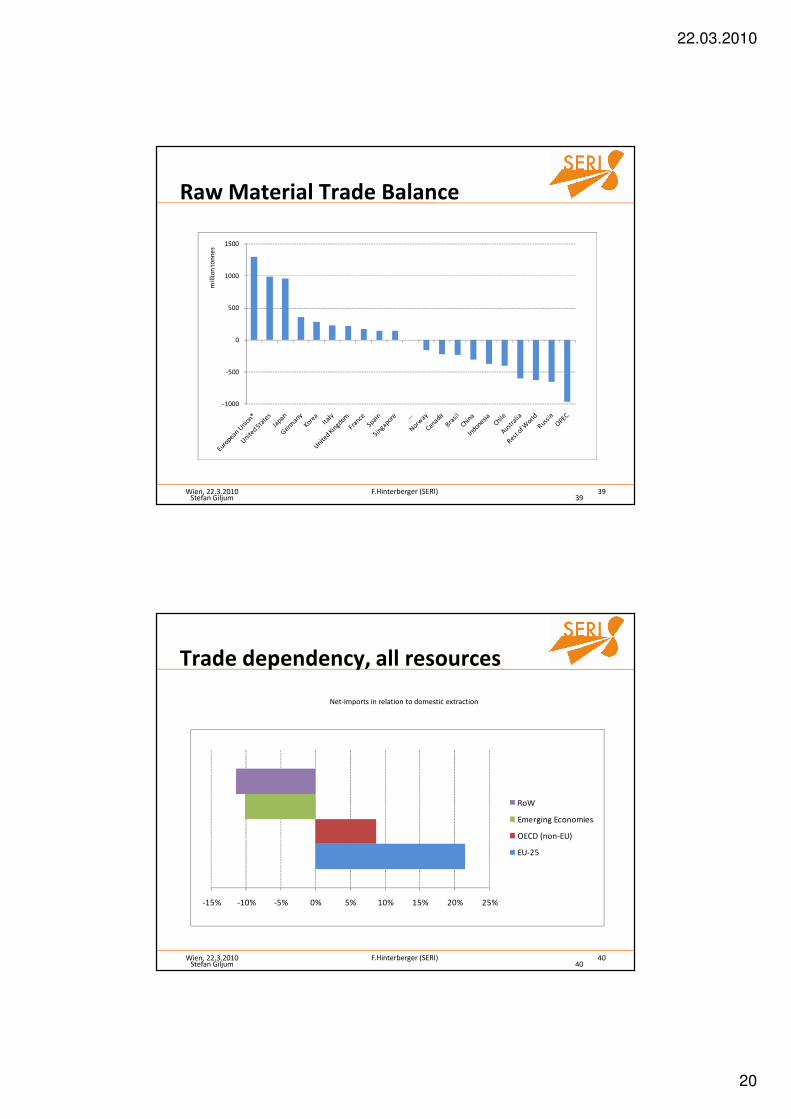
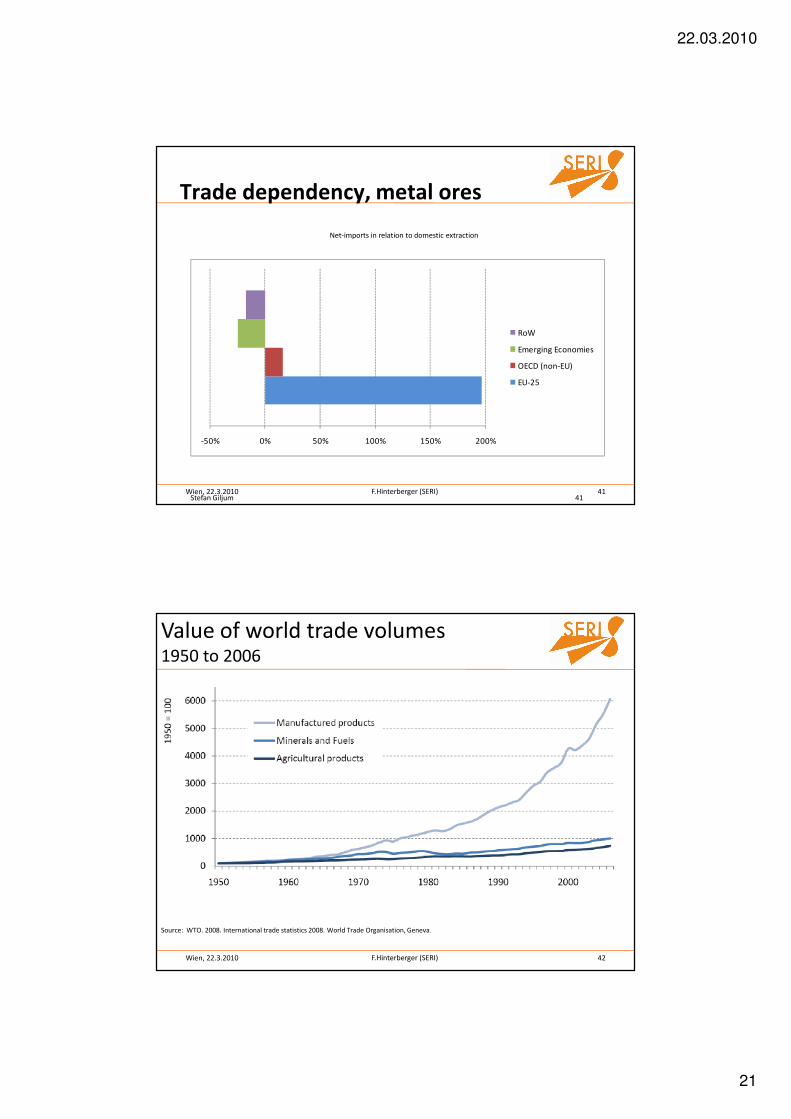
Summary of results
− Resource use: European economy highly interconnected with the rest of the world and dependent
on resource imports (metal ores & fossil fuels)
− Possible strategies: − ensure access to foreign resources
− increase domestic extraction and supply− increase resource productivity
− reduce demand
− Need to consider global dimension in environmental and resource policies (responsibility of consumption)
50F.Hinterberger (SERI)Wien, 22.3.201050
Summary of results
− International trade:
− Net-flows of resources from low- and middle-income countries to high income countries
− Trade reinforces inequalities in resource extraction and resource consumption
− Role of resource exports in development strategies
• Proportion of high income doubles from 18% to 36%
• 45%: 1/2 wealth
• Remaining 19%: 1/10 wealth
� Achievable with 3% GDP growth p.a. i.e. growth of Factor 4 of world GDP
(with practically no growth in rich world regions!)
*Meinhard Miegel (2008): Zukunft und Risiko. Die Folgen des Fortschritts. NZZ Podium, 31/01/2008
51
52F.Hinterberger (SERI)Wien, 22.3.2010
World GDP x 4 (equal to 3% p.a.)
= Resource use x 4
BUT:to halve the world‘s resource use
we need
an increase of resource productivity by a Factor 8
= 6% productivity growth p.a.
(with practically no growth in rich world regions!)
52
A scenario on growth and resource use
22.03.2010
27
53F.Hinterberger (SERI)Wien, 22.3.2010
In the above scenario
GDP growth in the rich part of the world
by 3% p.a.
whilehalving the world‘s resource use
requires
an increase of resource productivity by a Factor 30 !
= 9% productivity growth p.a.
53
A scenario on growth and resource use
54F.Hinterberger (SERI)Wien, 22.3.2010
Ökonomischer Wachstumsdialog
22.03.2010
28
55F.Hinterberger (SERI)Wien, 22.3.2010
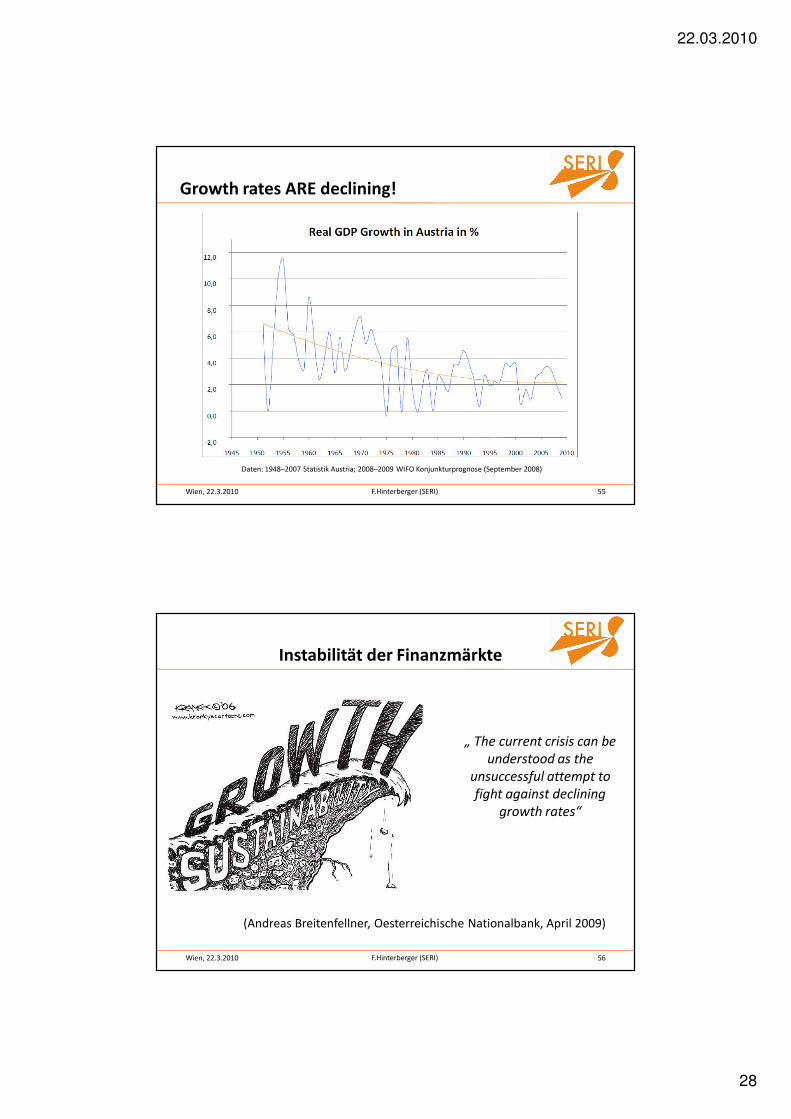
Growth rates ARE declining!
Daten: 1948–2007 Statistik Austria; 2008–2009 WIFO Konjunkturprognose (September 2008)
56F.Hinterberger (SERI)Wien, 22.3.2010
Instabilität der Finanzmärkte
„ The current crisis can be
understood as the
unsuccessful attempt to
fight against declining
growth rates“
(Andreas Breitenfellner, Oesterreichische Nationalbank, April 2009)
22.03.2010
29
57F.Hinterberger (SERI)Wien, 22.3.2010
Frankfurter Allgemeine Zeitung
58F.Hinterberger (SERI)Wien, 22.3.2010
OVERVIEW
� Limits! What limits?
� Degrowth in the North and Sustainable Growth in the
South?
� How to communicate OUR responsibility?
22.03.2010
30
59F.Hinterberger (SERI)Wien, 22.3.2010
Why is measuring important?
“You can’t manage what you can’t measure”
Clear communication in an understandable way is key to reach target audiences.
Targets can only be defined based on clear measurement systems and robust indicators.
Policy makers demand solid information to design appropriate policy responses.
(Self-) evaluation and (cyclical) re-design of policies
-> scoping, visioning and learing! (www.matisse-project.net)
60F.Hinterberger (SERI)Wien, 22.3.2010
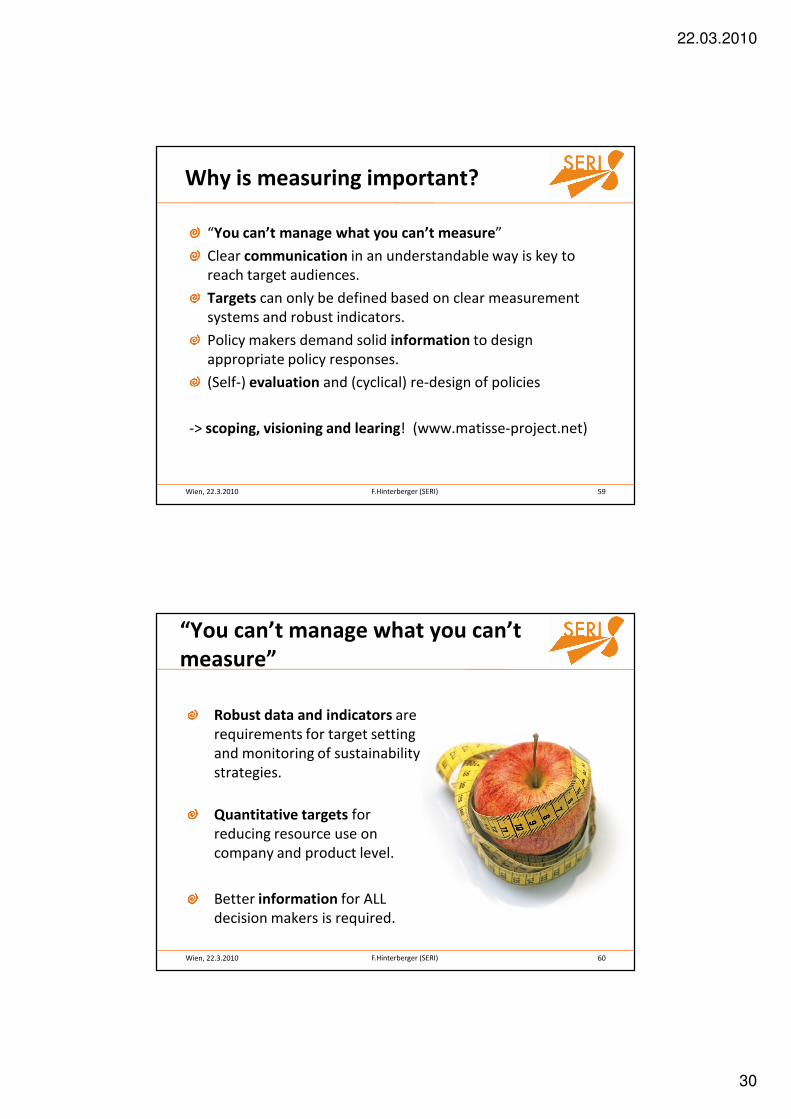
“You can’t manage what you can’t measure”
Robust data and indicators are requirements for target setting and monitoring of sustainability strategies.
Quantitative targets for reducing resource use on company and product level.
Better information for ALL decision makers is required.
22.03.2010
31
61F.Hinterberger (SERI)Wien, 22.3.2010
Commission on the Measurement of Economic Performance and Social Progress (“Stiglitz-Commission”)
Aims: • to identify the limits of GDP as an indicator of economic performance and social progress
• to consider additional information for the production of a more relevant picture
• to discuss how to present this information in the most appropriate way
• to check the feasibility of measurement tools
Outcome: Final report of the Commission (October 2009) that gains a lot of political interest and discussion
How should we measure progress (1)
www.stiglitz-sen-fitoussi.fr
62F.Hinterberger (SERI)Wien, 22.3.2010
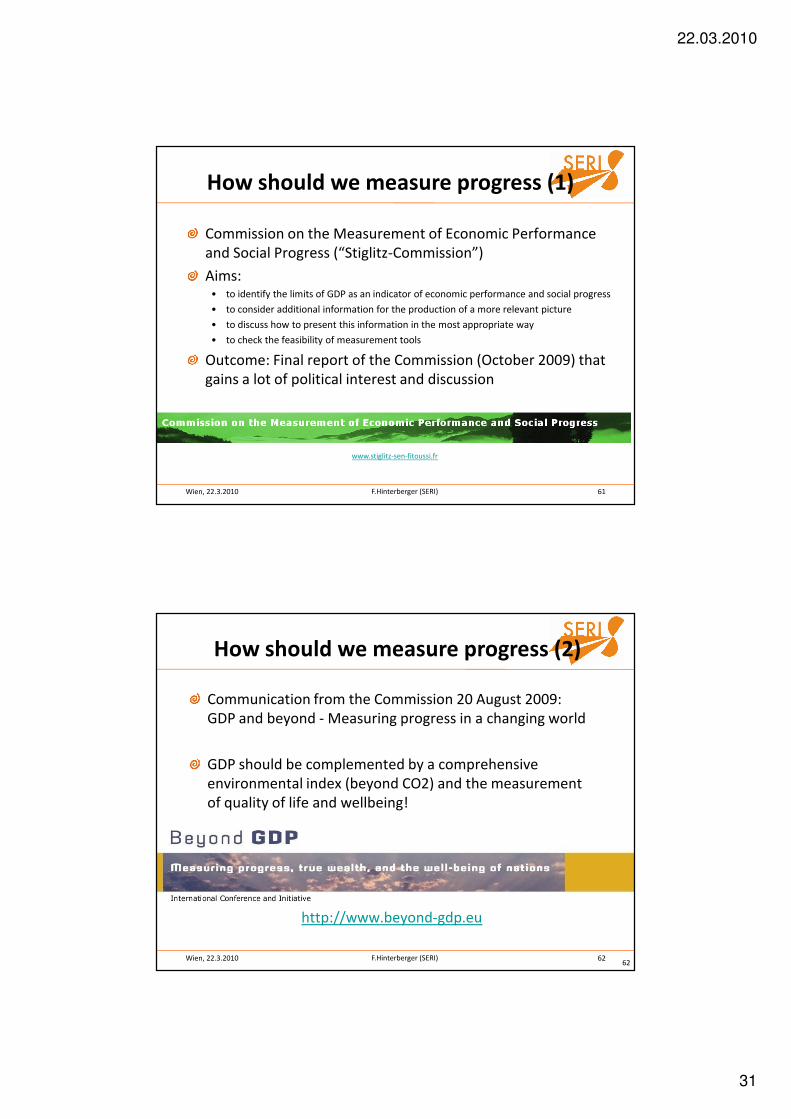
How should we measure progress (2)
62
Communication from the Commission 20 August 2009: GDP and beyond - Measuring progress in a changing world
GDP should be complemented by a comprehensive environmental index (beyond CO2) and the measurement of quality of life and wellbeing!
http://www.beyond-gdp.eu
22.03.2010
32
63F.Hinterberger (SERI)Wien, 22.3.2010
How should we measure progress (2)
63
Communication from the Commission 20 August 2009: GDP and beyond - Measuring progress in a changing world
GDP should be complemented by a comprehensive environmental index (beyond CO2) and the measurement of quality of life and wellbeing!
http://www.beyond-gdp.eu
64F.Hinterberger (SERI)Wien, 22.3.2010
„Frontpage indicators“: the big 3 ?
Economic (GDP) growth
Quality of life
(... environment ...)
22.03.2010
33
65F.Hinterberger (SERI)Wien, 22.3.2010
„Frontpage indicators“: the big 3 !
Economic (GDP) growth
Quality of life
Overall resource use !
66F.Hinterberger (SERI)Wien, 22.3.2010
Distribution of European resource consumption
Source: Calculations based on Moll, S., Watson, D. 2009. Environmental Pressures from European Consumption and Production. A studyin integrated environmental and economic analysis. European Topic Centre of Sustainable Consumption and Production, Copenhagen.
22.03.2010
34
67F.Hinterberger (SERI)Wien, 22.3.2010
ECR WORKING GROUP ON SUSTAINABILITY
68F.Hinterberger (SERI)Wien, 22.3.2010
GHG – green house gas emissions
Water
Land Use
Abiotic materials
Biotic materials
Carbon Footprint
Water Footprint
Biotic Material Input
Abiotic Material Input
Actual Land Use
Environmental Categories Our Indicator Set
LIFE-CYCLE MEASUREMENT
ProductionManu-
facturingDistribution Retailer Use
DisposalRecycling
22.03.2010
35
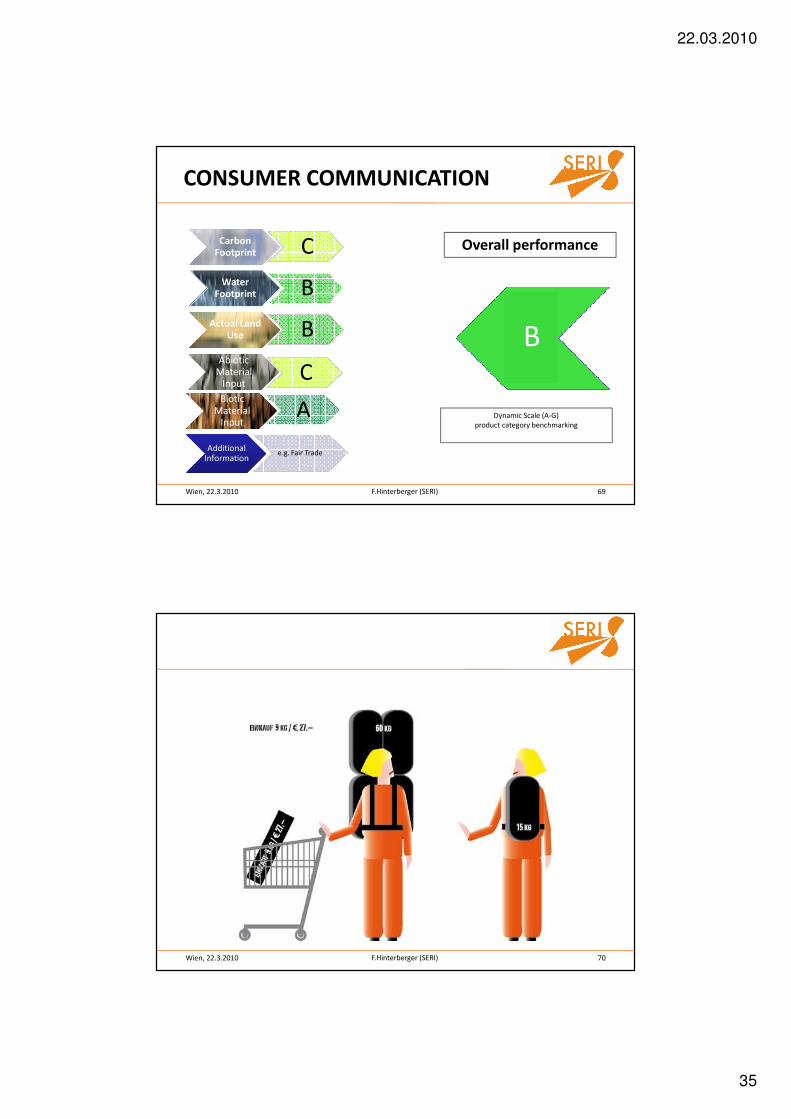
69F.Hinterberger (SERI)Wien, 22.3.2010
Dynamic Scale (A-G)product category benchmarking
Overall performance
B
CarbonFootprintCarbon
Footprint C
WaterFootprint
WaterFootprint B
Actual Land Use
Actual Land Use B
BioticMaterial
Input
BioticMaterial
InputA
AbioticMaterial
Input
AbioticMaterial
InputC
Additional Information
e.g. Fair Trade
CONSUMER COMMUNICATION
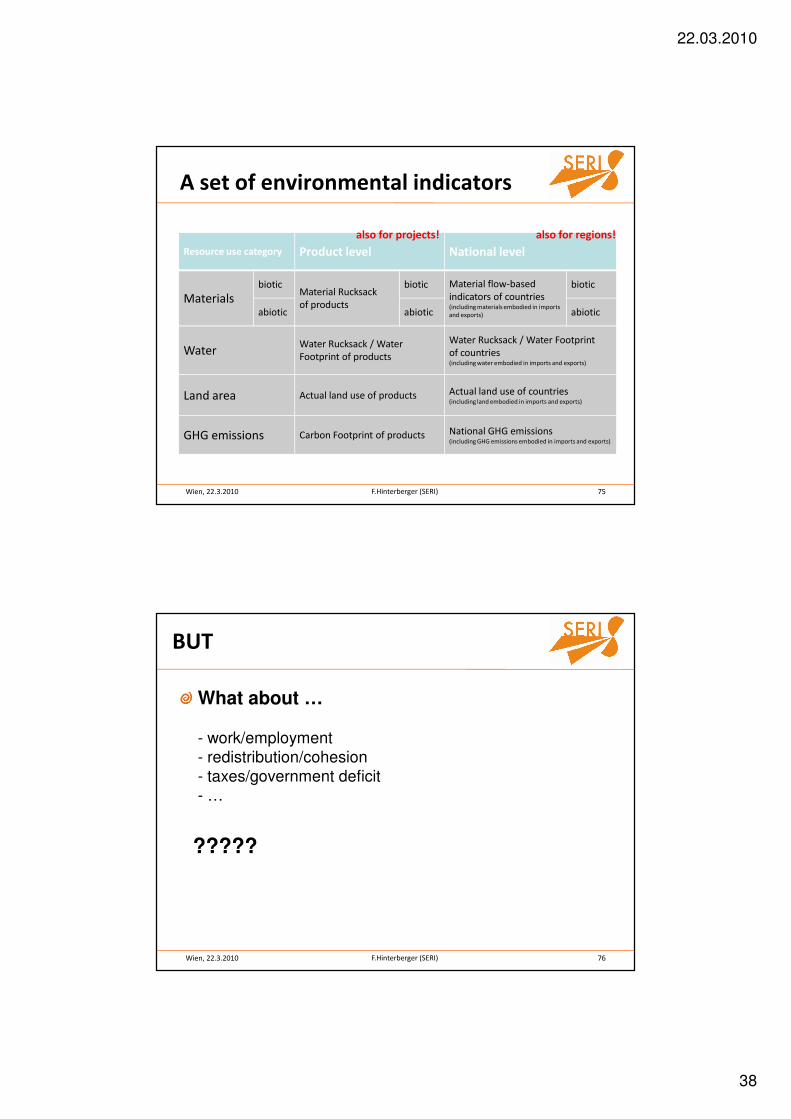
70F.Hinterberger (SERI)Wien, 22.3.2010
22.03.2010
36
71F.Hinterberger (SERI)Wien, 22.3.2010
VISUALIZATION EXAMPLERESULTS FOR LIGHT BULBS
8 YEARS/8.000 OPERATING HOURS
LOW-ENERGY LIGHT BULB
LIGHT BULB
72F.Hinterberger (SERI)Wien, 22.3.2010
VISUALIZATION EXAMPLERESULTS FOR LIGHT BULBS for DAILY CONSUMPTION
LIGHT BULB LOW-ENERGY LIGHT BULB
10 LAMPS (FLAT)/DAILY CONSUMPTION PER CAPITA FAMILY FLAT/3 PERSONSWITH OFFICE (30 LAMPS)
22.03.2010
37
73F.Hinterberger (SERI)Wien, 22.3.2010
GDA - Guideline Daily Amount
Carbon Footprint
935g
17%
Water Footprint
?
22%
Actual Land Use
7,8 m²
16%
Biotic Material
Input
?
20%
AbioticMaterial
Input
2250g
15%
Additional Information: e.g. Fair Trade
Sustainble levels of resource use:
CO2: 5,5kg/cap/dLand Use: 49 m²/cap/d
Abiotic Material: 15kg/cap/d
22,,77kgkg
LABELLING PRODUCTS: POSSIBLE CONSUMER COMMUNICATION
74F.Hinterberger (SERI)Wien, 22.3.2010
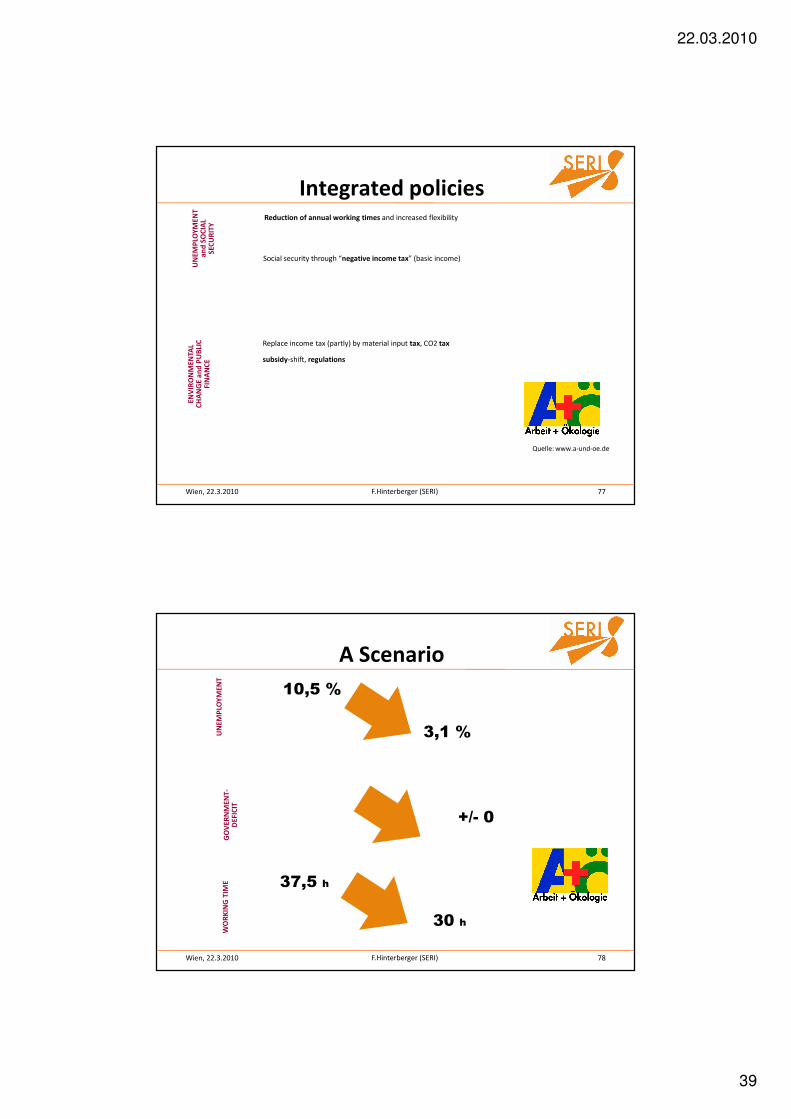
A set of environmental indicators
main categories of quantitative resource use
plus the output-category CO2-emissions
Indicators applied
GHG emissions
Water
Land use
Non-renewable resources
Renewable resources
Carbon Footprint
Water Rucksack
Biotic Material Rucksack
Abiotic Material Rucksack
Actual Land UseGHG emissions
Water
Land use
Non-renewable resources
Renewable resources
Carbon Footprint
Water Footprint
Biotic Material Input
Abiotic Material Input
Actual Land Use
22.03.2010
38
75F.Hinterberger (SERI)Wien, 22.3.2010
Resource use category Product level National level
Materialsbiotic
Material Rucksack of products
biotic Material flow-based indicators of countries(including materials embodied in imports and exports)
biotic
abiotic abiotic abiotic
WaterWater Rucksack / Water Footprint of products
Water Rucksack / Water Footprint of countries(including water embodied in imports and exports)
Land area Actual land use of products Actual land use of countries(including land embodied in imports and exports)
GHG emissions Carbon Footprint of products National GHG emissions(including GHG emissions embodied in imports and exports)
Baseline = Business as usual scenarioS1H = ETR with revenue recycling designed to meet unilateral EU 2020 GHG target (high oil price)S3H = ETR with revenue recycling designed to meet cooperation EU 2020 GHG target – an overall
30% reduction in GHG emissions by 2020 compared to 1990 (high oil price)
Global CO2 emissions can only be reduced with global cooperation (S3H)
22.03.2010
41
81F.Hinterberger (SERI)Wien, 22.3.2010
Policy recommendations
1. Combating climate change can only be successful through
global cooperation and global climate treaties
2. Targets to reduce CO2 emissions (by 20-30%) are not
sufficient. Additional measures are needed to increase
resource productivity and to limit resource consumption.
3. The responsibility for resource use and its environmental
impacts should be shared between producers and
consumers.
4. Europe should more actively address the potential conflict
between economic goals and development goals.
82F.Hinterberger (SERI)Wien, 22.3.2010
How to deal with degrowth (1)
• Growth increases wealth:
� If quality of life decouples from material wealth it becomes less dependent on growth!
• Growth increases employment:
� Economically unclear! �redistribution of work!
• Growth reduces inequality
� Empirically, the contrary is true!
� Rich parts of society “need” less material growth to increase their well-being
• Growth enables aid to 3rd World counties
� No evidence of such a link in Austria!
• Growth enables to finance government expenditures
� Possibility (or even necessity) to re-shuffle taxes from labour to resources
22.03.2010
42
83F.Hinterberger (SERI)Wien, 22.3.2010
How to deal with degrowth (2)
• Wachstum enables environmental protection
� On the contrary: growth increases resource consumption