The limits of social mobilization Alex Rutherford * , Manuel Cebrian †‡ , Sohan Dsouza * , Esteban Moro § , Alex Pentland ¶ , and Iyad Rahwan 1 * k * Computing & Information Science, Masdar Institute of Science and Technology, Abu Dhabi, UAE, † Department of Computer Science & Engineering, University of California at San Diego, La Jolla, California, USA, ‡ NICTA, Melbourne, Victoria, Australia, § Department of Mathematics, Universidad Carlos III de Madrid, Madrid, Spain, ¶ Media Laboratory, Massachusetts Institute of Technology, Cambridge, Massachusetts, USA, and k School of Informatics, University of Edinburgh, Edinburgh, UK Submitted to Proceedings of the National Academy of Sciences of the United States of America 1 To whom correspondence may be addressed. Email: [email protected]The Internet and social media has enabled the mobilization of large crowds to achieve time-critical feats, ranging from map- ping crises in real-time, to organizing mass rallies, to conducting search-and-rescue operations over large geographies. Despite significant success, selection bias may lead to inflated expecta- tions of the efficacy of social mobilization for these tasks. What are the limits of social mobilization, and how reliable is it to op- erate at these limits? We build on recent results on the spatio- temporal structure of social and information networks, to eluci- date the constraints they pose on social mobilization. We use the DARPA Network Challenge as our working scenario, in which social media was used to locate 10 balloons across the United States. We conduct high-resolution simulations for referral-based crowdsourcing and obtain a statistical characterization of the pop- ulation recruited, geography covered, and time to completion. Our results demonstrate that the outcome is plausible without the presence of mass media, but lies at the limit of what time- critical social mobilization is capable of. Success relies critically on highly connected individuals willing to mobilize people in dis- tant locations, overcoming the local trapping of diffusion in highly dense areas. Yet, even under these highly favorable conditions, the risk of unsuccessful search remains significant. These find- ings have implications on the design of better incentive schemes for social mobilization. They also call for caution in estimating the reliability of this capability. social mobilization | networks | search The Internet and online social media are now credited with the unprecedented ability to coordinate the mobilization of large masses of people to achieve incredible feats that require coverage of large ge- ographical and informational landscapes in very limited time. Social media has been used to mobilize volunteers to map natural disasters in real-time [1], and to conduct large-scale search-and-rescue mis- sions [2]. Online social networks have also been an important tool in the coordination of mass political rallies [3, 4]. Endeavors like the DARPA Network Challenge [5] aimed to test the power of the Internet and social media in time-critical social mo- bilization to its absolute limits. The Network Challenge required competing teams to locate and submit the coordinates of 10 tethered weather balloons dispersed at random locations all over the continen- tal United States. The winning team, based at MIT, won the challenge by locating all balloons in less than 9 hours. The MIT team used an incentive scheme to kick start an information and recruitment cas- cade that resulted in 4,400 sign-ups to the team’s Web site within 48 hours. Analysis of the diffusion revealed that the recursive incentive scheme may have played an important role in maximizing the speed and branching of the diffusion to limits above what is normally ob- served in viral propagation schemes [6–8]. More recently, the State Department’s Tag Challenge required competing teams to locate and photograph 5 target “thieves” (ac- tors) in 5 different cities in the US and Europe, based only on a mug shot released at 8:00am local time [9]. The targets were only vis- ible for 12 hours, and followed normal itineraries around the cities of Stockholm, London, Bratislava, New York City and Washington D.C. Our winning team located 3 of the five suspects using social media, without any of the team members being based in any of the target cities [10], demonstrating yet another example of time-critical social mobilization in tasks that require covering large geographies. Despite these numerous successes, we still have limited under- standing of the limits of technology-mediated mobilization. If we are to rely on social media to react to time-critical emergencies, it is important to understand the conditions under which they can be suc- cessful, and the risks of failure associated with them. A particular case, of highly practical importance, is to understand the extent to which we can expect to cover a certain geographical area in a given amount of time. For this, we must understand the complete statistical characterization of the population recruited, geographical area cov- ered, and completion time it takes for social mobilization to succeed in a particular task, as well as to quantify the likelihood of failure. This lack of understanding is especially prone to selection bias over few successful social mobilization strategies and may lead to inflated expectations of the reliability and efficacy of of these tech- niques [11, 12]. Yet it is beyond experimental capabilities to per- form randomized experimentation with large crowdsourcing chal- lenges (with notable exceptions emerging recently [13, 14]). Modeling efforts in the wake of the H1N1 and other global pan- demics have also provided a valuable insight into time sensitive hu- man dynamics on a large scale, via spatial simulation [15] or net- work based diffusion [16, 17]. In common with these efforts we model the interaction and connection of large numbers of agents, however we consider the propagation of a message which may be transmitted without direct physical proximity and generally shorter ‘incubation’ times leading to faster spreading. Thus the mechanism of ‘infection’ (recruitment) is independent of human mobility pat- terns [18–21], which in our case contribute only to the area searched. In this work, we build on recent results on social network struc- ture, information diffusion and urban economics, to elucidate the constraints that they pose on social mobilization. In particular, we conduct high-resolution simulations of the DARPA Network Chal- lenge. We obtain statistical characterizations of the population re- cruited, geography covered, and time to locate the 10 balloons, to- gether with their dependencies on the instrumental variables. Our results demonstrate, surprisingly, that the DARPA Network Challenge outcome is plausible, and thus it is not simply a fluke that can only be explained by the role of mass media. Having said that, the challenge lies at the limit of what time-critical social mobilization is capable of. Mobilization requires highly connected, highly active in- dividuals to be motivated to propagate the message to a large number of friends, and to mobilize people in distant locations, overcoming Reserved for Publication Footnotes www.pnas.org/cgi/doi/ PNAS Issue Date Volume Issue Number 1–10
Transcript
The limits of social mobilizationAlex Rutherford ∗, Manuel Cebrian † ‡, Sohan Dsouza ∗ , Esteban Moro §, Alex Pentland ¶, and Iyad Rahwan1 ∗ ‖
∗Computing & Information Science, Masdar Institute of Science and Technology, Abu Dhabi, UAE,†Department of Computer Science & Engineering, University ofCalifornia at San Diego, La Jolla, California, USA,‡NICTA, Melbourne, Victoria, Australia,§Department of Mathematics, Universidad Carlos III de Madrid, Madrid,Spain,¶Media Laboratory, Massachusetts Institute of Technology, Cambridge, Massachusetts, USA, and ‖School of Informatics, University of Edinburgh, Edinburgh,UK
Submitted to Proceedings of the National Academy of Sciences of the United States of America1To whom correspondence may be addressed. Email: [email protected]
The Internet and social media has enabled the mobilization oflarge crowds to achieve time-critical feats, ranging from map-ping crises in real-time, to organizing mass rallies, to conductingsearch-and-rescue operations over large geographies. Despitesignificant success, selection bias may lead to inflated expecta-tions of the efficacy of social mobilization for these tasks. Whatare the limits of social mobilization, and how reliable is it to op-erate at these limits? We build on recent results on the spatio-temporal structure of social and information networks, to eluci-date the constraints they pose on social mobilization. We usethe DARPA Network Challenge as our working scenario, in whichsocial media was used to locate 10 balloons across the UnitedStates. We conduct high-resolution simulations for referral-basedcrowdsourcing and obtain a statistical characterization of the pop-ulation recruited, geography covered, and time to completion.Our results demonstrate that the outcome is plausible withoutthe presence of mass media, but lies at the limit of what time-critical social mobilization is capable of. Success relies criticallyon highly connected individuals willing to mobilize people in dis-tant locations, overcoming the local trapping of diffusion in highlydense areas. Yet, even under these highly favorable conditions,the risk of unsuccessful search remains significant. These find-ings have implications on the design of better incentive schemesfor social mobilization. They also call for caution in estimating thereliability of this capability.
social mobilization | networks | search
The Internet and online social media are now credited with theunprecedented ability to coordinate the mobilization of large massesof people to achieve incredible feats that require coverage of large ge-ographical and informational landscapes in very limited time. Socialmedia has been used to mobilize volunteers to map natural disastersin real-time [1], and to conduct large-scale search-and-rescue mis-sions [2]. Online social networks have also been an important tool inthe coordination of mass political rallies [3, 4].
Endeavors like the DARPA Network Challenge [5] aimed to testthe power of the Internet and social media in time-critical social mo-bilization to its absolute limits. The Network Challenge requiredcompeting teams to locate and submit the coordinates of 10 tetheredweather balloons dispersed at random locations all over the continen-tal United States. The winning team, based at MIT, won the challengeby locating all balloons in less than 9 hours. The MIT team used anincentive scheme to kick start an information and recruitment cas-cade that resulted in 4,400 sign-ups to the team’s Web site within 48hours. Analysis of the diffusion revealed that the recursive incentivescheme may have played an important role in maximizing the speedand branching of the diffusion to limits above what is normally ob-served in viral propagation schemes [6–8].
More recently, the State Department’s Tag Challenge requiredcompeting teams to locate and photograph 5 target “thieves” (ac-tors) in 5 different cities in the US and Europe, based only on a mugshot released at 8:00am local time [9]. The targets were only vis-ible for 12 hours, and followed normal itineraries around the citiesof Stockholm, London, Bratislava, New York City and WashingtonD.C. Our winning team located 3 of the five suspects using socialmedia, without any of the team members being based in any of the
target cities [10], demonstrating yet another example of time-criticalsocial mobilization in tasks that require covering large geographies.
Despite these numerous successes, we still have limited under-standing of the limits of technology-mediated mobilization. If weare to rely on social media to react to time-critical emergencies, it isimportant to understand the conditions under which they can be suc-cessful, and the risks of failure associated with them. A particularcase, of highly practical importance, is to understand the extent towhich we can expect to cover a certain geographical area in a givenamount of time. For this, we must understand the complete statisticalcharacterization of the population recruited, geographical area cov-ered, and completion time it takes for social mobilization to succeedin a particular task, as well as to quantify the likelihood of failure.
This lack of understanding is especially prone to selection biasover few successful social mobilization strategies and may lead toinflated expectations of the reliability and efficacy of of these tech-niques [11, 12]. Yet it is beyond experimental capabilities to per-form randomized experimentation with large crowdsourcing chal-lenges (with notable exceptions emerging recently [13, 14]).
Modeling efforts in the wake of the H1N1 and other global pan-demics have also provided a valuable insight into time sensitive hu-man dynamics on a large scale, via spatial simulation [15] or net-work based diffusion [16, 17]. In common with these efforts wemodel the interaction and connection of large numbers of agents,however we consider the propagation of a message which may betransmitted without direct physical proximity and generally shorter‘incubation’ times leading to faster spreading. Thus the mechanismof ‘infection’ (recruitment) is independent of human mobility pat-terns [18–21], which in our case contribute only to the area searched.
In this work, we build on recent results on social network struc-ture, information diffusion and urban economics, to elucidate theconstraints that they pose on social mobilization. In particular, weconduct high-resolution simulations of the DARPA Network Chal-lenge. We obtain statistical characterizations of the population re-cruited, geography covered, and time to locate the 10 balloons, to-gether with their dependencies on the instrumental variables.
Our results demonstrate, surprisingly, that the DARPA NetworkChallenge outcome is plausible, and thus it is not simply a fluke thatcan only be explained by the role of mass media. Having said that, thechallenge lies at the limit of what time-critical social mobilization iscapable of. Mobilization requires highly connected, highly active in-dividuals to be motivated to propagate the message to a large numberof friends, and to mobilize people in distant locations, overcoming
Reserved for Publication Footnotes
www.pnas.org/cgi/doi/ PNAS Issue Date Volume Issue Number 1–10
the local trapping of diffusion in highly dense areas. Moreover, evenunder highly favorable conditions, the risk of mobilization failure re-mains significant. These findings have implications on the design ofbetter incentive schemes for social mobilization. They also call forcaution in estimating the reliability of this capability.
Simulation ModelIn seeking to understand social mobilization we must consider themany different dynamics that underpin such a process; in particu-lar the branching dynamics of recruitment, the temporal dynamicsof message propagation, the geographical spread of social networks,and the scales and aspects of human mobility. A full accountabilityof each process will render the simulation and its understanding im-possible and thus we concentrate on the main ingredients that explainthe observed behavior in each of the processes.
Recruitment. Examination of the dynamics of the branching recruit-ment process in empirical data from the challenge [6] suggests sev-eral key features. After a large initial round of recruitment from theseed node, the reproductive number is well below the tipping point(see SI Appendix). Thus a large number of sub-trees are first createdspreading from the root node which then steadily die out. In orderto describe the typical branching recruitment process, we fit to theobserved branching data assuming an atypical burst of recruitmentwhen the search commences. We find a power law distribution witha mean 〈Ro〉 = 0.89. (See Materials and Methods for details of fit).
Response Time. The importance of the heterogeneity in responsetimes in viral recruitment processes has been demonstrated [22]. Ina study of a viral email campaign, the time taken to forward a mes-sage was found to be log-normally distributed as opposed to the com-monly used Gaussian assumption, with a mean of 1.5 days with astandard deviation of 5.5 days. This large heterogeneity has a deepimpact on the propagation of information: cascade dynamics maybe halted by the few individuals with very long response times andthus recruitment events may continue up to the order of years afterthe seed node starts the cascade. The waiting time distribution in atime-critical campaign such as the DARPA Network Challenge mightdiffer fundamentally since it must necessarily end by a fixed deadlineregardless of whether the campaign is successful or not. Howeverwe use the distribution of [22] as a reasonable approximation. Wedo not apply a cut-off at large times, although the tail of the distribu-tion may be effectively truncated since a search may terminate if allballoons are found before recruits with waiting times drawn from thetail of the distribution are able to act. The role of burstiness in diffu-sion in temporal networks was investigated systematically in [23] bycharacterising tie strength due to both topological and temporal char-acteristics. Paradoxically, burstiness was found to promote efficientdiffusion at small scales but to hinder it on large scales.
Geography of Ties. Several studies have been made of geographi-cal scaling laws for friendship [24–26]. Liben-Nowell et al analyseda blogging network and the relationship between friendship and dis-tance. They concluded that friendship correlates more strongly with aperson’s rank, a measure of the number of closer people, than simplywith the distance between people [27].
Pij ∝1∑
k:rik<rijpk
[1]
Where Pij is the probability of friendship between agents in twodistinct grid cells i and j, pk is the population in cell k and rik isthe distance from cell i to cell k. The quantity on the right hand sideis the rank of an agent in i with respect to agent in j, it is a measureof the number of people located between i and j. Thus the spatialdistribution of a person’s friends is now strongly dependent on the
local population density; with the effect that two people separated bya given large distance are more likely to be friends in a rural regionthan a dense, urban environment. It was also noted that friends couldbe classified into two distinct types; firstly rank-based friends chosendue to geographical proximity (i.e. sharing a common workplace)in accordance with rank scaling. They also observed a ‘background’probability that an agent may be friends with any other randomlychosen agent from across the country, in this case friendships are in-dependent of geography. Further, these two types of friends werefound to exist in a ratio of 2.5 distance independent friendships to5.5 rank-based friendships among the user average of 8 friends. Inour simulation, we apply this model of friendship to high-resolutionpopulation density data derived from census data [28] (see Materialsand Methods).
Passive Recruitment. In addition to the branching, temporal andfriendship mechanisms above, we investigate the role of two othermechanisms: passive recruitment, and mobility. We describe these inturn below. The data collected during the DARPA network challengerecorded each person who officially registered with the MIT team al-lowing them to recruit others and to report findings. However thisis only a subset of all the people who became aware of the search;the record of sign-ups gives a measure of the number of new recruitswhich each individual successfully invites, but not the larger hiddennetwork of individuals who search but do not sign-up or recruit oth-ers. We refer to this process as passive recruitment, quantified bythe number of passive recruits per individual npass. There was aconsiderable number of single nodes reporting findings directly; sep-arate from any recruitment tree (5 of the 10 balloons were reported inthis way). The reported traffic to the MIT team’s website of 100,000individuals given only 4,400 signups is further evidence of an un-reported, hidden network. This suggests that in addition to the ob-servable chain of individuals which actively recruit others after be-ing recruited themselves, there is a supplementary process wherebyindividuals become aware of the search, and the associated incen-tives and will report any balloons in their vicinity, yet are not suf-ficiently motivated to recruit others. This may be due to low affin-ity with the potential parent node from which they became aware ofthe search [29–31]. The effect of mass media and possibly word ofmouth would also manifest itself in a similar way. By definition theparticipation of these individuals is difficult to measure unless theyreport a balloon, but given the large number of submissions attributedto single nodes which were not part of a recruitment chain, we expectthat a sizable number of passive recruits were also participating in thesearch. This process gives rise to an interesting multiplicative factor,separate from the exponential growth of recruits due to branching.
While the number of passive recruits a person is able to mobi-lize is intrinsically hard to quantify, a good measure of this number isthe number of friends of a user of a typical social networking servicesuch as Facebook. The average degree of the entire global networkis around 200 with a large range, but it is observed to be up to 400amongst the most active users [32]. It is these users which have beenobserved to drive such viral recruitment processes [22]. As discussedin the SI Appendix, we study this parameter for a wide range of pas-sive recruits: however, since we aim to test the behavior of successfulsocial mobilizations we set it to that upper limit of 400 friends. Notealso that maintaining a large social network requires a high level ofactivity [32]. Thus, by selecting this level of passive recruitment weensure that those users are also the most “temporally active” popula-tion.
Mobility. Census data provides a record of where individuals live, butlimiting an individual’s effective search area to their home ignorestheir ability to search their vicinity due to their mobility. Due to thehigh resolution of the simulations (1km2), it is fair to expect that re-cruits will instantaneously find a balloon in their own cell. Howeverit is likely that agents will be mobile during the course of a search al-
2 www.pnas.org/cgi/doi/ Footline Author
lowing them to locate balloons in nearby cells. We quantify this witha radius of gyration (rmob). The realistic modeling of individual mo-bility patterns on short timescales (≈ 101hours) is non-trivial. Thesepatterns have a proven seasonal nature due to commuting patterns,Circadian rhythms [33] and friendship [34], but an exact individualagent-scale model would require a complex probabilistic treatmentand to account for differences in mobility between rural and urbanareas [35] putting it beyond the scope of this model. Therefore we de-fine a fixed mobility radius allowing agents to locate balloons withina neighborhood of size rmob. The radius of gyration has been inves-tigated extensively using mobile phone data, although typically thesestudies have focused on the statistical properties of mobility over thecourse of weeks and months. However a recent study found that ontimescales appropriate for time-critical social mobilization (i.e. up to12 hours) radii of gyration reached 1-2km [36], with a large range.Since a large spread in radii around the mean is expected on thistimescale, we also investigate radii in the range 0-5km in our sim-ulations. This parameter also assimilates other mechanisms such asrecruited agents becoming aware of a balloon via face-to-face, wordof mouth communication.
In light of recent results which find a variability in mobility ra-dius with respect to rank [37] and population density [38], we inves-tigate a variable mobility radius in inverse proportion to local popu-lation density (see SI Appendix). Despite the number of passive re-cruits being unknown, it is likely that the number of passive recruitswould follow a distribution since the number of active recruits in thebranching recruitment process demonstrated a large range. Thereforewe also investigate the affect of a distribution of passive recruits. Ourfindings are insensitive to the introduction of both a variable mobilityradius and a distribution of passive recruits, see SI Appendix.
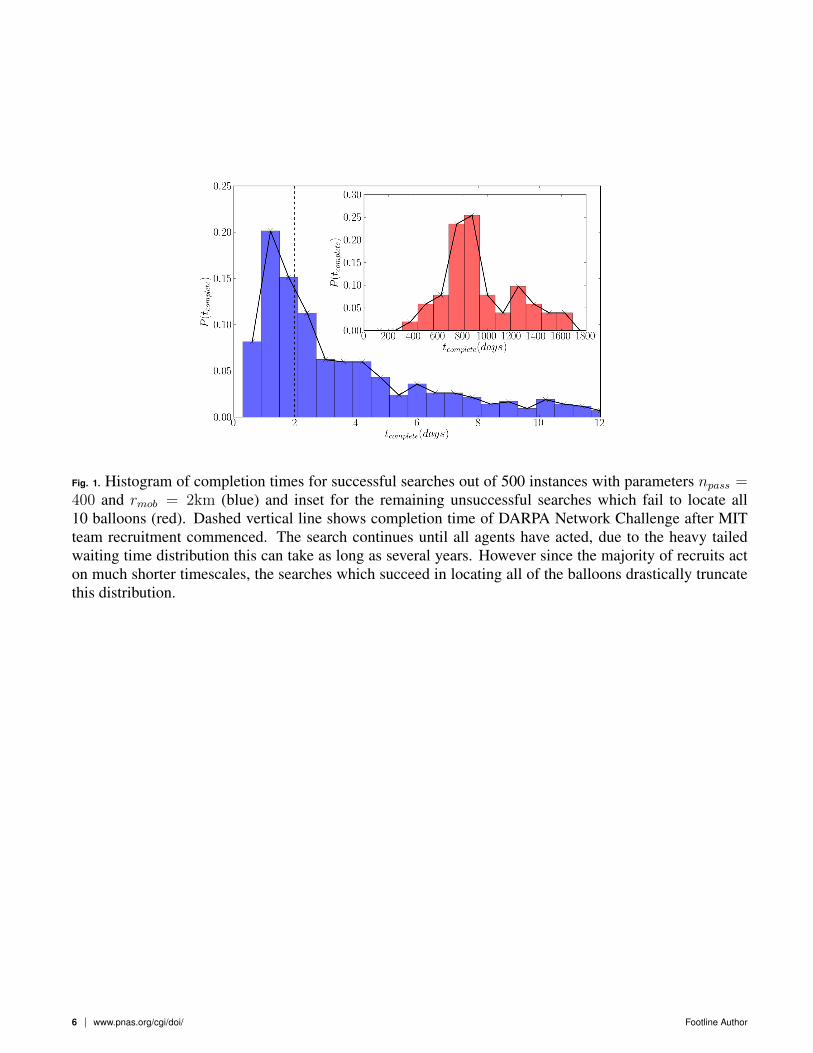
ResultsDARPA Balloon Challenge Feasibility. We conducted 500 searchesfor the 10 DARPA network challenge balloon locations using pa-rameters of rmob = 2km and npass = 400. We find a successrate of 89%. A large variation is seen in completion times (Fig (1)main plot), however the median completion time amongst successfulsearches was 2.3 days demonstrating a remarkable agreement withthe observed time of 48 hours between beginning recruitment andcompletion [6]. The combined effect of the heavy tailed distributionfor branching factor and large heterogeneity in response time givesrise to a large spread in the time for the pure branching process to ter-minate [22]. Successful searches terminate upon completion whichnaturally leads to a completion time distribution which is truncatedwith respect to the underlying distribution of termination times ofthe pure branching process. It is against this ‘natural’ range of ter-mination times of the branching (inset of Figure (1)) that the trun-cated distribution of completion times for successful search must becompared. The full range of parameters is investigated in the SI Ap-pendix. We find that minimum values for mobility radius and passiverecruits of 2km and 200 respectively are required for a reasonablelevel of success.
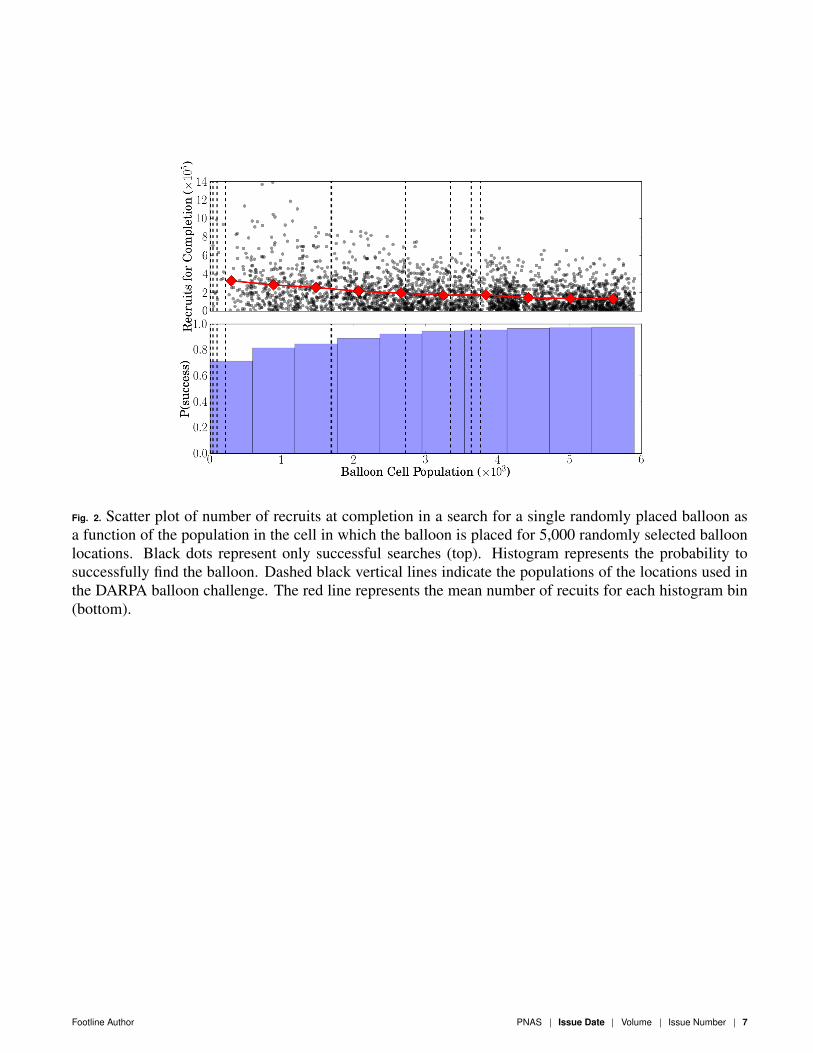
General Balloon Locations. We investigate the hypothesis that thespecific balloon locations chosen in the DARPA balloon challengecontributed positively to the speed with which the balloons werefound. We randomly choose cells uniformly sampling a large rangeof population. Further, we simulate the search for a single balloon ineach simulation in order to clearly isolate the effect of balloon loca-tion on the number of recruits needed to locate it. Figure (2) shows aplot of the number of recruits needed to locate a balloon as a functionof the population density of the balloon cell. While the plot containssome noise, there is a clear trend both that balloons in sparsely pop-ulated areas require significantly more people to find, and are less
likely to be found at all, compared to those in well populated areas.This is due to a combination of effects, a cell containing fewer po-tential recruits will more likely be searched at a later time. Howeverthis is exacerbated by the fact that the population is far from homo-geneously distributed, demonstrating strong spatial auto-correlation(see SI Appendix). Rather a sparsely populated cell is likely to besurrounded by other sparsely populated cells, thus there are consid-erably less opportunities for recruitment into that cell from its neigh-bors. Conversely, well populated cells in urban areas experience theopposite effect. We have highlighted the extent to which a balloonbecomes more easily found as it is moved to a location with higherdensity. In this context it can be seen that a few of the chosen bal-loon locations were in challenging locations, but that overall successis expected.
Searchabilty, Blendability, and Findability. In order to draw moregeneral conclusions about the probability of searching a location, wemove away from the specific balloon locations. We can now measurethe ease with which every single cell may be searched over the courseof many different search realisations. With this in mind, we map thesearchability (s) of each cell i as
si =nsearchedi
N, [2]
where nsearchedi is the number of instances in which someone is re-
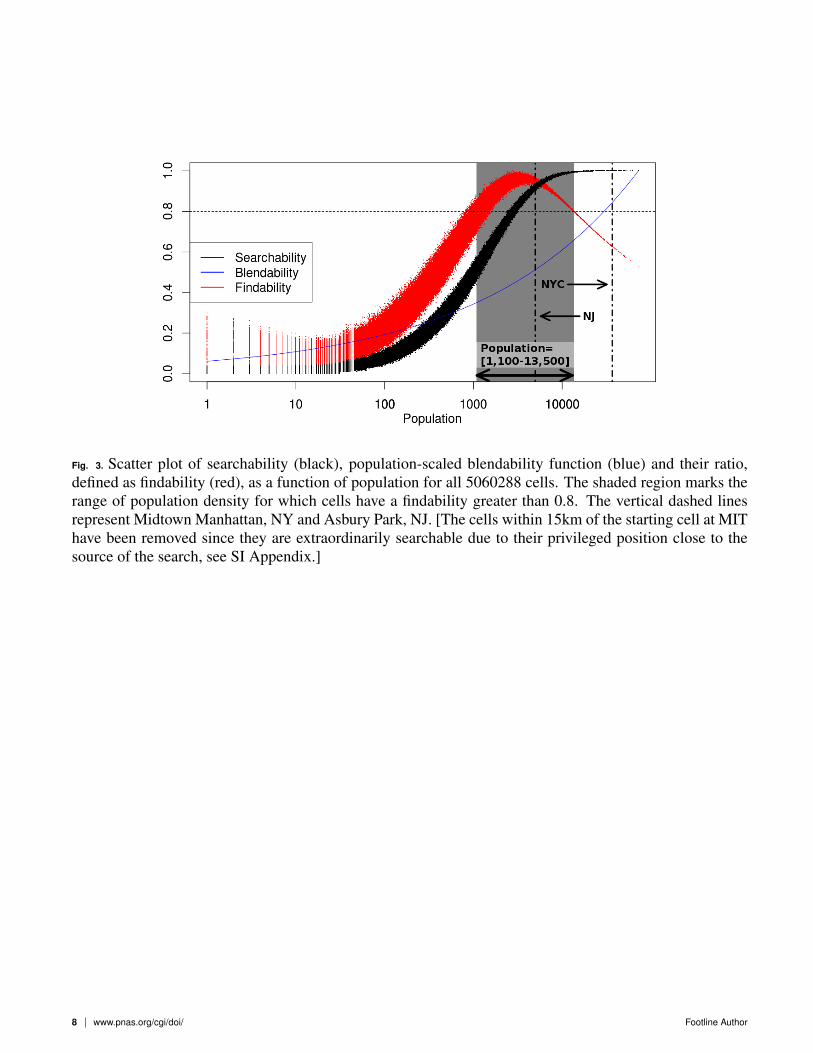
cruited in cell i out of N searches (N = 10, 000 for the followingresults). We see (Fig. (3)) that cells located in dense metropolitan ar-eas are easily searchable as there are many more potential searchersto recruit in those cells, whereas the opposite is true for sparsely pop-ulated areas. Figure (3, black points) demonstrates this saturatingtrend above cell population ≈ 104km−2. This is far from a linearmapping, as some places are highly searchable despite having onlyintermediate population. Adding more people to a cell located in asmall town increases the searchability a great deal, however the pay-off for adding more people to a cell in a large city is negligible.
Intuitively, we could also expect an added difficulty in locatinga target in a region of high population density such as Manhattan,despite its density-driven high searchability. We model this difficultyto successfully locate a target at a given place by the blendabilitybi of a cell i. There are (at least) two distinct sources for this dif-ficulty. Firstly as a characteristic of the city itself: The increaseddensity leads to increased complexity of the physical urban environ-ment [45–47] providing more possibilities for a target to be concealed(e.g. an adobe house in Santa Fe, New Mexico vs. a skyscraper inManhattan). The other contributor to the degree of blendability ofa location comes from the individual perspective: sensory overloadin busy places, leading to inattentional blindness [39–41], dimin-ished feelings of individual responsibility to report sightings in largecrowds [42, 43], and/or reduced cognitive processing ability due tostress [44]. In all the above cases we can safely infer that the largerthe population of a cell pi, the larger its blendability bi. We assumethat bi ∼ pβi similar to how other urban indicators scale with popula-tion [48, 49]; e.g. wages and crime with β = 1.25. We also considerwalking speed with β = 1 in SI Appendix.
Thus, if we define the blendability per person we obtain
bi =pβipi
= pβ−1i , [3]
and we rescale {bi} to lie in the range [0, 1].The tension between the searchability and blendability of places
is modeled by the findability per cell i
fi =si
bi[4]
Again we scale {fi} to be in the range [0, 1], and plot equation [4]as the red points in Figure (3) for β = 1.25 (we repeat the analysis
Footline Author PNAS Issue Date Volume Issue Number 3
using β = 1 in the SI). We isolate a regime of high findability definedby a value greater than 0.8, which corresponds to the grey shaded re-gion, with a population density in the range of [1,100 - 13,500km−2].We emphasise that the exact findability threshold is not important asthe blendability is only defined up to a constant. Comparing Mid-town Manhattan (population density 36,627km−2) with nearby As-bury Park, New Jersey (population density 4,975km−2) we see (Fig-ure 3) that, counterintuitively, it may be easier to hide in the formerthan in the latter. The origin of this result is that if β ≥ 1, then fora large pi the rate at which searchability increases with population isinsufficient to overcome the rate at which blendability increases withpopulation, and thus the findability is maximized in places of inter-mediate density (this happens when b is an increasing function of pi;a detailed derivation of the condition for β to display this behaviorcan be found in SI Appendix).
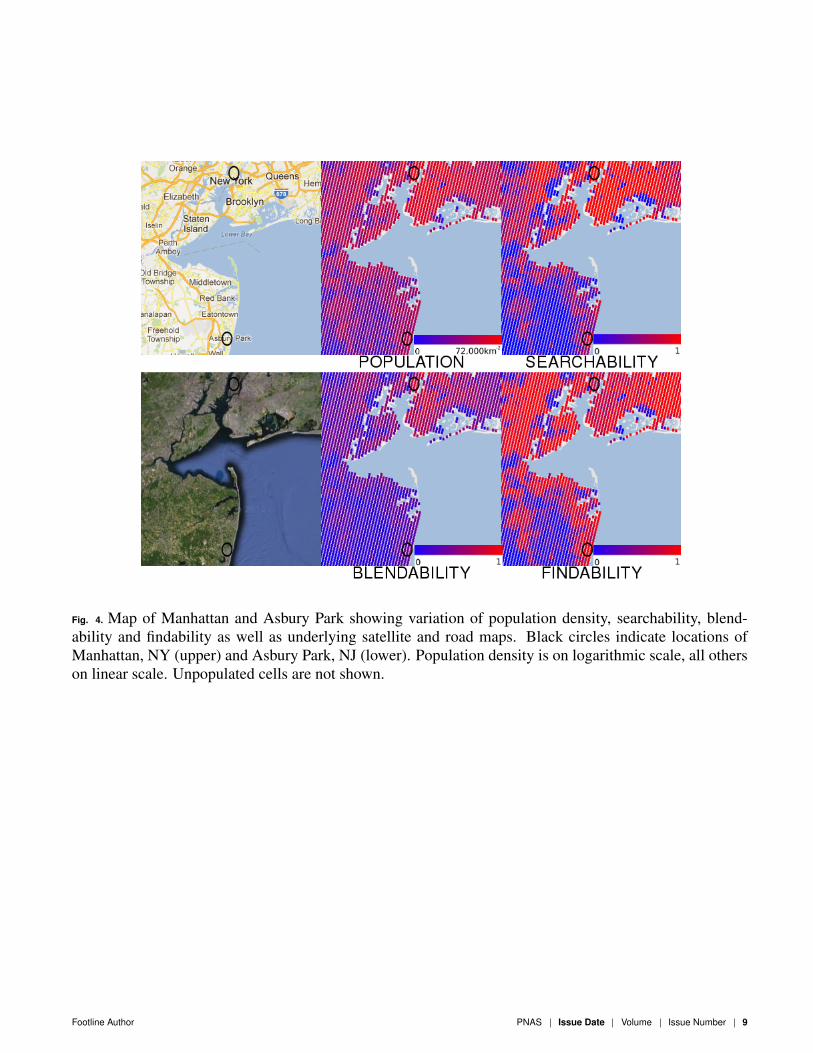
Finally in Figure (4) we visualise the variation of the searcha-bility, blendability and findability in the vicinity of Manhattan andAsbury Park (see SI Appendix for a full map of the continental US).Manhattan has extremely high population density (strong red shad-ing in upper circle), leading to high searchability. However this isagain counteracted by a very high blendability resulting in a rela-tively lower findability than intuitively expected (medium shading infindability map). In contrast the intermediate population density inAsbury Park leads to a fairly high searchability (medium shading inlower circle). But since the blendability is very low (blue shading ofblendability map) the findability is very high. In general it can beseen that areas of intermediate population have high findabilities.
DiscussionOur goal is to understand the practical limits of time-critical socialmobilization, and to do so in light of contemporary wisdom about thefactors that may affect it: the structure and geographical distributionof social ties, the branching and temporal dynamics of informationdiffusion via social media, and urban economics. Where possible,we used parameters measured from large-scale empirical results, inorder to create a realistic, high-resolution simulation of a mobiliza-tion scenario akin to the DARPA Network Challenge.
The popular reaction to the DARPA Network Challenge was thatit would be impossible without mass media. Our main finding is thatsuccess is actually expected with only social media and under real-istic parameters. Assuming an initial burst of motivated individuals,success takes place despite the branching factor being lower than thecritical point.
Having said that, we find two sobering and instructive qualifiers.Firstly, despite the average completion time coinciding with the expe-rience in the actual challenge, the long tail distribution of completiontime suggests that the risk of failing to locate the targets within ashort time-frame is also significant. The second important qualifieris that the challenge lies at the limits of what social mobilization isable to achieve. Success relies on all parameters being at their practi-cal limits: you need highly connected individuals to be motivated topropagate the message to a large number of friends, and to mobilizepeople in distant locations, overcoming the local trapping of diffusionin highly dense areas.
Our results have implications on the use of social mobilization toachieve time-critical tasks, like mapping crises in real-time, or con-ducting search-and-rescue operations over large geographies. Novelmobilization mechanisms need to focus on incentivizing those ele-ments of the network that are most conducive to successful mobiliza-tion: highly-connected people, with distant friends, and rapid reac-tion time. These characteristics can be exploited in a new measureof influence. One can envisage variants of the winning team’s re-cursive incentive strategy that provide network centrality, distanceand/or time-sensitive rewards to recruit such influentials.
We studied tension between the benefits and difficulties ofsearching for physical objects in highly populated areas by defin-
ing measures of searchability, blendability, and findability. On onehand, hiding in a sparsely populated town makes it less likely forsomeone from that town to be recruited to find the target. But assoon as someone gets recruited, identification becomes trivial. On theother hand, in a city with high density, one might be able to “blendinto the crowd.” Our results show that, short of hiding in the mid-dle of nowhere, one’s best bet is to hide in plain sight. The roleof human mobility in the context of blendability is not completelyclear, and certainly warrants further investigation using a more de-tailed treatment. Models of geographical ties and mobility shouldexplicitly account for variations in density. In particular the deviationfrom pure rank scaling [50], demonstrating the increased likelihoodof city-based users to have longer range ties.
It is worthwhile putting our work in the context of search in socialnetworks. Milgram’s landmark “small world” experiment showedthat people are, in principle, findable using 6 hops on the global socialnetwork [51], a result that has been reaffirmed in the Internet age [52].However, Milgram searchability relies on people’s ability to form areliable estimate of distance to the target, in order to exploit the largejumps afforded by small world networks [53–55]. For example, ifthe target is known to be a Professor residing in Kyoto, Japan, onemight send it to a friend who lives in Tokyo, Japan, as they are morelikely to know someone who lives in Kyoto, who in turn may knowsomeone in academia, and so on. But if information about a target isscarce (e.g. searching for a person in an entire country based only ona mug-shot), we cannot rely on distance estimates. In other words,the problem becomes that of uninformed (a.k.a. blind) search [56],and thus requires large-scale social mobilization. Having said that,endeavors like the Tag Challenge [57], in which search may benefitfrom partial knowledge of target location, require elements of bothuninformed and heuristic search, a topic that deserves further studyin the context of social mobilization.
Our work is not without limitations. First, we focused on mo-bilization processes that are fully driven by social ties. In reality,however, mobilization often also benefits from the use of mass media(e.g. AMBER Alert distributed via radio stations and cable Televi-sion) and social media hubs (e.g. highly followed blogs or Twitteraccounts). Surely, such media can accelerate social mobilization, asthey complement the social diffusion process and seed it over largeareas [58, 59]. Another limitation of our work is our use of a sim-ple model of human mobility. For a task like the Network Chal-lenge, this is unlikely to be a problem. However, for scenarios thatinvolve searching for mobile targets, as was the case in the Tag Chal-lenge [57], more sophisticated models of human mobility should beincorporated [33].
Materials and Methods
Materials. High resolution population data was taken from publicly availablesources [60] based on US census data [28]. This comprises 7,820,528 cellseach with an area of 1km2, of which 5,060,288 are populated (i.e. 2,760,240 areempty). Empirical data from [6] was used to parameterise the branching factorpower law distribution as follows. We exclude the first generation of recruitmentdirectly from the MIT team, as this is anomalously high (164 child recruits) anddue to the team’s own unique personal association with the task, likely to beatypical. We also exclude 611 single nodes which signed up directly and didnot recruit any child nodes, we assume that these are examples of passive re-cruits which signed up independently. The distribution of the branching factoramong a subset of the remaining nodes is described by a power law with mean〈Ro〉 = 0.89 (See SI Appendix).
Methods.
A set of seed nodes located at MIT is chosen; the number of which matchesthose initially recruited by the MIT Media Lab team. All of these nodes are activei.e. they continue to recruit themselves in contrast to passive recruits which donot continue the recruitment tree. Each newly activated node looks around in itsvicinity (within a distance radius of rmob) and reports any balloon that it sees
4 www.pnas.org/cgi/doi/ Footline Author
within that radius. Each newly activated node also chooses an outdegree (a con-stant number npass of ‘passive’ recruits, and a power-law-distributed numberna of ‘active’ recruits, where npass is drawn from the distribution seen in theMIT Red Balloon team’s recruitment data). Each chosen friend, passive or active,is chosen to be rank-based with respect to geography, using 1km2 populationdensity data across the U.S.) with probability 5.5/8, and uniform over populationwith probability 2.5/8. Each active new recruit selects a delay, chosen from a log-normally distributed waiting time distribution with mean 1.5 days and standard
deviation 5.5 days [22] and becomes activated and completes its own recruitmentafter that time delay.
ACKNOWLEDGMENTS. We thank Wei Pan for assistance with DARPA BalloonChallenge data, Galen Pickard for useful comments, and Mohammed Mekkiasfor support with HPC resources. Manuel Cebrian acknowledges support from theNational Science Foundation under grant 0905645, from DARPA/Lockheed Mar-tin Guard Dog Program under PO 4100149822, and the Army Research Officeunder Grant W911NF-11-1-0363.
1. Okolloh O (2009) Ushahidi or ‘testimony’: web 2.0 tools for crowdsourcing crisisinformation. Participatory Learning and Action 59(1):65–70.
2. Hellerstein J, Tennenhouse D (2011) Searching for Jim Gray: a technical overview.Communications of the ACM 54:77–87.
3. Gonzalez-Bailon S, Borge-Holthoefer J, Rivero A, Moreno Y (2011) The dynamics ofprotest recruitment through an online network. Scientific reports 1, 197.
4. Ghonim W (2012) Revolution 2.0: The Power of the People Is Greater Than thePeople in Power (Houghton Mifflin Harcourt).
5. Tang J, et al. (2011) Reflecting on the DARPA Red Balloon Challenge. Communica-tions of the ACM 54:78–85.
6. Pickard G, et al. (2011) Time-critical social mobilization. Science 334:509–512.7. Cebrian M, Coviello L, Vattani A, Voulgaris P (2012) Finding red balloons with split
contracts: Robustness to individual’s selfishness. Proceedings of the ACM Sym-posium on Theory of Computing pp. 775-788.
8. Naroditskiy V, Rahwan I, Cebrian M, Jennings N (2012) Verification in referral-basedcrowdsourcing. PLoS ONE 7:e45924.
9. (2012) Six degrees of mobilisation. Economist: Technology Quarterly .10. Rahwan I, et al. (2013) Global manhunt pushes the limits of social mobilization.
IEEE Computer (In press) .11. Golub B, Jackson M (2010) Using selection bias to explain the observed structure
of internet diffusions. Proceedings of National Academiy of Science of the UnitedStates of America 107:10833.
12. Bakshy E, Hofman J, Mason W, Watts D (2011) Everyone’s an influencer: quantify-ing influence on twitter. In Proceedings of the fourth ACM international conferenceon Web search and data mining (ACM), pp. 65–74.
13. Bond RM, et al. (2012) A 61-million-person experiment in social influence and po-litical mobilization. Nature 489:295–298.
14. Aral S, Walker D (2012) Identifying influential and susceptible members of socialnetworks. Science 337:337–341.
15. Epstein J (2009) Modeling to contain pandemics. Nature 460(7256), 687–687.16. Barthelemy M, Barrat A, Pastor-Satorras R, Vespignani A (2004) Velocity and hi-
erarchical spread of epidemic outbreaks in scale-free networks. Physical ReviewLetters 92:178701.
17. Wang P, Gonzalez MC, Hidalgo CA, Barabasi AL (2009) Understanding the spreadingpatterns of mobile phone viruses. Science 324:1071–1076.
18. Balcan D, et al. (2009) Multiscale mobility networks and the spatial spreading of in-fectious diseases. Proceedings of the National Academy of Sciences of the UnitedStates of America 106:21484.
19. Balcan D, et al. (2009) Commuting and pandemic prediction. Proceedings of Na-tional Academy of Science of United States of America 106:21459.
20. Nicolaides C, Felguerso L and Gonzalez GM (2011) A metric of influential spreadingduring contagion dynamics through the air transport network. PLoS ONE 7:40961.
21. Brockman D, Hufnagel L and Geisel T (2006) The scaling laws of human travel.Nature 439:462–465.
22. Iribarren JL, Moro E (2009) Impact of Human Activity Patterns on the Dynamics ofInformation Diffusion. Physical Review Letters 103:038702.
23. Miritello G, Moro E, Lara R (2011) Dynamical strength of social ties in informationspreading. Phys Rev E 83:045102.
24. Krings J, Calabrese F, Ratti C, Blonde V (2009) Urban gravity: A model for inter-citytelecommunication flows. Journal of Statistical Mechanics.
25. Ratti C, et al. (2010) Redrawing the map of great britain from a network of humaninteractions. PLoS ONE 5:e14248.
routing in social networks. Proceedings of the National Academy of Sciences102:11623–11628.
28. Bureau USC (2001), Census 2000: Census Tract Cartographic Boundary Files - U.S.Census Bureau. , [Online; accessed 3-September-2012].
29. Watts D, Dodds P, Newman M (2002) Identity and search in social networks. Science296:1302–1305.
30. Dodds P, Muhamad R, Watts D (2003) An experimental study of search in globalsocial networks. Science 301:827–829.
31. Iribarren JL, Moro E (2011) Affinity paths and information diffusion in social net-works. Social networks 33.2 (2011): 134-142.
32. Ugander J, Karrer B, Backstrom L, Marlow C (2011) The anatomy of the facebooksocial graph. arXiv preprint arXiv:1111.4503.
33. Gonzalez MC, Hidalgo CA, Barabasi AL (2008) Understanding individual humanmobility patterns. Nature 453:779–782.
34. Cho E, Myers S, Leskovec J (2011) Friendship and mobility: User movement inlocation-based social networks. Proceedings of the 17th ACM International Confer-ence on Knowledge Discovery and Data Mining :1082.
35. Noulas A, Scellato S, Lambiotte R, Pontil M, Mascolo C (2012) A tale of two cities:Universal patterns in human urban mobility. PLoS ONE 7.
36. Bagrow J, Lin Y (2012) Spatiotemporal features of human mobility. Arxiv preprintarXiv:12020224 .
37. Noulas A, Scellato S, Lambiotte R, Pontil M, Mascolo C (2012) A tale of many cities:Universal patterns in human urban mobility. PLoS ONE 7:e37027.
38. Phithakkitnukoon S, Smoreda Z, Olivier P (2012) Socio-geography of human mobil-ity: A study using longitudinal mobile phone data. PLoS ONE 7:e39253.
39. Mack A, Rock I (1998) Inattentional blindness (MIT press Cambridge, MA).40. Most S, et al. (2001) How not to be seen: The contribution of similarity and selective
ignoring to sustained inattentional blindness. Psychological Science 12:9–17.41. Miller G (1956) The magical number seven, plus or minus two: some limits on our
capacity for processing information. Psychological review 63:81.42. Milgram S (1970) The experience of living in cities. Science 167:1461–1468.43. Darley J, B Latane (1968) Bystander intervention in emergencies: Diffusion of re-
sponsibilities. Journal of the Learning Sciences 8:377–383.44. Lederbogen F, et al. (2011) City living and urban upbringing affect neural social
stress processing in humans. Nature 474:498.45. Rapoport A, Hawkes R (1970) The perception of urban complexity. Journal of the
American Institute of Planners 36:106–111.46. Rosvall M, Trusina A, Minnhagen P, Sneppen K (2005) Networks and cities: An
information perspective. Physical Review Letters 94:28701.47. Lee S, Holme P (2012) A greedy-navigator approach to navigable city plans. Arxiv
preprint arXiv:12050537.48. Bettencourt L, Lobo J, Helbing D, Kuhnert C, West G (2007) Growth, innovation,
scaling, and the pace of life in cities. Proceedings of the National Academy ofSciences 104:7301.
49. Bornstein M, Bornstein H (1976) The pace of life. Nature 259, 557-559.50. Backstrom L, Sun E, Marlow C (2010) Find me if you can: improving geographical
prediction with social and spatial proximity. In Proceedings of the 19th internationalconference on World wide web (ACM, New York, NY, USA), WWW ’10, pp. 61–70.
51. Milgram S (1967) The small world problem. Psychology Today 61:60–67.52. Dodds PS, Muhamad R, Watts DJ (2003) An experimental study of search in global
social networks. Science 301:827–829.53. Kleinberg J (2000) Navigation in a small world. Nature 406(6798), 845–845.54. Kleinberg J (2000) The small-world phenomenon: an algorithm perspective. In Pro-
ceedings of the thirty-second annual ACM symposium on Theory of computing(pp.163–170
55. Adamic LA, Adar E (2005) How to search a social network. Social Networks 27:187–203.
56. Knuth D, et al. (1973) Sorting and Searching, The Art of Computer Programming,vol. 3 (Addison-Wesley, Reading, Massachusetts).
57. Firth N (2012) Social media web snares ’criminals’. New Scientist 2860:18.58. Crane R, Sornette D (2008) Robust dynamic classes revealed by measuring the re-
sponse function of a social system. Proceedings of National Academy of Sciences41:15649–15653.
59. Myers SA, Zhu C, Leskovec J (2012) Information diffusion and external influencein networks. In Proceedings of the 18th ACM SIGKDD international conference onKnowledge discovery and data mining pp. 33-41.
60. Center NNCD (2008), Gridded 1 km Population for the Conterminous United States.[Online; accessed 3-September-2012].
Footline Author PNAS Issue Date Volume Issue Number 5
Fig. 1. Histogram of completion times for successful searches out of 500 instances with parameters npass =400 and rmob = 2km (blue) and inset for the remaining unsuccessful searches which fail to locate all10 balloons (red). Dashed vertical line shows completion time of DARPA Network Challenge after MITteam recruitment commenced. The search continues until all agents have acted, due to the heavy tailedwaiting time distribution this can take as long as several years. However since the majority of recruits acton much shorter timescales, the searches which succeed in locating all of the balloons drastically truncatethis distribution.
6 www.pnas.org/cgi/doi/ Footline Author
Fig. 2. Scatter plot of number of recruits at completion in a search for a single randomly placed balloon asa function of the population in the cell in which the balloon is placed for 5,000 randomly selected balloonlocations. Black dots represent only successful searches (top). Histogram represents the probability tosuccessfully find the balloon. Dashed black vertical lines indicate the populations of the locations used inthe DARPA balloon challenge. The red line represents the mean number of recuits for each histogram bin(bottom).
Footline Author PNAS Issue Date Volume Issue Number 7
Fig. 3. Scatter plot of searchability (black), population-scaled blendability function (blue) and their ratio,defined as findability (red), as a function of population for all 5060288 cells. The shaded region marks therange of population density for which cells have a findability greater than 0.8. The vertical dashed linesrepresent Midtown Manhattan, NY and Asbury Park, NJ. [The cells within 15km of the starting cell at MIThave been removed since they are extraordinarily searchable due to their privileged position close to thesource of the search, see SI Appendix.]
8 www.pnas.org/cgi/doi/ Footline Author
Fig. 4. Map of Manhattan and Asbury Park showing variation of population density, searchability, blend-ability and findability as well as underlying satellite and road maps. Black circles indicate locations ofManhattan, NY (upper) and Asbury Park, NJ (lower). Population density is on logarithmic scale, all otherson linear scale. Unpopulated cells are not shown.
Footline Author PNAS Issue Date Volume Issue Number 9