32
THE LINDSELL TRAIN INVESTMENT TRUST PLC Half-year Report for the six months ended 30 September 2020

THE LINDSELL TRAININVESTMENT TRUST PLC
Half-year Report for the six months
ended 30 September 2020

THE LINDSELL TRAIN INVESTMENT TRUST PLC
29
Perivan 259664
THE LINDSELL TRAIN INVESTMENT TRUST PLC
THE LINDSELL TRAIN INVESTMENT TRUST PLC
1
Contents
Page
Financial Highlights 2
Investment Objective 2
Investment Policy 2
Performance 3
Chairman’s Statement 4
Investment Manager’s Report 6
Income Statement 8
Statement of Changes in Equity 10
Statement of Financial Position 11
Cash Flow Statement 12
Notes to the Financial Statements 13
Interim Management Report 17
Portfolio Holdings 19
Analysis of Investment Portfolio 20
Appendix 1 – Half-year review of Lindsell Train Limited (“LTL”) 21
Appendix 2 – The Lindsell Train Investment Trust plc (“LTIT”) Directors’ Valuation
of LTL (unaudited) 23
Company Information 24
Glossary of Terms and Alternative Performance Measures 25

Investment Objective The objective of the Company is to maximise long-term total returns with a minimum objective to maintain the real purchasing power of Sterling capital.
Investment Policy The Investment Policy of the Company is to invest:
● in a wide range of financial assets including equities, unquoted equities, bonds, funds, cash and other financial investments globally with no limitations on the markets and sectors in which investment may be made, although there may be a bias towards Sterling assets consistent with a Sterling-dominated investment objective. The Directors expect that the flexibility implicit in these powers will assist in the achievement of the absolute returns that the investment objective requires;
● in Lindsell Train managed fund products, subject to Board approval, up to 25% of its gross assets; and
● in Lindsell Train Limited (“LTL”) and to retain a holding, currently 24.19%, in order to benefit from the growth of the business of the Company’s Investment Manager.
Diversification The Company expects to invest in a concentrated portfolio of securities with the number of equity investments averaging fifteen companies. The Company will not make investments for the purpose of exercising control or management and will not invest in securities of or lend to any one company (or other members of its group) more than 15% by value of its gross assets at the time of investment. The Company will not invest more than 15% of gross assets in other closed-ended investment funds.
Gearing The Directors have discretion to permit borrowings up to 50% of the Company’s Net Asset Value. However, the Directors have decided that it is in the Company’s best interests not to use gearing. This is in part a reflection of the increasing size and risk associated with the Company’s unquoted investment in LTL, but also in response to the additional administrative burden required to adhere to the full scope regime of the Alternative Investment Fund Managers Directive (“AIFMD”).
Dividends The Directors’ policy is to pay annual dividends consistent with retaining the maximum permitted earnings in accordance with investment trust regulations.
The composition of the portfolio as at 30 September 2020, which may be changed at any time at the discretion of the Investment Manager within the confines of the policy stated above, is shown on pages 19 to 20.
THE LINDSELL TRAIN INVESTMENT TRUST PLC
2
Financial Highlights Performance comparisons 1 April 2020 – 30 September 2020 Change
Share price total return per Ordinary Share*^ 13.0%
Net asset value total return per Ordinary Share*^ 21.0%
Benchmark† 2.0%
MSCI World Index total return (Sterling) 23.6%
UK RPI Inflation (all items) 0.6%
* The net asset value and the share price at 30 September 2020 have been adjusted to include the ordinary dividend of £41.39 per share and a special dividend of £2.61 per share paid on 8 September 2020, with the associated ex-dividend date of 13 August 2020.
† The annual average running yield of the longest-dated UK government fixed rate bond, currently UK Treasury 1.625% 2071, calculated using weekly data, plus a premium of 0.5%, subject to a minimum yield of 4%.
^ Alternative Performance Measure (‘APM’). See Glossary of Terms and Alternative Performance Measures beginning on page 25.
Source: Morningstar/Bloomberg

THE LINDSELL TRAIN INVESTMENT TRUST PLC
3
Performance
*Rebased to show the performance per £100 invested.The Closing price is adjusted for the dividend which went ex-dividend on 13 August 2020.
Apr May
Share price performance compared to the Benchmarkfrom 1 April 2020 to 30 September 2020
(based on total performance with reinvested net dividend)
Jun Jul Aug Sep
Closing Price*
Benchmark*
95
100
105
110
115
120
Apr
Share price performance and net asset value (’NAV’) per sharefrom 1 April 2020 to 30 September 2020
May Jun Jul Aug Sep
Daily Closing Price*
Weekly NAV per share*
Source: Bloomberg and Lindsell Train Limited.*The NAV per share and share price are unadjusted for the payment of the dividend.
£900
£950
£1,000
£1,050
£1,100
£1,150
£1,200
£1,250
£1,300

THE LINDSELL TRAIN INVESTMENT TRUST PLC
4
Chairman’s Statement
World stock markets recovered strongly over the six months to 30 September, with the MSCI World
Index up by 23.6% in Sterling terms. Having remained relatively resilient in the first quarter of the
calendar year when markets declined precipitately, the Company’s net asset value (‘NAV’) total return
of 21.0%^ failed to keep up with world markets over the subsequent six months, but exceeded its
benchmark return of 2%. The Company’s share price fared less well over the half-year, rising by 13.0%^
to £1,155, which represented a continued contraction in the share price premium from the heady levels
of mid last year, ending 30 September at 3.9%^.
The size of the investment in Lindsell Train Limited (‘LTL’) at 47.3% of NAV ensures it is almost bound
to be the most significant influence on returns in any period and this one was no exception. LTL was
once again the biggest positive contributor, with its valuation rising by 24.5%^ from its low point at
31 March 2020, reflecting LTL’s growth in funds under management (‘FUM’). Market movements were
the main impetus behind growing FUM, although net asset flows were also positive. These came
predominantly from US investors, with net inflows to Lindsell Train’s Delaware based Global Equity LLC
taking its assets to over $1bn, up from $384m at 31 March. Elsewhere LTL’s Japanese strategy assets
grew an encouraging 30%. LTL’s long term performance remains competitive even though over the
last six months other equity investors – particularly those with high weightings in technology companies
– will have done better, as Nick Train discusses in his Manager’s report.
In April LTL launched its first new fund since 2015, focused on investing in North American equities. It
represents a brand new strategy to add to UK, Global and Japan and in time it hopes that it will add
another leg to the business. The fund is managed by James Bullock (who joined Lindsell Train in 2010),
assisted by Madeline Wright (2012), providing them with the opportunity to manage a strategy with
complete autonomy. This is an important new initiative as it is the first fund at LTL to be run without
either founder being directly involved. The new fund has been seeded by LTL staff, LTL in-house capital
and a significant £12.5m cornerstone investment from your Company. It continues the symbiotic practice
since inception of the Company to use its capital to support LTL fund launches. To fund the new holding
we sold our remaining position in eBay as well as the entire holding in the LT Japan fund. This latter
holding was first acquired for much the same reasons in 2011. The capital committed increased in value
by 14.0% per annum over the history of the investment and, having given the fund critical mass in the
early days, LTL’s Japan Strategy has now grown to over £1bn in assets, amply demonstrating the benefits
of this symbiosis. LTL’s establishment of a US fund (a concentrated portfolio of 24 US businesses, 15 of
which are entirely new holdings for LTL) has two key motivations. First, there has been a desire to
launch a fund to capture the investment opportunity from US listed companies that already make up
more than 40% of the global universe of companies that LTL researches. And second, by focusing LTL’s
research resources on these US companies, it was felt that any increased knowledge and understanding
of them would percolate through to LTL’s other strategies – either directly in the case of Global and
UK (where 20% of the portfolio can be invested in non-UK listed companies, some of which are
currently US listed) or indirectly in the case of Japan. In addition, the initiative will help to burnish the
portfolio management skills of two key members of the investment team and could ease the route to
succession when LTL’s founders decide to withdraw from the business – not that there is any hint of
that happening any time soon! The new fund is not currently being promoted by LTL as it would prefer
to wait until a meaningful track record has been achieved.
^ Alternative Performance Measure (APM). See Glossary of Terms and Alternative Performance Measures beginning on page 25.

THE LINDSELL TRAIN INVESTMENT TRUST PLC
5
At the beginning of November the company appointed a new administrator and company secretary,
Frostrow Capital LLP, after a review process that had lasted through the summer and autumn. In doing
so your Board accepted quite a significant increase in fees – more than 50% – on the basis that we
expect a commensurate increase in the level of service provision. This will mean that we can be less
reliant on LTL, who over the years has increasingly been drawn in to help with administration, over
and above its appointed role as the Company’s investment manager.
The coronavirus pandemic has meant that the Company has had to run the great majority of its business
remotely since the beginning of the year although the Board managed a physical quorum for the AGM
and its associated Board meeting in September. I am happy to report that, despite the entire Board
not meeting physically since late 2019, we have conducted business without interruption and in a
seamless way. Notwithstanding that, we look forward to a return to conducting our business in the
traditional way next year.
Julian Cazalet
Chairman
30 November 2020
THE LINDSELL TRAIN INVESTMENT TRUST PLC
6
Investment Manager’s Report
Of our twelve quoted investee companies, including Finsbury Growth & Income Trust PLC (“Finsbury
Growth”), seven are showing share price gains over the last six months. The gainers are led by PayPal,
which has more than doubled, with double digit gains too for Finsbury Growth, LSE, Mondelez,
Nintendo and Unilever. Meanwhile, Diageo was up, but just 2.5%.
Of the five fallers the worst were Laurent Perrier, down a bit more than 5% and Heineken, down 4%.
There were more modest declines from A.G. Barr, Pearson and RELX – to round off this sorry set.
What conclusions can be drawn from these price moves? Clearly, those companies with a digital growth
story that can demonstrate that the pandemic has positively acted as an accelerant for their business
have done best. COVID has actually helped PayPal and Nintendo. We have been fortunate that investors
perceive our biggest direct equity holding, the LSE, as belonging to this favoured category. We agree
by the way.
Elsewhere, perhaps it is no surprise that the chocolate and biscuits of Mondelez and the cleaning and
hygiene products of Unilever have allowed both companies to deliver business progress in 2020. Perhaps
it is also relevant that both MDLZ and ULVR have been able to respond to changing consumer shopping
habits in lockdown. ULVR’s e-commerce sales were up 76% in the most recent quarter and now
represent 10% of group total. This is not to argue that ULVR is turning into an Internet company, but
it is demonstrating that a channel shift is not necessarily damaging to the owners of trusted or beloved
brands. And without any doubt Cadbury, Oreos, Dove, Domestos and Knorr have shown their
continuing relevance through this extraordinary year.
What is more of a surprise to us and an unpleasant one is that none of our beverage companies have
been able to grow in 2020, or to protect short term stock market value. In previous recessions or
financial shocks drinks companies have earned a reputation for being “defensive” and I had incorrectly
expected the same this time round. Of course, what I missed was the malign impact of an enforced
channel shift in booze, or a shift in where it is actually purchased or consumed. Beer is predominantly
consumed in pubs and clubs and their shuttering has hurt Heineken and Diageo’s Guinness. IRN-BRU
too is often consumed in clubs or purchased in newsagents and sandwich shops by people out and
about. Diageo’s US spirits business has proven resilient, as Americans experiment with at-home cocktail
mixing. But not enough to offset the hits to, say, Johnnie Walker. Laurent Perrier has also been hit
given the lack of restaurant dining and party celebrations.
A common denominator in our share price fallers is their reliance on face-to-face human sociability. Its
absence or at least marked reduction has hurt them all. Will business people return to RELX’s exhibitions
to cement deals? Will rugby crowds ever return to Lansdowne Road – with all the implications that has
for sales of Guinness?
I want to answer – yes. Tourism, live sport, festivals, pubs; when you get down to it: Cities. All of these
answer basic human needs and I expect will come roaring back. But when?
THE LINDSELL TRAIN INVESTMENT TRUST PLC
7
All equity investors, including us, face a challenge through the remainder of 2020 and beyond. Do we
have enough exposure to the bull market stocks of the pandemic – the digital winners? I’m sure that
most professional investors running general equity funds wish they had more. Contrarily, should we
tough out the earnings hiatus for those companies that rely on human interaction? The pinch of that
investment challenge can be felt when you look at PayPal; frankly its share price must have
incorporated a great deal of optimism. But the other side of that challenge is felt when you consider
our depressed investment in Heineken. Recovery for its European and Latin American on-trade business
is possibly still remote.
All we can say is that with current short and long term interest rates so low the warranted value of even
just steadily profitable companies, so long as they offer long term inflation protection, is very high.
When you look at the strategic shape of the direct holdings in the portfolio they essentially split into
two buckets. Two-thirds is invested in companies that either are already, or have the potential to
become, digital winners. The rest is in the owners of beloved and trusted consumer brands. Evidently,
as noted, there have been some disappointments for us in 2020 in both these buckets. But strategically
we are enthusiastic about the combination of growth and predictability the mix offers. And remember,
this same investment disposition is to be found across all of Lindsell Train’s client portfolios. If we’re
right about the potential for this investment strategy to deliver satisfactory returns in coming years,
then we hope we can continue to be optimistic about the prospects for the largest single asset in your
portfolio – the stake you hold in Lindsell Train Limited.
Nick Train
Lindsell Train Limited
Investment Manager
30 November 2020

THE LINDSELL TRAIN INVESTMENT TRUST PLC
8
Income Statement
Six months ended 30 September 2020 Unaudited
Revenue Capital Total Notes £’000 £’000 £’000
Gains on investments held at fair value
through profit or loss – 37,519 37,519
Exchange gains/(losses) on currency – 29 29
Income 2 7,135 – 7,135
Investment management fees 3 (531) (3,994) (4,525)
Other expenses 4 (250) – (250) ————— ————— —————
Net return before finance costs and tax 6,354 33,554 39,908
Interest payable and similar charges – – – ————— ————— —————
Return before tax 6,354 33,554 39,908
Tax 5 (31) – (31) ————— ————— —————
Return after tax for the financial period/year 6,323 33,554 39,877 ————— ————— —————
Return per Ordinary Share 6 £31.62 £167.77 £199.39
All revenue and capital items in the above statement derive from continuing operations.
The total columns of this statement represent the profit and loss accounts of the Company. The revenue
and capital columns are supplementary to this and are prepared under the guidance published by the
Association of Investment Companies.
The Company does not have any other recognised gains or losses. The net return for the period
disclosed above represents the Company’s total comprehensive income.
No operations were acquired or discontinued during the period.

THE LINDSELL TRAIN INVESTMENT TRUST PLC
9
Income Statement continued
Six months ended Year ended 30 September 2019 31 March 2020 Unaudited Audited
Revenue Capital Total Revenue Capital Total £’000 £’000 £’000 £’000 £’000 £’000
– 39,463 39,463 – 7,457 7,457
– (5) (5) – (6) (6)
6,275 – 6,275 12,395 – 12,395
(645) (3,061) (3,706) (1,298) (3) (1,301)
(247) (1) (248) (424) (1) (425) ————— ————— ————— ————— ————— —————
5,383 36,396 41,779 10,673 7,447 18,120
– – – – – – ————— ————— ————— ————— ————— —————
5,383 36,396 41,779 10,673 7,447 18,120
(42) – (42) (75) – (75) ————— ————— ————— ————— ————— —————
5,341 36,396 41,737 10,598 7,447 18,045 ————— ————— ————— ————— ————— —————
£26.71 £181.98 £208.69 £52.99 £37.24 £90.23

THE LINDSELL TRAIN INVESTMENT TRUST PLC
10
Statement of Changes in Equity
Share Special Capital Revenue capital reserve reserve reserve Total £’000 £’000 £’000 £’000 £’000
For the six months ended
30 September 2020 (unaudited)
At 31 March 2020 150 19,850 155,482 15,848 191,330
Return after tax for the financial period – – 33,554 6,323 39,877
Dividends paid – – – (8,800) (8,800) ————— ————— ————— ————— —————
At 30 September 2020 150 19,850 189,036 13,371 222,407 ————— ————— ————— ————— —————
Share Special Capital Revenue capital reserve reserve reserve Total £’000 £’000 £’000 £’000 £’000
For the six months ended
30 September 2019 (unaudited)
At 31 March 2019 150 19,850 148,035 11,150 179,185
Return after tax for the financial period – – 36,396 5,341 41,737
Dividends paid – – – (5,900) (5,900) ————— ————— ————— ————— —————
At 30 September 2019 150 19,850 184,431 10,591 215,022 ————— ————— ————— ————— —————
Share Special Capital Revenue capital reserve reserve reserve Total £’000 £’000 £’000 £’000 £’000
For the year ended 31 March 2020
(audited)
At 31 March 2019 150 19,850 148,035 11,150 179,185
Return after tax for the financial year – – 7,447 10,598 18,045
Dividends paid – – – (5,900) (5,900) ————— ————— ————— ————— —————
At 31 March 2020 150 19,850 155,482 15,848 191,330 ————— ————— ————— ————— —————

THE LINDSELL TRAIN INVESTMENT TRUST PLC
11
Statement of Financial Position
30 September 30 September 31 March 2020 2019 2020 Unaudited Unaudited Audited Note £’000 £’000 £’000
Fixed assets
Investments held at fair value through
profit or loss 226,170 217,640 185,678 ————— ————— —————
Current assets
Other receivables 311 293 415
Cash at bank 71 335 5,390 ————— ————— ————— 382 628 5,805
Creditors: amounts falling due within one year
Other payables (4,145) (3,246) (153) ————— ————— ————— (4,145) (3,246) (153)
Net current (liabilities)/assets (3,763) (2,618) 5,652 ————— ————— ————— Net assets 222,407 215,022 191,330 ————— ————— —————
Capital and reserves
Called up share capital 150 150 150
Special reserve 19,850 19,850 19,850 ————— ————— ————— 20,000 20,000 20,000
Capital reserve 189,036 184,431 155,482
Revenue reserve 13,371 10,591 15,848 ————— ————— ————— Total shareholders’ funds 222,407 215,022 191,330 ————— ————— —————
Net asset value per Ordinary Share 7 £1,112.04 £1,075.11 £956.65

THE LINDSELL TRAIN INVESTMENT TRUST PLC
12
Cash Flow Statement
Six months ended Six months ended Year ended 30 September 30 September 31 March 2020 2019 2020 Unaudited Unaudited Audited £’000 £’000 £’000
Operating Activities
Net return before finance costs and tax 39,908 41,779 18,120
Gains on investments held at fair value (37,519) (39,463) (7,457)
(Gains)/losses on exchange movements (29) 5 6
Decrease/(increase) in other receivables 14 7 (33)
Decrease/(increase) in accrued income 94 (7) (88)
Increase/(decrease) in other payables 3,992 664 (2,430)
Purchase of investments held at fair value (12,500) (527) (581)
Sale of investments held at fair value 9,527 43 53 ————— ————— —————
Net cash inflow from operating activities before interest and taxation 3,487 2,501 7,590
Interest paid – – –
Taxation on investment income (35) (43) (76) ————— ————— —————
Net cash inflow from operating activities 3,452 2,458 7,514
Financing activities
Equity dividends paid (8,800) (5,900) (5,900) ————— ————— ————— Net cash outflow from financing activities (8,800) (5,900) (5,900)
(Decrease)/increase in cash and cash equivalents (5,348) (3,442) 1,614
Cash and cash equivalents at beginning of period/year 5,390 3,782 3,782
Gains/(losses) on exchange movements 29 (5) (6) ————— ————— ————— Cash and cash equivalents at end of period/year 71 335 5,390 ————— ————— —————

THE LINDSELL TRAIN INVESTMENT TRUST PLC
13
Notes to the Financial Statements
1 Accounting policies
The financial statements of the Company have been prepared under the historical cost convention
modified to include the revaluation of fixed assets in accordance with United Kingdom law and
Accounting Standards and with the Statement of Recommended Practice (“SORP”) “Financial
Statements of Investment Trust Companies and Venture Capital Trusts”, issued by the Association
of Investment Companies dated October 2019 and the Companies Act 2006.
The accounting policies and methods of computation followed in this Half-year Report are
consistent with the most recent annual statements.
After considering a schedule of the Company’s current financial resources and liabilities for the next
twelve months, and as the majority of the net assets of the Company are securities which are traded
on recognised stock exchanges, the Directors have determined that its resources are adequate for
continuing in business for the foreseeable future and that it is appropriate to prepare the financial
statements on a going concern basis. The Company does not have a fixed life.
2 Income Six months ended Six months ended Year ended 30 September 2020 30 September 2019 31 March 2020 Unaudited Unaudited Audited £’000 £’000 £’000
Income from investments
Overseas dividends 278 366 650
UK dividends
– Lindsell Train Limited 6,121 5,005 10,442
– Other UK dividends 736 904 1,303 ————— ————— —————
7,135 6,275 12,395 ————— ————— —————
3 Investment management fees Six months ended Six months ended Year ended 30 September 30 September 31 March 2020 2019 2020 Unaudited Unaudited Audited £’000 £’000 £’000
Investment management fee 562 665 1,351
Manager’s performance fee –
charged to capital 3,994* 3,061* 3
Rebate of investment management fee (31) (20) (53) ————— ————— ————— Total management fee 4,525 3,706 1,301
————— ————— —————
* Accrued amount to 30 September.

THE LINDSELL TRAIN INVESTMENT TRUST PLC
14
Notes to the Financial Statements continued
4 Other expenses Six months ended Six months ended Year ended 30 September 30 September 31 March 2020 2019 2020 Unaudited Unaudited Audited £’000 £’000 £’000
Directors’ emoluments 67 62 127
Administration fee 40 40 80
Auditor’s remuneration for:
– audit of the financial statements of
the Company 19 13 25
Tax Compliance fee 2 2 3
Provision for VAT written off 4 21 –
Other* 118 109 189 ————— ————— —————
250 247 424
Capital charges – 1 1 ————— ————— ————— 250 248 425
————— ————— —————
* Includes registrar’s fees, printing fees, AIFMD monitoring fees, marketing fees, safe custody fees, London Stock Exchange/FCA fees, Key Man and Directors’ and Officers’ liability insurance, Employer’s National Insurance and legal fees.
5 Effective rate of tax
The effective rate of tax reported in the revenue column of the income statement for the six months
ended 30 September 2020 is 0.49% (year ended 31 March 2020: 0.70% and six months ended
30 September 2019: 0.78%), based on revenue profit before tax of £6,354,000 (year ended
31 March 2020: £10,673,000 and six months ended 30 September 2019: £5,383,000). This differs
from the standard rate of tax, 19% (year ended 31 March 2020 and six months ended
30 September 2019: 19%) as a result of revenue not taxable for Corporation Tax purposes.

THE LINDSELL TRAIN INVESTMENT TRUST PLC
15
Notes to the Financial Statements continued
6 Total return per Ordinary Share Six months ended Six months ended Year ended 30 September 30 September 31 March 2020 2019 2020 Unaudited Unaudited Audited
Total return £39,877,000 £41,737,000 £18,045,000
Weighted average number of Ordinary Shares
in issue during the period/year 200,000 200,000 200,000 ————— ————— ————— Total return per Ordinary Share £199.39 £208.69 £90.23
————— ————— —————
The total return per Ordinary Share detailed above can be further analysed between revenue and
capital, as below:
Revenue return per Ordinary Share
Revenue return £6,323,000 £5,341,000 £10,598,000
Weighted average number of Ordinary Shares
in issue during the period/year 200,000 200,000 200,000 ————— ————— ————— Revenue return per Ordinary Share £31.62 £26.71 £52.99
————— ————— —————
Capital return per Ordinary Share
Capital return £33,554,000 £36,396,000 £7,447,000
Weighted average number of Ordinary Shares
in issue during the period/year 200,000 200,000 200,000 ————— ————— ————— Capital return per Ordinary Share £167.77 £181.98 £37.24
————— ————— —————
7 Net asset value per Ordinary Share Six months ended Six months ended Year ended 30 September 30 September 31 March 2020 2019 2020 Unaudited Unaudited Audited
Net assets attributable £222,407,000 £215,022,000 £191,330,000
Ordinary Shares in issue at the
period/year end 200,000 200,000 200,000 ————— ————— ————— Net asset value per Ordinary Share £1,112.04 £1,075.11 £956.65
————— ————— —————
8 Valuation of financial instruments
The Company’s investments and derivative financial instruments as disclosed in the Statement of
Financial Position are valued at fair value.
FRS 102 requires an entity to classify fair value measurements using a fair value hierarchy that
reflects the significance of the inputs used in making the measurements. Categorisation within the
hierarchy has been determined on the basis of the lowest level input that is significant to the fair
value measurement of the relevant asset as follows:
– Level 1 – The unadjusted quoted price in an active market for identical assets or liabilities that
the entity can access at the measurement date.
– Level 2 – Inputs other than quoted prices included within Level 1 that are observable (ie developed
using market data) for the asset or liability, either directly or indirectly.
– Level 3 – Inputs are unobservable (ie for which market data is unavailable) for the asset or liability.
THE LINDSELL TRAIN INVESTMENT TRUST PLC
16
Notes to the Financial Statements continued
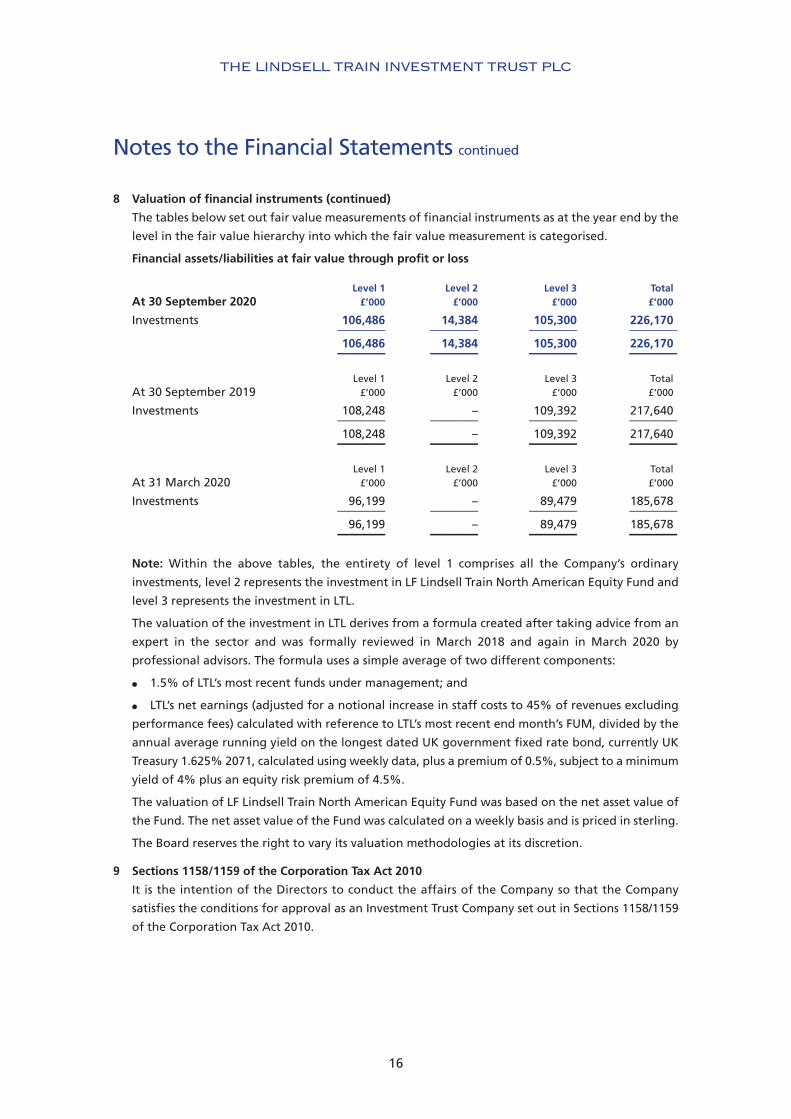
8 Valuation of financial instruments (continued)
The tables below set out fair value measurements of financial instruments as at the year end by the
level in the fair value hierarchy into which the fair value measurement is categorised.
Financial assets/liabilities at fair value through profit or loss
Level 1 Level 2 Level 3 Total At 30 September 2020 £’000 £’000 £’000 £’000
Investments 106,486 14,384 105,300 226,170 ———— ———— ———— ———— 106,486 14,384 105,300 226,170 ———— ———— ———— ————
Level 1 Level 2 Level 3 Total At 30 September 2019 £’000 £’000 £’000 £’000
Investments 108,248 – 109,392 217,640 ———— ———— ———— ———— 108,248 – 109,392 217,640 ———— ———— ———— ————
Level 1 Level 2 Level 3 Total At 31 March 2020 £’000 £’000 £’000 £’000
Investments 96,199 – 89,479 185,678 ———— ———— ———— ———— 96,199 – 89,479 185,678 ———— ———— ———— ————
Note: Within the above tables, the entirety of level 1 comprises all the Company’s ordinary
investments, level 2 represents the investment in LF Lindsell Train North American Equity Fund and
level 3 represents the investment in LTL.
The valuation of the investment in LTL derives from a formula created after taking advice from an
expert in the sector and was formally reviewed in March 2018 and again in March 2020 by
professional advisors. The formula uses a simple average of two different components:
l 1.5% of LTL’s most recent funds under management; and
l LTL’s net earnings (adjusted for a notional increase in staff costs to 45% of revenues excluding
performance fees) calculated with reference to LTL’s most recent end month’s FUM, divided by the
annual average running yield on the longest dated UK government fixed rate bond, currently UK
Treasury 1.625% 2071, calculated using weekly data, plus a premium of 0.5%, subject to a minimum
yield of 4% plus an equity risk premium of 4.5%.
The valuation of LF Lindsell Train North American Equity Fund was based on the net asset value of
the Fund. The net asset value of the Fund was calculated on a weekly basis and is priced in sterling.
The Board reserves the right to vary its valuation methodologies at its discretion.
9 Sections 1158/1159 of the Corporation Tax Act 2010
It is the intention of the Directors to conduct the affairs of the Company so that the Company
satisfies the conditions for approval as an Investment Trust Company set out in Sections 1158/1159
of the Corporation Tax Act 2010.
THE LINDSELL TRAIN INVESTMENT TRUST PLC
17
Interim Management Report The Directors are required to provide an Interim Management Report in accordance with the UK Listing
Authority’s Disclosure and Transparency Rules. They consider that the Chairman’s Statement and the
Investment Manager’s Report, the following statements and the Directors’ Responsibility Statement
below together constitute the Interim Management Report for the Company for the six months ended
30 September 2020.
Principal Risks and Uncertainties Equity markets continued to be volatile during the period associated with uncertainties linked to the
Covid-19 pandemic. The Directors have considered the impact of the continued uncertainty on the
Company’s financial position and, based on the information available to them at the date of this report,
have concluded that no adjustments are required to the accounts as at 30 September 2020. The Board
is also aware that the UK’s exit from the European Union has introduced elements of political and
economic uncertainty. Developments continue to be closely monitored by the Board.
A review of the half-year and the outlook for the Company can be found in the Chairman’s Statement
and in the Investment Manager’s Review. The principal risks and uncertainties faced by the Company
fall into the following broad categories: Market Risk, Investment Performance, Loss of Key Personnel,
Protection of Assets, Economic Conditions, Regulatory Risk, Political Risk, Climate Change Risk and the
Covid-19 pandemic. Information on these risks is given in the annual report for the year ended 31 March
2020.
The Board believes that the Company’s principal risks and uncertainties have not changed materially
since the date of that report and are not expected to change materially for the remaining six months
of the Company’s financial year.
Related Party Transactions During the first six months of the current financial year, no transactions with related parties have taken
place which have materially affected the financial position or the performance of the Company.
Going Concern The Directors believe, having considered the Company’s investment objective, risk management policies,
capital management policies and procedures, and the nature of the portfolio and the expenditure
projections, that the Company has adequate resources, an appropriate financial structure and suitable
management arrangements in place to continue in operational existence for the foreseeable future,
and, more specifically, that there are no material uncertainties relating to the Company that would
prevent its ability to continue in such operational existence for at least twelve months from the date
of the approval of this half-yearly financial report. For these reasons, they consider there is reasonable
evidence to continue to adopt the going concern basis in preparing the financial statements. In
reviewing the position as at the date of this report, the Board has considered the guidance on this
matter issued by the Financial Reporting Council.

THE LINDSELL TRAIN INVESTMENT TRUST PLC
18
Directors’ Responsibilities
The Board of Directors confirms that, to the best of its knowledge:
(i) the condensed set of financial statements contained within the Half-year Report have been
prepared in accordance with applicable United Kingdom Generally Accepted Accounting Practice
standards; and
(ii) the interim management report includes a true and fair review of the information required by:
(a) DTR 4.2.7R of the Disclosure Guidance and Transparency Rules, being an indication of
important events that have occurred during the first six months of the financial year and their
impact on the condensed set of financial statements; and a description of the principal risks
and uncertainties for the remaining six months of the year;
(b) DTR 4.2.8R of the Disclosure Guidance and Transparency Rules, being related party
transactions that have taken place in the first six months of the current financial year and
that have materially affected the financial position or performance of the entity during that
period; and
(c) any changes in the related party transactions described in the last annual report that could
do so.
The Half-year Report has not been audited by the Company’s auditors.
This Half-year Report contains certain forward-looking statements. These statements are made by the
Directors in good faith based on the information available to them up to the date of this report and
such statements should be treated with caution due to the inherent uncertainties, including both
economic and business risk factors, underlying any such forward-looking information.
The Half-year Report was approved by the Board on 30 November 2020 and the above responsibility
statement was signed on its behalf by:
Julian Cazalet
Chairman
30 November 2020

THE LINDSELL TRAIN INVESTMENT TRUST PLC
19
Portfolio Holdings at 30 September 2020 (All ordinary shares unless otherwise stated)
Look- through Fair % of basis: value total % of total Holding Security £’000 assets assets†
6,450 Lindsell Train Limited 105,300 47.34 47.34
235,000 London Stock Exchange 20,854 9.38 9.57
41,000 Nintendo 17,929 8.06 8.06
97,500 PayPal 14,853 6.68 7.06
12,500,000 LF Lindsell Train North American Equity Fund 14,384 6.47 5.85
420,500 Diageo 11,143 5.01 5.16
222,000 Unilever 10,603 4.77 4.94
150,000 Mondelez International 6,662 2.99 3.38
363,000 RELX 6,264 2.82 2.96
1,263,393 A.G. Barr 6,153 2.77 2.79
89,000 Heineken 5,364 2.41 2.49
420,000 Finsbury Growth & Income Trust 3,520 1.58 0.66
28,093 Laurent-Perrier 1,768 0.79 0.79
250,000 Pearson 1,373 0.62 0.64 ———— ———— ————
Total investments 226,170 101.69 101.69
Net current assets (3,763) (1.69) (1.69) ———— ———— ————
Total assets 222,407 100.00 100.00 ———— ———— ————
† Look-through basis: This adjusts the percentages held in each security upwards by the amount held in LTL managed funds and adjusts the fund’s holdings downwards to account for the overlap. It provides Shareholders with a measure of stock specific risk by amalgamating the direct holdings of the Company with the indirect holdings held within the LTL funds.
Leverage
We detail below the balance sheet positions of the Funds managed by LTL as at 30 September 2020:
Net equity Fund exposure
LF Lindsell Train North American Equity Acc 99.41%
Finsbury Growth & Income Trust 100.50%
THE LINDSELL TRAIN INVESTMENT TRUST PLC
20
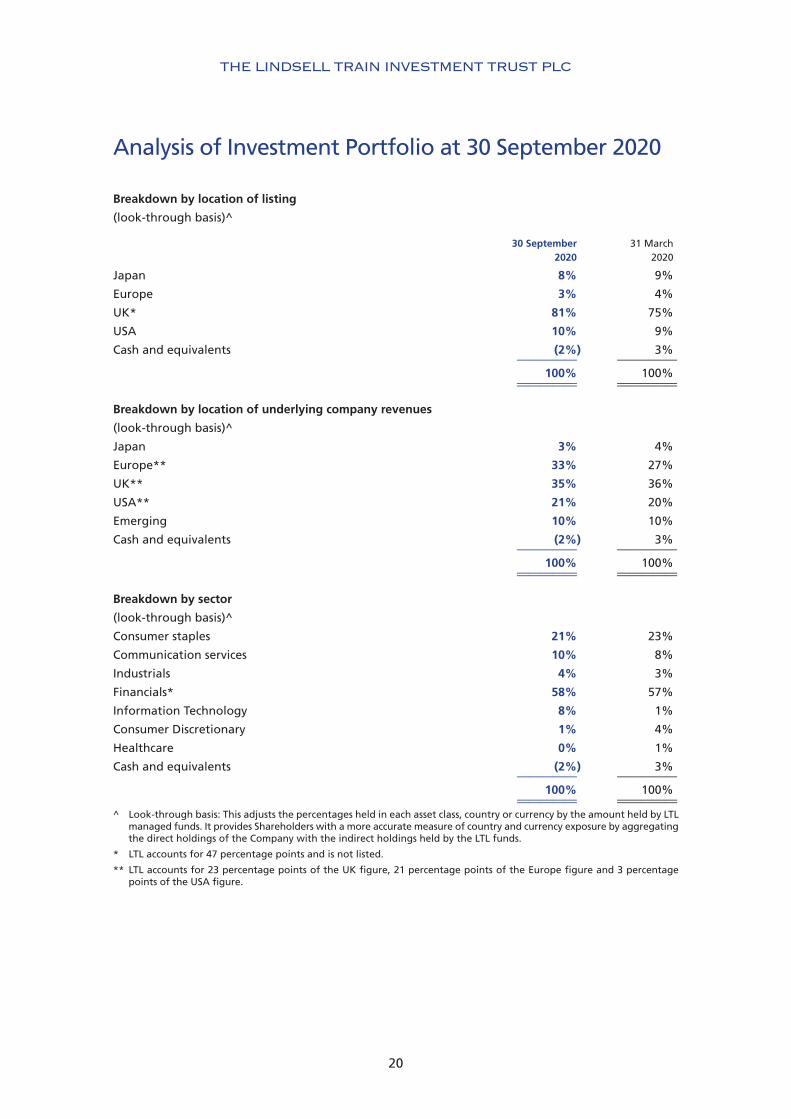
Analysis of Investment Portfolio at 30 September 2020
Breakdown by location of listing
(look-through basis)^
30 September 31 March 2020 2020
Japan 8% 9%
Europe 3% 4%
UK* 81% 75%
USA 10% 9%
Cash and equivalents (2%) 3% ————— —————
100% 100% ————— ————— ————— —————
Breakdown by location of underlying company revenues
(look-through basis)^
Japan 3% 4%
Europe** 33% 27%
UK** 35% 36%
USA** 21% 20%
Emerging 10% 10%
Cash and equivalents (2%) 3% ————— —————
100% 100% ————— ————— ————— —————
Breakdown by sector
(look-through basis)^
Consumer staples 21% 23%
Communication services 10% 8%
Industrials 4% 3%
Financials* 58% 57%
Information Technology 8% 1%
Consumer Discretionary 1% 4%
Healthcare 0% 1%
Cash and equivalents (2%) 3% ————— —————
100% 100% ————— ————— ————— —————
^ Look-through basis: This adjusts the percentages held in each asset class, country or currency by the amount held by LTL managed funds. It provides Shareholders with a more accurate measure of country and currency exposure by aggregating the direct holdings of the Company with the indirect holdings held by the LTL funds.
* LTL accounts for 47 percentage points and is not listed.
** LTL accounts for 23 percentage points of the UK figure, 21 percentage points of the Europe figure and 3 percentage points of the USA figure.

THE LINDSELL TRAIN INVESTMENT TRUST PLC
21
Appendix 1 Half-year review of Lindsell Train Limited (‘LTL’) The Manager of The Lindsell Train Investment Trust plc
Funds under Management Jul 2020 Jan 2020 Jul 2019 FUM by Strategy: £m £m £m
UK 8,799 9,486 10,691 Global 11,438 11,160 11,208 Japan 914 804 664
————— ————— ————— Total 21,151 21,450 22,563 ————— ————— —————
Largest Client Accounts Jul 2020 Jan 2020 Jul 2019 % of FUM % of FUM % of FUM
Largest Pooled Fund Account 36% 38% 39% Largest Segregated Account 8% 9% 8%
Financials Jul 2020 Jul 2019 % Profit & Loss £’000 £’000 Change
Fee Revenue Investment Management fees 52,260 50,506 3% Performance Fee – 2,436 (100%) Bank Interest 112 220 –
————— ————— 52,372 53,162 – Staff Remuneration * (15,165) (17,583) (14%) Fixed Overheads (2,453) (1,623) 51% Investment Unrealised Gain 459 – – FX Currency Translation Gain 422 720 –
————— ————— Operating profit 35,635 34,676 3% Taxation (6,771) (6,589) –
————— ————— Net Profit 28,864 28,087 3% Dividends (25,260) (20,688) –
————— ————— Retained profit 3,604 7,399 –
————— —————
Capital & Reserves Called up Share Capital 266 266 Treasury Stock (625) – Profit & Loss Account 70,073 57,384
————— ————— Shareholders' Funds 69,714 57,650
Balance Sheet Fixed Assets 224 37 Current Assets (inc cash at bank) 74,456 70,251 Liabilities (4,966) (12,638)
————— ————— Net Assets 69,714 57,650 ————— ————— ————— ————— * No more than 25% of fees (other than LTIT fees) can be paid as staff remuneration. Employer national insurance costs are
excluded from this limit.
THE LINDSELL TRAIN INVESTMENT TRUST PLC
22
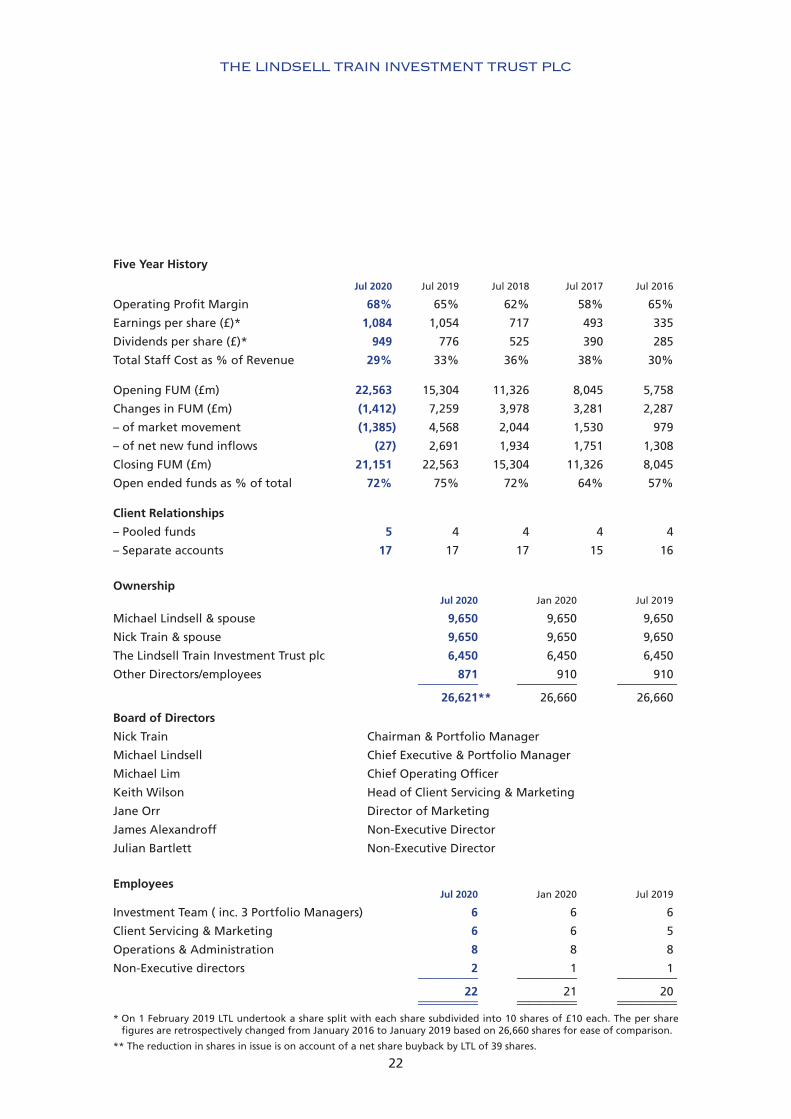
* On 1 February 2019 LTL undertook a share split with each share subdivided into 10 shares of £10 each. The per share figures are retrospectively changed from January 2016 to January 2019 based on 26,660 shares for ease of comparison.
** The reduction in shares in issue is on account of a net share buyback by LTL of 39 shares.
Five Year History
Jul 2020 Jul 2019 Jul 2018 Jul 2017 Jul 2016
Operating Profit Margin 68% 65% 62% 58% 65%
Earnings per share (£)* 1,084 1,054 717 493 335
Dividends per share (£)* 949 776 525 390 285
Total Staff Cost as % of Revenue 29% 33% 36% 38% 30%
Opening FUM (£m) 22,563 15,304 11,326 8,045 5,758
Changes in FUM (£m) (1,412) 7,259 3,978 3,281 2,287
– of market movement (1,385) 4,568 2,044 1,530 979
– of net new fund inflows (27) 2,691 1,934 1,751 1,308
Closing FUM (£m) 21,151 22,563 15,304 11,326 8,045
Open ended funds as % of total 72% 75% 72% 64% 57%
Client Relationships
– Pooled funds 5 4 4 4 4
– Separate accounts 17 17 17 15 16
Ownership Jul 2020 Jan 2020 Jul 2019
Michael Lindsell & spouse 9,650 9,650 9,650
Nick Train & spouse 9,650 9,650 9,650
The Lindsell Train Investment Trust plc 6,450 6,450 6,450
Other Directors/employees 871 910 910 ————— ————— —————
26,621** 26,660 26,660
Board of Directors
Nick Train Chairman & Portfolio Manager
Michael Lindsell Chief Executive & Portfolio Manager
Michael Lim Chief Operating Officer
Keith Wilson Head of Client Servicing & Marketing
Jane Orr Director of Marketing
James Alexandroff Non-Executive Director
Julian Bartlett Non-Executive Director
Employees Jul 2020 Jan 2020 Jul 2019
Investment Team ( inc. 3 Portfolio Managers) 6 6 6
Client Servicing & Marketing 6 6 5
Operations & Administration 8 8 8
Non-Executive directors 2 1 1 ————— ————— —————
22 21 20 ————— ————— ————— ————— ————— —————

THE LINDSELL TRAIN INVESTMENT TRUST PLC
23
Appendix 2
LTIT Directors’ Valuation of LTL (unaudited) Sept 2020 Sept 2019 £’000 £’000
Funds under Management excluding LTIT holdings 21,886,374 21,643,251 ——————— ———————
Valuation of LTL based on 1.5% of FUM (A) 328,296 324,649 ——————— ———————
Revenue ex performance fee 111,676** 115,232*
Notional staff costs (45%) (50,254) (51,854)
Interest income 69** 431*
Operating costs (4,728)** (3,280)*
Notional tax (19%) (10,785) (11,501) ——————— ———————
Notional post tax earnings 45,978 49,028 ——————— ———————
Benchmark + 4.0% 4.0%
Equity risk premium 4.5% 4.5%
Total yield + premium (discount rate) 8.5% 8.5% ——————— ———————
Valuation of LTL based on earnings (B) 540,915 576,803 ——————— ———————
Valuation of LTL (A+B)/2) (C) 434,605 450,726 ——————— ———————
Shares in issue (D)# 26,621 26,660 ——————— ———————
Valuation per share of LTL (C/D) £16,326 £16,906 ——————— ——————— ——————— ———————
* Annualised figures are previous three months’ data.
** Revenues based on 30 September 2020 LTL FUM multiplied by LTL’s average fee rate for the six months to 31 August 2020 and interest income and operating costs based on the average of three months to 31 August 2020.
+ The annual average running yield of the longest-dated UK government fixed rate bond, currently UK treasury 1.625% 2071, calculated using weekly data, plus a premium of 0.5%, subject to a minimum yield of 4%.
# The reduction in shares in issue is on account of a net share buyback of LTL of 39 shares.

THE LINDSELL TRAIN INVESTMENT TRUST PLC
24
Company Information
Directors Julian Cazalet (Chairman) Nicholas Allan Vivien Gould Richard Hughes Michael Lindsell
Company Secretary, Administrator and Registered Office Frostrow Capital LLP 25 Southampton Buildings London WC2A 1AL United Kingdom Tel: 0203 008 4910 Email: [email protected]
Solicitor Stephenson Harwood LLP 1 Finsbury Circus London EC2M 7SH
Broker JP Morgan Cazenove Ltd 25 Bank Street Canary Wharf London E14 5JP
Shareholder relations The Company’s Ordinary share price is listed daily in the Financial Times. For further information visit: www.lindselltrain.com and follow the links.
Individual Savings Account (“ISA”) The Company’s shares are eligible to be held in an ISA account subject to HM Revenue & Customs’ limits.
Website The Company’s internet website is located at: www.lindselltrain.com Registered in England, No: 4119429
Investment Manager Lindsell Train Limited 3rd Floor 66 Buckingham Gate London SW1E 6AU Tel: 020 7808 1210 (Authorised and Regulated by the Financial Conduct Authority)
Registrar Link Asset Services The Registry 34 Beckenham Road Beckenham Kent BR3 4TU Email: [email protected] Tel: +44 (0)371 664 0300 Website: www.linkassetservices.com
Calls outside the UK will be charged at the applicable International rate and may be recorded for training purposes. Lines are open from 9.00 a.m. to 5.30 p.m. Monday to Friday excluding public holidays in England and Wales.
Independent Auditors PricewaterhouseCoopers LLP Atria One, 144 Morrison Street Edinburgh EH3 8EX
Custodian Northern Trust Company 50 Bank Street Canary Wharf London E14 5NT
Identification codes SEDOL: 3197794 ISIN: GB0031977944 BLOOMBERG: LTI LN Legal Entity Identifier: 213800VMBJH2TCFDZU08

THE LINDSELL TRAIN INVESTMENT TRUST PLC
25
Glossary of Terms and Alternative Performance Measures
Alternative Performance Measure (APM)
An alternative performance measure is a financial measure of historical or future financial performance,
financial position or cash flow that is not prescribed by the relevant accounting standards.
Benchmark
The annual average running yield on the longest-dated UK government fixed rate bond (currently UK
Treasury 1.625% 2071), calculated using weekly data, plus a premium of 0.5%, subject to a minimum
yield of 4.0%.
Discount and premium (APM)
If the share price of an investment trust is higher than the Net Asset Value (NAV) per share, the shares
are trading at a premium to NAV. In this circumstance the price that an investor pays or receives for a
share would be more than the value attributable to it by reference to the underlying assets. The
premium is the difference between the share price (based on mid-market share prices) and the NAV,
expressed as a percentage of the NAV.
A discount occurs when the share price is below the NAV. Investors would therefore be paying less than
the value attributable to the shares by reference to the underlying assets.
A premium or discount is generally the consequence of supply and demand for the shares on the stock
market.
The discount or premium is calculated by dividing the difference between the share price and the NAV
by the NAV.
As at 30 As at 30 As at 31 September September March 2020 2019 2020 £ £ £ Share Price 1,155.00 1,375.00 1,060.00 Net Asset Value per Share 1,112.04 1,075.11 956.65 –––––––––– –––––––––– –––––––––– Premium to Net Asset Value per Share 3.9% 27.9% 10.8%
Net asset value (NAV) per Ordinary Share
The NAV is shareholders’ funds expressed as an amount per individual share. Equity shareholders’ funds
are the total value of all the Company’s assets, at current market value, having deducted all current
and long-term liabilities and any provision for liabilities and charges.
The NAV of the Company is published weekly and at each month end.

THE LINDSELL TRAIN INVESTMENT TRUST PLC
26
The figures disclosed on page 11 have been calculated as shown below:
Six months Six months ended 30 ended 30 Year ended September September 31 March 2020 2019 2020 Net Asset Value (a) £222,407,000 £215,022,000 £191,330,000 Ordinary Shares in issue (b) 200,000 200,000 200,000 –––––––––– –––––––––– –––––––––– Net asset value per Ordinary Share (a) ÷ (b) £1,112.04 £1,075.11 £956.65
Revenue return per Share
The revenue return per share is the revenue return profit for the period/year divided by the weighted
average number of ordinary shares in issue during the period/year.
Share price and NAV total return (APM)
This is the return on the share price and NAV taking into account both the rise and fall of share prices
and valuations and the dividends paid to shareholders.
Any dividends received by a shareholder are assumed to have been reinvested in either additional
shares (for share price total return) or the Company’s assets (for NAV total return).
The share price and NAV total return is calculated as the return to shareholders after reinvesting the net
dividend in additional shares on the date that the share price goes ex-dividend.
The figures disclosed on pages 2 and 4 have been calculated at shown below:
Six months ended 30 September 2020 LTIT NAV LTIT Price NAV/Price at 30 September 2020 a £1,112.04 £1,155 Dividend Adjustment Factor* b 1.0410 1.0372 Adjusted closing NAV/Price c = a x b £1,157.62 £1,197.98 NAV/Price 31 March 2020 d £956.65 £1,060 Total return [(c/d)-1]*100 21.0% 13.0%
* The dividend adjustment factor is calculated on the assumption that the dividends of £44.00 paid by the Company during the year were reinvested into shares or assets of the Company at the cum income NAV per share/share price, as appropriate, at the ex-dividend date.
LTL total return performance
The total return performance for LTL is calculated as the return after receiving but not reinvesting
dividends received over the period.
The figure disclosed on page 4 has been calculated as show below:
Six months ended 30 September 2020 LTL valuation Valuation at 31 March 2020 a £13,873 Valuation at 30 September 2020 b £16,326 Dividends paid during the year c £949 Total return [(b-a)+c]/a*100 24.5%

THE LINDSELL TRAIN INVESTMENT TRUST PLC
27
Disability Act Copies of this Half-year Report and other documents issued by the Company are available from the
Company Secretary. If needed, copies can be made available in a variety of formats, including braille,
audio tape or larger type as appropriate. You can contact the Registrar to the Company, Link Asset
Services, which has installed telephones to allow speech and hearing impaired people who have their
own telephone to contact them directly, without the need for an intermediate operator, for this service
please call 0800 731 1888. Specially trained operators are available during normal business hours to
answer queries via this service. Alternatively, if you prefer to go through a ‘typetalk’ operator (provided
by The Royal National Institute for Deaf People) you should dial 18001 from your textphone followed
by the number you wish to dial.

THE LINDSELL TRAIN INVESTMENT TRUST PLC
28

THE LINDSELL TRAIN INVESTMENT TRUST PLC
29
Perivan 259664
THE LINDSELL TRAIN INVESTMENT TRUST PLC

THE LINDSELL TRAININVESTMENT TRUST PLC
Half-year Report for the six months
ended 30 September 2020


