The Liquidation of The Liquidation of Government Debt Government Debt Carmen M. Carmen M. Reinhart Reinhart Peterson Peterson Institute Institute for for International Economics, International Economics, NBER NBER and and Peterson Peterson Institute Institute for for International Economics, International Economics, NBER NBER and and CEPR CEPR M. M. Belen Belen Sbrancia Sbrancia University University of Maryland of Maryland Macro Macro-Financial Stability in the New Normal Financial Stability in the New Normal April 7 April 7, 2011, International Monetary Fund , 2011, International Monetary Fund
Transcript
The Liquidation of The Liquidation of Government DebtGovernment Debt
Carmen M. Carmen M. ReinhartReinhartPeterson Peterson InstituteInstitute forfor International Economics,International Economics,NBER NBER and and Peterson Peterson InstituteInstitute forfor International Economics,International Economics,NBER NBER and and
CEPRCEPR
M. M. BelenBelen SbranciaSbranciaUniversityUniversity of Marylandof Maryland
MacroMacro--Financial Stability in the New NormalFinancial Stability in the New Normal
April 7April 7, 2011, International Monetary Fund, 2011, International Monetary Fund
Throughout history, debt/GDP ratios have Throughout history, debt/GDP ratios have been reduced by:been reduced by:
((ii) economic growth; economic growth; (ii) (ii) fiscal adjustment/austerity; fiscal adjustment/austerity; (iii) (iii) explicit default or restructuring; explicit default or restructuring; (iv) (iv) a sudden surprise burst in inflation; anda sudden surprise burst in inflation; and(iv) (iv) a sudden surprise burst in inflation; anda sudden surprise burst in inflation; and(v) (v) a steady dosage of financial repression that a steady dosage of financial repression that
is accompanied by an equally steady is accompanied by an equally steady dosage of inflation. dosage of inflation.
((Options (iv) and (v) are only viable for Options (iv) and (v) are only viable for domesticdomestic--currency debtscurrency debts).).
Reinhart and SbranciaReinhart and Sbrancia 22
Financial repressionFinancial repression… includes directed lending to government … includes directed lending to government by captive domestic audiences (such as by captive domestic audiences (such as pension funds), explicit or implicit caps on pension funds), explicit or implicit caps on interest rates, regulation of crossinterest rates, regulation of cross--border border interest rates, regulation of crossinterest rates, regulation of cross--border border capital movements, and (generally) a tighter capital movements, and (generally) a tighter connection between government and banks.connection between government and banks.
It is a subtle type of debt restructuring…It is a subtle type of debt restructuring…
Reinhart and SbranciaReinhart and Sbrancia33
This paper is an empirical This paper is an empirical investigation of (iv) and (v) investigation of (iv) and (v) in that list.in that list.
Reinhart and SbranciaReinhart and Sbrancia 44
in that list.in that list.
Main results:Main results:
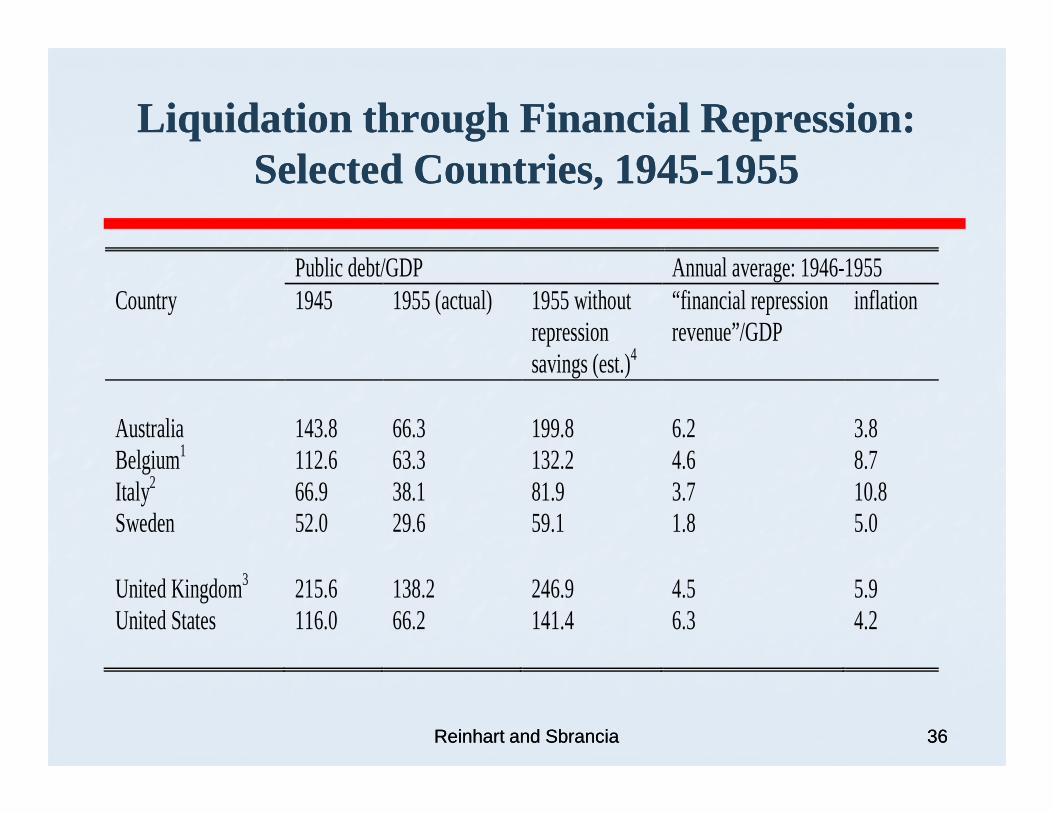
In the heavily regulated financial markets of In the heavily regulated financial markets of the the BrettonBretton Woods, restrictions facilitated a Woods, restrictions facilitated a sharp and rapid reduction in public sharp and rapid reduction in public debt/GDP ratios from the late 1940s to the debt/GDP ratios from the late 1940s to the debt/GDP ratios from the late 1940s to the debt/GDP ratios from the late 1940s to the 1970s. 1970s.
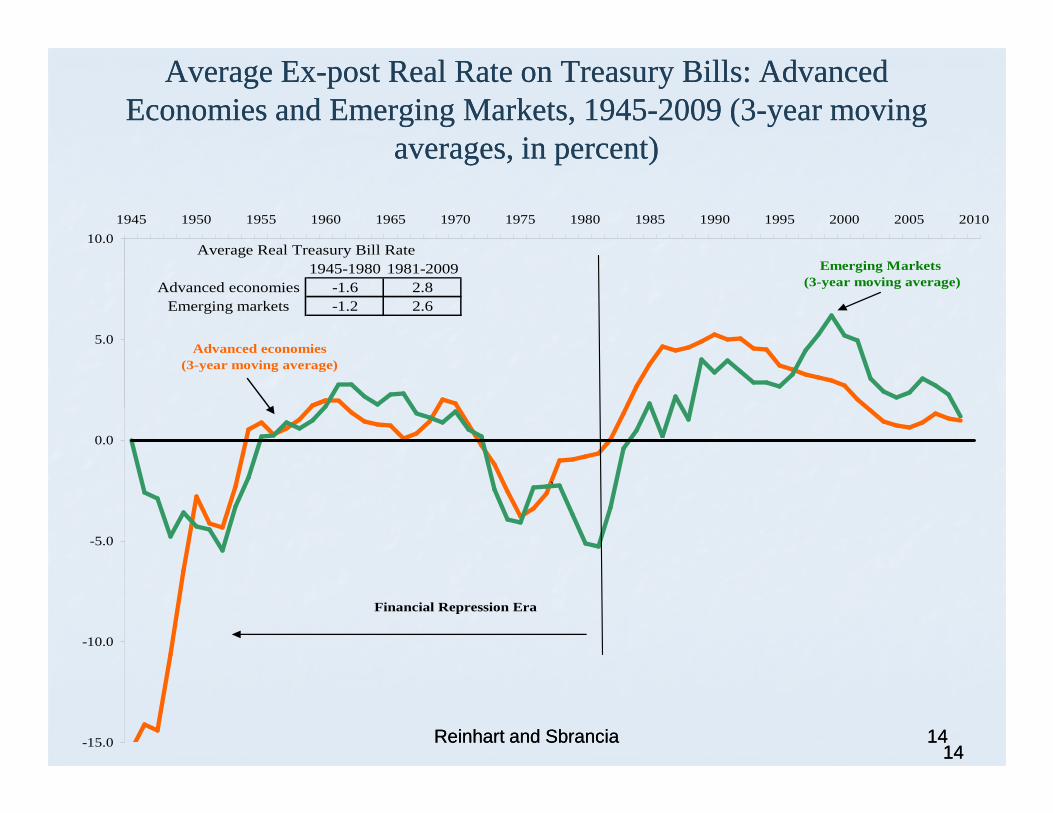
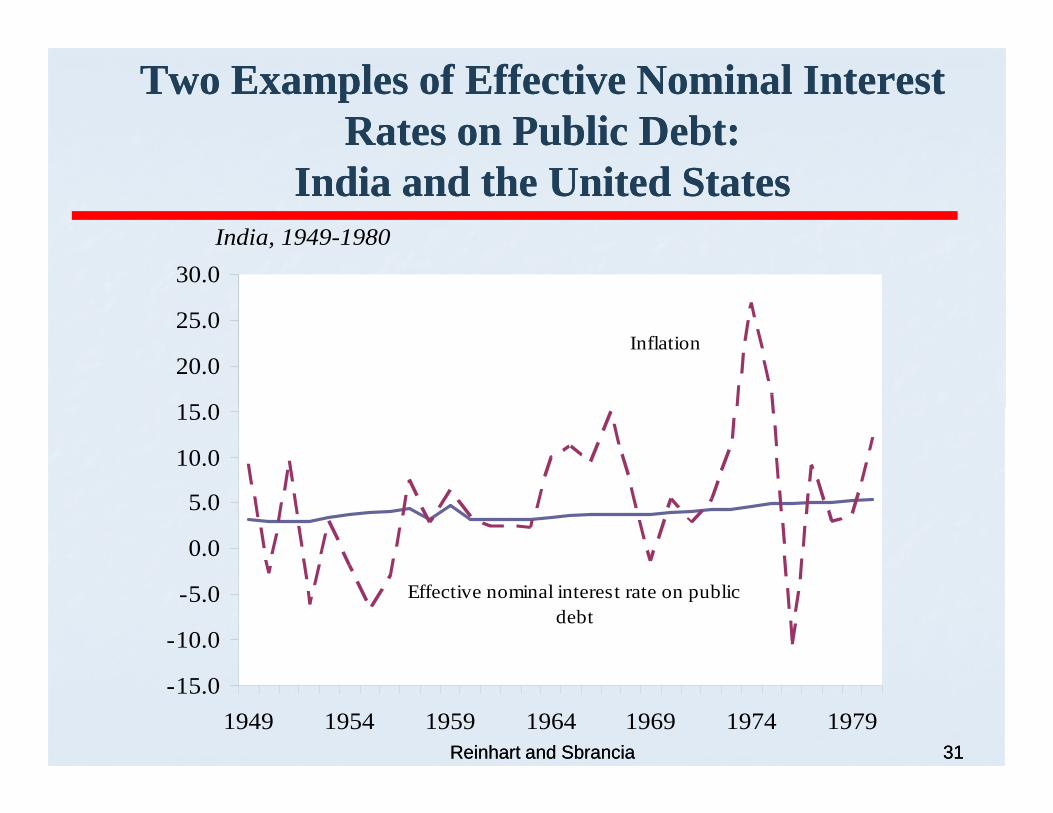
Low nominal interest rates reduced debt Low nominal interest rates reduced debt servicing costs while a high incidence of servicing costs while a high incidence of negative real interest rates liquidated the negative real interest rates liquidated the real value of government debt. real value of government debt.
Reinhart and SbranciaReinhart and Sbrancia 55
Main results:Main results:�� For the advanced economies in our sample, For the advanced economies in our sample,
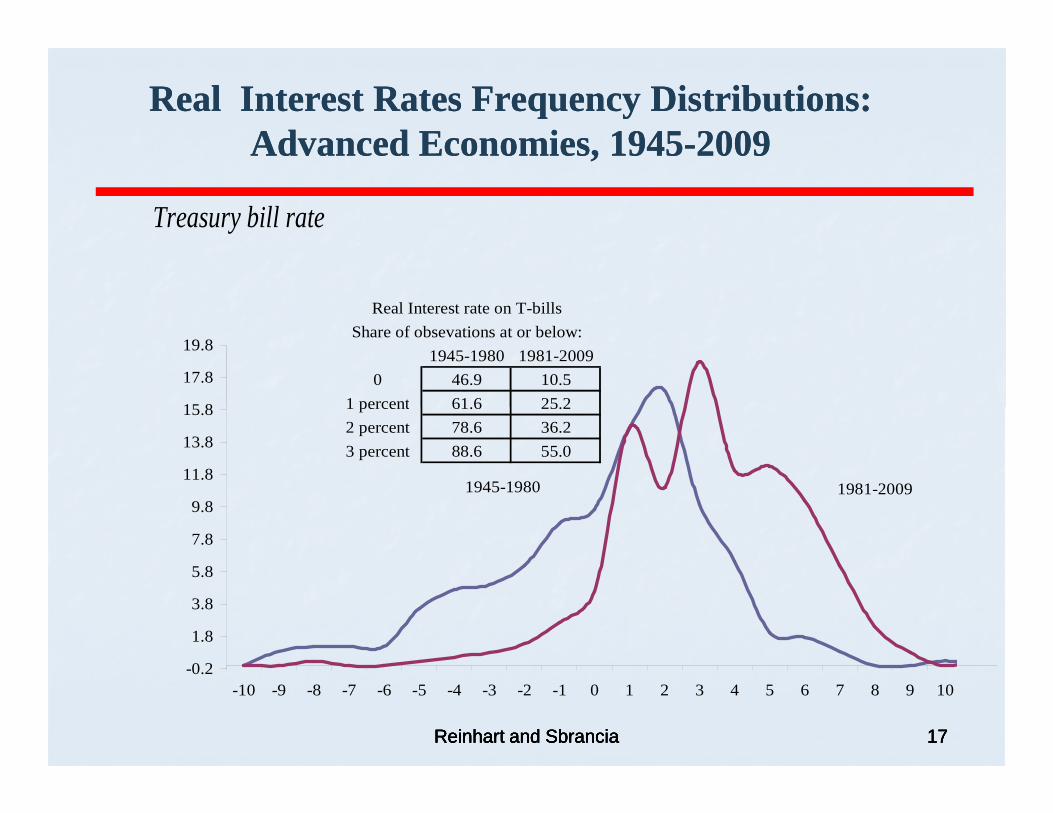
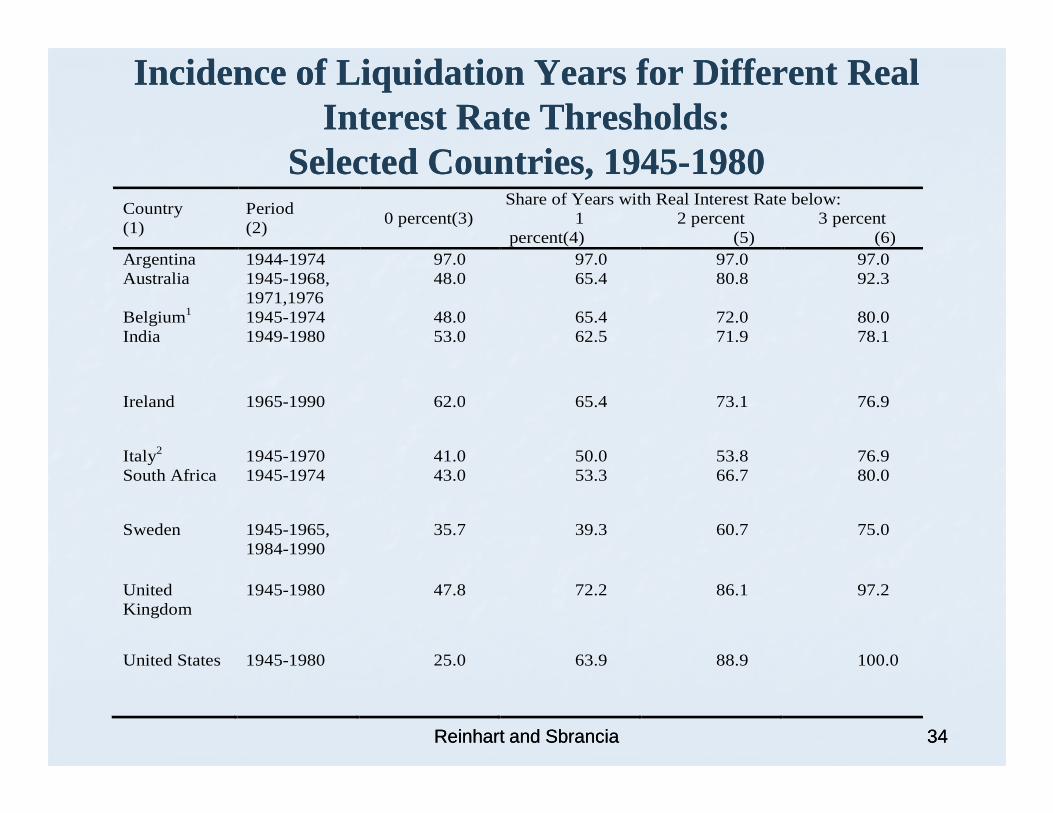
real interest rates were negative roughly ½ real interest rates were negative roughly ½ of the time during 1945of the time during 1945--1980.1980.
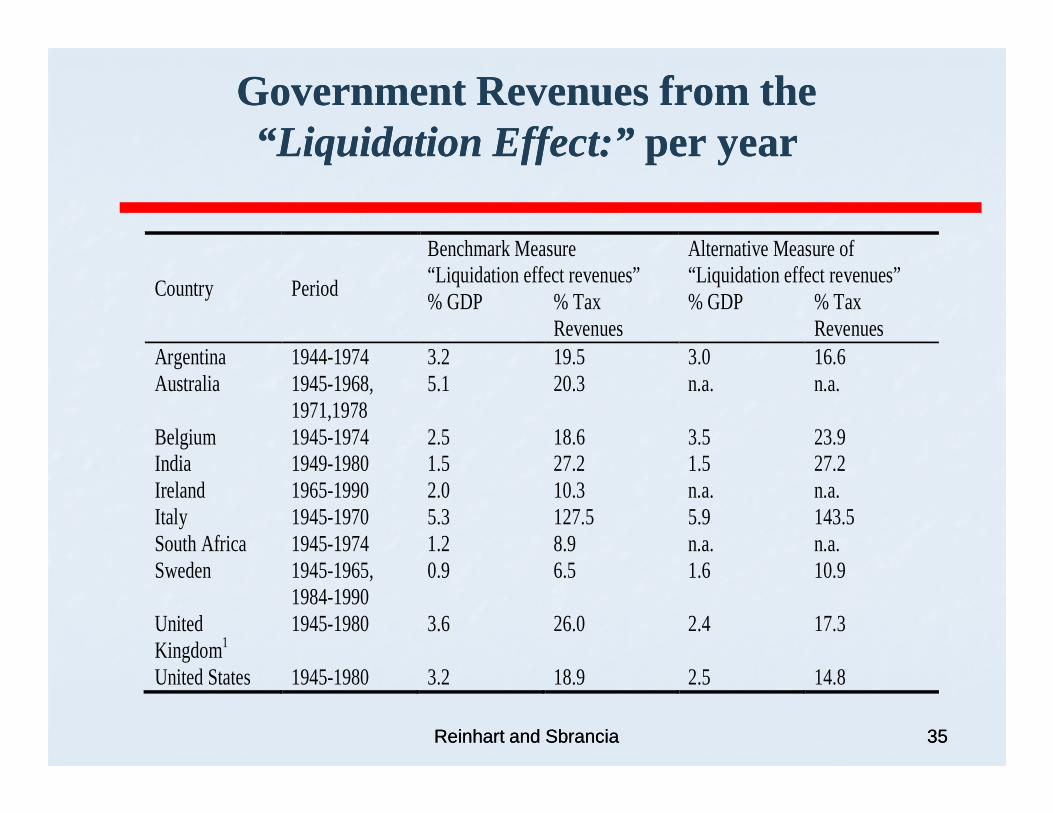
�� For the US and the UK our estimates of the For the US and the UK our estimates of the annual liquidation of debt via negative real annual liquidation of debt via negative real annual liquidation of debt via negative real annual liquidation of debt via negative real interest rates amounted on average from 3 interest rates amounted on average from 3 to 4 percent of GDP a year. For Australia to 4 percent of GDP a year. For Australia and Italy, which recorded higher inflation and Italy, which recorded higher inflation rates, the liquidation effect was larger rates, the liquidation effect was larger (around 5 percent per annum). (around 5 percent per annum).
Reinhart and SbranciaReinhart and Sbrancia 66
Main results:Main results:�� “Financial repression” was most successful “Financial repression” was most successful
in liquidating debts when accompanied by a in liquidating debts when accompanied by a steady dose of inflation.steady dose of inflation.
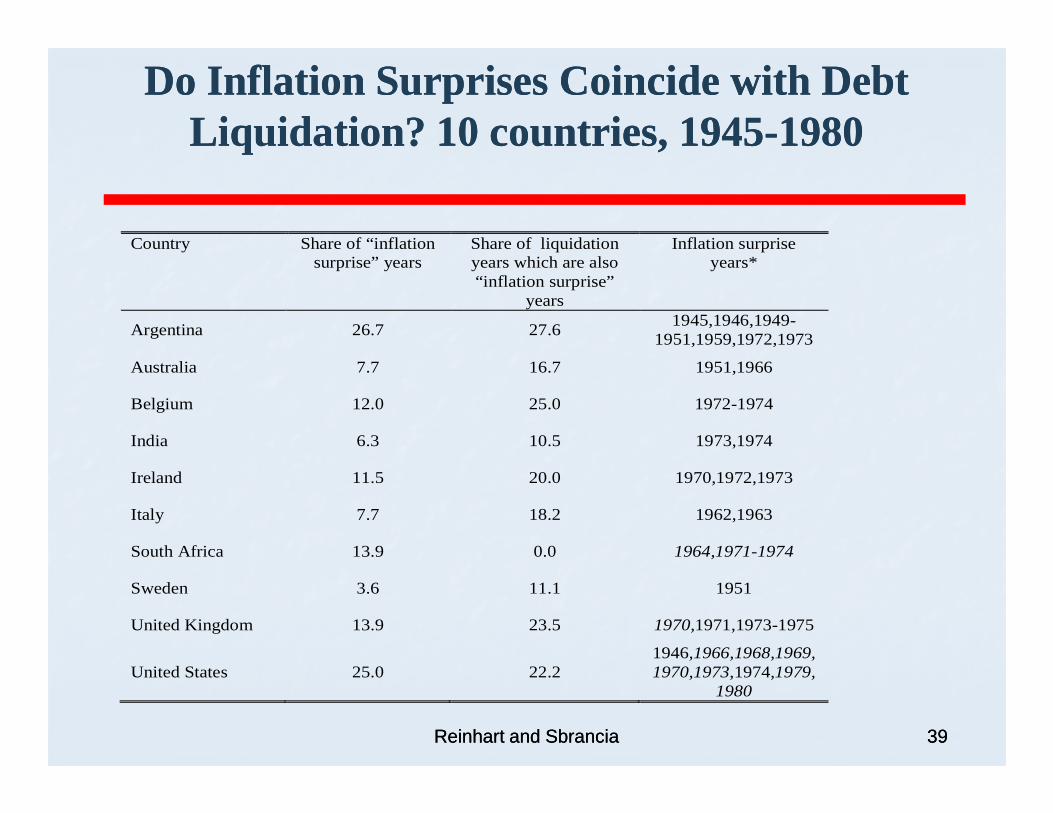
�� Inflation need not take market participants Inflation need not take market participants entirely by surprise and, in effect, it need entirely by surprise and, in effect, it need entirely by surprise and, in effect, it need entirely by surprise and, in effect, it need not be very high (by historic standards). not be very high (by historic standards). Indeed, there is little overlap between our Indeed, there is little overlap between our dating of inflation surprises and debt dating of inflation surprises and debt reduction in our sample.reduction in our sample.
Reinhart and SbranciaReinhart and Sbrancia 77
““ Some people will think the 2 ¾ Some people will think the 2 ¾ nonmarketable bond is a trick issue. nonmarketable bond is a trick issue. We want to meet that head on. It is. We want to meet that head on. It is. It is an attempt to lock up as much It is an attempt to lock up as much as possible of these longeras possible of these longer--term term issues.”issues.”issues.”issues.”
Assistant Secretary of the Treasury William Assistant Secretary of the Treasury William McChesneyMcChesney Martin Jr.Martin Jr.
FOMC minutes, March 1FOMC minutes, March 1--2, 19512, 1951
Remarks on the 1951 conversion of shortRemarks on the 1951 conversion of short--term marketable US Treasury debts for 29term marketable US Treasury debts for 29--year nonyear non--marketable bonds. Mr. Martin was marketable bonds. Mr. Martin was subsequently Chairman of the Board of subsequently Chairman of the Board of Governors, 1951Governors, 1951--1970.1970. 88
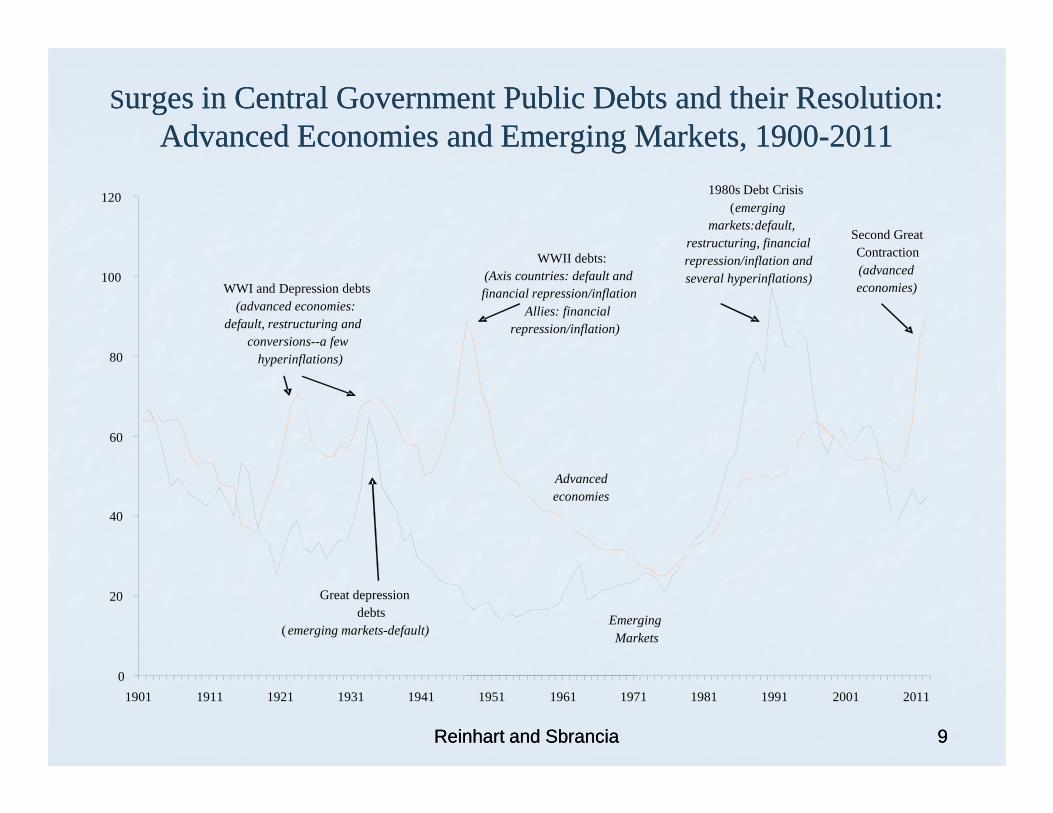
SSurges in Central Government Public Debts and their Resolution: urges in Central Government Public Debts and their Resolution: Advanced Economies and Emerging Markets, 1900Advanced Economies and Emerging Markets, 1900--20112011
80
100
120
WWI and Depression debts(advanced economies:
default, restructuring and conversions--a few
hyperinflations)
WWII debts:(Axis countries: default and financial repression/inflation
Allies: financial repression/inflation)
1980s Debt Crisis(emerging
markets:default, restructuring, financial repression/inflation and several hyperinflations)
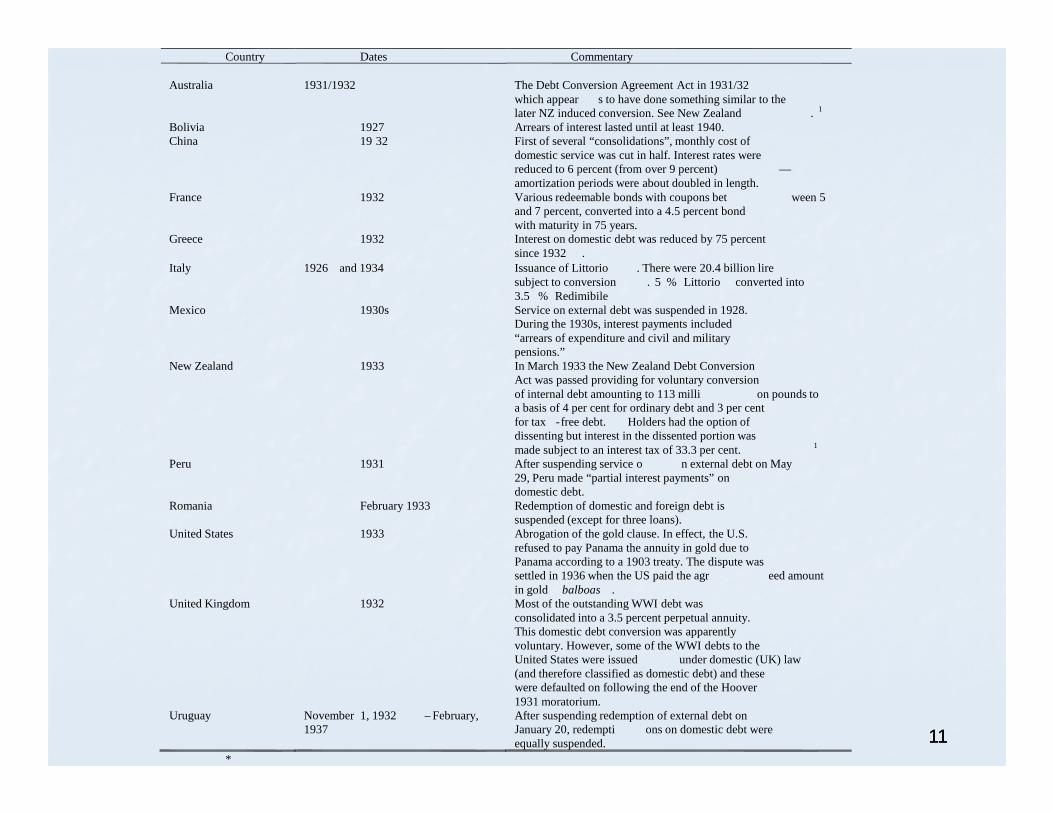
Australia 1931/1932 The Debt Conversion Agreement Act in 1931/32 which appear s to have done something similar to the later NZ induced conversion. See New Zealand . 1
Bolivia 1927 Arrears of interest lasted until at least 1940.China 19 32 First of several “consolidations”, monthly cost of
domestic service was cut in half. Interest rates were reduced to 6 percent (from over 9 percent) —amortization periods were about doubled in length.
France 1932 Various redeemable bonds with coupons bet ween 5 and 7 percent, converted into a 4.5 percent bond with maturity in 75 years.
Greece 1932 Interest on domestic debt was reduced by 75 percent since 1932 .
Italy 1926 and 1934 Issuance of Littorio . There were 20.4 billion lire subject to conversion . 5 % Littorio converted into 3.5 % Redimibile
Mexico 1930s Service on external debt was suspended in 1928. During the 1930s, interest payments included “arrears of expenditure and civil and military pensions.”
New Zealand 1933 In March 1933 the New Zealand Debt Conversion Act was passed providing for voluntary conversion of internal debt amounting to 113 milli on pounds to a basis of 4 per cent for ordinary debt and 3 per cent
1111
a basis of 4 per cent for ordinary debt and 3 per cent for tax -free debt. Holders had the option of dissenting but interest in the dissented portion was made subject to an interest tax of 33.3 per cent. 1
Peru 1931 After suspending service o n external debt on May 29, Peru made “partial interest payments” on domestic debt.
Romania February 1933 Redemption of domestic and foreign debt is suspended (except for three loans).
United States 1933 Abrogation of the gold clause. In effect, the U.S. refused to pay Panama the annuity in gold due to Panama according to a 1903 treaty. The dispute was settled in 1936 when the US paid the agr eed amount in gold balboas .
United Kingdom 1932 Most of the outstanding WWI debt was consolidated into a 3.5 percent perpetual annuity. This domestic debt conversion was apparently voluntary. However, some of the WWI debts to the United States were issued under domestic (UK) law (and therefore classified as domestic debt) and these were defaulted on following the end of the Hoover 1931 moratorium.
Uruguay November 1, 1932 – February, 1937
After suspending redemption of external debt on January 20, redempti ons on domestic debt were equally suspended.
*
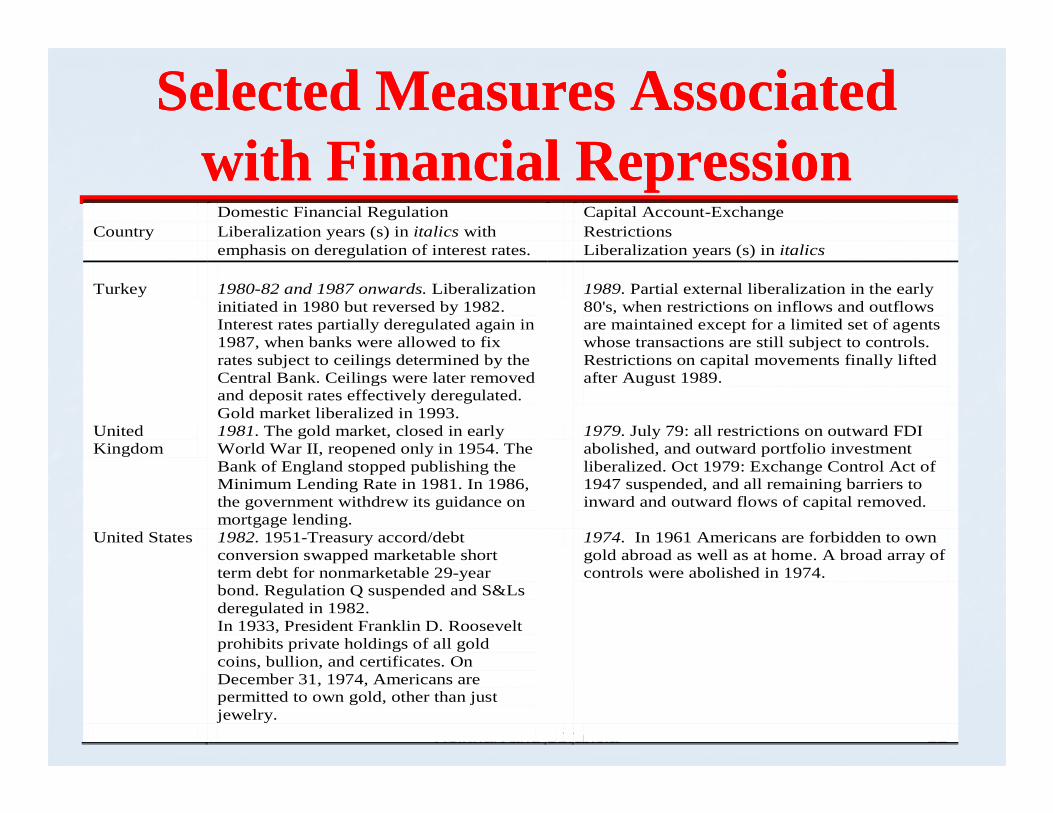
Selected Measures Associated Selected Measures Associated with Financial Repression with Financial Repression
Domestic Financial Regulation Capital Account-Exchange Country Liberalization years (s) in italics with Restrictions
emphasis on deregulation of interest rates. Liberalization years (s) in italics
Turkey 1980-82 and 1987 onwards. Liberalization initiated in 1980 but reversed by 1982. Interest rates partially deregulated again in 1987, when banks were allowed to fix rates subject to ceilings determined by the Central Bank. Ceilings were later removed and deposit rates effectively deregulated. Gold market liberalized in 1993.
1989. Partial external liberalization in the early 80's, when restrictions on inflows and outflows are maintained except for a limited set of agents whose transactions are still subject to controls. Restrictions on capital movements finally lifted after August 1989.
Reinhart and Reinhart and SbranciaSbrancia 1212
Gold market liberalized in 1993. United Kingdom
1981. The gold market, closed in early World War II, reopened only in 1954. The Bank of England stopped publishing the Minimum Lending Rate in 1981. In 1986, the government withdrew its guidance on mortgage lending.
1979. July 79: all restrictions on outward FDI abolished, and outward portfolio investment liberalized. Oct 1979: Exchange Control Act of 1947 suspended, and all remaining barriers to inward and outward flows of capital removed.
United States 1982. 1951-Treasury accord/debt conversion swapped marketable short term debt for nonmarketable 29-year bond. Regulation Q suspended and S&Ls deregulated in 1982. In 1933, President Franklin D. Roosevelt prohibits private holdings of all gold coins, bullion, and certificates. On December 31, 1974, Americans are permitted to own gold, other than just jewelry.
1974. In 1961 Americans are forbidden to own gold abroad as well as at home. A broad array of controls were abolished in 1974.
Real Interest RatesReal Interest Rates
Reinhart and SbranciaReinhart and Sbrancia 1313
Average ExAverage Ex--post Real Rate on Treasury Bills: Advanced post Real Rate on Treasury Bills: Advanced Economies and Emerging Markets, 1945Economies and Emerging Markets, 1945--2009 (32009 (3--year moving year moving
1414Reinhart and SbranciaReinhart and Sbrancia 1414-15.0
-10.0
-5.0
0.0
`
Financial Repression Era
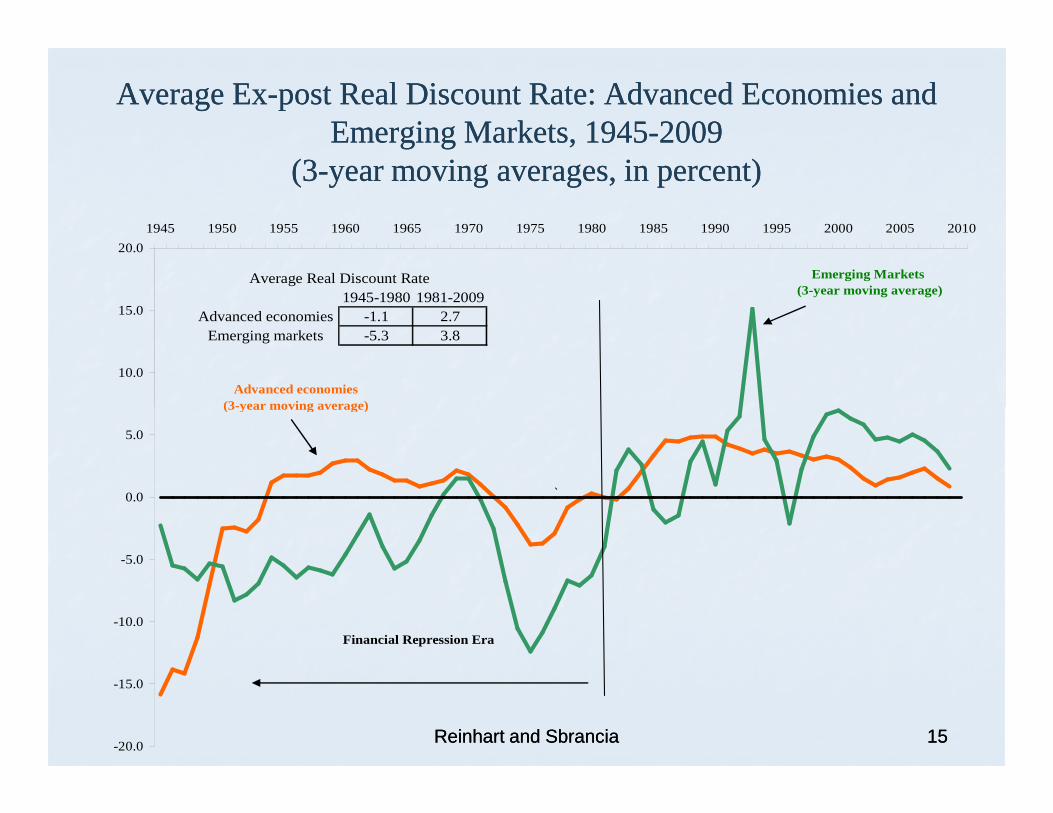
Average ExAverage Ex--post Real Discount Rate: Advanced Economies and post Real Discount Rate: Advanced Economies and Emerging Markets, 1945Emerging Markets, 1945--2009 2009
(3(3--year moving averages, in percent)year moving averages, in percent)
Reinhart and SbranciaReinhart and Sbrancia 1515-20.0
-15.0
-10.0
-5.0
0.0
5.0
`
(3-year moving average)
Financial Repression Era
Average ExAverage Ex--post Real Interest Rates on Deposits: Advanced post Real Interest Rates on Deposits: Advanced Economies and Emerging Markets, 1945Economies and Emerging Markets, 1945--2009 (32009 (3--year year
moving averages, in percent)moving averages, in percent)
End-of-year effective reserve requirements ratios are calculated (see entry under Brock). The authors calculate how i mportant a share of seignorage is accounted for by the reserve requirement tax.
32 advanced and emerging market economies 1980 -1991.
Reserve ratios are higher for emerging markets. Among the advanced economies the highest share of seignorageaccounted for by reserve ratios is Italy over this period. For the emerging markets, Chile and Peru have the highest readings.
Beim and Calomiris (2001)
Six measures (real interest rates, reserve ratio, liquidity, private borrowing, bank lending, and stock market capi talization) of financial repression are used to construct an aggregate index. Their aim is to provide a broad-brush cross-
All countries, advanced and emerging -datapermitting. The most comprehensive coverage is for 1997. The annual indices are reported for 1970 and for 1990 for a
Based on the cross -sectional evidence , the authors conclude that financial development (the opposite of repression) contributes importantly to economic
Reinhart and SbranciaReinhart and Sbrancia 2222
provide a broad-brush cross-country comparison at a particular point in time —not a “tax equivalent” to the government.
1970 and for 1990 for a subset of countries. The period of heaviest repression 1945 -early 1970s is not part of the analysis.
importantly to economic development and growth.
Brock (1989) End-of-year effective reserve requirements ratios are calculated as base money less currency in circulation (central bank reserves) divided broad money (or money plus quasi -money). Looks at the correlation between inflation rates and the reserve ratio.
41 advanced and emerging market economies 1960 -1984.
Reserve ratios are higher for emerging markets. Among the advanced economies these are highest for Australia and Italy over this period. A positive relationship between inflation and reserve requirements is mostly present in the chronic high inflation countries of Africa and Latin America.
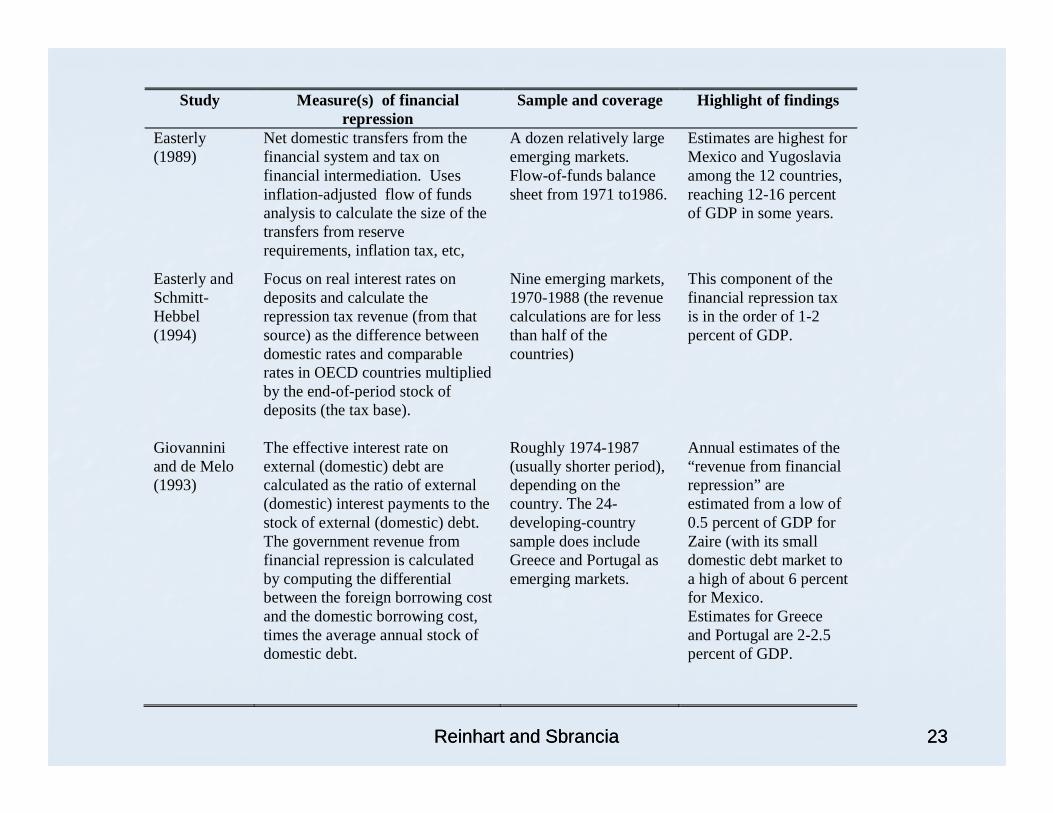
Study Measure(s) of financial repression
Sample and coverage Highlight of findings
Easterly (1989)
Net domestic transfers from the financial system and tax on financial intermediation. Uses inflation-adjusted flow of funds analysis to calculate the size of the transfers from reserve requirements, inflation tax, etc,
A dozen relatively large emerging markets. Flow-of-funds balance sheet from 1971 to1986.
Estimates are highest for Mexico and Yugoslavia among the 12 countries, reaching 12-16 percent of GDP in some years.
Easterly and Schmitt-Hebbel (1994)
Focus on real interest rates on deposits and calculate the repression tax revenue (from that source) as the difference between domestic rates and comparable rates in OECD countries multiplied by the end-of-period stock of deposits (the tax base).
Nine emerging markets, 1970-1988 (the revenue calculations are for less than half of the countries)
This component of the financial repression tax is in the order of 1-2 percent of GDP.
2323Reinhart and SbranciaReinhart and Sbrancia
deposits (the tax base).
Giovannini and de Melo (1993)
The effective interest rate on external (domestic) debt are calculated as the ratio of external (domestic) interest payments to the stock of external (domestic) debt. The government revenue from financial repression is calculated by computing the differential between the foreign borrowing cost and the domestic borrowing cost, times the average annual stock of domestic debt.
Roughly 1974-1987 (usually shorter period), depending on the country. The 24- developing-country sample does include Greece and Portugal as emerging markets.
Annual estimates of the “revenue from financial repression” are estimated from a low of 0.5 percent of GDP for Zaire (with its small domestic debt market to a high of about 6 percent for Mexico. Estimates for Greece and Portugal are 2-2.5 percent of GDP.
The Liquidation of The Liquidation of government debt:government debt:
Conceptual issues
Reinhart and SbranciaReinhart and Sbrancia 2424
Data requirementsData requirements
Differences in coupon rates, maturity and the distribution of marketable and nonmarketable debt, securitized debt versus loans from financial institutions, shape the cost of debt financing for the government. cost of debt financing for the government. There is no “single” government interest rate that is appropriate to apply to a hybrid debt stock. A reconstruction of the government’s debt profile over time is required.
Reinhart and SbranciaReinhart and Sbrancia 2525
The core sampleThe core sample
Government’s debt profiles for 10 countries: Argentina, Australia, Belgium, India, Ireland, Italy, South Africa, Sweden, the United Kingdom, Africa, Sweden, the United Kingdom, and the United States. These were constructed from primary sources over the period 1945-1990 where possible or over shorter intervals (determined by data availability).
Reinhart and Reinhart and SbranciaSbrancia 2626
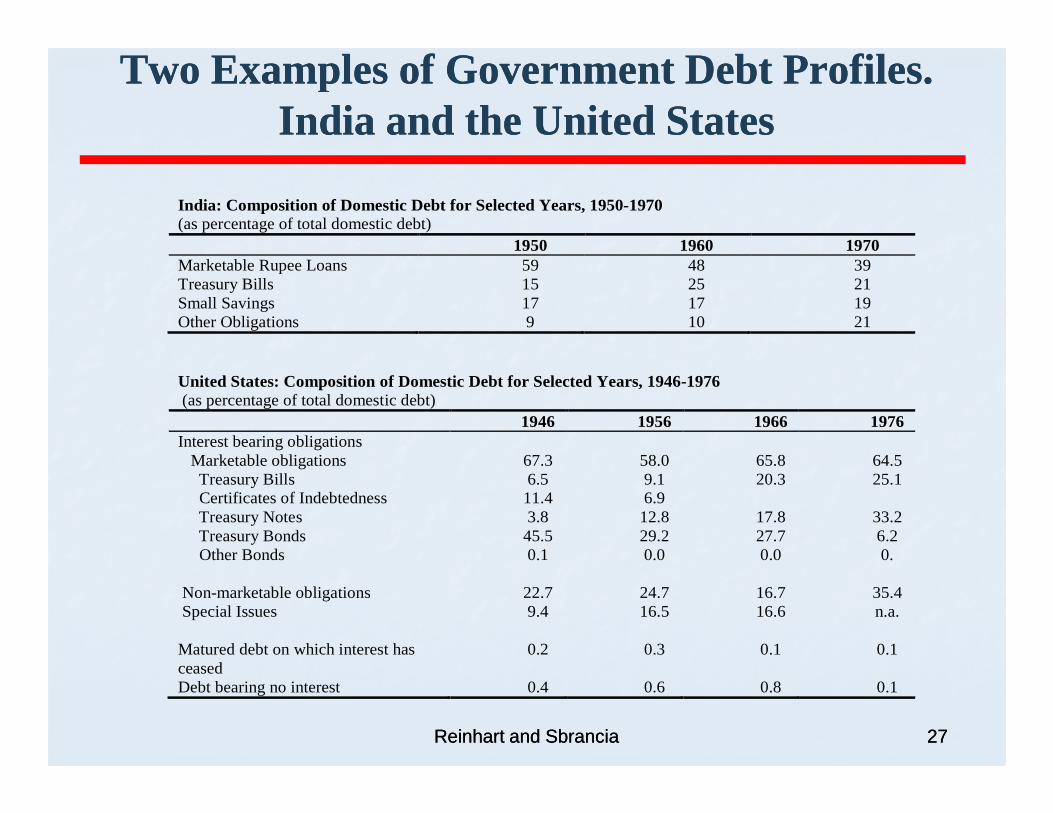
Two Examples of Government Debt Profiles. Two Examples of Government Debt Profiles. India and the United StatesIndia and the United States
India: Composition of Domestic Debt for Selected Years, 1950-1970 (as percentage of total domestic debt)
Non-marketable obligations 22.7 24.7 16.7 35.4 Special Issues
9.4 16.5 16.6 n.a.
Matured debt on which interest has ceased
0.2 0.3 0.1 0.1
Debt bearing no interest 0.4 0.6 0.8 0.1
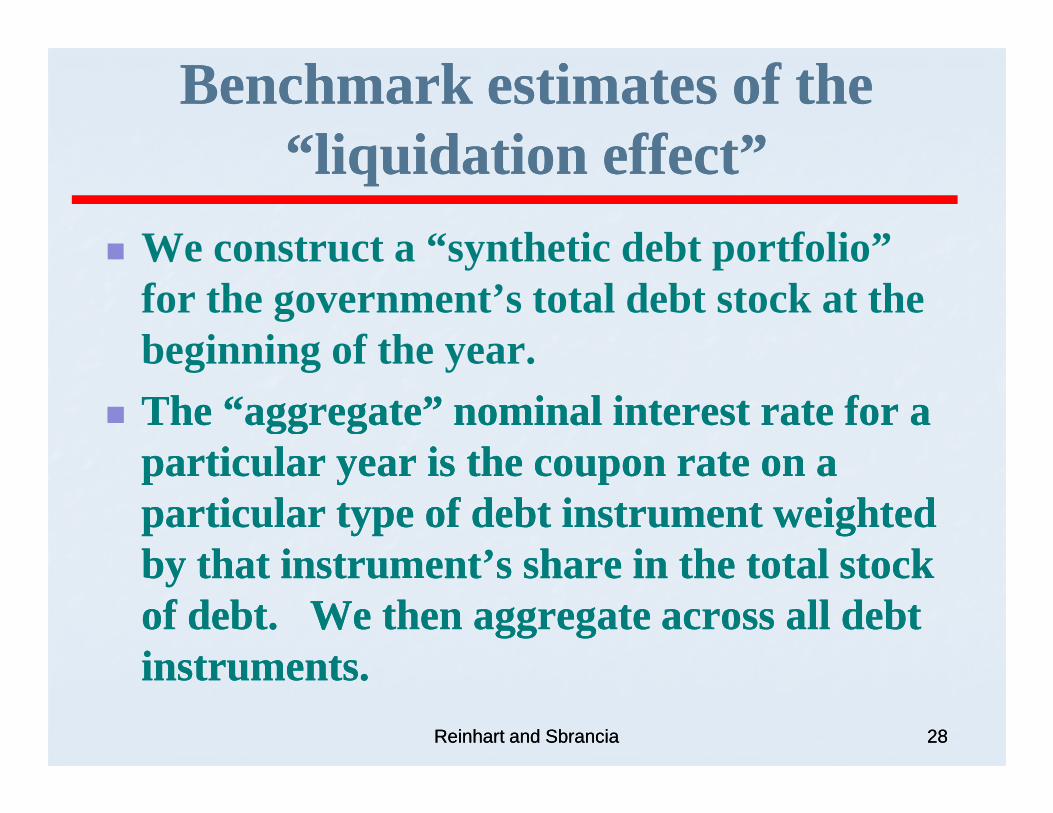
Benchmark estimates of the Benchmark estimates of the “liquidation effect”“liquidation effect”
� We construct a “synthetic debt portfolio” for the government’s total debt stock at the beginning of the year.
�� The “aggregate” nominal interest rate for a The “aggregate” nominal interest rate for a �� The “aggregate” nominal interest rate for a The “aggregate” nominal interest rate for a particular year is the coupon rate on a particular year is the coupon rate on a particular type of debt instrument weighted particular type of debt instrument weighted by that instrument’s share in the total stock by that instrument’s share in the total stock of debt. We then aggregate across all debt of debt. We then aggregate across all debt instruments.instruments.
Reinhart and SbranciaReinhart and Sbrancia 2828
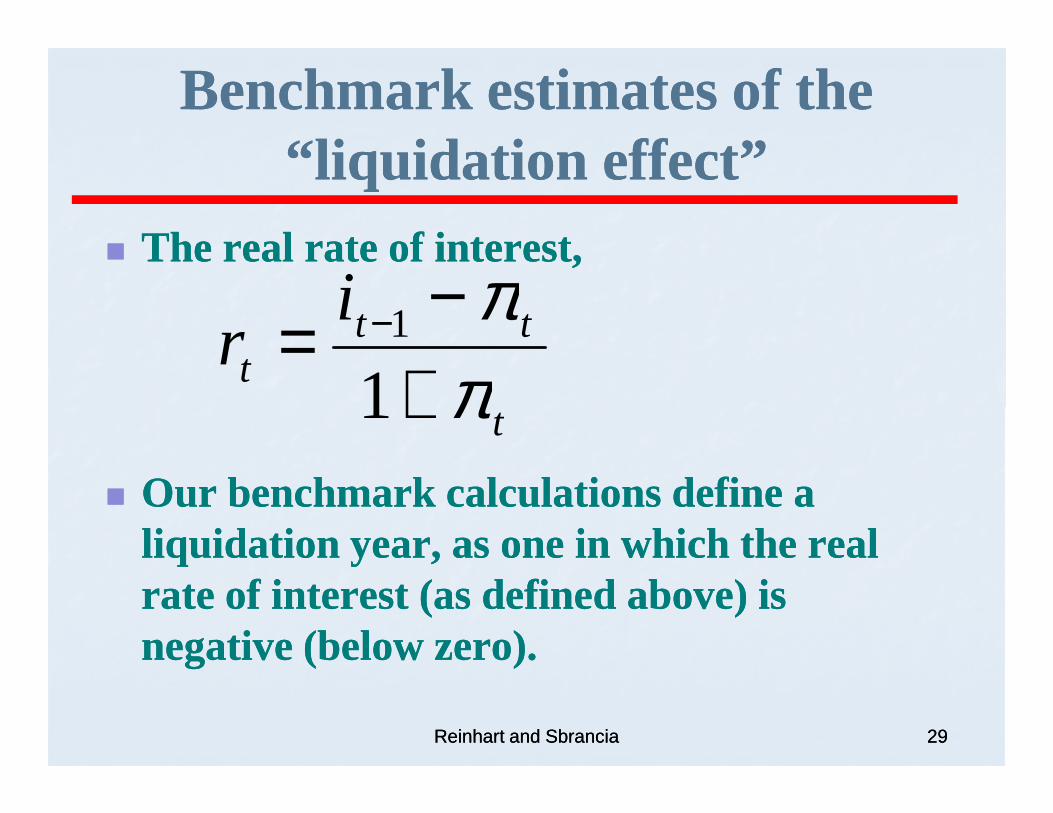
�� The real rate of interest, The real rate of interest,
t
ttt
ir
ππ
+−
= −
11
Benchmark estimates of the Benchmark estimates of the “liquidation effect”“liquidation effect”
�� Our benchmark calculations define a Our benchmark calculations define a liquidation year, as one in which the real liquidation year, as one in which the real rate of interest (as defined above) is rate of interest (as defined above) is negative (below zero).negative (below zero).
Reinhart and SbranciaReinhart and Sbrancia 2929
tπ+1
Benchmark estimates of the Benchmark estimates of the “liquidation effect”“liquidation effect”
� The saving (or “revenue”) to the government or the “liquidation effect” or the “financial repression tax” is the real “financial repression tax” is the real (negative) interest rate times the “tax base,” which is the stock of domestic government debt outstanding.
Reinhart and SbranciaReinhart and Sbrancia 3030
Two Examples of Effective Nominal Interest Two Examples of Effective Nominal Interest Rates on Public Debt: Rates on Public Debt:
India and the United StatesIndia and the United StatesIndia, 1949-1980
15.0
20.0
25.0
30.0
Inflation
-15.0
-10.0
-5.0
0.0
5.0
10.0
15.0
1949 1954 1959 1964 1969 1974 1979
Effective nominal interest rate on public debt
3131Reinhart and SbranciaReinhart and Sbrancia
Two Examples of Effective Nominal Interest Two Examples of Effective Nominal Interest Rates on Public Debt: Rates on Public Debt:
India and the United StatesIndia and the United StatesUnited States, 1945-1980
7.9
9.9
11.9
13.9
Inflation
3232Reinhart and SbranciaReinhart and Sbrancia
-0.1
1.9
3.9
5.9
7.9
1945 1950 1955 1960 1965 1970 1975 1980
Effective nominal interest rate on public debt
The Liquidation of The Liquidation of government debt:government debt:government debt:government debt:
Empirical estimates
Reinhart and SbranciaReinhart and Sbrancia 3333
Incidence of Liquidation Years for Different Real Incidence of Liquidation Years for Different Real Interest Rate Thresholds: Interest Rate Thresholds:
United Kingdom3 215.6 138.2 246.9 4.5 5.9 United States 116.0 66.2 141.4 6.3 4.2
Inflation surprises and its Inflation surprises and its broader role in debt broader role in debt
reductionreductionreductionreduction
Reinhart and SbranciaReinhart and Sbrancia 3737
Because we do not have a direct measure of Because we do not have a direct measure of inflation expectations for much of the sample, we inflation expectations for much of the sample, we define inflation bursts or “surprises” in a more define inflation bursts or “surprises” in a more mechanical, exmechanical, ex--post manner. post manner.
Specifically, we calculate a tenSpecifically, we calculate a ten--year moving average year moving average for inflation and classify those years in which for inflation and classify those years in which inflation was more than twoinflation was more than two--standard deviations standard deviations above the 10above the 10--year average as an “inflation year average as an “inflation above the 10above the 10--year average as an “inflation year average as an “inflation burst/surprise year”. burst/surprise year”.
As the 10As the 10--year window may be arbitrarily too year window may be arbitrarily too backward looking, we also perform the backward looking, we also perform the comparable exercise using a fivecomparable exercise using a five--year moving year moving average.average.
Reinhart and SbranciaReinhart and Sbrancia 3838
Do Inflation Surprises Coincide with Debt Do Inflation Surprises Coincide with Debt Liquidation? 10 countries, 1945Liquidation? 10 countries, 1945--19801980
Country Share of “inflation surprise” years
Share of liquidation years which are also “inflation surprise”
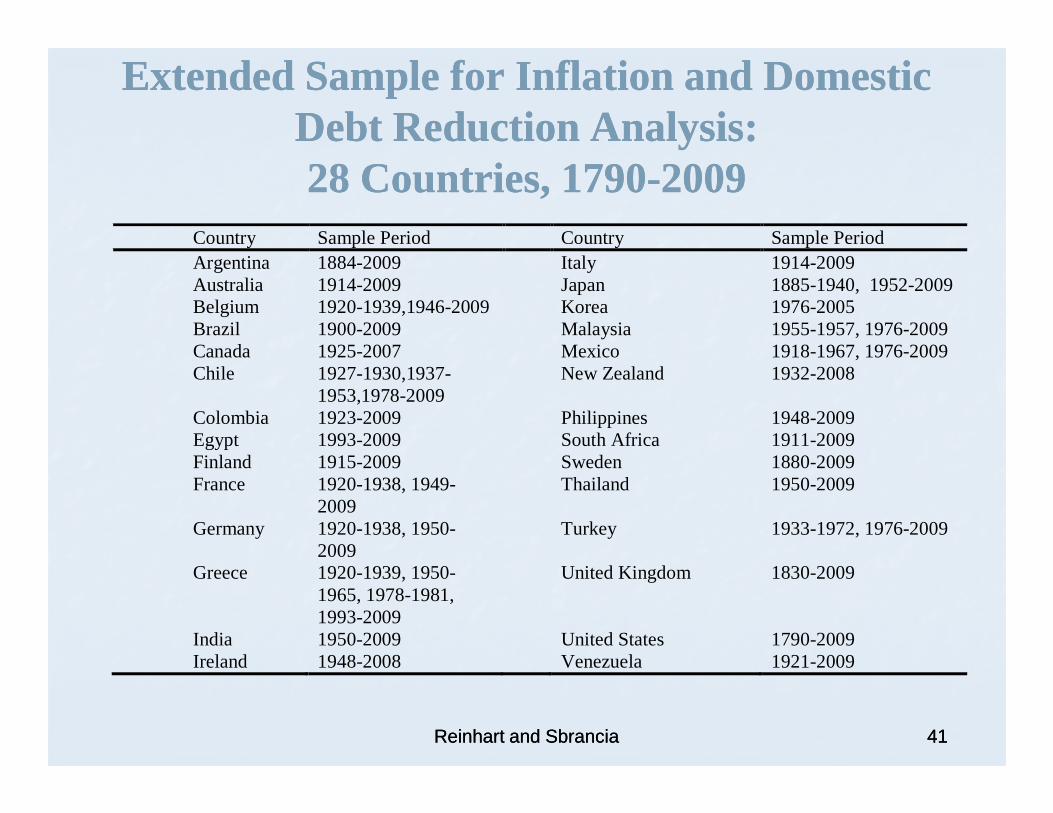
Extended Sample for Inflation and Domestic Extended Sample for Inflation and Domestic Debt Reduction Analysis: Debt Reduction Analysis: 28 Countries, 179028 Countries, 1790--20092009
Country Sample Period Country Sample Period Argentina 1884-2009 Italy 1914-2009 Australia 1914-2009 Japan 1885-1940, 1952-2009 Belgium 1920-1939,1946-2009 Korea 1976-2005 Brazil 1900-2009 Malaysia 1955-1957, 1976-2009 Canada 1925-2007 Mexico 1918-1967, 1976-2009 Chile 1927-1930,1937-
1953,1978-2009 New Zealand 1932-2008
Colombia 1923-2009 Philippines 1948-2009
Reinhart and SbranciaReinhart and Sbrancia 4141
Colombia 1923-2009 Philippines 1948-2009 Egypt 1993-2009 South Africa 1911-2009 Finland 1915-2009 Sweden 1880-2009 France 1920-1938, 1949-
2009 Thailand 1950-2009
Germany 1920-1938, 1950-2009
Turkey 1933-1972, 1976-2009
Greece 1920-1939, 1950-1965, 1978-1981, 1993-2009
United Kingdom 1830-2009
India 1950-2009 United States 1790-2009 Ireland 1948-2008 Venezuela 1921-2009
The return of financial repression?The return of financial repression?
The collective buildup of public debts in the The collective buildup of public debts in the advanced economies during WWI was advanced economies during WWI was largely unwound through default in the largely unwound through default in the largely unwound through default in the largely unwound through default in the 1930s1930s
The even larger buildup in public debts of The even larger buildup in public debts of WWII was unwound partially through WWII was unwound partially through steady growthsteady growth--but, more importantly, but, more importantly, through “financial repression”through “financial repression”
Reinhart and SbranciaReinhart and Sbrancia 4343
The return of financial repression?The return of financial repression?
To deal with the current debt overhang, To deal with the current debt overhang, similar policies to those documented here similar policies to those documented here may remay re--emerge in the guise of prudential emerge in the guise of prudential regulation rather than under the politically regulation rather than under the politically incorrect label of financial repression. incorrect label of financial repression. incorrect label of financial repression. incorrect label of financial repression.
Moreover, the process where debts are being Moreover, the process where debts are being “placed” at below market interest rates in “placed” at below market interest rates in pension funds and other more captive pension funds and other more captive domestic financial institutions is already domestic financial institutions is already under way in several countries in Europe. under way in several countries in Europe.