The liquid–glass transition in sugars: Relaxation dynamics in trehalose Herman Z. Cummins a, * , Hepeng Zhang a,1 , Jiyoung Oh b , Jeong-Ah Seo b , Hyung Kook Kim b , Yoon-Hwae Hwang b , Y.S. Yang c , Yun Sik Yu d , Yongwoo Inn e a Department of Physics, City College of CUNY, New York, NY 10031, United States b Research Center for Dielectric and Advanced Matter Physics and Department of Physics, Pusan National University, Busan 609-735, South Korea c Institute of Nanoscience and Technology, Pusan National University, Busan 609-735, South Korea d Department of Physics, Dongeui University, Busan, South Korea e Department of Chemical Engineering, City College of CUNY, New York, NY 10031, United States Available online 29 September 2006 Abstract The liquid–glass transition in the disaccharide sugar trehalose mixed with small amounts of water was studied with calorimetry, pho- ton correlation spectroscopy, Brillouin scattering, dielectric spectroscopy, and rheology measurements. Trehalose is of particular interest among the sugars because of its importance in biology, biochemistry, and the pharmaceutical industry, due to its ability to protect organ- isms, proteins, or membranes during dehydration (anhydrobiosis). Preliminary results of these experiments are presented and compared with each other and with previously published data on this material. Ó 2006 Elsevier B.V. All rights reserved. PACS: 81.05.Kf; 06.60.Ei; 65.60.+a; 78.35.+c Keywords: Brillouin scattering; Dielectric properties; Relaxation, electric modulus; Glass transition; Calorimetry; Rheology; Structural relaxation 1. Introduction Studies of the liquid–glass transition in glassforming molecular liquids such as orthoterphenyl, propylene car- bonate, glycerol, salol, and metatoluidine with a variety of experimental techniques have been used extensively to test theories of the liquid–glass transition. One group of molecular glassforming materials that has received rela- tively little attention is the sugars, a subset of the carbohy- drates. These include the monosaccharides (glucose, sorbose, mannose, galactose, and fructose), the disaccha- rides (sucrose, lactose, maltose, and trehalose), and various higher polysaccharides. the structure of two important monosaccharides, glucose and fructose, and two important disaccharides, sucrose and trehalose, are shown in Fig. 1 [1]. Glucose, the body’s main energy source, can exist in either the chain or ring form. Sucrose is composed of one glucose ring and one fructose ring, while trehalose contains two linked glucose rings. There have been many calorimet- ric studies of sugars designed to determine their glass-tran- sition temperatures T G [2–8], but there have been relatively few studies of the dynamics of either the liquid or glassy states of these materials. The glass transition in sugars is important for several reasons. First, although water is obviously necessary for life, some organisms are able to withstand very low temper- atures (cryopreservation) or to survive almost complete 0022-3093/$ - see front matter Ó 2006 Elsevier B.V. All rights reserved. doi:10.1016/j.jnoncrysol.2006.02.182 * Corresponding author. Tel.: +212 650 6921; fax: +212 650 6923. E-mail address: [email protected](H.Z. Cummins). 1 Present address: Center for Nonlinear Dynamics, University of Texas at Austin, Austin, TX 78712-0264, United States. www.elsevier.com/locate/jnoncrysol Journal of Non-Crystalline Solids 352 (2006) 4464–4474
Transcript
www.elsevier.com/locate/jnoncrysol
Journal of Non-Crystalline Solids 352 (2006) 4464–4474
The liquid–glass transition in sugars: Relaxationdynamics in trehalose
Herman Z. Cummins a,*, Hepeng Zhang a,1, Jiyoung Oh b,Jeong-Ah Seo b, Hyung Kook Kim b, Yoon-Hwae Hwang b,
Y.S. Yang c, Yun Sik Yu d, Yongwoo Inn e
a Department of Physics, City College of CUNY, New York, NY 10031, United Statesb Research Center for Dielectric and Advanced Matter Physics and Department of Physics,
Pusan National University, Busan 609-735, South Koreac Institute of Nanoscience and Technology, Pusan National University, Busan 609-735, South Korea
d Department of Physics, Dongeui University, Busan, South Koreae Department of Chemical Engineering, City College of CUNY, New York, NY 10031, United States
Available online 29 September 2006
Abstract
The liquid–glass transition in the disaccharide sugar trehalose mixed with small amounts of water was studied with calorimetry, pho-ton correlation spectroscopy, Brillouin scattering, dielectric spectroscopy, and rheology measurements. Trehalose is of particular interestamong the sugars because of its importance in biology, biochemistry, and the pharmaceutical industry, due to its ability to protect organ-isms, proteins, or membranes during dehydration (anhydrobiosis). Preliminary results of these experiments are presented and comparedwith each other and with previously published data on this material.� 2006 Elsevier B.V. All rights reserved.
Studies of the liquid–glass transition in glassformingmolecular liquids such as orthoterphenyl, propylene car-bonate, glycerol, salol, and metatoluidine with a varietyof experimental techniques have been used extensively totest theories of the liquid–glass transition. One group ofmolecular glassforming materials that has received rela-tively little attention is the sugars, a subset of the carbohy-drates. These include the monosaccharides (glucose,sorbose, mannose, galactose, and fructose), the disaccha-
0022-3093/$ - see front matter � 2006 Elsevier B.V. All rights reserved.
1 Present address: Center for Nonlinear Dynamics, University of Texasat Austin, Austin, TX 78712-0264, United States.
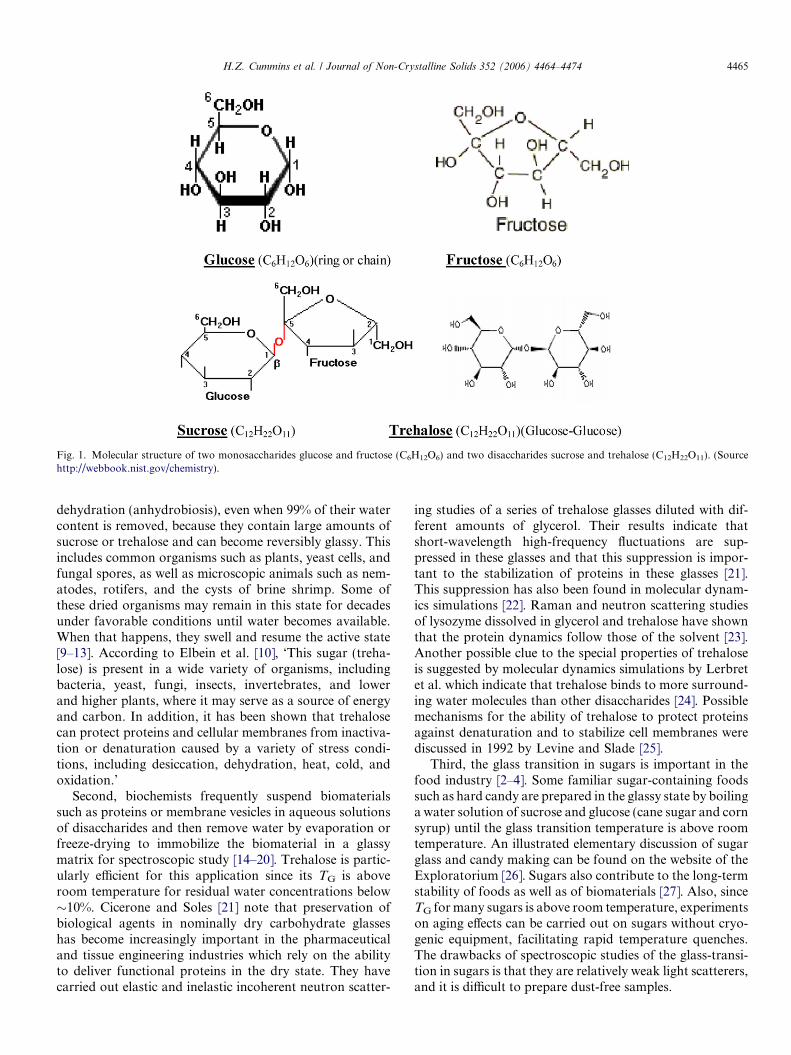
rides (sucrose, lactose, maltose, and trehalose), and varioushigher polysaccharides. the structure of two importantmonosaccharides, glucose and fructose, and two importantdisaccharides, sucrose and trehalose, are shown in Fig. 1[1]. Glucose, the body’s main energy source, can exist ineither the chain or ring form. Sucrose is composed of oneglucose ring and one fructose ring, while trehalose containstwo linked glucose rings. There have been many calorimet-ric studies of sugars designed to determine their glass-tran-sition temperatures TG [2–8], but there have been relativelyfew studies of the dynamics of either the liquid or glassystates of these materials.
The glass transition in sugars is important for severalreasons. First, although water is obviously necessary forlife, some organisms are able to withstand very low temper-atures (cryopreservation) or to survive almost complete
Fig. 1. Molecular structure of two monosaccharides glucose and fructose (C6H12O6) and two disaccharides sucrose and trehalose (C12H22O11). (Sourcehttp://webbook.nist.gov/chemistry).
H.Z. Cummins et al. / Journal of Non-Crystalline Solids 352 (2006) 4464–4474 4465
dehydration (anhydrobiosis), even when 99% of their watercontent is removed, because they contain large amounts ofsucrose or trehalose and can become reversibly glassy. Thisincludes common organisms such as plants, yeast cells, andfungal spores, as well as microscopic animals such as nem-atodes, rotifers, and the cysts of brine shrimp. Some ofthese dried organisms may remain in this state for decadesunder favorable conditions until water becomes available.When that happens, they swell and resume the active state[9–13]. According to Elbein et al. [10], ‘This sugar (treha-lose) is present in a wide variety of organisms, includingbacteria, yeast, fungi, insects, invertebrates, and lowerand higher plants, where it may serve as a source of energyand carbon. In addition, it has been shown that trehalosecan protect proteins and cellular membranes from inactiva-tion or denaturation caused by a variety of stress condi-tions, including desiccation, dehydration, heat, cold, andoxidation.’
Second, biochemists frequently suspend biomaterialssuch as proteins or membrane vesicles in aqueous solutionsof disaccharides and then remove water by evaporation orfreeze-drying to immobilize the biomaterial in a glassymatrix for spectroscopic study [14–20]. Trehalose is partic-ularly efficient for this application since its TG is aboveroom temperature for residual water concentrations below�10%. Cicerone and Soles [21] note that preservation ofbiological agents in nominally dry carbohydrate glasseshas become increasingly important in the pharmaceuticaland tissue engineering industries which rely on the abilityto deliver functional proteins in the dry state. They havecarried out elastic and inelastic incoherent neutron scatter-
ing studies of a series of trehalose glasses diluted with dif-ferent amounts of glycerol. Their results indicate thatshort-wavelength high-frequency fluctuations are sup-pressed in these glasses and that this suppression is impor-tant to the stabilization of proteins in these glasses [21].This suppression has also been found in molecular dynam-ics simulations [22]. Raman and neutron scattering studiesof lysozyme dissolved in glycerol and trehalose have shownthat the protein dynamics follow those of the solvent [23].Another possible clue to the special properties of trehaloseis suggested by molecular dynamics simulations by Lerbretet al. which indicate that trehalose binds to more surround-ing water molecules than other disaccharides [24]. Possiblemechanisms for the ability of trehalose to protect proteinsagainst denaturation and to stabilize cell membranes werediscussed in 1992 by Levine and Slade [25].
Third, the glass transition in sugars is important in thefood industry [2–4]. Some familiar sugar-containing foodssuch as hard candy are prepared in the glassy state by boilinga water solution of sucrose and glucose (cane sugar and cornsyrup) until the glass transition temperature is above roomtemperature. An illustrated elementary discussion of sugarglass and candy making can be found on the website of theExploratorium [26]. Sugars also contribute to the long-termstability of foods as well as of biomaterials [27]. Also, sinceTG for many sugars is above room temperature, experimentson aging effects can be carried out on sugars without cryo-genic equipment, facilitating rapid temperature quenches.The drawbacks of spectroscopic studies of the glass-transi-tion in sugars is that they are relatively weak light scatterers,and it is difficult to prepare dust-free samples.
4466 H.Z. Cummins et al. / Journal of Non-Crystalline Solids 352 (2006) 4464–4474
We have undertaken studies of a number of sugars andsugar mixtures including glucose, maltose, galactose, fruc-tose, sucrose, ribose, trehalose, glucose/sucrose, sucrose/trehalose, trehalose/maltose, sucrose/fructose (candyglass), and fructose/glucose using calorimetry (DTA andDSC), photon correlation spectroscopy, Brillouin scatter-ing, dielectric spectroscopy, rheology, and X-ray diffrac-tion, carried out in New York and Busan as part of aUS–Korea collaborative research project. The results ofsome of these studies are being reported separately[28,29]. In this communication, we present a preliminaryreport of our experiments on trehalose.
Previous studies of the dynamical properties of trehaloseinclude neutron scattering [21,30,31], Raman scattering[32], dielectric and infrared spectroscopy [33], dynamicalmechanical analysis [34], and molecular dynamics studies[35].
2. Experimental
Trehalose dihydrate (Pharma grade 99.99%, lot 1H061)was generously provided by Cargill Inc., Minneapolis,MN. (trehalose dihydrate contains 9.53% water by weight).Anhydrous trehalose (C12H22O11, mw 342.31, mp 97 �C) isa disaccharide composed of two linked glucose rings. Theglass transition temperature TG of anydrous trehalose is�114 �C [17]. It is well suited for optical studies since itis nonreducing and remains optically clear at relativelyhigh temperatures where many other sugars becomediscolored.
Samples of molecular liquids for light-scattering experi-ments are usually prepared by vacuum distillation. Forsugars, however, this method is not possible since dissocia-tion (or caramelization) occurs at relatively low tempera-tures. Simply melting sugar samples is also notappropriate since the resulting melts are invariably dusty.We therefore prepared samples by dissolving the trehalosedihydrate powder in hot purified water to make a solutionof typically �30% sugar concentration. The solution wasthen filtered at room temperature with a syringe fitted witha Millipore 0.1 lm millex filter to remove dust. The filtratewas then either heated in a Sartorius model MA100C mois-ture analyzer, or else placed in a beaker with a teflon-coated magnetic stir bar and boiled slowly on a stirringhot plate to remove water. The boiling temperature wasmeasured continuously during this procedure with a ther-mocouple thermometer. TB increases as the volumedecreases, slowly at first and then faster as the residualwater content decreases. When the desired final boilingtemperature was reached, the sample was removed fromthe hotplate, weighed to estimate the final water concentra-tion, and poured into sample cells.
For light scattering (Brillouin scattering or Photon Cor-relation Spectroscopy) experiments, the sample cells wereglass cylinders 16 mm in diameter and 16 mm high. Afterfilling, the cell was sealed with a plastic stopper and teflontape. It was then installed in a copper enclosure attached to
the cold finger of an Oxford DN1754 variable temperatureLN2 cryostat. The temperature inside the cryostat was con-trolled by an Oxford ITC4 temperature controller with a Ptresistance thermometer. For the experiments describedbelow, the typical boiling temperature was 126 �C, corre-sponding to a final water concentration of �9% and aglass-transition temperature TG � 30 �C.
2.1. Calibration
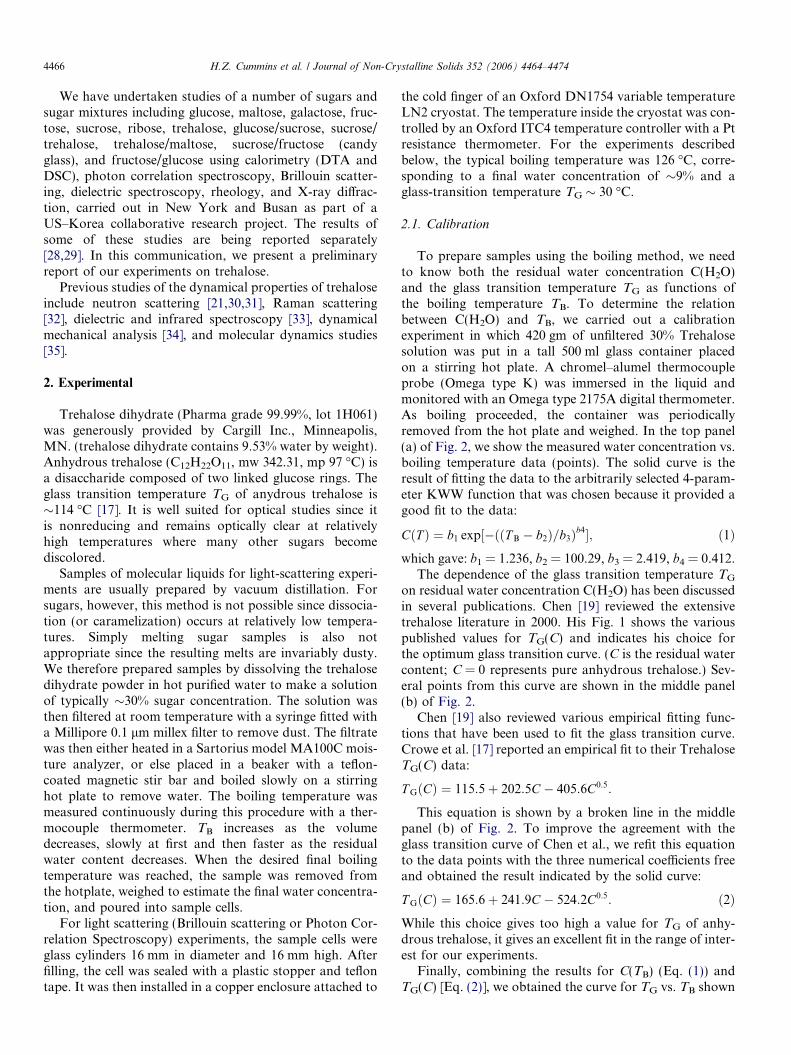
To prepare samples using the boiling method, we needto know both the residual water concentration C(H2O)and the glass transition temperature TG as functions ofthe boiling temperature TB. To determine the relationbetween C(H2O) and TB, we carried out a calibrationexperiment in which 420 gm of unfiltered 30% Trehalosesolution was put in a tall 500 ml glass container placedon a stirring hot plate. A chromel–alumel thermocoupleprobe (Omega type K) was immersed in the liquid andmonitored with an Omega type 2175A digital thermometer.As boiling proceeded, the container was periodicallyremoved from the hot plate and weighed. In the top panel(a) of Fig. 2, we show the measured water concentration vs.boiling temperature data (points). The solid curve is theresult of fitting the data to the arbitrarily selected 4-param-eter KWW function that was chosen because it provided agood fit to the data:
The dependence of the glass transition temperature TG
on residual water concentration C(H2O) has been discussedin several publications. Chen [19] reviewed the extensivetrehalose literature in 2000. His Fig. 1 shows the variouspublished values for TG(C) and indicates his choice forthe optimum glass transition curve. (C is the residual watercontent; C = 0 represents pure anhydrous trehalose.) Sev-eral points from this curve are shown in the middle panel(b) of Fig. 2.
Chen [19] also reviewed various empirical fitting func-tions that have been used to fit the glass transition curve.Crowe et al. [17] reported an empirical fit to their TrehaloseTG(C) data:
T GðCÞ ¼ 115:5þ 202:5C � 405:6C0:5:
This equation is shown by a broken line in the middlepanel (b) of Fig. 2. To improve the agreement with theglass transition curve of Chen et al., we refit this equationto the data points with the three numerical coefficients freeand obtained the result indicated by the solid curve:
T GðCÞ ¼ 165:6þ 241:9C � 524:2C0:5: ð2ÞWhile this choice gives too high a value for TG of anhy-drous trehalose, it gives an excellent fit in the range of inter-est for our experiments.
Finally, combining the results for C(TB) (Eq. (1)) andTG(C) [Eq. (2)], we obtained the curve for TG vs. TB shown
Fig. 2. (a) Water concentration (by weight) vs. boiling temperature TB for aqueous trehalose solutions, (b) Glass transition temperature TG vs. waterconcentration (from [19]). The lines are empirical fits discussed in the text, (c) TG vs. TB from the fits shown in (a) and (b).
H.Z. Cummins et al. / Journal of Non-Crystalline Solids 352 (2006) 4464–4474 4467
in the bottom panel (c) of Fig. 2. Given the uncertainty inthe glass transition curve, we assign an uncertainty of±5 �C to this result. For a sample prepared by boiling at126 �C, the predicted glass transition temperature wouldtherefore be TG = 30 ± 5 �C.
3. Results
3.1. Brillouin scattering
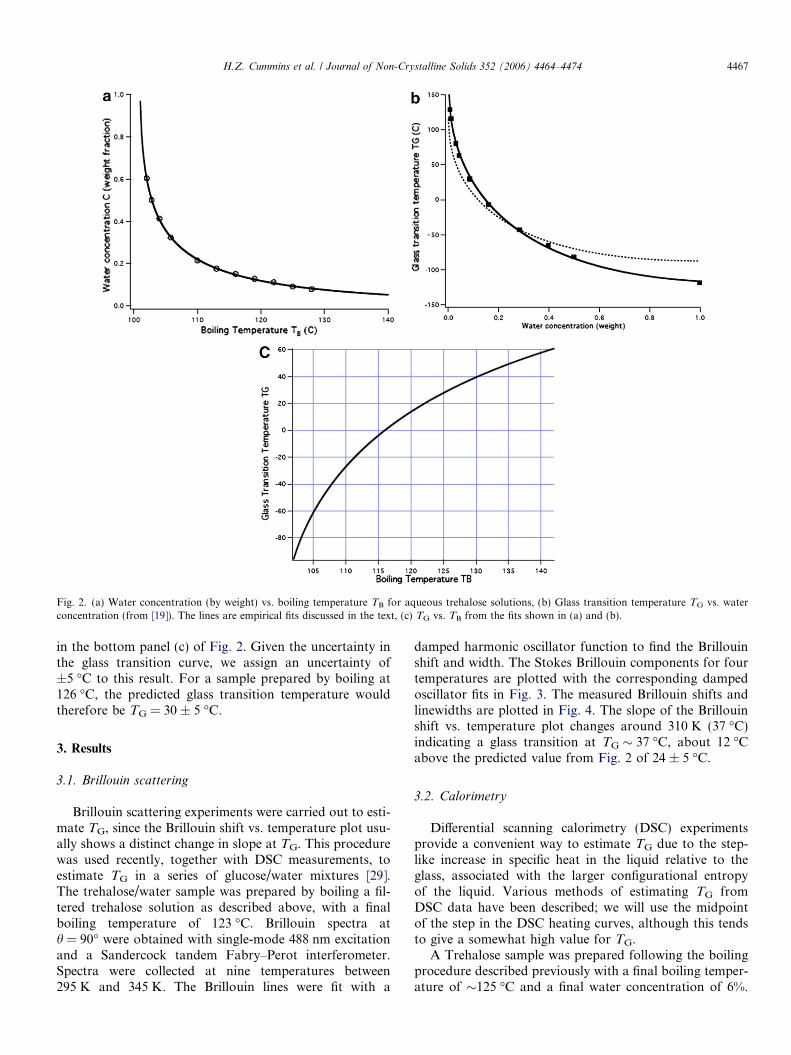
Brillouin scattering experiments were carried out to esti-mate TG, since the Brillouin shift vs. temperature plot usu-ally shows a distinct change in slope at TG. This procedurewas used recently, together with DSC measurements, toestimate TG in a series of glucose/water mixtures [29].The trehalose/water sample was prepared by boiling a fil-tered trehalose solution as described above, with a finalboiling temperature of 123 �C. Brillouin spectra ath = 90� were obtained with single-mode 488 nm excitationand a Sandercock tandem Fabry–Perot interferometer.Spectra were collected at nine temperatures between295 K and 345 K. The Brillouin lines were fit with a
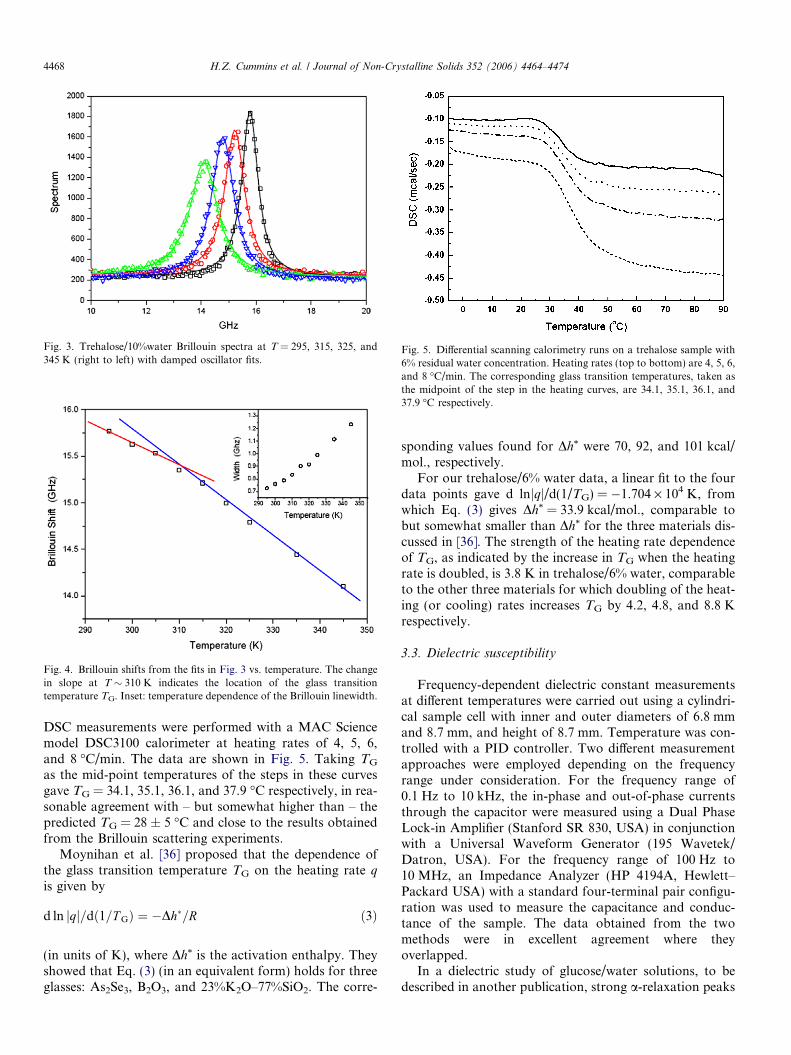
damped harmonic oscillator function to find the Brillouinshift and width. The Stokes Brillouin components for fourtemperatures are plotted with the corresponding dampedoscillator fits in Fig. 3. The measured Brillouin shifts andlinewidths are plotted in Fig. 4. The slope of the Brillouinshift vs. temperature plot changes around 310 K (37 �C)indicating a glass transition at TG � 37 �C, about 12 �Cabove the predicted value from Fig. 2 of 24 ± 5 �C.
3.2. Calorimetry
Differential scanning calorimetry (DSC) experimentsprovide a convenient way to estimate TG due to the step-like increase in specific heat in the liquid relative to theglass, associated with the larger configurational entropyof the liquid. Various methods of estimating TG fromDSC data have been described; we will use the midpointof the step in the DSC heating curves, although this tendsto give a somewhat high value for TG.
A Trehalose sample was prepared following the boilingprocedure described previously with a final boiling temper-ature of �125 �C and a final water concentration of 6%.
Fig. 3. Trehalose/10%water Brillouin spectra at T = 295, 315, 325, and345 K (right to left) with damped oscillator fits.
Fig. 4. Brillouin shifts from the fits in Fig. 3 vs. temperature. The changein slope at T � 310 K indicates the location of the glass transitiontemperature TG. Inset: temperature dependence of the Brillouin linewidth.
Fig. 5. Differential scanning calorimetry runs on a trehalose sample with6% residual water concentration. Heating rates (top to bottom) are 4, 5, 6,and 8 �C/min. The corresponding glass transition temperatures, taken asthe midpoint of the step in the heating curves, are 34.1, 35.1, 36.1, and37.9 �C respectively.
4468 H.Z. Cummins et al. / Journal of Non-Crystalline Solids 352 (2006) 4464–4474
DSC measurements were performed with a MAC Sciencemodel DSC3100 calorimeter at heating rates of 4, 5, 6,and 8 �C/min. The data are shown in Fig. 5. Taking TG
as the mid-point temperatures of the steps in these curvesgave TG = 34.1, 35.1, 36.1, and 37.9 �C respectively, in rea-sonable agreement with – but somewhat higher than – thepredicted TG = 28 ± 5 �C and close to the results obtainedfrom the Brillouin scattering experiments.
Moynihan et al. [36] proposed that the dependence ofthe glass transition temperature TG on the heating rate q
is given by
d ln jqj=dð1=T GÞ ¼ �Dh�=R ð3Þ
(in units of K), where Dh* is the activation enthalpy. Theyshowed that Eq. (3) (in an equivalent form) holds for threeglasses: As2Se3, B2O3, and 23%K2O–77%SiO2. The corre-
sponding values found for Dh* were 70, 92, and 101 kcal/mol., respectively.
For our trehalose/6% water data, a linear fit to the fourdata points gave d lnjqj/d(1/TG) = �1.704 · 104 K, fromwhich Eq. (3) gives Dh* = 33.9 kcal/mol., comparable tobut somewhat smaller than Dh* for the three materials dis-cussed in [36]. The strength of the heating rate dependenceof TG, as indicated by the increase in TG when the heatingrate is doubled, is 3.8 K in trehalose/6% water, comparableto the other three materials for which doubling of the heat-ing (or cooling) rates increases TG by 4.2, 4.8, and 8.8 Krespectively.
3.3. Dielectric susceptibility
Frequency-dependent dielectric constant measurementsat different temperatures were carried out using a cylindri-cal sample cell with inner and outer diameters of 6.8 mmand 8.7 mm, and height of 8.7 mm. Temperature was con-trolled with a PID controller. Two different measurementapproaches were employed depending on the frequencyrange under consideration. For the frequency range of0.1 Hz to 10 kHz, the in-phase and out-of-phase currentsthrough the capacitor were measured using a Dual PhaseLock-in Amplifier (Stanford SR 830, USA) in conjunctionwith a Universal Waveform Generator (195 Wavetek/Datron, USA). For the frequency range of 100 Hz to10 MHz, an Impedance Analyzer (HP 4194A, Hewlett–Packard USA) with a standard four-terminal pair configu-ration was used to measure the capacitance and conduc-tance of the sample. The data obtained from the twomethods were in excellent agreement where theyoverlapped.
In a dielectric study of glucose/water solutions, to bedescribed in another publication, strong a-relaxation peaks
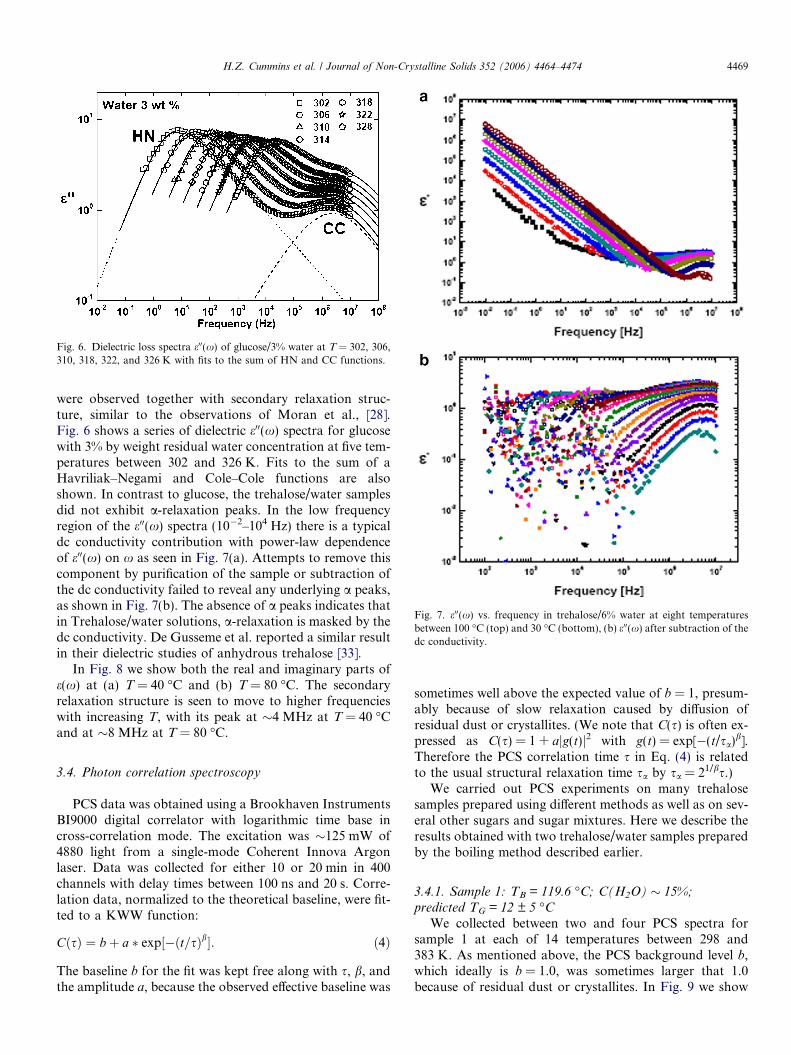
Fig. 6. Dielectric loss spectra e00(x) of glucose/3% water at T = 302, 306,310, 318, 322, and 326 K with fits to the sum of HN and CC functions.
Fig. 7. e00(x) vs. frequency in trehalose/6% water at eight temperaturesbetween 100 �C (top) and 30 �C (bottom), (b) e00(x) after subtraction of thedc conductivity.
H.Z. Cummins et al. / Journal of Non-Crystalline Solids 352 (2006) 4464–4474 4469
were observed together with secondary relaxation struc-ture, similar to the observations of Moran et al., [28].Fig. 6 shows a series of dielectric e00(x) spectra for glucosewith 3% by weight residual water concentration at five tem-peratures between 302 and 326 K. Fits to the sum of aHavriliak–Negami and Cole–Cole functions are alsoshown. In contrast to glucose, the trehalose/water samplesdid not exhibit a-relaxation peaks. In the low frequencyregion of the e00(x) spectra (10�2–104 Hz) there is a typicaldc conductivity contribution with power-law dependenceof e00(x) on x as seen in Fig. 7(a). Attempts to remove thiscomponent by purification of the sample or subtraction ofthe dc conductivity failed to reveal any underlying a peaks,as shown in Fig. 7(b). The absence of a peaks indicates thatin Trehalose/water solutions, a-relaxation is masked by thedc conductivity. De Gusseme et al. reported a similar resultin their dielectric studies of anhydrous trehalose [33].
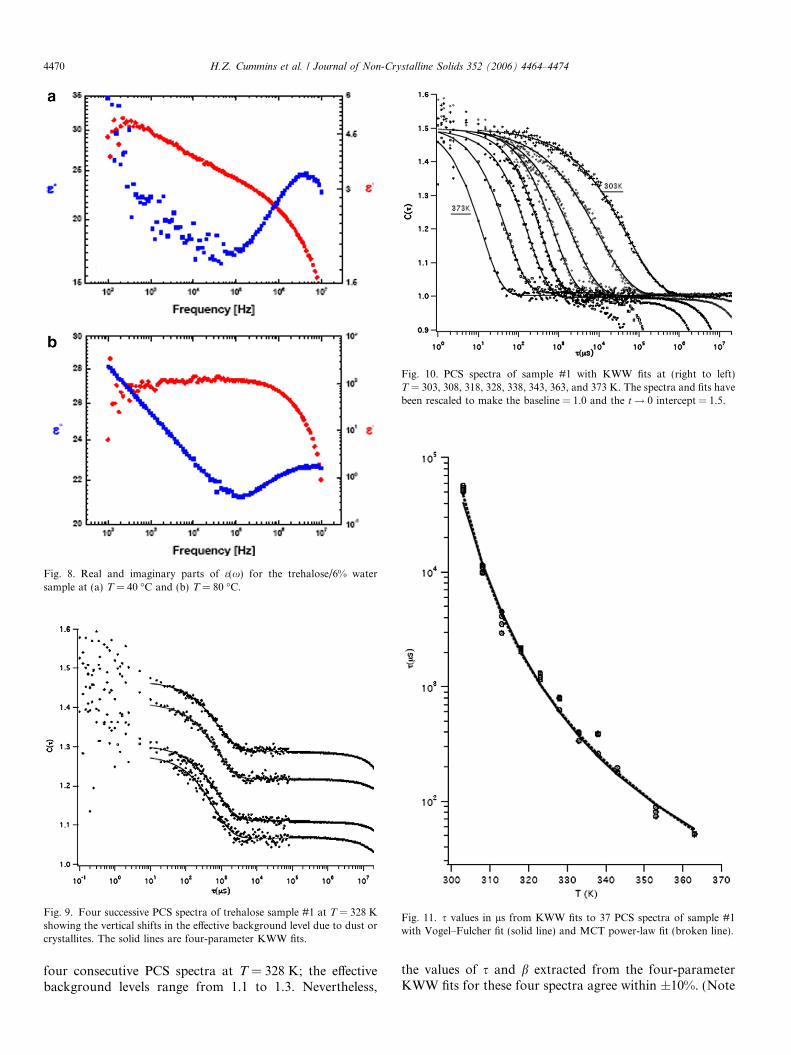
In Fig. 8 we show both the real and imaginary parts ofe(x) at (a) T = 40 �C and (b) T = 80 �C. The secondaryrelaxation structure is seen to move to higher frequencieswith increasing T, with its peak at �4 MHz at T = 40 �Cand at �8 MHz at T = 80 �C.
3.4. Photon correlation spectroscopy
PCS data was obtained using a Brookhaven InstrumentsBI9000 digital correlator with logarithmic time base incross-correlation mode. The excitation was �125 mW of4880 light from a single-mode Coherent Innova Argonlaser. Data was collected for either 10 or 20 min in 400channels with delay times between 100 ns and 20 s. Corre-lation data, normalized to the theoretical baseline, were fit-ted to a KWW function:
CðsÞ ¼ bþ a � exp½�ðt=sÞb�: ð4Þ
The baseline b for the fit was kept free along with s, b, andthe amplitude a, because the observed effective baseline was
sometimes well above the expected value of b = 1, presum-ably because of slow relaxation caused by diffusion ofresidual dust or crystallites. (We note that C(s) is often ex-pressed as C(s) = 1 + ajg(t)j2 with g(t) = exp[�(t/sa)b].Therefore the PCS correlation time s in Eq. (4) is relatedto the usual structural relaxation time sa by sa = 21/bs.)
We carried out PCS experiments on many trehalosesamples prepared using different methods as well as on sev-eral other sugars and sugar mixtures. Here we describe theresults obtained with two trehalose/water samples preparedby the boiling method described earlier.
3.4.1. Sample 1: TB = 119.6 �C; C(H2O) � 15%;
predicted TG = 12 ± 5 �C
We collected between two and four PCS spectra forsample 1 at each of 14 temperatures between 298 and383 K. As mentioned above, the PCS background level b,which ideally is b = 1.0, was sometimes larger that 1.0because of residual dust or crystallites. In Fig. 9 we show
Fig. 10. PCS spectra of sample #1 with KWW fits at (right to left)T = 303, 308, 318, 328, 338, 343, 363, and 373 K. The spectra and fits havebeen rescaled to make the baseline = 1.0 and the t! 0 intercept = 1.5.
Fig. 8. Real and imaginary parts of e(x) for the trehalose/6% watersample at (a) T = 40 �C and (b) T = 80 �C.
Fig. 9. Four successive PCS spectra of trehalose sample #1 at T = 328 Kshowing the vertical shifts in the effective background level due to dust orcrystallites. The solid lines are four-parameter KWW fits.
Fig. 11. s values in ls from KWW fits to 37 PCS spectra of sample #1with Vogel–Fulcher fit (solid line) and MCT power-law fit (broken line).
4470 H.Z. Cummins et al. / Journal of Non-Crystalline Solids 352 (2006) 4464–4474
four consecutive PCS spectra at T = 328 K; the effectivebackground levels range from 1.1 to 1.3. Nevertheless,
the values of s and b extracted from the four-parameterKWW fits for these four spectra agree within ±10%. (Note
H.Z. Cummins et al. / Journal of Non-Crystalline Solids 352 (2006) 4464–4474 4471
that the excess background in these spectra does decay atlong times since the particles producing the backgrounddiffuse). Of the 45 spectra analyzed, those for T = 298,373, and 383 K were found to give inconsistent values fors and were not included in the subsequent analysis. (Thereason for this inconsistency is not known.)
Fig. 10 shows PCS data of sample #1 with KWW fits foreight temperatures between 303 and 373 K. In this plot, thebackground levels have been shifted to b = 1.0 and thet! 0 intercepts scaled to b + a = 1.5 to improve visibility.Finally, the 37 values of s(T) obtained from the KWW fitsfor temperatures between 303 and 363 K were fit to aVogel–Fulcher equation:
sVFðlsÞ ¼ s0 exp½A=ðT � T 0Þ�; ð5Þwhich gave T0 = 263 ± 2 K. The s(T) data and VF fit areshown in Fig. 11. (Error bars for these fits were taken fromthe nonlinear confidence limits returned by the fitting pro-gram). The glass transition temperature TG, obtained byextrapolating sVF to 1000 s, is TG = 284 ± 2 K = 11 ±2 �C, in close agreement with the predicted TG = 12 ±5 �C.
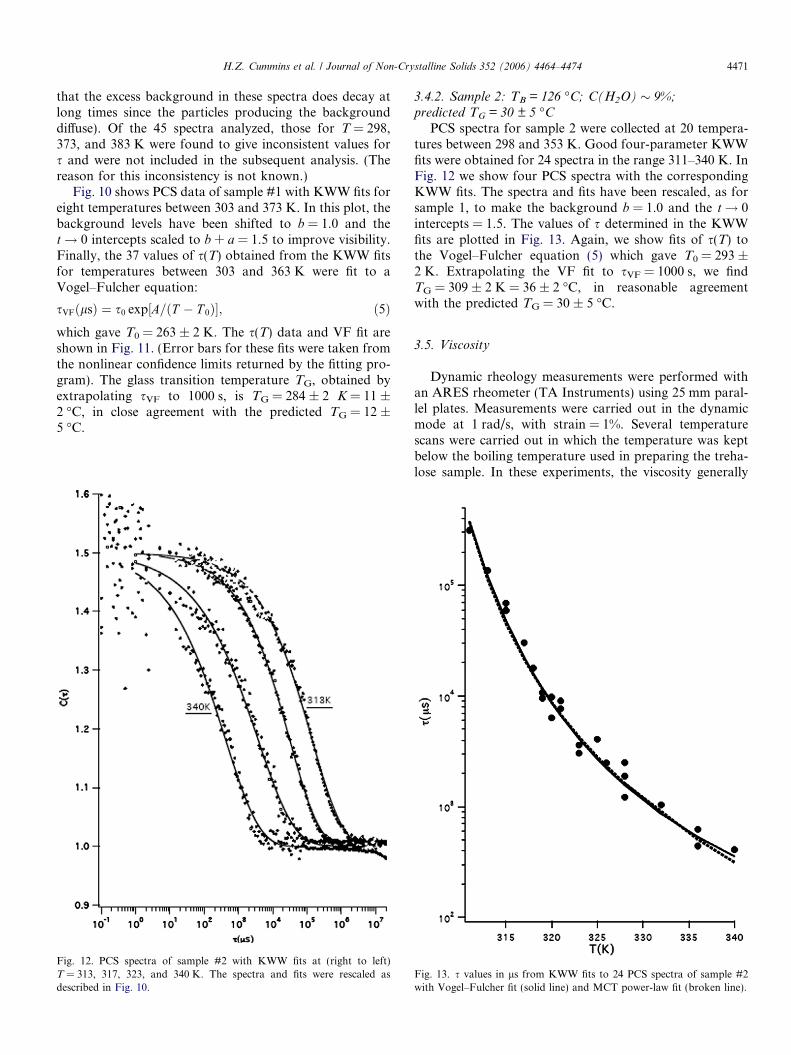
Fig. 12. PCS spectra of sample #2 with KWW fits at (right to left)T = 313, 317, 323, and 340 K. The spectra and fits were rescaled asdescribed in Fig. 10.
3.4.2. Sample 2: TB = 126 �C; C(H2O) � 9%;
predicted TG = 30 ± 5 �C
PCS spectra for sample 2 were collected at 20 tempera-tures between 298 and 353 K. Good four-parameter KWWfits were obtained for 24 spectra in the range 311–340 K. InFig. 12 we show four PCS spectra with the correspondingKWW fits. The spectra and fits have been rescaled, as forsample 1, to make the background b = 1.0 and the t! 0intercepts = 1.5. The values of s determined in the KWWfits are plotted in Fig. 13. Again, we show fits of s(T) tothe Vogel–Fulcher equation (5) which gave T0 = 293 ±2 K. Extrapolating the VF fit to sVF = 1000 s, we findTG = 309 ± 2 K = 36 ± 2 �C, in reasonable agreementwith the predicted TG = 30 ± 5 �C.
3.5. Viscosity
Dynamic rheology measurements were performed withan ARES rheometer (TA Instruments) using 25 mm paral-lel plates. Measurements were carried out in the dynamicmode at 1 rad/s, with strain = 1%. Several temperaturescans were carried out in which the temperature was keptbelow the boiling temperature used in preparing the treha-lose sample. In these experiments, the viscosity generally
Fig. 13. s values in ls from KWW fits to 24 PCS spectra of sample #2with Vogel–Fulcher fit (solid line) and MCT power-law fit (broken line).
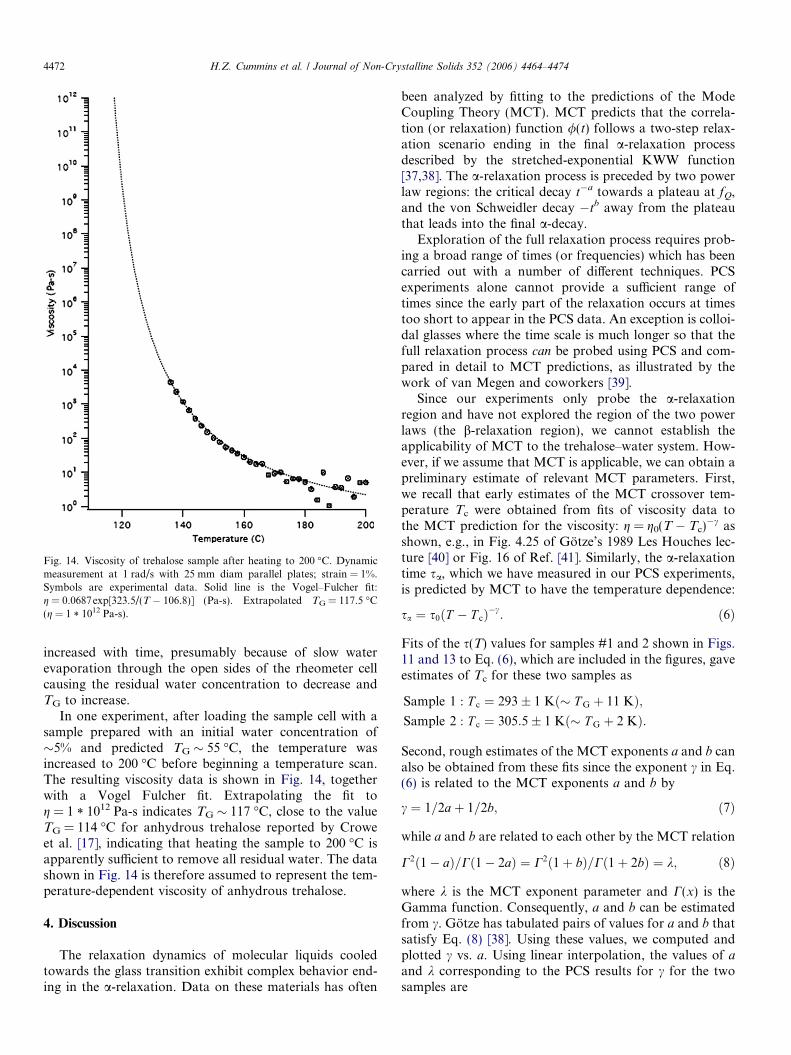
Fig. 14. Viscosity of trehalose sample after heating to 200 �C. Dynamicmeasurement at 1 rad/s with 25 mm diam parallel plates; strain = 1%.Symbols are experimental data. Solid line is the Vogel–Fulcher fit:g = 0.0687exp[323.5/(T � 106.8)] (Pa-s). Extrapolated TG = 117.5 �C(g = 1 * 1012 Pa-s).
4472 H.Z. Cummins et al. / Journal of Non-Crystalline Solids 352 (2006) 4464–4474
increased with time, presumably because of slow waterevaporation through the open sides of the rheometer cellcausing the residual water concentration to decrease andTG to increase.
In one experiment, after loading the sample cell with asample prepared with an initial water concentration of�5% and predicted TG � 55 �C, the temperature wasincreased to 200 �C before beginning a temperature scan.The resulting viscosity data is shown in Fig. 14, togetherwith a Vogel Fulcher fit. Extrapolating the fit tog = 1 * 1012 Pa-s indicates TG � 117 �C, close to the valueTG = 114 �C for anhydrous trehalose reported by Croweet al. [17], indicating that heating the sample to 200 �C isapparently sufficient to remove all residual water. The datashown in Fig. 14 is therefore assumed to represent the tem-perature-dependent viscosity of anhydrous trehalose.
4. Discussion
The relaxation dynamics of molecular liquids cooledtowards the glass transition exhibit complex behavior end-ing in the a-relaxation. Data on these materials has often
been analyzed by fitting to the predictions of the ModeCoupling Theory (MCT). MCT predicts that the correla-tion (or relaxation) function /(t) follows a two-step relax-ation scenario ending in the final a-relaxation processdescribed by the stretched-exponential KWW function[37,38]. The a-relaxation process is preceded by two powerlaw regions: the critical decay t�a towards a plateau at fQ,and the von Schweidler decay �tb away from the plateauthat leads into the final a-decay.
Exploration of the full relaxation process requires prob-ing a broad range of times (or frequencies) which has beencarried out with a number of different techniques. PCSexperiments alone cannot provide a sufficient range oftimes since the early part of the relaxation occurs at timestoo short to appear in the PCS data. An exception is colloi-dal glasses where the time scale is much longer so that thefull relaxation process can be probed using PCS and com-pared in detail to MCT predictions, as illustrated by thework of van Megen and coworkers [39].
Since our experiments only probe the a-relaxationregion and have not explored the region of the two powerlaws (the b-relaxation region), we cannot establish theapplicability of MCT to the trehalose–water system. How-ever, if we assume that MCT is applicable, we can obtain apreliminary estimate of relevant MCT parameters. First,we recall that early estimates of the MCT crossover tem-perature Tc were obtained from fits of viscosity data tothe MCT prediction for the viscosity: g = g0(T � Tc)
�c asshown, e.g., in Fig. 4.25 of Gotze’s 1989 Les Houches lec-ture [40] or Fig. 16 of Ref. [41]. Similarly, the a-relaxationtime sa, which we have measured in our PCS experiments,is predicted by MCT to have the temperature dependence:
sa ¼ s0ðT � T cÞ�c: ð6Þ
Fits of the s(T) values for samples #1 and 2 shown in Figs.11 and 13 to Eq. (6), which are included in the figures, gaveestimates of Tc for these two samples as
Sample 1 : T c ¼ 293� 1 Kð� T G þ 11 KÞ;Sample 2 : T c ¼ 305:5� 1 Kð� T G þ 2 KÞ:
Second, rough estimates of the MCT exponents a and b canalso be obtained from these fits since the exponent c in Eq.(6) is related to the MCT exponents a and b by
c ¼ 1=2aþ 1=2b; ð7Þ
while a and b are related to each other by the MCT relation
C2ð1� aÞ=Cð1� 2aÞ ¼ C2ð1þ bÞ=Cð1þ 2bÞ ¼ k; ð8Þ
where k is the MCT exponent parameter and C(x) is theGamma function. Consequently, a and b can be estimatedfrom c. Gotze has tabulated pairs of values for a and b thatsatisfy Eq. (8) [38]. Using these values, we computed andplotted c vs. a. Using linear interpolation, the values of aand k corresponding to the PCS results for c for the twosamples are
H.Z. Cummins et al. / Journal of Non-Crystalline Solids 352 (2006) 4464–4474 4473
Sample 1 : c ¼ 3:476; a ¼ 0:237; k ¼ 0:865;
Sample 2 : c ¼ 3:817; a ¼ 0:22; k ¼ 0:887:
For comparison, the values of a for two well-studiedmolecular glassformers, propylene carbonate and salol,are 0.29 and 0.327, respectively.
Again, we stress that, in view of the limited time rangecovered by our experiments this analysis is only intendedto provide preliminary estimates for the MCT crossovertemperature Tc and critical exponent a. We anticipate thatfuture experiments will provide more definitive tests of theapplicability of MCT to this system.
Finally, we note that it is possible to estimate the activa-tion energy Dh* from the PCS results and compare with thevalue of 33.9 kcal/mol. found from the DSC measurementsin Section 3.2. If we assume that close to TG s(T) followsthe Arrhenius law s = s0exp(Dh*/RT), then the limitingslope close to TG of ln(s) vs. 1/T would be Dh*/R. Fromthe VF fit to the data of sample #1 shown in Fig. 11, wefound the slope to be 22,771 from which we estimateDh* = 45.2 kcal/mol. in reasonable agreement with theDSC value.
5. Conclusions
The dynamical properties of trehalose/water solutionshave been explored with a range of experimental tech-niques. Several typical signatures of the glass transitionwere observed:
1. A break in the slope of the Brillouin shift vs. tempera-ture curve.
2. A step in the specific heat curve.3. An a-relaxation time that follows the Vogel–Fulcher
equation and can also be described by an MCTpower-law equation which indicates that Tc � TG +11 K.
4. Viscosity that increases rapidly with decreasing temper-ature, that can be described by a Vogel–Fulcherequation.
Dielectric spectroscopy has not yet provided usefulinformation on the a-relaxation dynamics because thelow-frequency dielectric loss is apparently dominated bydc conductivity of unknown origin. However, evidence oftemperature-dependent secondary relaxation at higher fre-quencies has been observed.
In view of the importance of sugars (including trehalose)in biology, biotechnology, and the food industry, furtherexperiments along these lines are clearly worth pursuing.
Acknowledgements
We thank Harry Levine for helpful discussions and forsuggesting trehalose as an interesting sugar for study, andCargill, Inc for providing the trehalose dihydrate used in
these experiments. We also thank Marilyn Gunner andLisa Lapidus for helpful discussions about handling Treha-lose, and Wolfgang Gotze for helpful suggestions on thismanuscript. This US–Korea Cooperative Research Projectis supported by the US National Science Foundation undergrant NSF-INT 0216824 and by the Korea Science andEngineering Foundation (KOSEF) through grant F01-2003-000-00024-0. Research in New York was supportedby the NSF under grant DMR-0243471.
References
[1] NIST, NIST Chemistry Webbook Available from: http://web-book.nist.gov/chemistry.
[2] L. Slade, H. Levine, Critical Rev. Food Sci. Nutr. 30 (1991) 115.[3] L. Slade, H. Levine, Adv. Food Nutr. Res. 38 (1995) 103.[4] J.M.V. Blanshard, P.J. Lillford, The Glassy State in Foods,
Nottingham University Press, 1993.[5] S.P. Ding, J. Fan, J.L. Green, Q. Lu, E. Sanchez, C.A. Angell, J.
Therm. Anal. 47 (1996) 1391.[6] K.L. Koster, Y.P. Lei, M. Amderson, S. Martin, G. Bryant, Biophys.
J. 78 (2000) 1932.[7] C. Macdonald, G.P. Johari, J. Mol. Struct. 523 (2000) 119.[8] P.D. Orford, R. Parker, S.G. Ring, Carbohydrate Res. 196 (1990) 11.[9] J.L. Green, C.A. Angell, J. Phys. Chem. 93 (1989) 2880.
[10] A.D. Elbein, Y.T. Pan, I. Pastuszak, D. Carroll, Glycobiology 13(2003) 17R.
4474 H.Z. Cummins et al. / Journal of Non-Crystalline Solids 352 (2006) 4464–4474
[33] A. De Gusseme, L. Carpentier, J.F. Willart, M. Descamps, J. Phys.Chem. B 107 (2003) 10879;D.L. French, T. Arakawa, T. Li, Biopolymers 73 (2004) 524.
Hunenberger, Biophys. J. 86 (2004) 2273.[36] C.T. Moynihan, A.J. Easteal, J. Wilder, J. Tucker, J. Phys. Chem. 78
(1974) 2673.
[37] W. Gotze, L. Sjogren, Rep. Prog. Phys. 55 (1992) 241.[38] W. Gotze, J. Phys. Condens. Matter 2 (1990) 8485.[39] W. van Megen, S.M. Underwood, Phys. Rev. E 49 (1994) 4206.[40] W. Gotze, in: J.P. Hansen, D. Levesque, J. Zinn-Justin (Eds.),
Liquids Freezing and the Glass Transition – Les Houches LI 1989,North Holland, 1991, p. 292.
[41] G. Li, W.M. Du, A. Sakai, H.Z. Cummins, Phys. Rev. A 46 (1992)3343.