The Livestock Gross Margin Insurance Program for Dairy: Potential for Future Research?. Brian W. Gould Associate Professor Department of Agricultural and Applied Economics Victor E. Cabrera Assistant Professor Department of Dairy Science. Dairy Price Risk: What are the Alternatives. - PowerPoint PPT Presentation
The Livestock Gross The Livestock Gross gin Insurance Program for Da gin Insurance Program for Da otential for Future Research otential for Future Research Brian W. Gould Brian W. Gould Associate Professor Associate Professor Department of Agricultural and Applied Department of Agricultural and Applied Economics Economics Victor E. Cabrera Victor E. Cabrera Assistant Professor Assistant Professor Department of Dairy Science Department of Dairy Science
Transcript
The Livestock Gross The Livestock Gross Margin Insurance Program for Dairy:Margin Insurance Program for Dairy:
Potential for Future Research?Potential for Future Research?
Brian W. GouldBrian W. GouldAssociate ProfessorAssociate Professor
Department of Agricultural and Applied EconomicsDepartment of Agricultural and Applied Economics
Victor E. CabreraVictor E. CabreraAssistant ProfessorAssistant Professor
Department of Dairy ScienceDepartment of Dairy Science
How Can Producers Control Milk Price Risk?How Can Producers Control Milk Price Risk? Forward Fixed Price Contracts via Cheese PlantForward Fixed Price Contracts via Cheese Plant
Minimum Price Contracts with Cheese PlantMinimum Price Contracts with Cheese Plant Similar to Use of Class III Put OptionSimilar to Use of Class III Put Option
Traditional Hedging and Options StrategiesTraditional Hedging and Options Strategies Class III Futures Contract: Milk from average Class III Futures Contract: Milk from average
Wisconsin dairy farm with 125 cow herdWisconsin dairy farm with 125 cow herd
Dairy Price Risk: What are the AlternativesDairy Price Risk: What are the Alternatives
Livestock Gross Margin Insurance for Dairy (Livestock Gross Margin Insurance for Dairy (LGM-LGM-DairyDairy)) Available Starting in August 2008 Available Starting in August 2008 Protects Against Unanticipated Declines in Protects Against Unanticipated Declines in Gross Gross
MarginsMargins Where Where Gross Margin = Milk Revenue – Feed CostsGross Margin = Milk Revenue – Feed Costs
Purchased from Crop Insurance Agents Selling Federal Purchased from Crop Insurance Agents Selling Federal Crop Insurance ProductsCrop Insurance Products
LGM-Dairy: An OverviewLGM-Dairy: An Overview
LGM-Dairy: An OverviewLGM-Dairy: An Overview
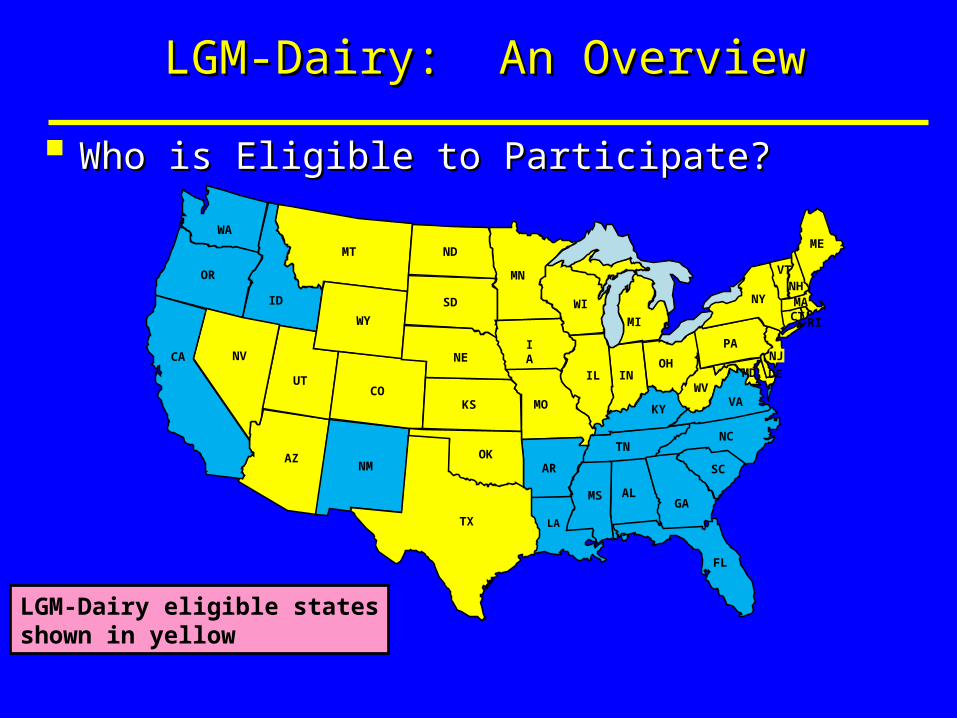
Who is Eligible to Participate?Who is Eligible to Participate?
LGM-Dairy eligible statesshown in yellow
ID
AZ
UT
MT
WY
NM
CO
AL
FL
SC
TN
KY
INOH
NC
SD
KS
NE
MN
WI
IA
IL
MO
AR
MS
OK
ND
OR
CA NV
WA
PA
ME
VA
NY
CT
WVMD
NJ
VTNHMA
DE
RI
LA
MI
GA
TX
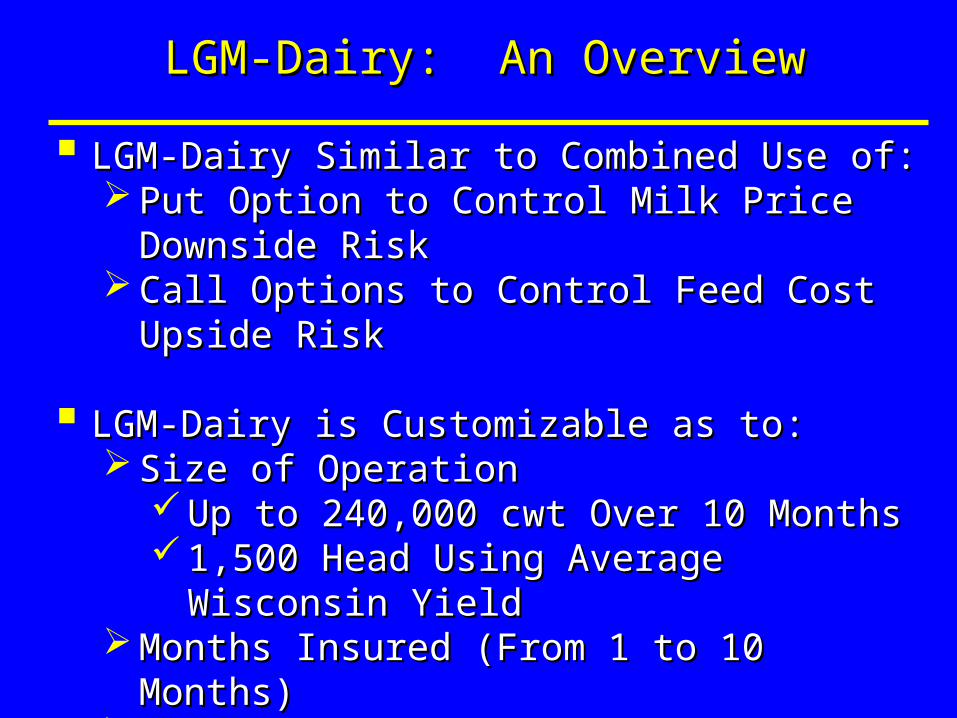
LGM-Dairy Similar to Combined Use of:LGM-Dairy Similar to Combined Use of: Put Option to Control Milk Price Downside RiskPut Option to Control Milk Price Downside Risk Call Options to Control Feed Cost Upside RiskCall Options to Control Feed Cost Upside Risk
LGM-Dairy is Customizable as to:LGM-Dairy is Customizable as to: Size of OperationSize of Operation
Up to 240,000 cwt Over 10 Months Up to 240,000 cwt Over 10 Months 1,500 Head Using Average Wisconsin Yield1,500 Head Using Average Wisconsin Yield
Months Insured (From 1 to 10 Months)Months Insured (From 1 to 10 Months) % of Monthly Gross Margins Covered% of Monthly Gross Margins Covered Gross Margin Deductible Range: $0 - $1.50/cwtGross Margin Deductible Range: $0 - $1.50/cwt
LGM-Dairy: An OverviewLGM-Dairy: An Overview
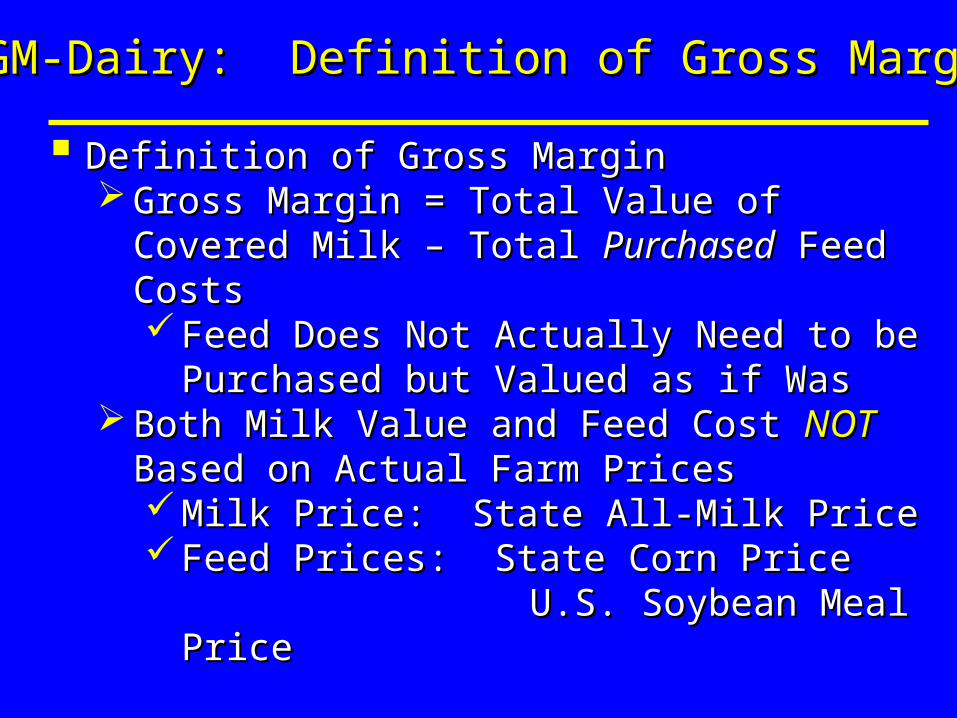
Definition of Gross MarginDefinition of Gross Margin Gross Margin = Total Value of Covered Milk – Gross Margin = Total Value of Covered Milk –
Total Total PurchasedPurchased Feed Costs Feed Costs Feed Does Not Actually Need to be Purchased Feed Does Not Actually Need to be Purchased
but Valued as if Wasbut Valued as if Was Both Milk Value and Feed Cost Both Milk Value and Feed Cost NOTNOT Based on Based on
Actual Farm PricesActual Farm Prices Milk Price: State All-Milk PriceMilk Price: State All-Milk Price Feed Prices: State Corn PriceFeed Prices: State Corn Price
U.S. Soybean Meal PriceU.S. Soybean Meal Price
LGM-Dairy: Definition of Gross MarginLGM-Dairy: Definition of Gross Margin
Expected Feed Use Over Contract Period Converted to Expected Feed Use Over Contract Period Converted to Corn and Soybean Meal EquivalentsCorn and Soybean Meal Equivalents Any Reasonable Conversion System AcceptableAny Reasonable Conversion System Acceptable UW UW Understanding Dairy MarketsUnderstanding Dairy Markets Website has Website has
Conversion Software AvailableConversion Software Available SpreadsheetSpreadsheet Web-BasedWeb-Based
Feed Equivalents Need to be in Very Broad Ranges:Feed Equivalents Need to be in Very Broad Ranges: Corn: 0.00364–0.02912 Tons/cwtCorn: 0.00364–0.02912 Tons/cwt
LGM-Dairy: Definition of Gross MarginLGM-Dairy: Definition of Gross Margin
What Impacts Total Insurance Contract Premium?What Impacts Total Insurance Contract Premium? Amount of Milk and Feed Insured (Amount of Milk and Feed Insured (++)) Proportion of Gross Margin/cwt Not Covered Under Proportion of Gross Margin/cwt Not Covered Under
LGM-Dairy Contract (LGM-Dairy Contract (--))
Expected Milk Price (+)Expected Milk Price (+) Corn and Meal Prices (-)Corn and Meal Prices (-) Expected Price Volatility Over Contract Period (Expected Price Volatility Over Contract Period (++))
LGM-Dairy: Program CharacteristicsLGM-Dairy: Program Characteristics
Determined by Futures/Options Settle Prices at Sign-up and BeyondProducer Control
Determined by Producer
Example of One Possible Insurance StrategyExample of One Possible Insurance Strategy Purchase Insurance in FebruaryPurchase Insurance in February
Feb ′09Mar ′09
Apr ′09
May ′09
Jun ′09
Jul ′09
Aug ′09
Sep ′09
Oct ′09
Nov ′09
Dec ′09
Jan ′10
1 2 3 4 5 6 7 8 9 10
Purchase at End of
Month
NoCover-
ageInsurance Contract PeriodInsurance Contract Period
CoveredMonths
Apr May Jun Sep Oct Nov
Possible Production Months CoveredPossible Production Months Covered
LGM-Dairy: Program CharacteristicsLGM-Dairy: Program Characteristics
Have from 4 pm (EDT) on 3rd to last business day of purchase month to 9 am (EDT) on the following day to make purchase decision(i.e., 17 hour-period)
GMGGross Margin Guarantee
AGMActual Gross Margin
EGMExpected Gross Margin
DLDeductible Level
EFCExpected Feed Cost
EMPExpected Class III
Price
SMBState Milk Basis
EMRExpected Milk Revenue
ECCExpected
Corn Cost
ESCExpected
SBM Cost
CMEClass IIIFutures
SCBStateCornBasis
CBOTCorn
Futures
CBOTSBM
Futures
AFCActual Feed Cost
CMEActual
Class IIIPrice
Settlement
AMRActual Milk Revenue
CBOTActualFeedsCosts
Settlement
TMTarget Marketings
PREMPremium
Cost
EFQExpected Feed Quantity
INDIndemnity
Producer Data/Decision
Policy Rules
Exogenous Data
LGM-Dairy: Program CharacteristicsLGM-Dairy: Program Characteristics
Premium Estimates Available via RMA Website Premium Estimates Available via RMA Website www.rma.usda.gov/tools/premcalc.htmlwww.rma.usda.gov/tools/premcalc.html on Purchase on Purchase DayDay
UW has developed an unofficial web-based premium UW has developed an unofficial web-based premium calculator using current futures and optionscalculator using current futures and optionshttp://future.aae.wisc.edu/premium/http://future.aae.wisc.edu/premium/
You Want to Purchase a Contract, How are You Want to Purchase a Contract, How are Expected Expected PricesPrices Determined? Determined? Futures Settle Price Averaged Over 3Futures Settle Price Averaged Over 3rdrd, 4, 4thth and 5 and 5thth
Last Business Days of Insurance Purchase Month Last Business Days of Insurance Purchase Month Corn, Soybean Meal and Class III FuturesCorn, Soybean Meal and Class III Futures
LGM-Dairy: Program CharacteristicsLGM-Dairy: Program Characteristics
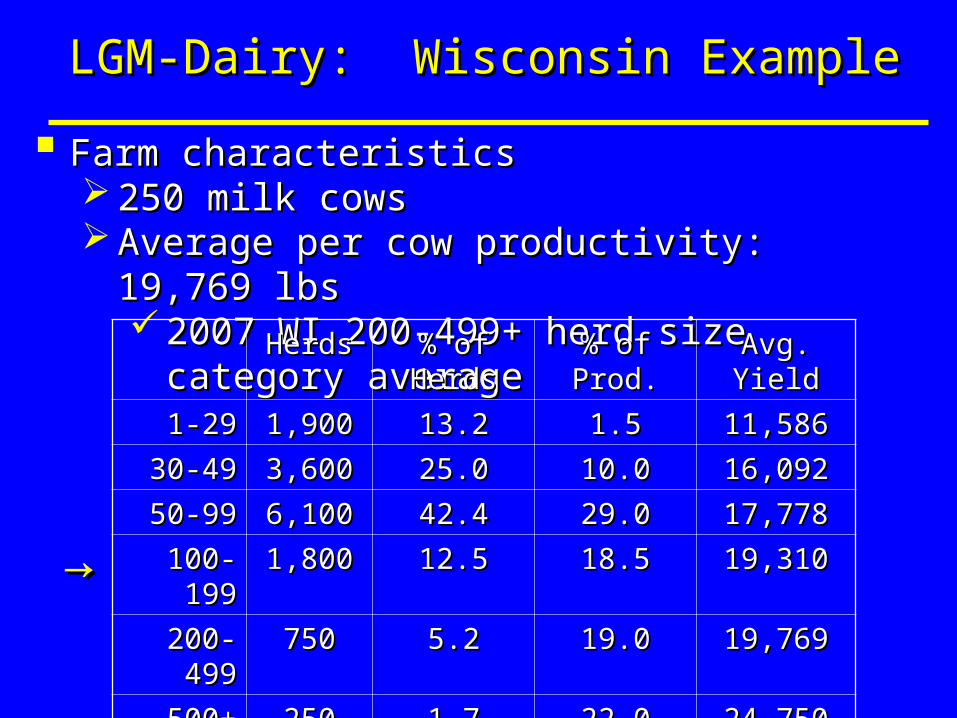
Farm characteristicsFarm characteristics 250 milk cows250 milk cows Average per cow productivity: 19,769 lbsAverage per cow productivity: 19,769 lbs
2007 WI 200-499+ herd size category average2007 WI 200-499+ herd size category average
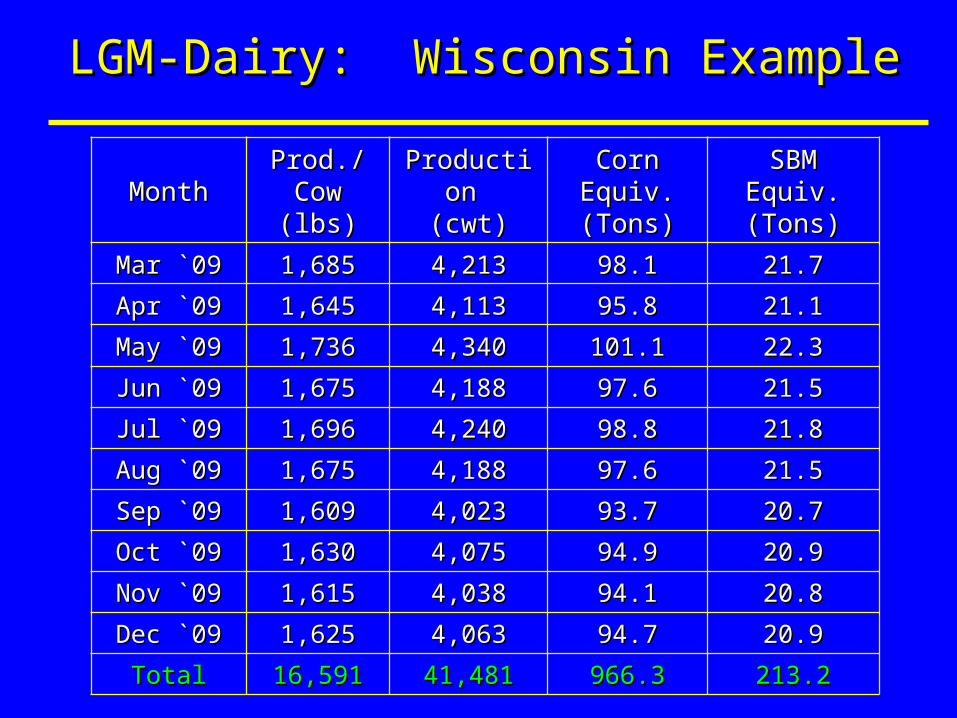
LGM-Dairy: Wisconsin ExampleLGM-Dairy: Wisconsin Example
HerdsHerds % of Herds% of Herds % of Prod.% of Prod. Avg. YieldAvg. Yield
Purchase insurance in Jan. Purchase insurance in Jan. → p→ possible 10-Month ossible 10-Month insurance period: Mar `09 – Dec `09insurance period: Mar `09 – Dec `09 Cow productivity changes by monthCow productivity changes by month
Based on Wisconsin monthly yield profileBased on Wisconsin monthly yield profile Amount of feed expected to be usedAmount of feed expected to be used
With January 28With January 28thth insurance purchase date insurance purchase date Expected Price Measurement Period Expected Price Measurement Period (EPM): (EPM):
January 26January 26thth, 27, 27thth and 28 and 28thth
To determine the Gross Margin Guarantee at contract To determine the Gross Margin Guarantee at contract sign-up we need:sign-up we need: Expected monthly milk and feed pricesExpected monthly milk and feed prices Producer elected deductibleProducer elected deductible
Calculation of Expected PricesCalculation of Expected Prices
Purchase Insurance
Monthly expected prices for MarMonthly expected prices for Mar`09`09 - - DecDec`09`09 Expected Expected Wisconsin All MilkWisconsin All Milk price price
= Expected Class III prices + Wisconsin [All-Milk = Expected Class III prices + Wisconsin [All-Milk – Class III] Basis– Class III] Basis
Received – Corn Received – Corn Futures] BasisFutures] Basis
Expected Expected U.S. Soybean MealU.S. Soybean Meal prices (no local basis) prices (no local basis)
Calculation of Expected PricesCalculation of Expected Prices
Calculated from futures settleprices on January 26th – 28th
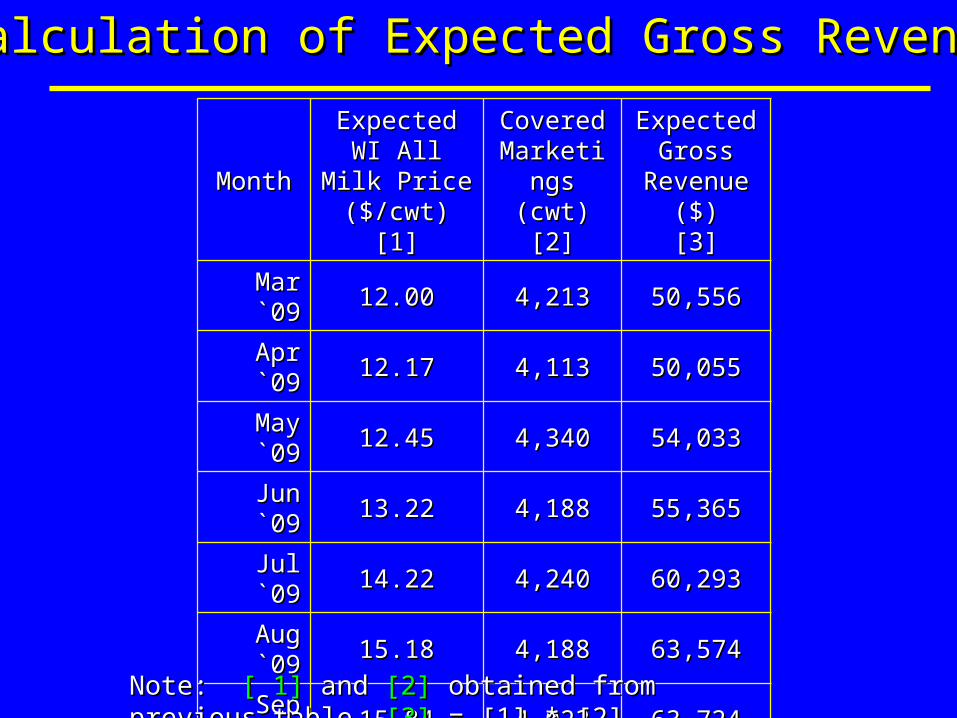
With the estimation of 10 expected Wisconsin All-Milk With the estimation of 10 expected Wisconsin All-Milk price values one canprice values one can Calculate Expected Gross Revenue (Calculate Expected Gross Revenue (EGREGR) at sign-) at sign-
upup EGREGR is the product of expected All-Milk price is the product of expected All-Milk price
times covered milk productiontimes covered milk production Covered production could be less than allowable Covered production could be less than allowable
target as elected by the producertarget as elected by the producer Different price and covered production each Different price and covered production each
monthmonth
Calculation of Expected Gross RevenueCalculation of Expected Gross Revenue
MonthMonth
Expected WI Expected WI All Milk PriceAll Milk Price
($/cwt)($/cwt)[1][1]
Covered Covered Marketings Marketings
(cwt)(cwt)[2][2]
Expected Expected Gross Gross
Revenue ($)Revenue ($)[3][3]
Mar Mar `̀0909 12.0012.00 4,2134,213 50,55650,556
Apr Apr `̀0909 12.1712.17 4,1134,113 50,05550,055
May `May `0909 12.4512.45 4,3404,340 54,03354,033
Jun `Jun `0909 13.2213.22 4,1884,188 55,36555,365
Jul `Jul `0909 14.2214.22 4,2404,240 60,29360,293
Aug `Aug `0909 15.1815.18 4,1884,188 63,57463,574
Sep `Sep `0909 15.8415.84 4,0234,023 63,72463,724
Oct Oct `̀0909 16.2716.27 4,0754,075 66,30066,300
Nov Nov `̀0909 16.5816.58 4,0384,038 66,95066,950
Dec Dec `̀0909 16.5216.52 4,0634,063 67,12167,121
TotalTotal 41,48141,481 597,972597,972Note: Note: [ 1][ 1] and and [2] [2] obtained from previous table obtained from previous table [3][3] = [1] * = [1] * [2] [2]
Calculation of Expected Gross RevenueCalculation of Expected Gross Revenue
With calculation of expected feed prices for each monthWith calculation of expected feed prices for each month Multiply each months covered feed equivalents times Multiply each months covered feed equivalents times
the expected price to obtain expected feed coststhe expected price to obtain expected feed costs Covered feed equivalents equal to total feed Covered feed equivalents equal to total feed
equivalents multiplied by % of production equivalents multiplied by % of production coveredcovered
Unlike Class III contracts, corn/soybean meal futures Unlike Class III contracts, corn/soybean meal futures contracts may not exist for every month of insurance contracts may not exist for every month of insurance contractcontract
Calculation of Expected Feed CostsCalculation of Expected Feed Costs
Oct Oct `̀0909 ------------ ------------ ------------ ------------ 4.224.22 -0.15-0.15 4.074.07
Nov Nov `̀0909 ------------ ------------ ------------ ------------ 4.264.26 -0.18-0.18 4.084.08
Dec Dec `̀0909 4.39004.3900 4.23004.2300 4.30004.3000 4.314.31 4.314.31 -0.22-0.22 4.094.09Note: Note: [4][4] = ([1]+[2]+[3])/3, = ([1]+[2]+[3])/3, [5][5] = weighted average with weights based = weighted average with weights based on months from contract expiration, on months from contract expiration, [7][7] = [5]+[6] = [5]+[6]
Calculation of Expected Corn PriceCalculation of Expected Corn Price
MonthMonth
Expected WI Expected WI Corn PriceCorn Price
($/bu)($/bu)[1][1]
CoveredCoveredCorn Equiv. Corn Equiv.
(tons)(tons)[2][2]
ExpectedExpectedCorn CostCorn Cost
($)($)[3][3]
Mar Mar `̀0909 3.683.68 98.198.1 12,89312,893
Apr Apr `̀0909 3.803.80 95.895.8 13,00113,001
May `May `0909 3.843.84 101.1101.1 13,86513,865
Jun `Jun `0909 3.903.90 97.697.6 13,59413,594
Jul `Jul `0909 3.953.95 98.898.8 13,93813,938
Aug `Aug `0909 3.973.97 97.697.6 13,83813,838
Sep `Sep `0909 4.064.06 93.793.7 13,58713,587
Oct Oct `̀0909 4.074.07 94.994.9 13,79413,794
Nov Nov `̀0909 4.084.08 94.194.1 13,71213,712
Dec Dec `̀0909 4.094.09 94.794.7 13,83313,833
Total Total 966.4966.4 136,056136,056
Calculation of Expected Corn CostCalculation of Expected Corn Cost
Calculation of Expected SBM CostCalculation of Expected SBM Cost
Summary of information required for enrollment:Summary of information required for enrollment: Estimation of expected milk prices and feed costsEstimation of expected milk prices and feed costs Statement of insured marketingsStatement of insured marketings
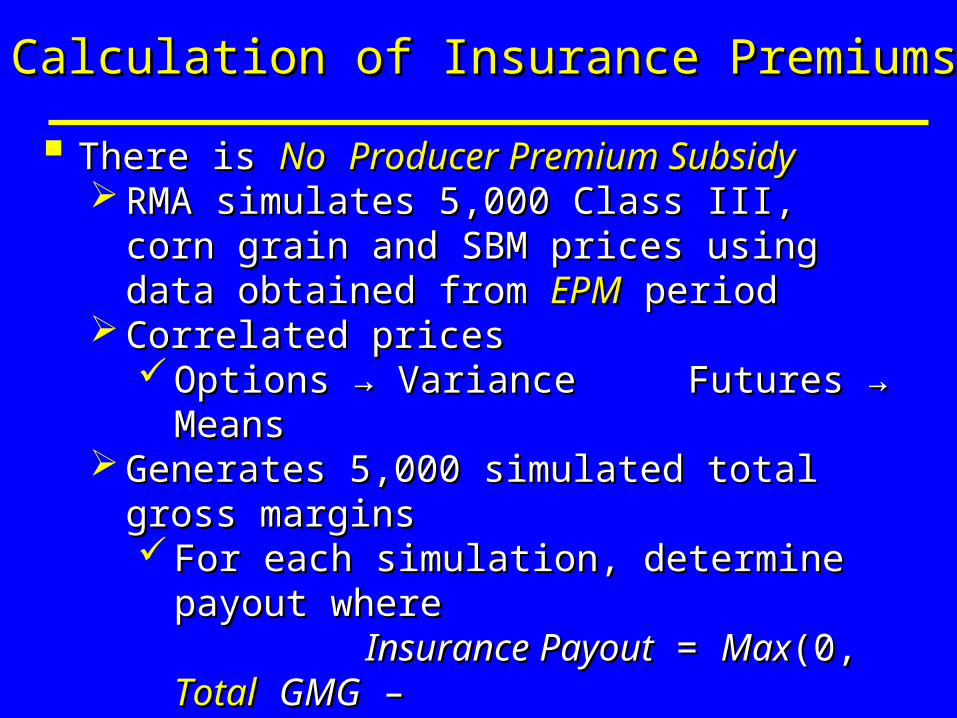
There is There is NoNo Producer Premium SubsidyProducer Premium Subsidy RMA simulates 5,000 Class III, corn grain and RMA simulates 5,000 Class III, corn grain and
SBM prices using data obtained from SBM prices using data obtained from EPMEPM periodperiod Correlated pricesCorrelated prices
Options Options → Variance Futures → Means→ Variance Futures → Means Generates 5,000 simulated total gross marginsGenerates 5,000 simulated total gross margins
For each simulation, determine payout whereFor each simulation, determine payout whereInsurance PayoutInsurance Payout = = MaxMax(0, (0, TotalTotal
GMGGMG – – SimulatedSimulated TotalTotal GMGGMG))
Premiums = Avg. of 5,000 Simulated Payouts + 3%Premiums = Avg. of 5,000 Simulated Payouts + 3%
Calculation of Insurance PremiumsCalculation of Insurance Premiums
We have developed in-house premium softwareWe have developed in-house premium software Official random draws: Aug. 08+Official random draws: Aug. 08+ Simulate our own random draws: Jan. 00-July 08 Simulate our own random draws: Jan. 00-July 08 On-Demand software systemOn-Demand software system
RMA website provides official premiums at sign-upRMA website provides official premiums at sign-up For January 2009 example:For January 2009 example:
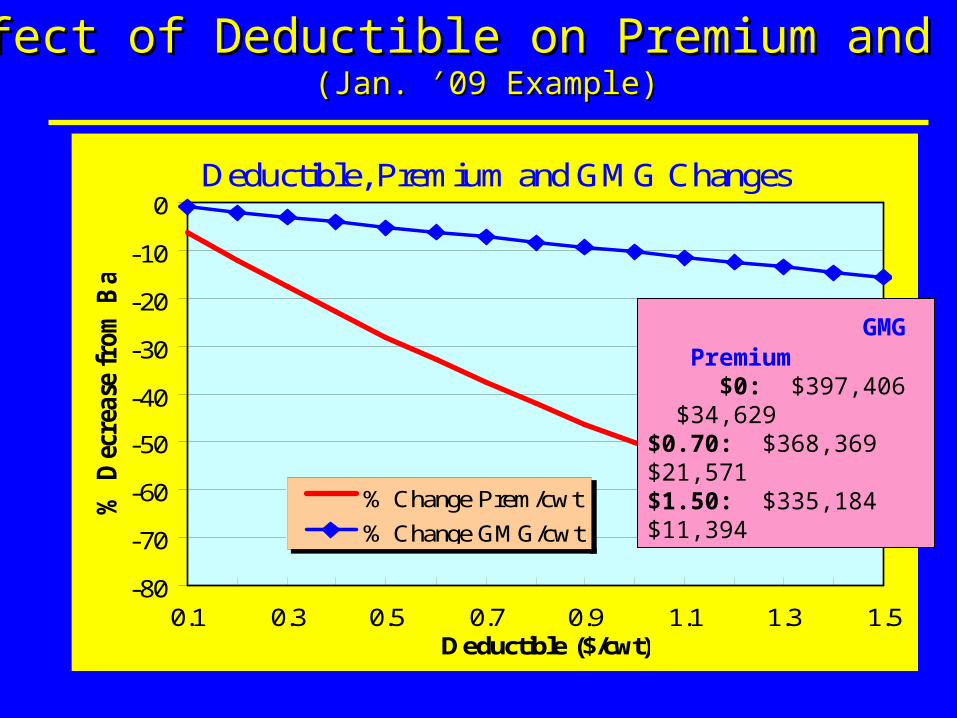
PremiumsPremiums decrease at a faster rate then decrease at a faster rate then GMGGMG as as deductibles increasedeductibles increase
Premium vs. Gross Revenue reduction depends on Premium vs. Gross Revenue reduction depends on price volatility at sign-up expected gross marginsprice volatility at sign-up expected gross margins
Payout probability decreases with higher deductiblesPayout probability decreases with higher deductibles
Calculation of Insurance PremiumsCalculation of Insurance Premiums
Insurance Premiums and Deductible LevelInsurance Premiums and Deductible Level(Jan. ′09 Example)(Jan. ′09 Example)
Relative Premium Value and DeductibleRelative Premium Value and Deductible(Jan. ′09 Example)(Jan. ′09 Example)
Premium as % of GMG
3.00
3.75
4.50
5.25
6.00
6.75
7.50
8.25
9.00
0.0 0.2 0.4 0.6 0.8 1.0 1.2 1.4Deductible ($/cwt)
% o
f G
MG
Effect of Deductible on Payout Probability
20.0
25.0
30.0
35.0
40.0
45.0
50.0
55.0
0.0 0.2 0.4 0.6 0.8 1.0 1.2 1.4Deductible ($/cwt)
Pro
bab
ilit
y o
f P
ayo
ut
Simulated Probability of Positive IndemnitiesSimulated Probability of Positive Indemnities(Jan. ′09 Example)(Jan. ′09 Example)
Payout probability ↓with higher deductibleas GMG decreases
Actual Prices Known → Calculate Actual Prices Known → Calculate Actual Gross MarginActual Gross Margin (AGM) = Actual Revenue – Actual Feed Costs(AGM) = Actual Revenue – Actual Feed Costs Actual Prices determined each month over contract Actual Prices determined each month over contract
life as futures contracts expirelife as futures contracts expire Similar to expected prices, actual prices are statewide Similar to expected prices, actual prices are statewide
averages averages notnot your farm price your farm price Uses settle prices on futures contracts 1,2, and 3 days Uses settle prices on futures contracts 1,2, and 3 days
priorprior to last trading dayto last trading day of a futures contract of a futures contract
LGM-Dairy Actual Indemnity:LGM-Dairy Actual Indemnity: Actual Indemnity = Max[0, Actual Indemnity = Max[0, TotalTotal GMG GMG
– – TotalTotal AGM]AGM] TotalTotal Refers to Sum Over All Contract Months Refers to Sum Over All Contract Months
Determining Actual IndemnitiesDetermining Actual Indemnities
Actual Class III and feed pricesActual Class III and feed prices Determined each month over insurance contract lifeDetermined each month over insurance contract life Uses settle prices on futures contracts 1,2, and 3 Uses settle prices on futures contracts 1,2, and 3
days days priorprior to last trading dayto last trading day of a particular futures of a particular futures contractcontract Averaged over these three daysAveraged over these three days
Determining Actual Class III and Feed PricesDetermining Actual Class III and Feed Prices
LGM-Dairy similar to a bundled optionLGM-Dairy similar to a bundled option
How do LGM-Dairy costs compare to the costs of How do LGM-Dairy costs compare to the costs of setting a similar revenue setting a similar revenue floorfloor via use of Class III puts via use of Class III puts and Corn/SBM calls?and Corn/SBM calls?
Difficult to compare given options lumpinessDifficult to compare given options lumpiness Assume options perfectly divisibleAssume options perfectly divisible Compare costs under alternative deductible levelsCompare costs under alternative deductible levels Use data for January 2008 LGM-Dairy contract Use data for January 2008 LGM-Dairy contract
given availability of actual 10-month price data given availability of actual 10-month price data
A Cost Comparison of LGM-Dairy WithA Cost Comparison of LGM-Dairy WithOptions-Based Revenue ManagementOptions-Based Revenue Management
Procedure for determining option premium costsProcedure for determining option premium costs Use expected prices observed on January 29Use expected prices observed on January 29 thth to to
determine nearby optiondetermine nearby option To determine ending option value we use final settle To determine ending option value we use final settle
price of futures contractprice of futures contract For missing months, we use average of For missing months, we use average of
surrounding futures contract on last business day surrounding futures contract on last business day prior to the 15prior to the 15thth of the missing month(s) of the missing month(s)
A Cost Comparison of LGM-Dairy WithA Cost Comparison of LGM-Dairy WithOptions-Based Revenue ManagementOptions-Based Revenue Management
Class III Put ($/cwt) Corn Call ($/bu) SBM Call ($/Ton)
MonthMonth Put Actual Class
III
Put Value
Corn Call
ActualCorn
Corn Call
Value
SBM Call
Actual SBM
SBM Call
Value
Mar Mar `̀0808 17.0017.00 18.0018.00 00 5.005.00 5.45505.4550 0.45500.4550 340340 336.50336.50 00
Note: Under the options based strategy we reduce the options costs by Note: Under the options based strategy we reduce the options costs by the % reduction in GMG observed under the LGM-Dairy scenarios.the % reduction in GMG observed under the LGM-Dairy scenarios.
LGM-Dairy a challenge for producers to understand LGM-Dairy a challenge for producers to understand given the big black box of how premiums calculatedgiven the big black box of how premiums calculated
How can LGM-Dairy complement plant offered How can LGM-Dairy complement plant offered forward/minimum price contractsforward/minimum price contracts Portfolio of risk management strategiesPortfolio of risk management strategies Software systems for on-demand premiumsSoftware systems for on-demand premiums
Still trying to understand dairy producer risk preferencesStill trying to understand dairy producer risk preferences Farm characteristicsFarm characteristics Producer characteristicsProducer characteristics


![[Business Report] - Evans Winanda Wirgaevansww.staff.gunadarma.ac.id/Downloads/files/63408/...Pricing and gross margin targets – Define your pricing structure, gross margin levels,](https://static.documents.pub/doc/80x56/6094e5eb954f1728c65018f7/business-report-evans-winanda-pricing-and-gross-margin-targets-a-define.jpg)


