79
e Living Standards Audit 2021 Karl Handscomb, Kathleen Henehan & Lalitha Try July 2021 resolutionfoundation.org @resfoundation

The Living Standards Audit 2021 Karl Handscomb, Kathleen Henehan & Lalitha TryJuly 2021
resolutionfoundation.org @resfoundation

Download
This document is available to download as a free PDF at:
https://www.resolutionfoundation.org/publications/the-living-standards-audit-2021/
Citation
If you are using this document in your own writing, our preferred citation is:
K Handscomb, K Henehan & L Try, The Living Standards Audit: 2021, Resolution Foundation,
July 2021
Permission to share
This document is published under the Creative Commons Attribution Non Commercial No
Derivatives 3.0 England and Wales Licence. This allows anyone to download, reuse, reprint,
distribute, and/or copy Resolution Foundation publications without written permission subject to
the conditions set out in the Creative Commons Licence.
For commercial use, please contact: [email protected]
Acknowledgements
The authors would like to thank the Health Foundation for funding
this work and for their support and advice throughout the research
process. We are also grateful to colleagues at the Resolution
Foundation for their helpful comments and input, including Mike
Brewer, Jack Leslie, Krishan Shah and Hannah Slaughter. All views and
any errors remain the authors’ own.
This research uses data from an online survey conducted by YouGov
and funded by the Health Foundation. The figures presented from the
online survey have been analysed independently by the Resolution
Foundation. The views expressed here are not necessarily those of the
Health Foundation or YouGov.
2The Living Standards Audit | 2021
Resolution Foundation

3
Contents
Acknowledgements 2
Executive Summary 4
Section 1
Introduction 14
Section 2
Living standards before Covid-19 18
Section 3
Employment and incomes in the spring 2021 reopening 36
Section 4
The nature of household finances during the crisis 54
Section 5
Government support will remain crucial to the recovery in incomes 67
Annexes 74
The Living Standards Audit | 2021
Resolution Foundation

Executive Summary
The Covid-19 crisis has stretched on for 16 months, creating a unique and very deep economic shock. Now the economy – and the labour market – is in full recovery mode driven by the speed of the vaccine rollout. So far, GDP has bounced back quicker than predicted earlier this year and the labour market is recovering well. But the spread of the Delta variant has also delayed the point at which all social distancing restrictions are removed, and there remains significant uncertainty around the economic recovery and household incomes in the wake of the removal of government schemes designed to support them.
Even before the Delta wave of infections, the Office for Budget Responsibility (OBR) expected aggregate household incomes to fall slightly in 2021, as various support measures are removed. With that context, this year’s Living Standards Audit assesses whether the economic recovery to GDP is translating into a labour market and living standards recovery, using new data from a survey of adults aged 18 and over conducted by YouGov in early June 2021, with 8,030 respondents. We also draw on recent official income data for 2019-20 to provide a definitive look at household incomes and living standards in the lead up to the crisis. In a companion report, to be released later in July 2021, the Resolution Foundation will assess how the crisis has impacted household wealth.
The Living Standards Audit | Executive Summary
Resolution Foundation
4

Official data suggests strong income growth in 2019-20, but the big picture of the 2010s was very weak growth in household incomes and rising child poverty
Official estimates suggested that household incomes boomed in 2019-20, just before the Covid-19 crisis hit, driven by a sharp rise in household earnings. But this is not seen in other – usually more reliable – data about the labour market, and this cautions us against over-interpreting year-on-year changes in what can be a volatile series.
Instead, it is safer to look at incomes data across several years, where the underlying story is families going into the pandemic having lived through the worst period for income growth in recent decades. Typical non-pensioner household income grew by an annualised rate of 1.7 per cent from 2014-15 to 2019-20, and low-to-middle income households saw even lower gains, with growth of just 1.5 per cent at the 30th percentile. Since the slowdown in household income growth started – around 2003-04 – income growth has been especially weak at the bottom of the distribution. The 10th percentile of incomes have increased by just 7 per cent since 2003-04, compared to 15 per cent at the median, and 15 per cent at the 90th percentile.
Income growth has had implications for poverty levels too. We show that 22 per cent of the population were in relative poverty in 2019-20, almost the same rate as in 2002-03. But this unchanging overall picture hides some important differences. In particular, since 2010-11, relative child poverty has increased from 27 per cent to 31 per cent, and it now stands at its highest rate since 2007-08, with more than three-in-ten children living in poverty. Child poverty rates in larger families – those with three or more children – are rising the fastest, with almost half of children in larger families living in relative poverty in 2019-20, twice the rate of children in smaller families. New food poverty statistics show the real-world impact of poverty, with one-in-eight households in the poorest fifth of the income distribution in very low food security.
The Living Standards Audit | Executive Summary
Resolution Foundation
5

The economy and the labour market are recovering quickly, but there is still a way to go
The reopening of much of the UK economy in recent months has driven swift and significant changes in the UK labour market. The relaxation of some social distancing restrictions has boosted opportunities: vacancies in May were higher than pre-pandemic levels; payroll employment in May rose by nearly 200,000 in the same month; and unemployment in February to April fell back to 4.7 per cent.
The recovery has also meant the number of people on the Job Retention Scheme (JRS) has been falling sharply, with official data showing a drop from 4.7 million at the end of February to 3.4 million at the end of April 2021. Findings from our own survey suggest there were 2.3 million workers on furlough in May, and data from the ONS Business Insights and Impact on the UK Economy (BICs) survey estimated that there were 1.5 million furloughed jobs in early June, although this source has historically underestimated the true number. Given our online survey tracked furlough in the month of May, it seems likely that furlough numbers have indeed fallen below 2 million by now. For the first time during the crisis, more than half of those furloughed were partially-furloughed (i.e. doing some paid work): our survey finds that the share of furloughed workers on full furlough fell from 73 per cent in February 2021 to 49 per cent in May. The BICs survey presents a similar picture, finding that 48 per cent were on full-furlough in the last two weeks of May.
But official data tell us little about the trajectories of workers coming off furlough; which types of workers are most at risk of being left on furlough; who has changed the sector they work in since the pandemic; and whether those who have left hard-hit industries like hospitality and leisure are likely to return. Starting with the destinations of respondents who were previously furloughed, our survey data indicates the success of the JRS in keeping firms and workers connected through the course of successive lockdowns: among respondents who were on any form of furlough in February, 78 per cent were doing some form of work by May, while 17 per cent were on full furlough and not working and just 3 per cent were now off furlough and not working. However, the self-employed continue
The Living Standards Audit | Executive Summary
Resolution Foundation
6

to be hit hard by the crisis: 10 per cent of respondents who were self-employed before the crisis were still out of work at the end of May, much higher than the share of former employees who are now unemployed or fully-furloughed (4 per cent in total). But welcome signs of an improvement in the labour market must not blind us to the fact that the labour market is a long way from recovered, with aggregate data showing there were still about 2 million fewer people working in early June than before the pandemic, and total hours worked still 5 per cent down.
Older workers on furlough have been less likely to leave furlough, and the reopening of some sectors has changed the sectoral mix of furloughed employees
The recent reopening of hospitality and some entertainment sectors has played a major role in changing not just how many workers are furloughed, but which types of workers they are. Our survey finds that hospitality, leisure, wholesale and retail and administrative services (including for example, office support roles, tour operators and office cleaners) accounted for just under 64 per cent of fully furloughed respondents in February, falling to 51 per cent in May.
Along with this has come a change in the age profile of furloughed workers, and especially workers on full furlough, where age gaps have largely eroded. In April 2020, surveyed 18-24-year-olds were nearly twice as likely to be on full furlough (23 per cent) than their 45-54-year-old counterparts (12 per cent); by May 2021 that gap had disappeared, with 2 per cent of each group reporting they were on full furlough. As a result, in April 2020, over-45s accounted for 38 per cent of those surveyed on full furlough; by May 2021 they accounted for half.
This reflects less positive outcomes for those older workers who have been furloughed: nearly three-quarters of respondents who were fully furloughed in April 2020 were back in work by May 2021, but those aged over 45 were less likely to be in work than those under 45. In the recent reopening period, 22 and 26 per cent of respondents aged 45-54 and 55+ who were fully furloughed in
The Living Standards Audit | Executive Summary
Resolution Foundation
7

February 2021 remained on full furlough in May, compared with just 6 per cent of their 35-44-year-old counterparts, and 16 per cent of 18-34-year-olds.
Of the estimated 2 million workers left on furlough in May, our survey finds respondent workers aged 18-to-34 were more likely to have been furloughed from jobs in hospitality and other heavily-affected sectors than older workers. But among those aged 45 and over and still on furlough in May 2021, 53 per cent come from the non-heavily-affected sectors, compared with 37 per cent of their 18-34-year-old counterparts.
As the end of the furlough approaches, the majority of respondents who are furloughed or unemployed have been in that state for at least half a year
Roughly one-in-four of the working-age population has been furloughed or had a spell of unemployment at some point in this crisis, but much more worrying is the extent of long-term lack of work (which we define as being unemployed or fully-furloughed for at least six months). We find that 57 per cent of 18-64-year-old respondents who were either unemployed or fully furloughed in May (and 62 per cent of those on full furlough) had been in that state for 6 months or more.
Evidence from past recessions has shown that older workers tend to return to work from a workless period at a much slower rate than their younger counterparts, and so we should be concerned that older workers still on furlough in May 2021 were at a much higher risk of being so for a long time: 69 per cent of furloughed or unemployed respondents aged 55 to 64 in May had been so for at least consecutive six months, compared to 38 per cent of those aged 18-to-24. That translates to 270,000 55-64-year-olds who have been fully furloughed or unemployed for six months or more, and 619,000 45-64-year-olds as a whole. Overall, this evidence is suggestive that, as the crisis abates, it is those young people still on furlough now who are more likely to return to work, with those older workers who remain furloughed more likely to be part of a residualised left-behind group.
The Living Standards Audit | Executive Summary
Resolution Foundation
8

Few workers who changed sector during the pandemic want to return to their previous industry
Our survey suggests that sectoral changes among respondents between February 2020 and April 2021 were double the normal rate, with 12 per cent indicating that they worked in a different sector in May 2021 than where they were in February 2021, as would be expected in a pandemic with large sectoral differences in impact. Changes were much higher among those who experienced a spell of furlough or unemployment over the time period (21 per cent) than among those who had not (8 per cent), and particularly high among those who used to work in sectors hit hard by the pandemic, including hospitality, personal services (including hairdressers, beauticians and repair workers) and leisure, but also in administrative services (which includes office support, office cleaners, tour operators among others). For example, 26 per cent of respondents who worked in administrative services had changed sector by May 2021, as compared to just 5 per cent of those who had worked in manufacturing.
Only a small share of respondents who changed sector want to return within the next six months (10 per cent of leavers from hospitality, leisure and non-supermarket retail, compared to 11 per cent of leavers from all other sectors). However, respondents who have moved from these harder-hit appear least content with their destinations. Instead of wanting to return to their previous sectors, they are more likely to say that they want to switch to another sector entirely: nearly one-in-five (20 per cent) want to move again, compared to just 15 per cent of changers from other sectors. This is suggestive of some taking jobs they thought of as temporary stop-gaps, and means that some employers in sectors unaffected directly by the pandemic may see higher rates of churn in future months as employees seek new opportunities.
Household incomes are starting to benefit from the labour market recovery, but the crisis will leave an unequal legacy via savings and debt
GDP dropped by 10.8 per cent in 2020-21, but household incomes remained remarkably resilient on average. This reflected
The Living Standards Audit | Executive Summary
Resolution Foundation
9

extensive government spending on income support programmes, which effectively doubled the size of the UK’s welfare system to 9 per cent of GDP.
The labour market shock was large and much more likely to affect workers in low-income households than higher-income households – 47 per cent of respondents in the bottom fifth of families who were working pre-pandemic have been negatively affected, compared to 20 per cent in the top income quintile. But our updated assessment is that real-terms median non-pensioner household income growth remained low in 2020-21 (with growth of just 1.5 per cent). This is impressive given the fall in GDP, and reflects the extent of government support.
Our survey also finds that families are seeing income gains as the economy recovers from Covid-19. Just over 25 per cent of respondent families reported an increase in income between February and May 2021, more than the 13 per cent who reported a fall. Despite this, around one-quarter of people are still spending less than before the pandemic, and higher-income households are the least likely to have returned to (or exceeded) pre-Covid spending. This reflects the higher discretionary spending power that higher-income households have, and that elements of consumer spending they are most likely to engage in – travel abroad, for example – are still limited by government regulations.
But the particular nature of this crisis – with the way it affected opportunities to spend for some as well as pushed up household costs for others – means that it is important to look at the effect of the crisis on household balance sheets, as well as income and spending. In June, individuals with the lowest incomes were much more likely to have seen savings fall from pre-crisis levels (32 per cent) than rise (12 per cent). The situation is completely reversed for higher-income individuals in our survey – only 10 per cent saw a savings fall, whereas four times as many people (46 per cent) saw their savings rise.
The enforced cut in household spending means that overall debt levels are down since pre-pandemic, but this is not true for everyone. A labour market shock or a pandemic-driven increase in costs without the flexibility to reduce outgoings or to draw on savings will inevitably result in more debt. Our
The Living Standards Audit | Executive Summary
Resolution Foundation
10

survey shows that 13 per cent of individuals saw their family debt level rise during the pandemic – rising to 21 per cent for those with incomes in the second lowest quintile. A large proportion of this increased debt was not through choice: over 40 per cent stated that increased spending pressures were at least partly responsible, and over 60 per cent for those on the lowest incomes. Separately, almost half of individuals who saw increasing debt during the pandemic cited lower earnings (or lower partner earnings) as a reason.
The recovery is on track but uncertain, with an anticipated income hit from this Autumn’s Universal Credit cut as the Job Retention Scheme phases out
The relatively benign impact of the crisis on average incomes so far should not distract us the uneven impact on household balance sheets, or from the threats that lie ahead.
The phase out of the JRS – one of the UK’s great policy successes of the Covid-19 crisis – has begun today, with employers required to pay a share of gross wages of their furloughed workers. The scheme is due to stop entirely at the end of September 2021. If the reopening of the economy proceeds as planned, with the number of workers on furlough falling and the majority left now partly working, then that timetable would seem appropriate. Should autumn still see substantial restrictions in some sectors – and the future seems uncertain for international travel, in particular – then there could be a case for continued Government support, but it would be much more sensible to do this through targeted schemes than continue an economy-wide programme. The latter would of course be the appropriate response to much more unwelcome pandemic developments, such as the emergence of vaccine resistant variants.
Some have also suggested that the JRS should be closed early to help provide a labour supply boost to the economy. This would be an over-reaction to anecdotal evidence of labour market tightness that is not borne out by the facts: two-year pay growth (stripping out base effects) is no higher than before the crisis. It also ignores that half of those on furlough are actually working for their employer through partial furlough. Despite recent calls that the labour market is heating-up as (anecdotally) firms are struggling to fill vacancies, we are not at full employment.
The Living Standards Audit | Executive Summary
Resolution Foundation
11

Supposed labour shortages are more likely to be due to the increased matching churn as a result of the economy opening up rapidly, rather than a structural lack of workers.
But it is very likely that firms will make redundancies as the JRS ends, and the evidence from our survey suggests that those made redundant could find themselves in a weak position in the labour market, with over 55 per cent of those on full furlough in May having been in that position for at least six months. This is especially concerning among older workers, who history suggests take longer to find new work after redundancy. Therefore, the Department for Work and Pensions should be preparing for a new wave of claims in the months ahead. Although smaller than the surge in March and April 2021, this will be a cohort that will need tailored support to find work – as they may have been out of work for some time – and it should be delivered as soon as possible.
In addition, the Government should continue the £20 a week boost to Universal Credit (UC). With one-in-four working-age families set to be on the benefit by the end of Parliament, avoiding incomes falling by 5.7 per cent at the bottom of the distribution ought to be a priority. Without this move, relative poverty will rise over this Parliament.
It is not just Universal Credit that will be in the spotlight this autumn. On current policy, pensioners are set to benefit hugely from the ratchet effect of the ‘Triple Lock’ this year. Over two years, the State Pension is set to increase by over 10 per cent, despite average earnings increasing by 6.5 per cent. It would be much more sensible for the Government to adopt a two-year measure of earnings growth in this unusual period – one that would see pensioners income follow a similar path to the rest of the economy and would avoid £4 billion per year of extra State Pension spending.
To deliver better living standards by the end of Parliament, the UK will need a strong recovery, and broad-based income growth
As we come out of the Covid-19 crisis period, the Government will want to return to its pre-crisis priorities. But it cannot overlook the legacy of the pandemic. This is most evident in
The Living Standards Audit | Executive Summary
Resolution Foundation
12

the impact on mortality and the nation’s health, as well as the accumulated pressures on the NHS. But the unequal changes in household balance sheets, together with any long-lasting scarring impacts of being out of work, could have a serious long-lasting impact on household living standards long after the crisis is over. The next few years will see new challenges as we negotiate our way into new trading arrangements, as the impact of the UK’s new migration policy become clear, and as decisions on the path to net zero start to have more direct implications for household finances and government spending. These will further complicate the perennial challenge of how to improve the UK’s productivity record to deliver stronger economic growth and raise household living standards – ensuring income growth across the income distribution. The Government – and the UK as a whole – has much more work to do in the years ahead if we are to prevent another dismal decade of living standards for UK households.
The Living Standards Audit | Executive Summary
Resolution Foundation
13

Section 1
Introduction
It is nearly 16 months since the rapid spread of Covid-19 led the Government to impose the UK’s first lockdown. Large swathes of the economy were shutdown, leading the Government to introduce various schemes to support incomes and employment. Taking stock in March this year, 12 months after the crisis began, we noted that the Government’s economic policy response had, at the aggregate level, been successful in insuring the labour market and household incomes from the unprecedented fall in economic activity.1 The OBR’s most recent forecast was for the economy to bounce back strongly in 2021 – driven by the speed of the UK’s vaccine rollout – and for aggregate household incomes to fall slightly in 2021, as the various support measures are removed.
As the economy began to re-open this spring, we are starting to see signs of a recovery. So far, GDP has bounced back more quickly than forecast by the OBR (in part due to upwards revisions by the ONS), as shown in Figure 1. Unemployment has also fallen to 4.7 per cent in April from 5.1 per cent in December 2020; the employment rate has remained relatively flat in recent months, now standing at 75.2 per cent, compared to 76.6 per cent before the crisis; and vacancies are at 90 per cent of their pre-pandemic levels.2
However, the spread of the Delta variant has also delayed the point at which all social distancing restrictions are removed, and there remains significant uncertainty around the economic recovery.3 There are also short-term threats to household incomes: at the time of writing, it was still the Government’s intention to stop the furlough scheme entirely – which was supporting the wages of an estimated 1.5 million workers at the start of June – and end the £20 a week uplift to Universal Credit, currently supporting over 4 million people (with over 1 million on tax credits), both on 30 September.4
1 See: T Bell & M Brewer, The 12-month stretch: Where the Government has delivered – and where it has failed – during the Covid-19 crisis, March 2021, Resolution Foundation.
2 Taken from: Labour market overview, UK, ONS, June 2021.3 For example, see the discussion of risks in: Monetary Policy Report, Bank of England, May 2021.4 DWP, People on Universal Credit, Stat-Xplore.
14The Living Standards Audit | 2021
Resolution Foundation

FIGURE 1: GDP has recovered quicker than previously expectedMonthly index of GDP, outturn and OBR forecast: UK
NOTES: the OBR’s March 2021 forecast is adjusted for the difference between the quarterly estimate of output and expenditure measures of GDP.SOURCE: RF analysis of ONS, GDP monthly estimate; OBR, Economic and Fiscal Outlook.
In this year’s Living Standards Audit, we assess the immediate question of whether the recovery to GDP is translating into a living standards recovery, and provide an updated analysis of the how the crisis has affected living standards among working-age households. We also draw on official income data for 2019-20, released earlier this year, to provide a definitive look at household incomes and living standards in the lead up to the crisis. This report focuses on incomes, as the most reliable measure of living standards and one where we have good historical data. But the Covid-19 crisis has had profound impacts on health and wellbeing, as we acknowledge in Box 1. In a companion report, to be released later in July 2021, the Resolution Foundation will further assess how the crisis has impacted household wealth.
The main source of historical data used in this report is the DWP’s Households Below Average Income survey, which gives us key data about household incomes, up to the 2019-20 financial year, ending just as Covid-19 crisis began.5 We will also be analysing our ‘Nowcast’, which covers the financial year 2020-21, in order to explore the impacts of the Covid-19 crisis on household incomes and living standards. Furthermore, to show the most recent effects of the crisis on incomes and living standards, we also use data from our own, original survey, conducted by YouGov in June 2021, of adults aged 18 and
5 The latest report is: DWP, Households below average income: an analysis of the income distribution FYE 1995 to FYE 2020, March 2021. The data-set used by us is: DWP. Households Below Average Income, 1994/95-2019/20. [data collection]. 15th Edition. UK Data Service. SN: 5828.
OBR: March 2021Outturn
70
75
80
85
90
95
100
105
Nov-19 Feb-20 May-20 Aug-20 Nov-20 Feb-21 May-21 Aug-21 Nov-21 Feb-22
Index, Jan 2020 =100
15The Living Standards Audit | 2021
Resolution Foundation

over and with 8,030 respondents. In most cases, we focus on non-pensioner household incomes – that is, of people living in households where no one is at or above the State Pension age.
6 Figure from: Deaths registered weekly in England and Wales, provisional: week ending 11 June 2021, ONS, June 2021.7 RF analysis of UK Government, Daily Deaths with Covid-19 on the death certificate. 8 For more information on the health effects of Covid-19, see T Bell & M Brewer, The 12-month stretch, Resolution Foundation,
March 2021 and R Sehmi & H Slaughter, Double Trouble, Resolution Foundation, May 2021.
Box 1. The Covid-19 crisis has primarily had a health impact, in addition to an economic impact on living standards
Although we primarily discuss the economic effects of the Covid-19 crisis in this report, the most significant effects of the crisis on living standards have been the effect it has had on health. At the time of writing, total excess deaths during the Covid-19 pandemic have reached 104,000 in England and Wales, millions of people in the UK have suffered from the illness, and we have lived through three separate lockdowns, with their attendant impacts on mental health and wellbeing.6 The health (and economic) effects of Covid-19 may not have been so severe if the UK had not successively locked down too late multiple times. Indeed, we estimated earlier this year that if the death rate had not risen in December
2020, there would have been up to 27,000 fewer deaths in England as a result of the winter wave.7 The virus has also had long-lasting effects beyond those that were initially anticipated: many people have suffered from Long Covid, and the nature of the crisis has led to an increase in the prevalence of mental health issues. This is especially true for young people, who were disproportionately likely to be in insecure work, and significantly more likely to have a mental health condition than they were ten years before. In addition, young people and women from lower-earning households have seen the largest rise in mental health problems between before the pandemic and April 2020.8
The rest of the report is set out as follows:
• Section 2 looks at living standards before Covid-19, showing income growth within the past year and over the past decade, and trends in poverty and inequality rates and material deprivation.
16The Living Standards Audit | 2021
Resolution Foundation

• Section 3 sets out our assessment of how the labour market and living standards have recovered since early 2021, as restrictions are relaxed.
• Section 4 examines the income impact of Covid-19, providing an update to our nowcast of household incomes in 2020-21, and presents new data on how household incomes and balance sheets are faring in the reopening phase,
• Section 5 assesses the ongoing importance of Government support during the economic recovery phase of the crisis.
Two annexes provide more information for technical audiences: Annex 1 sets out Resolution Foundation’s definition of households on low-to-middle incomes in the year 2019-20, and Annex 2 discusses our previous predictions for incomes with subsequently released outturn data.
17The Living Standards Audit | 2021
Resolution Foundation

Section 2
Living standards before Covid-19
Official estimates suggested that household incomes saw an apparent boom in 2019-20, just before the Covid-19 crisis hit. The Households Below Average Income data suggests this was caused by a sharp rise in household earnings, and a large rise in the fraction of individuals in low-income households who are in work. But this is not reflected in other data about the labour market, and this cautions us in over-interpreting year-on-year changes in what can be a volatile series. It is safer to look across several years, and that shows that growth in household incomes over the previous five years has been lacklustre, with typical non-pensioner household income growing by just 1.7 per cent per year, and low-to-middle income households seeing even slower growth, with growth of just 1.5 per cent per year at the 30th percentile. Households went into the pandemic having lived through the worst period for income growth in recent decades.
Relative child poverty increased in 2019-20 to the highest rate since 2007-08, with more than three-in-ten children living in poverty. It is particularly concerning that child poverty rates in larger families – those with three or more children – are rising the fastest. Almost half of children in larger families were living in relative poverty in 2019-20, twice the rate of children in smaller families, and the continuing roll-out of the two-child limit for Universal Credit means this is likely to rise further. New food poverty statistics show the real-world impact of poverty, with 1-in-20 low-income households living with very low food insecurity and unable to eat adequately – rising to 1-in-8 for the lowest-income households.
The UK appeared to see a small boom in living standards across the income distribution immediately before the Covid-19 crisis began
Before turning to the ongoing impact of the crisis on household incomes, this Section explores the state of incomes in 2019-20, and how incomes have been growing before the crisis.
18The Living Standards Audit | 2021
Resolution Foundation

The headline figures for 2019-20 showed what appeared to be exceptionally high annual income growth, with median income for non-pensioners growing by 5.7 per cent in real-terms in 2019-20 (see Figure 2). This is the largest increase since 2001-02 and a stark reversal to the small decline in incomes seen over the previous two years (with growth of 0.4 per cent in 2017-18 and -0.9 per cent in 2018-19).9 There was also a considerable difference with pensioners, where median pensioner household income grew by a modest 1.1 per cent in 2019-20.
FIGURE 2: 2019-20 saw the strongest year of income growth since 2001-02Annual real-terms growth in median non-pensioner household income: UK
NOTES: GB before 2002-03.SOURCE: RF analysis of DWP, Households Below Average Income.
Figure 3, which sets out longer-term trends for different parts of the non-pensioner income distribution, shows that this strong growth was not limited to median income, with income growth in 2019-20 stronger than previous years across the income distribution. This is particularly notable at the bottom, where growth of 7.1 per cent at the 10th income percentile came after two years of falling real incomes (with annual falls of 1.7 and 3.6 per cent), and compares to 4.0 per cent at the 90th percentile.
9 In this Section, unless otherwise stated, we report non-pensioner household incomes – that is, the incomes of individuals in household where no-one is over the State Pension age – measured after housing costs. The figures are also weighted by the number of people in the household (i.e. equivalised) and deflated into real-terms using the same approach as taken by the DWP in their report (Household Below Average Income, DWP, March 2021).
5.4%
-4%
-2%
0%
+2%
+4%
+6%
1995-96
1997-98
1999-00
2001-02
2003-04
2005-06
2007-08
2009-10
2011-12
2013-14
2015-16
2017-18
2019-20
Article 50
Strong, shared growth
Pre-crisis slowdown
Financialcrisis
RecoveryLow-inflationrecovery
19The Living Standards Audit | 2021
Resolution Foundation

FIGURE 3: The bottom of the income distribution has seen the weakest income growth in the past two decadesCumulative real-terms change since 2003-04 in selected points of the non-pensioner household income distribution: UK
NOTES: GB before 2002-03.SOURCE: RF analysis of DWP, Households Below Average Income.
These are very striking results. In Figure 4, we compare estimates of median household income from the HBAI series (both before and after housing costs), with estimates produced by the ONS (before housing costs) using a different underlying dataset.10 We typically take HBAI as our main source of data on the income distribution, as it has a larger sample size and devotes more time in the questionnaire to measuring income. However, it is worth comparing the two. Over long periods of time, though, both data sources tend to track each other closely: for example, the HBAI estimates are that median income before housing costs has risen by 7.7 per cent since 2009-10, compared to 6.9 per cent for the ONS data. But, although the two data sources were remarkably consistent in their estimates of growth in median income from 2013-14 to 2016-17, year-on-year changes can be substantially different. For example, the HBAI data shows growth of 4.5 per cent in median income in 2019-20, whereas the ONS estimate is of a slight fall, and this is the opposite pattern from 2017-18, where the ONS data suggested a sizable fall in median income, but HBAI suggested almost no change. A close comparison of the HBAI and ONS data suggests that the much higher growth rates in 2019-20 in HBAI reflect a form of correction to what seems to have been an underestimate of the level of median income in 2018-19.
10 For comparison purposes these income measures are across the entire population. ONS data is from ONS, Average household income, UK: financial year 2020.
-30%
-25%
-20%
-15%
-10%
-5%
0%
+5%
+10%
+15%
1994-95
1996-97
1998-99
2000-01
2002-03
2004-05
2006-07
2008-09
2010-11
2012-13
2014-15
2016-17
2018-19
p10
p30
Median
p70
p90
20The Living Standards Audit | 2021
Resolution Foundation

FIGURE 4: Differences between single year income growth rates have balanced out over the longer term for different surveysIndexed real-terms median household income measures (2009-10 = 100): UK
NOTES: ONS measure is based on Household Finances Survey data.SOURCE: ONS, Average Household Income; DWP, Households Below Average Income.
Increasing earnings and employment have driven the apparent boom in 2019-20 in the HBAI data, but this is not matched by other official data sources
It is important to understand what has driven this apparent mini-boom in incomes in 2019-20, given that it does not match other estimates of income growth.
Around four-fifths of the overall income growth in 2019-20 in the HBAI data is explained by a rise in earned income, which increased by 4.8 per cent in total (see Figure 5) and by 5.1 per cent among the middle-income quintile. As well as being the most important income source across households, this was also a higher rate of growth than other income sources.
ONS Average Household Income
DWP HBAI Before Housing Costs
DWP HBAI After Housing Costs
94
96
98
100
102
104
106
108
110
2006-07
2007-08
2008-09
2009-10
2010-11
2011-12
2012-13
2013-14
2014-15
2015-16
2016-17
2017-18
2018-19
2019-20
21The Living Standards Audit | 2021
Resolution Foundation

FIGURE 5: Growth in employee and self-employed earnings appeared to drive strong income growth in 2019-20Indices (in real-terms) of different sources of household income after housing costs for non-pensioner households (2007-08 = 100): UK
NOTES: Earned income includes gross employee pay and self-employment earnings. Income sources have been deflated by the after-housing-costs deflator used by DWP. ‘Other income’ includes income from investments, child maintenance, occupational pensioners (in early retirement for our below pension-age households) and other sources.SOURCE: RF analysis of DWP, Households Below Average Income.
However, the estimated growth in earned income in the HBAI data in 2019-20 is at odds with the official data on changes in the employment rate and average earnings, shown in Figure 6. Although employment and earnings both grew in 2019-20 according to other data, these other (and usually more reliable) estimates are considerably smaller than those implied by the FRS/HBAI data.11 In particular, the implied growth in average earnings in the FRS data is 3.1 per cent in 2019-20, much higher than the 1.0 per cent implied by ONS data. Employment growth in our index of FRS employment was also higher at 1.2 per cent, compared to the increase in the equivalent Labour Force Survey measure of just 0.9 per cent.
However, over a longer time period, the various series are much more comparable. Since 2007-08, for example, the FRS estimate of employment grew by 10.5 per cent, compared to 9.3 per cent in the LFS, and average earnings in the FRS has fallen by 2.1 per cent, compared to the ONS earnings measure remaining unchanged (an average difference per year of 0.2 per cent).
11 To compare like-with-like, we show measures of individual employment and earnings growth taken directly from the Family Resources Survey (FRS) – which is the survey that underlies the HBAI data. Employment and earnings changes in 2019-20 at the household level are almost identical to those at an individual level within the survey data, showing the difference lies with the data and not any household composition effect.
Earned income
Other income
Benefit income
Tax
Housing costs
70
75
80
85
90
95
100
105
110
115
2003-04
2004-05
2005-06
2006-07
2007-08
2008-09
2009-10
2010-11
2011-12
2012-13
2013-14
2014-15
2015-16
2016-17
2017-18
2018-19
2019-20
22The Living Standards Audit | 2021
Resolution Foundation

FIGURE 6: The recent growth in earned income in HBAI data is at odds with other labour market dataIndexed employment levels and average earnings measures: UK
NOTES: We calculate ONS average earnings per employed person as the sum of total employee compensation (ONS identifier: DTWM) and gross mixed income (ONS identifier: ROYH) divided by total employment (ONS identifier: MGRZ).SOURCE: RF analysis of DWP, Family Resources Survey and ONS.
As well as the rise in earned income in 2019-20 being considerably larger than other estimates, Box 2 shows that the HBAI data suggests that there was a particularly large rise in the fraction of individuals living in low-income working households in 2019-20.
Box 2. Estimates of the proportion of adults living in a working household
To understand more about the impact of the unexpectedly-strong earnings growth, Figure 7 shows the change in the number of adults living in a household where someone works between 2018-19 and 2019-20 for each income decile, and how that compares to the changes over the previous 20 years. It shows that the HBAI data suggests that there was a particularly large rise in the fraction of individuals living in working households in 2019-
20, with the single-year change (0.8 percentage points) being greater than that seen over the previous four years (0.5 percentage points). In particular, households in the second income decile saw a rise of 4.1 percentage points in the number of working households in the year to 2019-20 – compared with an average rise of 3.6 percentage points in the previous three years.
LFS 16-64 employment level
ONS average combined earnings
FRS 16-64 employment level
FRS average combined earnings
85
90
95
100
105
110
115
2003-04
2004-05
2005-06
2006-07
2007-08
2008-09
2009-10
2010-11
2011-12
2012-13
2013-14
2014-15
2015-16
2016-17
2017-18
2018-19
2019-20
23The Living Standards Audit | 2021
Resolution Foundation

FIGURE 7: 2019-20 saw a large increase in the proportion of adults living in a working householdChange in proportion of individuals living in working non-pensioner households by income decile: 1999-00 to 2019-20
SOURCE: RF analysis of DWP, Households Below Average Income.
This detailed look at recent changes in employment and average earnings suggests that the HBAI data may not be providing a reliable impression of the actual changes to household income between 2018-19 and 2019-20. But it is not clear that there is any fundamental flaw with the HBAI dataset for 2019-20 (the methodology is unchanged from previous years), and there is no reason to think that the HBAI estimate is any better or worse than the ONS estimate now that the size of the sample underlying the ONS estimate has increased. The most likely explanation for the high growth rate in 2019-19 is that part of it is due to the underlying sampling variability. This statistical variation arises because the underlying survey data is simply a sample of households in the UK – around 20,000 in the latest year.12 By chance, in any one year the survey may include slightly better-off or worse-off households compared to the population as a whole. And this can be exacerbated when looking at year-on-year changes, which might compare an overestimate in one year to an underestimate in another (we discuss this more in Box 3).13 Our overall assessment is that there is little evidence that the level of household incomes recorded in the 2019-20 HBAI is too high – in fact, the estimates line up well with the ONS estimates – and it is more likely that the estimates of household incomes in the
12 See: Family Resources Survey: background information and methodology, DWP, March 2021.13 The chance of any individual HBAI year not accurately reflecting population income growth is low. However, over several years of
surveying we would expect the occasional year to be less accurate.
+5ppts
+10ppts+7ppts
+4ppts
+4ppts
-2ppts
+4ppts
+3ppts+8ppts
+18ppts
+11ppts
+2ppts
-1ppts-1ppts -1ppts -1ppts
+0ppts -0ppts
+3ppts
-5ppts
0ppts
+5ppts
+10ppts
+15ppts
+20ppts
1 2 3 4 5 6 7 8 9 10 All
Change from 2018-19 to 2019-20Change from 2014-15 to 2018-19Change from 1999-00 to 2014-15
Poorer ← Decile of income distribution → Richer
24The Living Standards Audit | 2021
Resolution Foundation

2018-19 HBAI are too low. This conclusion is consistent with both the comparison with the ONS estimate and also the rapid growth in earnings implied by HBAI, which looks like a correction to several years of considerably under-reporting total earnings (as shown in Figure 6). For this reason, for the rest of this report, we draw conclusions from the 2019-20 estimates, but we focus on analysing changes over the medium or long-run.
14 For further details on using resampling datasets for confidence interval analysis, see: Household below average income series: quality and methodology information report FYE 2020, DWP, March 2021.
15 For more details, see: Work and Pensions Committee Oral evidence: Children in poverty: measurement and targets, HC 188, May 2021.
16 Review of Income-based poverty statistics, Office for Statistics Regulation, May 2021.
BOX 3: Understanding single year-on-year changes in household incomes
To formally assess the robustness of the income estimates in 2019-20, we have estimated confidence intervals around key measures of income growth in 2019-20, using the resampling HBAI datasets provided by DWP.14 Our results show a typical 95 per cent confidence interval of around 7 percentage points, meaning that an estimated growth of less than 3 percentage points is entirely consistent with the true growth rate being zero.
This means that that the estimated growth in median income in 2019-20 from HBAI is statistically-significant from zero – that is, the HBAI estimate of growth in median income would have been extremely unlikely to be 5.7 per cent were the true rate of growth actually equal to zero – but it does remind us that there is a relatively wide confidence interval around growth in median income, and we would not
be able to reject the hypothesis that the true growth rate was as low as 2.5 per cent. Repeating the analysis for incomes at the 10 percentile of incomes in each year gives a much wider confidence interval of some 17 percentage points, which is a salutary reminder that estimates of growth rates at the bottom of the income distribution are particularly uncertain.
Finally, it is worth noting that DWP are introducing a much larger sample (some 45,000 households) to the underlying HBAI survey, so in future years this may be less of an issue, and single year-on-year comparisons may be more statistically sound.15 In addition to this, the ongoing work led by the Office for Statistics Regulation to further improve all household income statistics is to be welcomed.16
25The Living Standards Audit | 2021
Resolution Foundation

Looking forward, the next year of HBAI data will cover the Covid-19 period. Given already identified issues with the Labour Force Survey, it will be especially important to take care when analysing income changes for the next few years of data.17
Income growth has improved in recent years, but still falls short of typical income growth in the late 1990s
We now focus on assessing the changes in incomes across the distribution over the previous five years. Even taking the latest data at face value, assessing incomes over the previous five years as a whole – from 2014-15 to 2019-20 – show that average annual growth rates are lower than they have been historically, with growth of 1.7 per cent per year at the median, 1.5 per cent at the 30th percentile, and 1.0 per cent at the 70th percentile (see Figure 8). Moreover, whereas the lowest income households saw the strongest growth in 2019-20 – 6.2 per cent at the 10th income percentile compared to 4.6 per cent at the median – the picture over the past five years is for low-income households to see weaker growth than households at the median and at the top of the distribution.
FIGURE 8: Income growth has been weak across the distribution in the five years before Covid-19, with low-income households falling behind those with middle incomesAnnualised real-terms growth in non-pensioner household income at selected points across the income distribution: UK
NOTES: GB before 2002-03. 5-year average calculated as the annualised income growth rate from 2014-15 to 2019-20.SOURCE: RF analysis of DWP, Households Below Average Income.
17 For more details, see: Update to Coronavirus - impact on labour market outputs, ONS, January 2021.
-6%
-4%
-2%
0%
+2%
+4%
+6%
+8%
2015-16
2016-17
2017-18
2018-19
2019-20
5 year average
p10 p30 Median p70 p90
26The Living Standards Audit | 2021
Resolution Foundation

This low level of household income growth from 2015-16 to 2019-20 is substantially below the rates of growth seen in the late 1990s and, for some quintile groups, the early 2000s. Figure 9 sets this out in detail, showing annualised five-year growth rates over consecutive five-year periods from 1994-95 to 2019-20 (this can also be seen in Figure 3). It shows that the latest five years (the dark blue line) had middling annual growth of between 1 to 2 per cent across the distribution. This is around 1 to 2 percentage points lower than the income growth in the ‘mini-boom’ during the late 1990s and early 2000s – but 1 to 2 percentage points higher than income growth during and following the financial crisis from 2009-10 to 2014-15.
As shown earlier (in Figure 8), growth across the distribution in the most recent five years to 2019-20 was fairly equal across the income distribution. In comparison, we can see that inequality reduced across the bulk of the distribution in the early 2000s, as incomes grew fastest at the bottom of the distribution, and from 2009-10 to 2014-15, when the impact of the financial crisis bore down heavily on higher-income families. On the other hand, incomes changed in a way that increased income inequality from 2004-05 to 2009-10.
FIGURE 9: Income growth in the five years before the Covid-19 crisis was an improvement compared to the previous decade, but still disparaging compared to the late 1990sAnnualised real-terms income growth rates over consecutive five-year periods across non-pensioner income distribution: UK
NOTES: GB before 2002-03. We exclude the very bottom and top of the distribution due to data reliability issues.SOURCE: RF analysis of DWP, Households Below Average Income.
-4%
-3%
-2%
-1%
0%
+1%
+2%
+3%
+4%
+5%
+6%
0 5 10 15 20 25 30 35 40 45 50 55 60 65 70 75 80 85 90 95
1994-95 to 1999-001999-00 to 2004-052004-05 to 2009-102009-10 to 2014-152014-15 to 2019-20
Poorer ← Percentile of income distribution → Richer
27The Living Standards Audit | 2021
Resolution Foundation

If we take a longer period, as we did earlier in Figure 3, we can see that the previous 16 years have seen an unprecedented slowdown in income growth. However, it is the lowest-income households that have seen the smallest growth in incomes since 2003-04, with incomes increasing by just 7 per cent for the lowest-income households, compared to 15 per cent at the median, and 15 per cent for the highest-income households. Some clues as to how that happened can be seen in earlier figures. For example, Figure 5 showed that average benefit income per household has fallen by 17 per cent since 2007-08 in real terms, despite earned income only rising by 3.5 per cent – a reflection of the cumulative benefit cuts made since 2010. Working in the other direction has been a fall in housing costs, down since 2007-08 by over a fifth in real-terms. Although much of this fall occurred during the financial crisis, they have also fallen by 6.5 per cent since 2016-17. Falling housing costs are largely as a result of lower interest rates benefiting pre-existing homeowners through cheaper mortgages, rather than falling rents (and certainly not due to falling house prices).18 Breaking this down by tenure shows that average housing costs for non-pensioners with a mortgage have fallen by 4.0 per cent in real terms from 2016-17 to 2019-20, whereas they have risen by 2.6 per cent for private renters. Since 2007-08, the difference is even more stark – those with a mortgage have seen average housing costs fall by 41 per cent, whereas average private renting costs have risen by 11 per cent – and this is compounded by a tenure shift towards private renting.19
Child and working-age poverty have remained broadly unchanged since the late 1990s
Although household incomes rose in 2019-20, there was no change in relative poverty rates, as shown in Figure 10. Notably, though, both child poverty and pensioner poverty rates increased in 2019-20, with child poverty increasing to 31 per cent (the highest rate since 2007-08) and pensioner poverty increasing to 18 per cent.
All of these are in line with medium-term trends. The overall relative poverty rate has remained steady since the early 2000s, fluctuating between 20 and 22 per cent since year 2002-03. Working-age poverty rates have been broadly unchanged for over two decades, and stood at 20 per cent in 2019-20. Pensioner poverty fell significantly from a high of nearly 30 per cent in the late 1990s to a low of 13 per cent in the early 2010s, but has been increasing since 2013-14 (although pensioners remain less likely to be in relative poverty, measuring incomes AHC as we do, than children or working-age adults).
18 L Judge & J Leslie, Stakes and ladders: the costs and benefits of buying a first home over the generations, Resolution Foundation, June 2021.
19 Since 2007-08, the share of below pension-age individuals renting privately has increased by 7 percentage points, with a similar fall in owning with a mortgage.
28The Living Standards Audit | 2021
Resolution Foundation

FIGURE 10: Overall relative poverty rates have remained unchanged since the late 1990s, but child and pensioner poverty have been trending up since the early 2010sProportion of individuals living in relative poverty: UK
SOURCE: DWP, Households Below Average Income.
Children (and, by extension, the adults that live in households with children, as these measures of poverty are based on household income) have faced consistently higher poverty rates than adults, with over one-in-four children having been in poverty every year since the mid-1990s (we discuss a wider range of child poverty measures in Box 4). The rise in child poverty in 2019-20 follows a slow and steady increase from the early 2010s, which in turn follows a significant drop during the late 1990s and early 2000s.
BOX 4: Trends in child poverty under various definitions
It is useful to consider trends in poverty under a range of poverty measures, which we do in Figure 11. In 2019-20, 21 per cent of children lived in poverty using the 50 per cent of median incomes (AHC) measure, and 31 per cent of children lived in poverty using the 60 per cent of median incomes (AHC) measure. Child poverty rates
using the 50 per cent of median incomes measure have been steadily increasing since the early 2010s, showing that the rise in relative poverty is not due to the choice of an arbitrary poverty line. The rate of absolute child poverty monitored by the Government (defined as children living in households with less than the median household
Children 31%
Working-Age20%
Pensioners
18%
All persons 22%
0%
5%
10%
15%
20%
25%
30%
35%
40%
1995-96
1997-98
1999-00
2001-02
2003-04
2005-06
2007-08
2009-10
2011-12
2013-14
2015-16
2017-18
2019-20
29The Living Standards Audit | 2021
Resolution Foundation

income of 2010-11), has been falling slowly in recent years, and there have also been small falls in the fraction of children who face material deprivation in addition to a relative low income
20 As noted recently by the Children’s Commissioners for Northern Ireland, Scotland and Wales in a recent letter to the Secretary of State.
(defined as living in household subject to material deprivation and with an income below 70 per cent of median income, before housing costs).
FIGURE 11: Absolute child poverty and material deprivation are falling slightly while relative child poverty is risingProportion of children living in relative poverty using different thresholds, absolute poverty and in low income and material deprivation: UK
NOTES: GB before 2002-03. SOURCE: DWP, Households Below Average Income; Institute for Fiscal Studies (IFS), Living Standards, Inequality and Poverty.
Figure 12 explores the rise in child poverty by showing how poverty rates vary by the number of children in the family. Child poverty has always been higher for families with three or more children than those in smaller families, but the poverty gap between smaller and larger families has been growing since 2012-13, with almost 1-in-2 children in large families (47 per cent) being in poverty in 2019-20, twice the rate for children in smaller families. It is highly likely that this growing disparity is driven by benefit policy. The two-child limit, which means that families do not receive the child element of Universal Credit or Child Tax Credits for third and subsequent children born after the 6th April 2017, will explain some of the recent rise in poverty in larger families.20 However, child poverty
Below 60% of median incomes
Below 50% of median incomes
Absolute poverty
In low income and material deprivation
0%
10%
20%
30%
40%
50%
60%
1994-95
1996-97
1998-99
2000-01
2002-03
2004-05
2006-07
2008-09
2010-11
2012-13
2014-15
2016-17
2018-19
30The Living Standards Audit | 2021
Resolution Foundation

rates for larger families were increasing before 2017, so this policy doesn’t completely explain this increase. Other policy decisions that will affect these rates include the benefit cap, introduced in 2013 and made more restrictive in 2016, as families with three or more children are more likely to have their benefits capped than other families, as well as the various years in which benefit rates were frozen.
FIGURE 12: Rising child poverty is driven by the growing poverty risk among larger familiesProportion of children living in relative poverty (after housing costs) by number of children in the family: UK.
NOTES: GB before 2002-03. SOURCE: RF analysis of DWP, Households Below Average Income.
Individuals in low-to-middle income households continue to face material disadvantages
The statistics presented in this section can be rather dry, and discussions of measures of relative income poverty can seem far removed from the real lives of families living on a low income. But behind these statistics are millions of families living on a low income in material disadvantage or unable to afford essentials. For example, as shown in Figure 13, 34 per cent of individuals living in households in the bottom income quintile (which broadly corresponds to those in relative poverty) are unable to afford household contents insurance, and almost half (48 per cent) of such individuals are unable to save just £10 per month – something many people take for granted.
One child
24%Two children
24%
Three or more children 47%
0%
10%
20%
30%
40%
50%
60%
1995-96
1997-98
1999-00
2001-02
2003-04
2005-06
2007-08
2009-10
2011-12
2013-14
2015-16
2017-18
2019-20
31The Living Standards Audit | 2021
Resolution Foundation

FIGURE 13: One-in-three individuals live in low-income families that cannot afford contents insurance, or to repair or replace broken appliancesProportion of people living in families unable to afford basic goods and services, by non-pensioner household income quintile: UK, 2019-20
SOURCE: RF analysis of DWP, Households Below Average Income and Family Resources Survey.
Low-income households are also more likely to be in food insecurity. As Figure 14 shows, one-in-four people living in households (24 per cent) in the bottom income quintile live in food insecurity, with half of those living in very low food security.21 In contrast, just 6 per cent of individuals living in households on medium incomes (that is, the middle income quintile) are food insecure, with hardly any high-income households falling into this category.
21 Food insecurity is defined as answering two or more food security questions negatively. For example: ‘Did you ever eat less than you felt you should because there wasn’t enough money for food?’. For full details, see: Family Resources Survey: financial year 2019 to 2020, DWP, March 2021.
5%
13%
22%
37%
48%
1%
5%
11%
21%
35%
1%
3%
10%
23%
34%
0% 10% 20% 30% 40% 50% 60%
Highest income
4
3
2
Lowest income
Cannot afford household contentsinsuranceCannot repair or replace brokenelectrical goodsCannot save £10 per month
32The Living Standards Audit | 2021
Resolution Foundation

FIGURE 14: Low-income households are more than three times more likely to live in food insecurity compared to middle-income householdsProportion of people living in households with low or very low food security, by non-pensioner household income quintile: UK, 2019-20
SOURCE: RF analysis of DWP, Households Below Average Income and Family Resources Survey.
Income inequality has changed little since the early 1990s, meaning the UK continues to have one of the highest levels of income inequality among comparable developed countries
Along with the long-term stability in relative poverty has also been long-term stability since the early 1990s in the level of income inequality in the UK (see Figure 15). But this represents stability at a high level: the UK’s rate of income inequality is higher than all countries in the EU except Bulgaria, the second highest in the G7 other than the US, and higher than all countries in the OECD except the US, Mexico and Chile.22
Inequality increased markedly during the 1980s, with the Gini coefficient (a measure of inequality, where zero means no inequality and 100 means absolute inequality) jumping around 10 percentage points by all measures, from around 25 per cent to around 35 per cent between 1978 and 1989. Before and after housing cost rates of inequality also started to diverge during the 1980s, reflecting the increasing effect of housing costs on inequality.23 Since the financial crisis, rates of inequality have been high but steady, with the Gini coefficient (after housing costs) being at or just below 40 per cent, and the Gini
22 RF analysis of OECD, Income Inequality. 23 We show measures of inequality before and after housing costs separately. As discussed earlier in this Section, low-income
households spend a higher proportion of their incomes on housing costs compared to high income households, meaning that housing costs are regressive across the distribution, and so inequality is higher when measuring incomes after housing costs.
12%
7%4%
2%5%
12%
6%
2%4%
0%
5%
10%
15%
20%
25%
30%
Lowest income 2 3 4 Highest income All
Very low food securityLow food security
33The Living Standards Audit | 2021
Resolution Foundation

coefficient (before housing costs) around 35 per cent, with both the HBAI and ONS series broadly agreeing in recent years.
FIGURE 15: Inequality has remained steady since the financial crisis, and has changed little since the early 1990sGini coefficient for equivalised disposable income: UK
NOTES: UK from 2002-03, GB before.SOURCE: DWP, Households Below Average Income: Institute for Fiscal Studies (IFS), Living Standards, Inequality and Poverty: and Office for National Statistics (ONS), Effects of taxes and benefits on UK household income.
As shown in Figure 16, household income gaps between different ethnicities are prevalent and persistent. Pakistani and Bangladeshi households have the lowest household incomes (household income including pensioner incomes) of the ethnic groups. Incomes for Pakistani and Bangladeshi households have increased during recent years: by around £2,500 in real terms (just over 20 per cent of their median household incomes) compared to an increase of £2,100 (9 per cent of their median household incomes) for the White ethnicity group. Despite these increases, the income gaps between Pakistani and Bangladeshi households and White households remain; with median incomes for Pakistani and Bangladeshi households being over 40 per cent lower than the median household incomes of White households.
0%
5%
10%
15%
20%
25%
30%
35%
40%
45%
1961 1966 1971 1976 1981 1986 1991 1996-97
2001-02
2006-07
2011-12
2016-17
HBAI (before housing costs)
HBAI (after housing costs)
ONS (before housing costs)
34The Living Standards Audit | 2021
Resolution Foundation

FIGURE 16: Large income gaps between different ethnic groups have persisted over timeThree-year average (year ending) of median real (CPI-adjusted to 2020-21 prices) equivalised disposable household income, after housing costs, by ethnicity
NOTES: GB before 2002-03.SOURCE: RF analysis of DWP, Households Below Average Income.
This Section has shown the trajectory of incomes, poverty and inequality preceding the Covid-19 crisis, showing a small period of income growth following a longer period of stagnation; and stable poverty and inequality rates overall, but increasing poverty and inequality for some groups. In the next chapter we will consider the effect of Covid-19 on incomes in 2020-21.
White
Mixed/multiple ethnic groups
Indian
Pakistani
Bangladeshi
Chinese
Any other Asian backgroundBlack African/Caribbean/BritishOther ethnic group
£10,000
£12,000
£14,000
£16,000
£18,000
£20,000
£22,000
£24,000
£26,000
2007-08
2008-09
2009-10
2010-11
2011-12
2012-13
2013-14
2014-15
2015-16
2016-17
2017-18
2018-19
2019-20
35The Living Standards Audit | 2021
Resolution Foundation

Section 3
Employment and incomes in the spring 2021 reopening
The reopening of much of the UK economy is translating into swift, and significant, changes in the UK labour market. Alongside growth in vacancies and employment, the Job Retention Scheme has proved to be a success in supporting viable jobs through successive lockdowns: of respondents who were on any form of furlough in February of this year, 78 per cent were doing some form of work by May. But although the pandemic has had the largest effects on younger workers, the younger workers are currently moving off furlough and into work faster than older age groups. Over a quarter (26 per cent) of 55-64-year-old respondents who were fully furloughed in February remained so in May; compared with just 6 per cent of their 35-44-year-old counterparts. Nearly seven-in-ten (69 per cent) of 55-65-year-oldswho were unemployed or fully furloughed in May had been so for six months or more, compared with 57 per cent overall. There is a risk that those older workers still furloughed as the JRS comes to an end are more likely to be part of a residualised left-behind group. This section presents new findings, largely based on a recent online survey commissioned by the Resolution Foundation and conducted by YouGov in the first week of June 2021, which asked respondents to report their employment information for the week from the 24th to the 30th of May.24
The relaxation of restrictions in the spring has driven a labour market recovery
The UK’s recent relaxation of social distancing restrictions, including the reopening of indoor dining and some entertainment, has driven a welcome rise in vacancies and employment, alongside falls in the number of furloughed jobs. Recent figures from the ONS find that there were 880,000 vacancies in May (higher than pre-pandemic levels25)
24 The survey undertaken by YouGov from the 3rd – 8th June 2021, has a sample size of 8,030 adults aged 18+. Results are weighted so as to be representative of the population of that age group.
25 In the single-month figures.
36The Living Standards Audit | 2021
Resolution Foundation

and that payroll employment rose by nearly 200,000 in the same month.26 The ONS Labour Force Survey findings for February to April were also upbeat: with employment up and the headline unemployment rate falling to 4.7 per cent – its lowest rate since last summer (see Figure 17).27
FIGURE 17: Headline labour market figures suggest a recovery is underway16-64-year-old employment rate, 16+ unemployment rate, 16-64-year-old inactivity rate: UK, January 2020 to April 2021
SOURCE: RF analysis of ONS, Labour Market Statistics. Data covers up to the first week of May 2021.
Alongside this, the number of employee jobs on the Job Retention Scheme (JRS) has been coming down quickly: the latest HMRC figures show the number of employments on furlough fell from 4.7 million at the end of February to 3.4 million at the end of April.28 Our recent online survey lends support to these positive headlines (see Figure 18), suggesting that there were 2.3 million workers on furlough in May. Data from the ONS Business insights and impact on the UK Economy (BICs) survey also estimates that there were 2 million furloughed employments in mid-May, dropping to 1.5 million (6 per cent of employees) in early June (Figure 18 shows that the BICs data has in the past underestimated the actual number on furlough, and our online survey has tended to overestimate it). 29
26 HMRC real-time PAYE dataset, via ONS Labour Market Statistics, 15 June 2021. 27 Figure 1 was originally published as part of the Resolution Foundation 15 June 2021 labour market statistics reaction.28 HMRC, Coronavirus Job Retention Scheme statistics, 3 June 2021.29 ONS, Business insights and impact on the UK economy, 17 June 2021.
3%
4%
5%
6%
Jan 20 Jul 20 Jan 21
16+ unemployment rate
One-month
Three-month series
Weekly series
One-month series Weekly
series
73%
74%
75%
76%
77%
78%
Jan 20 Jul 20 Jan 21
16-64 employment rate
Three-month
One-month series
Weekly series
19%
20%
21%
22%
23%
Jan 20 Jul 20 Jan 21
16-64 inactivityrate
Three month
37The Living Standards Audit | 2021
Resolution Foundation

FIGURE 18: The number of people on furlough has fallen markedly since the most recent lockdownNumber of furloughed workers, actual count from HMRC and estimates from surveys: UK
NOTES: For the estimates based on ONS BICs and YouGov surveys, the estimate is based on the proportion of employments furloughed, scaled up to the number of eligible employments reported by HMRC. Base in the YouGov survey is those who were employees at the start of the crisis (n = 3,957). The proportions on furlough have been calculated at the sector level, and weighted based on sector proportions from ONS, Workforce Jobs, for March 2021. The RF/YouGov survey was conducted 3rd-8th June; respondents were asked to provide employment information for the survey reference week of 24th-30th May. All figures have been analysed independently by the Resolution Foundation. The views expressed here are not necessarily those of YouGov.SOURCE: HMRC Job Retention Statistics; RF analysis of ONS, Business Impact of Coronavirus Survey; and RF analysis of YouGov, Adults Age 18+ and the Coronavirus (COVID-19), June 2021 wave.
In a positive sign, our survey found that in the last week of May, only a minority (49 per cent) of furloughed respondents were ‘fully’ furloughed, down from 73 per cent of furloughed respondents in February (see Figure 19).30 Similarly, the latest data points from ONS’s BICs survey suggests the share of furloughed employees on ‘full’ furlough at the end of May fell below 50 per cent (48.7 per cent) for the first time since the ‘partial’ furlough option became available in July 2020.31
30 We categorise respondents who reported working in one job while being furloughed in another as being on ‘full furlough,’ although it is technically possible that some of this group may be partially furloughed in one role while working in another one.
31 ONS, Business insights and impact on the UK economy, 17 June 2021.
HMRC actual
Estimate from ONS Business Impact of Coronavirus Survey
Estimate based on RF/YouGov
0
1m
2m
3m
4m
5m
6m
7m
8m
9m
10m
Mar 20 Apr 20 May 20 Jun 20 Jul 20 Aug 20 Sep 20 Oct 20 Nov 20 Dec 20 Jan 21 Feb 21 Mar 21 Apr 21 May 21 Jun 21
38The Living Standards Audit | 2021
Resolution Foundation

FIGURE 19: For the first time since partial furloughing became available, there are now more workers on ‘partial’ furlough than on ‘full’ furloughNumber of furloughed jobs/workers by full and partial furlough: UK
SOURCE: HMRC Job Retention Statistics; RF analysis of ONS, Business Impact of Coronavirus Survey.
Although the headline figures show that the number of respondents on furlough is on a clear decline, official data doesn’t tell us about the employment destinations of those rolling off of furlough. For that, we can turn to new evidence from our survey. Figure 20 shows the labour market status in May of surveyed workers who were (fully or partially) furloughed in February, and reveals that 79 per cent of those who were on some form of furlough in February were doing some form of work in May. This includes 49 per cent who moved completely off of furlough and into work, 8 per cent who moved from full to partial furlough and 22 who were on partial furlough or being furloughed in one job while working in another. Only 17 per cent of those fully furloughed in February remained on furlough and out of work in May, and 3 per cent of those on any form of furlough in February had moved off furlough and were not in work by May. This shows that the JRS is broadly working as intended, supporting employees’ earnings and keeping firms and workers connected while restrictions limiting their activity are in place.
39The Living Standards Audit | 2021
Resolution Foundation

FIGURE 20: Nearly half of respondents furloughed in February were working by MayLabour market status among respondents in May 2021 who were furloughed in February 2021, 18-64-year-olds: UK, data collected 3-8 June 2021
NOTES: The base is all respondents who indicated they were fully furloughed, partially furloughed or furloughed while working in another job during February 2021, excluding those whose labour market status was listed as ‘don’t know/can’t recall’ or ‘none of these’ (n=472). The RF/YouGov survey was conducted 3rd-8th June; respondents were asked to provide employment information for the survey reference week of 24th-30th May. The views expressed here are not necessarily those of YouGov.SOURCE: RF analysis of YouGov, adults age 18+ and the Coronavirus (COVID-19), June 2021 wave.
However, this good news does not mean that the labour market has fully recovered. There remains significant room for improvement: for example, there were an estimated 2.3 million fewer people working in the UK in early June than before the crisis.32 In particular, the recent good news among employee jobs is not matched among the self-employed, who continue to be hit particularly hard by this crisis, as we discuss in Box 5.
32 This is before factoring in for any further changes to employment since the latest HMRC and ONS data. See: T Bell et al., Understanding the labour market: pandemic not pandemonium: the labour market is normalising, not overheating, Resolution Foundation, June 2021.
49% 8% 22% 17% 3%
0% 10% 20% 30% 40% 50% 60% 70% 80% 90% 100%
Feb-May2021
Any furlough to working & not furloughedFull to partial furlough (inc. working while furloughed in another job)Partial furlough (inc. working & furlough another job) stillStill fully furloughedPartial furlough (inc. working & furloughed another job) to full
40The Living Standards Audit | 2021
Resolution Foundation

BOX 5: Changes among the self-employed
33 See: M Brewer et al., Jobs, Jobs, Jobs, Resolution Foundation, October 2020, and N Cominetti, et al., Long Covid in the labour market: the impact on the labour market of Covid-19 a year into the crisis, and how to secure a strong recovery, Resolution Foundation, February 2021.
Previous Resolution Foundation research has set out the extent to which self-employed workers were particularly affected by the pandemic.33 Our survey found that 10% of those respondents who had been self-employed in February 2020 were self-employed but not working in May. This is much higher than the share of respondents who were employed in February 2020 that were unemployed or economically inactive (1.3 and 3 per
cent, respectively) or fully furloughed (1.6 per cent) in May. Nearly four-in-ten (38 per cent) of self-employed respondents who were not working between March and July 2020 reported claiming and receiving from the Self-employed Income Support Scheme (SEISS) during that period. Just over a third reported doing so in between February and April 2021 (between 34 per cent in February and 28 per cent in April 2021).
FIGURE 21: One-in-ten respondents who were self-employed before the pandemic were still self-employed but not working in MayEmployment status in May 2021 of those who were employed and self-employed in February 2020: UK, 24-30 May 2021
NOTES: The base is all respondents who indicated they were self-employed (n=526) and employed (n=3,957) in February 2020. The RF/YouGov survey was conducted 3rd-8th June; respondents were asked to provide employment information for the survey reference week of 24th-30th May. The views expressed here are not necessarily those of YouGov.SOURCE: RF analysis of YouGov, adults age 18+ and the Coronavirus (COVID-19), June 2021 wave.
11%
92%
4%
3%
73% 10%
0% 10% 20% 30% 40% 50% 60% 70% 80% 90% 100%
Self-employed
Employed
Employed Inactive UnemployedFurloughed Self-employed & working Self-employed & not workingOther
41The Living Standards Audit | 2021
Resolution Foundation

As the number of people on furlough falls, those remaining are increasingly likely to be older and to have been furloughed for a long period of time
Given the nature of the crisis, furlough take up has varied widely by sector, with those that provide in-person services, like hospitality, entertainment, hairdressing, or even office support roles being particularly affected during the pandemic. As we would expect as the economy reopens, our survey suggests that the overall share of furlough accounted by hard-hit sectors is coming down. Hospitality, leisure, wholesale and retail and administrative services (a grouping that includes office support roles, tour operators and office cleaners) accounted for just under 65 per cent of fully-furloughed respondents in February, falling to 51 per cent in May.
It’s long been clear that the young people have borne much of the brunt of the pandemic’s labour market effects: our survey finds that more than four-in-ten (44 per cent) of 18-24-year-old respondents have experienced furlough or unemployment at some point during the pandemic, a figure that falls with age (see the left-hand panel of Figure 22). Just over one-in-four (28 per cent) of 25-34-year-old respondents and just under one-in-five (19 per cent) aged 55-64 reported the same.
FIGURE 22: The steep age gradient that characterised the employment effects of the pandemic has begun to flattenProportion of respondents experiencing furlough or unemployment, by age group and time period: UK, data collected 3-8 June
NOTES: The base is all respondents age 18-24 (n = 732); 25-34 (n = 1,347); 25-34 (n = 1,382); 35-44 (n= 1,382); 45-54 (n = 1,356); 55-64 (n = 1,188). The RF/YouGov survey was conducted 3rd-8th June; respondents were asked to provide employment information for the survey reference week of 24th-30th May. The views expressed here are not necessarily those of YouGov.SOURCE: RF analysis of YouGov, adults age 18+ and the Coronavirus (COVID-19), June 2021 wave.
18-24
18-24
25-34
25-34
35-44
35-44
45-54
45-54
55-64
55-64
0%
5%
10%
15%
20%
25%
30%
35%
40%
45%
50%
Ever furloughed/unemployed Furloughed/unemployed in May-21
42The Living Standards Audit | 2021
Resolution Foundation

But as ‘shut-down’ parts of the economy (and especially sectors like hospitality and leisure, which had a disproportionately young workforce before the crisis hit34) have begun to open up, the age-related gradient of furlough or unemployment experience has flattened somewhat. In May, the proportion of 18-24-year-old respondents that reported being on furlough or unemployed (16 per cent) remained roughly double that of other age groups, but the remaining age gradient (between 25-65-year-olds) has all but disappeared: the likelihood of a 45-54-year-old respondent being furloughed or unemployed (8 per cent) is now the same as for a 25-34-year-old.
FIGURE 23: By May 2021, young people were only slightly more likely to be furloughed than their older counterpartsProportion of respondents on furlough, by furlough type and age group in April 2020 (left-hand panel) and May 2021 (right-hand panel): UK, data collected 3-8 June 2021
NOTES: The base is all respondents who provided their labour market status (excluding those who answered “don’t know/can’t recall” and “none of these) by age band in April 2020 and in May 2021. Sample size for April 2020 is as follows: 18-24 = 584. 25-34 = 1,235; 35-44 = 1,281; 45-54 = 1,240. In May 2021, 18-24 = 612; 25-34 = 1,232; 35-44 = 1,285; 45-54 = 1,241; 55-64 = 1,098. The RF/YouGov survey was conducted 3rd-8th June; respondents were asked to provide employment information for the survey reference week of 24th-30th May. The views expressed here are not necessarily those of YouGov.SOURCE: RF analysis of YouGov, adults age 18+ and the Coronavirus (COVID-19), June 2021 wave.
Turning to furlough specifically, we find an even sharper trend. The left-hand panel of Figure 23 shows that, at the start of the crisis, the proportion of young respondents (age 18-24) who were furloughed (fully furloughed or working in one job while furloughed in another) was substantially higher than among their older counterparts. In April 2020, 23 per cent of 18-24-year-old respondents were fully furloughed (and not working elsewhere),
34 According to our survey, in February 2020, 18-24-year-old respondents comprised 36 per cent of those working in hospitality and 25-34-year-olds comprised a further 23 per cent. In hospitality, 18-34-year-olds comprised 34 per cent of respondents. Base = all respondents working in hospitality (n= 208) and leisure (181) in March 2020.
43The Living Standards Audit | 2021
Resolution Foundation

nearly double the share of surveyed 45-54-year-olds (12 per cent). By May 2021 this gap had almost entirely disappeared: the share of 18-24-year-old respondents on full furlough (2 per cent) was the same as those aged 45-to-54.
These changes are reflected in the composition of workers on furlough (Figure 24), where we also find a narrowing of age gaps. In April 2020, the over-45s as a whole accounted for 38 per cent of those on full furlough; by May 2021 they accounted for half. The share of fully-furloughed workers accounted for by 45-54-year-olds grew from just under one-in-five (19 per cent) to just under one-in-four (24 per cent) over the same timeframe.
FIGURE 24: More than half of workers fully furloughed in May were age 45 and olderShare of furloughed workers in different age categories, by furlough type and time period: UK, data collected 3-8 June 2021
NOTES: The base is all respondents who were fully furloughed in April 2020 (n=750) and May 2021 (n=91);
that were partially furloughed in May 2021 (n=126) and furloughed in one job working in another in April 2020 (n=68) and in April and May 2021 (n=71). Figures on the age-related composition of respondents working in one job while furloughed in another in May 2021 were combined with those of April 2021 in order to achieve a larger sample size. The RF/YouGov survey was conducted 3rd-8th June; respondents were asked to provide employment information for the survey reference week of 24th-30th May. The views expressed here are not necessarily those of YouGov.SOURCE: RF analysis of YouGov, adults age 18+ and the Coronavirus (COVID-19), June 2021 wave.
The rising share of furloughing accounted for by older workers reflects the fact that younger workers have been flowing off furlough and into work at a faster rate. Figure 25 shows the employment status in May 2021 of respondents who were fully furloughed in April 2020, by age group. Overall, nearly three-quarters of respondents who were fully
19% 16% 17%26% 30%
22%20% 19%
21% 18%
21%15% 22%
24% 28%
19%24%
22%
16% 11%12% 17% 13%
7% 11%7% 8% 7% 6%
0%
10%
20%
30%
40%
50%
60%
70%
80%
90%
100%
Apr-20 May-21 May-21 Apr-21 April & May-2118-24 25-34 35-44 45-54 55-64 65+
Full furlough Partial furlough Furloughed; working in another job
44The Living Standards Audit | 2021
Resolution Foundation

furloughed in April 2020 were back in work by May 2021, but the share of respondents age 45 and older who were still furloughed in May (11 per cent) is more than double the share of 35-44-year-olds who were (5 per cent). This pattern holds when we consider the May 2021 status of respondents who were fully furloughed over the latest lockdown. 22 and 26 per cent of 45-54 and 55+ respondents who were fully furloughed in February 2021 remained on full furlough in May, compared with just 6 per cent of their 35-44-year-old counterparts, and (a slightly larger) 16 per cent of 18-34-year-olds.
FIGURE 25: Older respondents who were furloughed in April 2020 and February 2021 are more likely to have remained fully furloughed than their younger counterpartsMay 2021 employment status among respondents fully furloughed in April 2020 (lefthand panel) and February 2021 (right-hand panel): UK, data collected 3-8 June 2021
NOTES: The base is all respondents who were fully furloughed in April 2020 and in February 2020 that provided their current employment information in May 2021 (excluding those who indicated that their current employment in May 2021 was “other”) by age group. Sample size for those furloughed in April 2020 is as follows: 18-34 = 203; 35-44 = 164; 45-54= 138; 55+ = 148. Sample size for those furloughed in February 2021 is as follows: 18-34 = 117; 35-44 = 53; 45-54 = 53; 55+ = 69. The 18-24 and 35-44, and 55-64 and 65+ age groups were combined in order to achieve a sufficient sample size. The RF/YouGov survey was conducted 3rd-8th June; respondents were asked to provide employment information for the survey reference week of 24th-30th May. The views expressed here are not necessarily those of YouGov.SOURCE: RF analysis of YouGov, adults age 18+ and the Coronavirus (COVID-19), June 2021 wave.
The different rates of leaving furlough across those of different ages are related to the changing the sectoral mix of workers who remain on furlough. Figure 26 also shows that older furloughed respondents in May were spread much more evenly across different sectors than younger furloughed workers, and indeed were somewhat over-represented in sectors that we would not normally think have been heavily affected by Covid-19 restrictions (for example, manufacturing, construction and IT and communications).
6%7% 5% 14%6%5%
11%11%
85% 91%78% 73%
0%
10%
20%
30%
40%
50%
60%
70%
80%
90%
100%
18-34 35-44 45-54 55+Unemployed InactiveFully furloughed Working
Furloughed in April 2020
16%6%
22%26%
81%92%
71% 65%
0%
10%
20%
30%
40%
50%
60%
70%
80%
90%
100%
18-34 35-44 45-54 55+Unemployed InactiveFully furloughed Working
Furloughed in Februray 2021
45The Living Standards Audit | 2021
Resolution Foundation

Overall, 53 per cent of respondents aged 45 and older that were furloughed in May were in less-affected sectors (i.e. those sectors outside of hospitality, leisure, administrative support services and personal services), compared with 37 per cent of those aged 18-34.
FIGURE 26: Older respondents are furloughed across a wider range of sectors than their counterpartsShare of furloughed respondents in each sector, by age group in May 2021: UK, data collected 3-8 June 2021
NOTES: The base is all respondents who were fully furloughed, partially furloughed or furloughed while
working in another job in May 2021, by age group. Same size is as follows: 18-34 = 75; 35-44 = 50; 45+ = 101. The 18-24 and 18-34; and 45-54, 55-64 and 65+ age groups were combined in order to achieve a sufficient sample size. The RF/YouGov survey was conducted 3rd-8th June; respondents were asked to provide employment information for the survey reference week of 24th-30th May. The views expressed here are not necessarily those of YouGov. Furloughed workers include those on full furlough and partial furlough including those furloughed and working in another job.SOURCE: RF analysis of YouGov, adults age 18+ and the Coronavirus (COVID-19), June 2021 wave.
A small but significant share of the population have experienced long-term worklessness
Long-term unemployment often leads to employment scarring, where those who have been out of work for six months or more are at risk of losing motivation and having their skills depreciate, and potential employers are often hesitant to take on new hire with a significant gap on their CV.35 It’s unclear whether those who have been furloughed for the longer-term are likely to suffer similar forms employment scarring: the signalling effects
35 See: P Gregg & E Tominey, The Wage Scar from Youth Unemployment, Labour Economics, 2005; Z Nazarov, N Adilov & H Tierney, Human Capital Depreciation and Stigma Effects in Unemployed Workers’ Re-Employment Wages, July 2018.
16%
6%
24%
9%
8%
18%
8%
16%
11%
7%
12%
5%
8%
4%
6%
11%
10%
11%
10%
8%
8%
8%
7%
7%
10%
6%
7%
9%
5%
6%
8%
3%
3%
2%
0% 10% 20% 30% 40% 50% 60% 70% 80% 90% 100%
45+
35-44
18-34
Hospitality Non-supermarket retail Administrative LeisurePersonal services Public admin & education Construction Finance & prof. servicesOther Manufacturing IT & comms. Health & careWarehousing & dist.
46The Living Standards Audit | 2021
Resolution Foundation

of being out of work may indeed be weaker, but there is potential for skills loss.
Thankfully, most people who have experienced furlough over the course of the crisis, only did so for a relatively short amount of time. Figure 27 shows that 24 per cent of 18-64-year-olds respondents experienced a spell furlough or unemployment at any point between March 2020 and May 2021 that lasted a month or more. Just over one-in-ten (11 per cent) were in this state for six months or more and finally, four per cent have been furloughed or unemployed for 12 months or more.
FIGURE 27: One-in-ten 18-64-year-old respondents have experienced six or more months of furloughProportion of the 18-to-64-year-old respondents that have experienced unemployment or furloughing, by the number of months between February 2020 and May 2021 thatthey were in those states: UK, data collected 3-8 June 2021
NOTES: The base is all respondents age 18-64 (n=6,005). The views expressed here are not necessarily those of YouGov. The RF/YouGov survey was conducted 3rd-8th June; respondents were asked to provide employment information for the survey reference week of 24th-30th May.SOURCE: RF analysis of YouGov, adults age 18+ and the Coronavirus (COVID-19), June 2021 wave.
But as the economy reopened and many have moved back to work, the composition of people on furlough has shifted: a significant proportion of respondents that were on full furlough or unemployed in May 2021 had been so for the long-term. Figure 28 shows that 55 per cent of 18-64-year-old respondents who were either unemployed or fully furloughed in May had been in that state for 7 or more months (or 62 per cent of those on full furlough).
24%
11%
4%
19%
9%
3%
16%
6%
11%
5%
2%0%
5%
10%
15%
20%
25%
30%
1+ months 6+ months 12+ months
Full furlough or unemploymentFurlough (full or partial)Full furloughUnemployment
47The Living Standards Audit | 2021
Resolution Foundation

FIGURE 28: More than 62 per cent of respondent workers on full furlough in May had been in that state for seven months or moreDuration of time spent in May 2021 labour market state, by labour market state: UK, data collected 3-8 June 2021
NOTES: Base for each bar is all respondents who were in that position in May 2021: unemployed (n = 289), unemployed or fully furloughed (n = 537), fully furloughed (n = 91), furloughed full or partial (n = 216). The RF/YouGov survey was conducted 3rd-8th June; respondents were asked to provide employment information for the survey reference week of 24th-30th May. The views expressed here are not necessarily those of YouGov.SOURCE: RF analysis of YouGov, adults age 18+ and the Coronavirus (COVID-19), June 2021 wave.
Policy makers will want to ensure that contingencies are in place to help the long-term unemployed return to work, and also provide similar levels of employment support for those who might roll of long-term furlough and into unemployment. For example, previous Resolution Foundation research has argued that, in the event they lose their job, long-term furloughed workers should be directed to the Government’s flagship employment support scheme for the long-term unemployed, Restart.36 This evidence, illustrating that the majority of respondent workers on furlough have indeed been so for at least half a year, adds emphasis to that call.
It’s difficult to predict whether those long-term furloughed workers will return to employment as the JRS begins to wind down from July, and shuts in autumn. It’s also difficult to predict whether younger versus older workers coming off furlough will flow back into employment, or flow into worklessness at substantially different rates. However, evidence from past recessions has shown that older workers tend to return to work from a workless period at a much slower rate than their younger counterparts. Previous Resolution Foundation research found that between 1998 to 2020, 62 per cent
36 N Cominetti et al., Long Covid in the Labour Market, Resolution Foundation, February 2021.
18%
0%
4%
15%
13%
6%
9%
12%
17%
24%
25%
19%
9%
11%
10%
10%
43%
59%
52%
45%
0% 10% 20% 30% 40% 50% 60% 70% 80% 90% 100%
Unemployed
Furlough
Full furlough
Unemployedor
full furlough
1 month 2-3 months 4-6 months 7-9 months 10+ months
48The Living Standards Audit | 2021
Resolution Foundation

of workers aged 50 and above have returned to work within 6 months after becoming unemployed, compared to 74 per cent among those aged 16 to 29, and 72 per cent among those aged 30 to 49.37 For that reason, we should be concerned that the oldest group of furloughed or unemployed working-age respondents in our survey (55-64-year-olds) are at particularly high risk of being so for a long time: 69 per cent of those furloughed or unemployed in May had been so for at least six months. This is equivalent to 270,000 55-64-year-olds who have been fully furloughed or unemployed for six months or more, and 619,000 45-64-year-olds as a whole.
FIGURE 29: Nearly seven-in-ten fully furloughed or unemployed respondents aged 55-64 have been in that state for six months or moreProportion of respondents fully furloughed or unemployed in May that have been in that state for at least six consecutive months: UK, data collected 3-8 June 2021
NOTES: Base for each bar is respondents who were unemployed or fully furloughed in May 2021 by age group. The RF/YouGov survey was conducted 3rd-8th June; respondents were asked to provide employment information for the survey reference week of 24th-30th May. 18-24 = 93; 25-34 = 75; 35-44 = 60; 45-54 = 81; 55-64 = 65. The views expressed here are not necessarily those of YouGov.SOURCE: RF analysis of YouGov, adults age 18+ and the Coronavirus (COVID-19), June 2021 wave.
Since the onset of Covid-19, a larger share of workers have moved to a new sector than we’d normally expect in a year; although they’ve had varying experiences, most don’t want to move back
In a normal year, we would expect roughly 6 per cent of working adults to change the sector that they work in.38 Our survey suggests that sector changes among respondents was double that between February 2020 and April 2021, which we might expect given
37 N Cominetti, A U-shaped crisis: the impact of the Covid-19 crisis on older workers, Resolution Foundation, April 2021.38 See, for example: K Henehan, Can training help workers change their stripes? Retraining and career change in the UK, Resolution
Foundation, August 2020.
69%
65%
64%
64%
38%
57%
0% 10% 20% 30% 40% 50% 60% 70%
55-64
45-54
35-44
25-34
18-24
All 16-64
49The Living Standards Audit | 2021
Resolution Foundation

the sectorally-unequal impact the pandemic has had upon the economy: 12 per cent of respondents indicated that they worked in a different sector in May 2021 than where they were in February 2020. Sector changes were, unsurprisingly, higher among those who experienced a spell of furlough or unemployment over the time period (21 per cent) than among those who had not (8 per cent).
Relatedly, sector moves were higher among those 18-64-year-old respondents at the bottom of the pre-pandemic pay quintile (17 per cent) than at the top (9 per cent). And as Figure 30 shows, sector changes were (again, unsurprisingly) highest among those in hard-hit industries, including hospitality, personal services (including hairdressers, beauticians and repair workers) and leisure, and at their highest among administrative services, a broad category that includes office support, office cleaners, tour operators among others.
FIGURE 30: More than one-in-four respondents working in administrative services before the pandemic was working in a new sector by May 2021Proportion of 18-64-year-old respondents who were working in February 2020 that have changed sector between February 2020 and May 2021, by pre-pandemic sector: UK, data collected 3-8 June 2021
NOTES: The base is all respondents age 18-64 who were in work in February 2020 and May 2021 (including if furloughed). Sample size is as follows: Other = 337; manufacturing = 191; construction = 134’; non-supermarket retail = 218; warehousing and distribution = 77; hospitality = 157; IT and communications = 289; finance and professional = 557; administrative services = 331; public administration and education = 902; health, care and social work = 498; leisure = 143 and personal services = 209. The RF/YouGov survey was conducted 3rd-8th June; respondents were asked to provide employment information for the survey reference week of 24th-30th May. The views expressed here are not necessarily those of YouGov.SOURCE: RF analysis of YouGov, adults age 18+ and the Coronavirus (COVID-19), June 2021 wave.
5%5%
8%8%
11%11%12%
12%13%13%
14%19%19%
26%
0% 5% 10% 15% 20% 25% 30%
Health, care & social workManufacturing
ConstructionPublic admin & education
Finance & professionalIT & commsAll workers
Warehousing & distOther
Non-supermarket retailArts, ent & rec
Personal servicesHospitality
Administrative
50The Living Standards Audit | 2021
Resolution Foundation
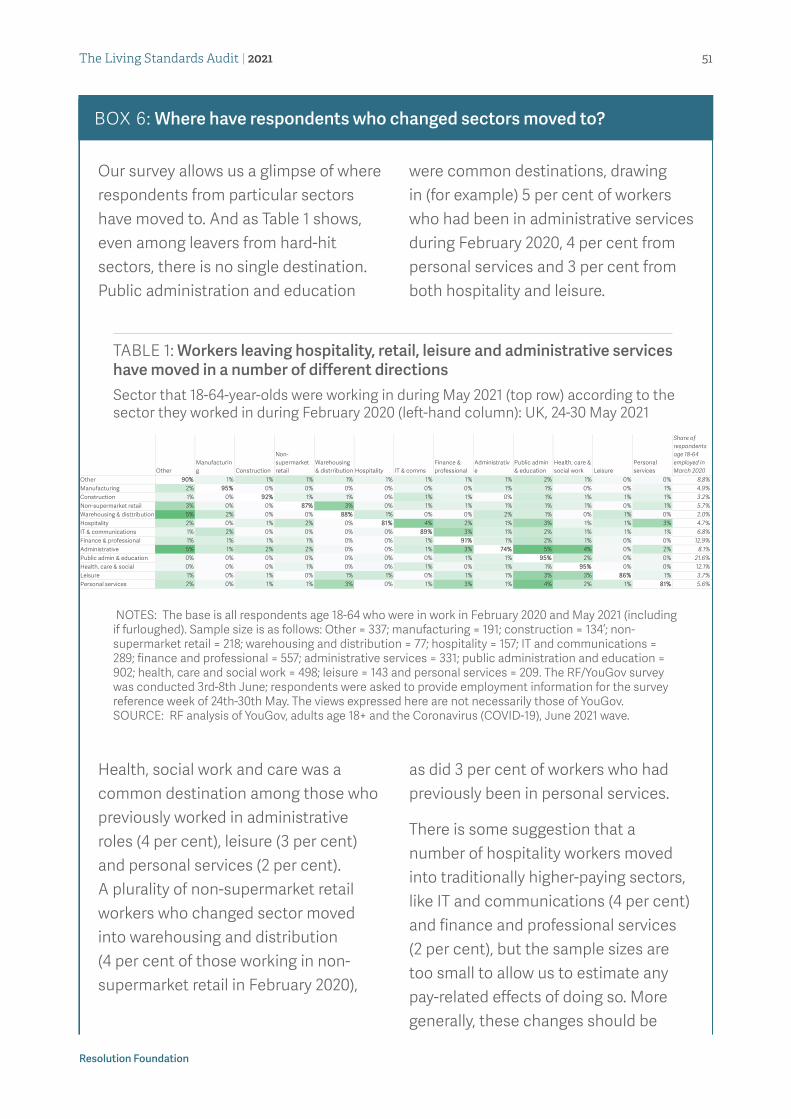
BOX 6: Where have respondents who changed sectors moved to?
Our survey allows us a glimpse of where respondents from particular sectors have moved to. And as Table 1 shows, even among leavers from hard-hit sectors, there is no single destination. Public administration and education
were common destinations, drawing in (for example) 5 per cent of workers who had been in administrative services during February 2020, 4 per cent from personal services and 3 per cent from both hospitality and leisure.
TABLE 1: Workers leaving hospitality, retail, leisure and administrative services have moved in a number of different directionsSector that 18-64-year-olds were working in during May 2021 (top row) according to the sector they worked in during February 2020 (left-hand column): UK, 24-30 May 2021
NOTES: The base is all respondents age 18-64 who were in work in February 2020 and May 2021 (including if furloughed). Sample size is as follows: Other = 337; manufacturing = 191; construction = 134’; non-supermarket retail = 218; warehousing and distribution = 77; hospitality = 157; IT and communications = 289; finance and professional = 557; administrative services = 331; public administration and education = 902; health, care and social work = 498; leisure = 143 and personal services = 209. The RF/YouGov survey was conducted 3rd-8th June; respondents were asked to provide employment information for the survey reference week of 24th-30th May. The views expressed here are not necessarily those of YouGov.SOURCE: RF analysis of YouGov, adults age 18+ and the Coronavirus (COVID-19), June 2021 wave.
Health, social work and care was a common destination among those who previously worked in administrative roles (4 per cent), leisure (3 per cent) and personal services (2 per cent). A plurality of non-supermarket retail workers who changed sector moved into warehousing and distribution (4 per cent of those working in non-supermarket retail in February 2020),
as did 3 per cent of workers who had previously been in personal services.
There is some suggestion that a number of hospitality workers moved into traditionally higher-paying sectors, like IT and communications (4 per cent) and finance and professional services (2 per cent), but the sample sizes are too small to allow us to estimate any pay-related effects of doing so. More generally, these changes should be
OtherManufacturing Construction
Non-supermarket retail
Warehousing & distrribution Hospitality IT & comms
Finance & professional
Administrative
Public admin & education
Health, care & social work Leisure
Personal services
Share of respondents age 18-64 employed in March 2020
Other 90% 1% 1% 1% 1% 1% 1% 1% 1% 2% 1% 0% 0% 8.8%Manufacturing 2% 95% 0% 0% 0% 0% 0% 0% 1% 1% 0% 0% 1% 4.9%Construction 1% 0% 92% 1% 1% 0% 1% 1% 0% 1% 1% 1% 1% 3.2%Non-supermarket retail 3% 0% 0% 87% 3% 0% 1% 1% 1% 1% 1% 0% 1% 5.7%Warehousing & disttribution 5% 2% 0% 0% 88% 1% 0% 0% 2% 1% 0% 1% 0% 2.0%Hospitality 2% 0% 1% 2% 0% 81% 4% 2% 1% 3% 1% 1% 3% 4.7%IT & communications 1% 2% 0% 0% 0% 0% 89% 3% 1% 2% 1% 1% 1% 6.8%Finance & professional 1% 1% 1% 1% 0% 0% 1% 91% 1% 2% 1% 0% 0% 12.9%Administrative 5% 1% 2% 2% 0% 0% 1% 3% 74% 5% 4% 0% 2% 8.1%Public admin & education 0% 0% 0% 0% 0% 0% 0% 1% 1% 95% 2% 0% 0% 21.6%Health, care & social 0% 0% 0% 1% 0% 0% 1% 0% 1% 1% 95% 0% 0% 12.1%Leisure 1% 0% 1% 0% 1% 1% 0% 1% 1% 3% 3% 86% 1% 3.7%Personal services 2% 0% 1% 1% 3% 0% 1% 3% 1% 4% 2% 1% 81% 5.6%
51The Living Standards Audit | 2021
Resolution Foundation

interpreted with some caution given the small overall amounts of change shown, and the fact that respondents leaving smaller sectors (for example, warehousing and distribution, where
39 The question asked: “Considering the sectors in the previous question, do you think you are likely to change the sector you work in over the next 6 months (i.e. between now and the beginning of December 2021)?” Answer options were: “Yes - I want to work in a different sector that I’ve not worked in before”; “Yes - I want to return to the job/sector I was working in before the pandemic”; “No - but I would consider working in a new sector I haven’t worked in before”; “No - but I would consider returning to my previous sector”; “No - I want to continue to work in my current sector”; “I don’t mind what sector I work in”; “Don’t know.”
just 2 per cent of respondents worked in February 2020) will amount to small number of people moving sector overall.
For some workers, changing sectors will bring living standards improvements, be they related to pay, job satisfaction or work-life balance. For others, a sector change may have been out of necessity after losing a job. Our survey asked respondents whether they are likely to stay to in their new industry over the next six months, as a proxy for whether their recent switch is likely to represent a permanent improvement in living standards or quality of life. Figure 31 shows that respondents who have moved from harder-hit sectors like hospitality, non-supermarket retail and leisure are no less likely than leavers from other sectors to want to return: just 10 per cent of leavers from this group reported this, compared with 11 per cent of leavers from all other sectors. 39 However, they do differ in that respondents who moved out of hospitality, leisure and non-supermarket retail appear less satisfied in their new sector than ‘other’ changers are. Nearly one-in-five (20 per cent) want to move again, compared to just 15 per cent of changers from other sectors, which could suggest that many sector changes were stop-gap moves made out of economic necessity, rather than as part of a longer-term career aim.
Many of the findings discussed in this section are a cause for optimism: headline labour market conditions are improving, furlough is winding down at a rapid rate, and – crucially – furloughed workers are for the most part flowing back into employment. This is especially important for younger workers, who have experienced labour market shocks at the highest rate. But the recovery both has a way to go, and isn’t without risk: our findings suggest that the remaining pool of furloughed workers are likely to have been in this state for the long-term, a pattern especially prominent among older workers.
52The Living Standards Audit | 2021
Resolution Foundation

FIGURE 31: Respondents who moved from hard-hit industries like hospitality are no less likely than others to want to return to it; but they are more likely to be dissatisfied with their new sectorIntentions to switch sector among 18-64-year-old respondents who have changed sector since February 2020, by pre-crisis sector: UK, 24-30 May 2021
NOTES: Base is all adults age 18 to 64 changed sectors between March 2020 and May 2021 and answered whether they would like to stay or change sector in future, according to whether they worked in worked in hospitality, leisure and non-supermarket retail (n=77) or all other sectors (n = 399). All figures have been analysed independently by the Resolution Foundation. The RF/YouGov survey was conducted 3rd-8th June; respondents were asked to provide employment information for the survey reference week of 24th-30th May. The views expressed here are not necessarily those of YouGov.SOURCE: RF analysis of YouGov, Adults Age 18+ and the Coronavirus (COVID-19), June 2021 wave.
Indeed, it appears that, as the economy re-opens, economic risk is shifting up the age distribution. An uneven labour market recovery could translate into an uneven incomes recovery, for those whose employment has been interrupted. Policy makers should pay close attention to these trends as the reopening continues, with a view towards supporting the smaller pool of workers that are left on furlough and more likely to flow into unemployment once the JRS draws to a close this autumn. We discuss this in the next section.
11%
10%
15%
20%
48%
46%
26%
23%
0% 20% 40% 60% 80% 100%
Changed from allother sectors
Changed fromhospitality, leisure
or non-supermarketretail
Wants to return to old sector Wants to change (again) to new sector Wants to stay Maybe/Don't know
53The Living Standards Audit | 2021
Resolution Foundation

Section 4
The nature of household finances during the crisis
Our updated nowcast suggests that typical incomes were almost flat in 2020-21 – remarkable given GDP fell by around 10.8 per cent in 2020-21, and in no small part due to the government support that effectively doubled the size of the welfare state in 2020-21.
New data from our online survey shows that households are starting to see the economic gains from reopening: just over 25 per cent of respondent families reported an increase in income between February and May 2021, more than the 13 per cent who reported a fall. However, the way that the pandemic has affected opportunities to spend for some as well as pushed up household costs for others means its true distributional impact is only seen if we look at household income and spending together, and the impact on household balance sheets. One-quarter of people are still spending less in May 2021 than before the pandemic, and this is particularly likely among higher-income households. And although balance sheets have improved on average through the crisis – that is, savings rose and debts fell – it was not true for everyone, and lower-income households were more likely to have seen debts rise during the pandemic, and higher-income households more likely to have accumulated savings.
Earlier this year, the Resolution Foundation produced a nowcast showing how the crisis had affected household incomes in 2020-21, and a forecast for how it would change in future years.40 As official data on household incomes for 2020-21 will not be available until Spring 2022, that work drew on various glimpses provided by rapid online surveys into how incomes were changing across the crisis period. In this section, we provide an update to that income nowcast for 2020-21, and then present new results from our online survey fielded at the beginning of June 2021 to provide the most up-to-date assessment of the impact of Covid-19 on household incomes and balance sheets. In a companion
40 See: M Brewer et al., The Living Standards Outlook 2021, January 2021, Resolution Foundation.
54The Living Standards Audit | 2021
Resolution Foundation

report, to be released later in July 2021, Resolution Foundation researchers will also assess how the crisis has impacted household wealth.
Unprecedented government support in 2020-21 was able to, at the aggregate level, protect incomes across the distribution
Figure 32 shows annual household income growth after housing costs from 1962, up until 2019-20, and our nowcast of income growth in 2020-21.41 The combination of the JRS, SEISS and the £20 uplift to Universal Credit – which together effectively doubled the size of the welfare state to 9 per cent of GDP last year42 – meant that household incomes have (largely) been protected: our modelling shows that median income growth in 2020-21 will be 1.5 per cent, despite GDP falling by 10.8 per cent. This is slightly higher than estimates from the OBR that household income fell by 0.3 per cent in 2020-21,43 although our nowcast reflects the stronger-than-expected labour market towards the end of 2020-21.44
FIGURE 32: Despite the shutdown of the economy, median incomes increased by 1.5 per centAnnual real growth in median non-pensioner equivalised disposable household income, after housing costs: UK
NOTES: Non-pensioner incomes are those recorded/nowcast for benefit units containing no one over State Pension age.SOURCE: RF analysis of DWP and IFS, Households Below Average Income; RF nowcast.
41 We employ a similar method to previous nowcasts. We use the IPPR tax benefit model to model incomes in 2020-21, using the 2019-20 HBAI data, updated with employment, earnings, inflation, benefit rates, and other data. In particular, we model furlough in line with a weighted average of results from the Covid-19 waves of Understanding Society.
42 M Brewer, K Handscomb & K Shah, In need of support? Lessons from the Covid-19 crisis for our social security system, Resolution Foundation, April 2021.
43 See: Office for Budget Responsibility, Economic and Fiscal Outlook, March 2021; T Bell & M Brewer, The 12-month stretch: Where the Government has delivered – and where it has failed – during the Covid-19 crisis, Resolution Foundation, March 2021.
44 In 2020’s Living Standards Audit, we estimated that, in the first lockdown in 2020, typical incomes fell by 4.2 per cent relative to 2019-20. This is a significantly larger fall than that presented here and reflects that our forecast a year ago was of the level of income at the depth of the first lockdown, whereas here we are presenting an estimate of the average position over the whole of 2020-21.
2020-21: 1.5%
Annual …
-6%
-4%
-2%
0%
+2%
+4%
+6%
+8%
+10%
+12%
1962 1966 1970 1974 1978 1982 1986 1990 1994-95
1998-99
2002-03
2006-07
2010-11
2014-15
2018-19
55The Living Standards Audit | 2021
Resolution Foundation

Figure 33 shows our nowcast of the change in household incomes across the income distribution in 2020-21. This confirms previous estimates that incomes have grown at the bottom of the distribution by more than elsewhere.45 As a result, our nowcast suggests that the Gini coefficient will be 37.9 per cent in 2020-21, down from 39.1 per cent in 2019-20. In addition, our nowcast suggests that relative poverty rates will be 20.5 per cent, down from 22 per cent in 2019-20, although our previous work has highlighted that poverty will rise in future years if the £20 a week boost to UC is not maintained.46
FIGURE 33: The benefit uplift has protected incomes at the very bottom of the distributionEstimated real-terms growth in non-pensioner disposable household income, after housing costs, by income percentile: UK, 2020-21
NOTES: Non-pensioner incomes are those recorded/nowcast for benefit units containing no one over State Pension age.SOURCE: RF analysis of DWP and IFS, Households Below Average Income; RF nowcast.
It is important to note that this nowcast does not show how incomes have changed for people with different levels of pre-crisis income. It shows instead the difference between our estimates of the shape of the income distribution in 2019-20 and 2020-21. It is perfectly possible for a lot of people to see income falls that bring them towards the bottom of the distribution and for the temporary boost to UC and other benefits to mean that incomes are higher at the bottom of the distribution in 2020-21 than in 2019-20. As we discuss in Box 7, it remains the case that, among those in work, the Covid-19 labour market shock has been skewed towards low-income households. But adults who were not in work, who are likely to be at the bottom of the income distribution, will not have been affected by a labour market shock, and will have received a boost to their incomes
45 There is an extensive discussion of this in Box 3 of M Brewer et al., The Living Standards Outlook 2021, Resolution Foundation, January 2021.
46 See Section 5 of M Brewer et al., The Living Standards Outlook 2021, Resolution Foundation, January 2021.
-2%
0%
+2%
+4%
+6%
+8%
+10%
+12%
+14%
0 5 10 15 20 25 30 35 40 45 50 55 60 65 70 75 80 85 90 95Poorer ← Percentile of income distribution → Richer
56The Living Standards Audit | 2021
Resolution Foundation

in the form of the uplift to UC and other benefits. And the shock to household incomes where low-paid workers lost jobs will have been smaller than the shock where high-paid workers lost jobs, thanks to the support provided by the benefit system. Finally, although the crisis has hit low-paid workers hard, not all low-paid workers live in low-income households.
47 See: K Handscomb & L Judge, Caught in a (Covid) trap: Incomes, savings and spending through the coronavirus crisis, Resolution Foundation, November 2020.
BOX 7: Among those in work, low-income households have been much more likely to be have affected by the Covid-19 labour market shock
In Figure 34, we provide an update to earlier Resolution Foundation analysis that assesses where in the income distribution are those who have experienced a negative labour market experienced since the crisis began.47 Overall, 29 per cent of respondents who were in work in March 2020 report
experiencing a negative employment change between March 2020 and June 2021. This figure was nearly 2.5 times as large among respondents in the bottom of the pre-crisis family income quintile (47 per cent) than those at the top (20 per cent).
FIGURE 34: Respondents at the bottom of the family income distribution were nearly 2.5 times as likely as those at the top to have had a negative employment change during the past 15 months Proportion of 18-64-year-old respondents who were working in March 2020 that had experienced negative employment changes by June 2021, by February 2020 family income quintile
NOTES: Base = 3,212: all adults aged 18 to 64 who were working in March 2020 with valid income data (apart from the ‘all’ category where the base is 4,354). Family income distribution based on equivalised, disposable benefit unit incomes among 18-65-year-old adults, excluding families containing retired adults or nonworking adult students. These figures have been analysed independently by the Resolution Foundation.SOURCE: RF analysis of YouGov, UK Adults and The Coronavirus (Covid-19) – June 2021 wave.
2%
2%
2%
6%
5%
3%
5%
5%
8%
17%
10%
17%
15%
23%
26%
4%
5%
2%
3%
3%
10%
0% 10% 20% 30% 40% 50% 60%
All
5 (highest income)
4
3
2
1 (lowest income)
No longer working, unemployment spell No longer working, had furlough spellWorking, now furloughed Working now, had furlough spellWorking, had unemployment spell
57The Living Standards Audit | 2021
Resolution Foundation

Having assessed how household incomes may have fared during the first year of the crisis, we now move on to looking at new data on household incomes during the reopening period.
Households are starting to see the economic gains of the easing of restrictions, but the legacy of the crisis can be seen in its lasting impact on household finances
The economic recovery from Covid-19, though very much incomplete, has brought some income gains to families. Figure 35 shows the welcome news that, across the pre-crisis income distribution, incomes are more likely to have improved rather than deteriorated since the start of 2021, reflecting the improvements in the labour market since the third lockdown. Just over 25 per cent of respondent families reported an increase in income between February and May 2021, more than the 13 per cent who reported a fall. Inevitably, these figures will be marred by some amount of recall error, but the results shown in Figure 35 suggest that a slightly larger share of surveyed families at the top of the income distribution (27 per cent) reported income gains than at the bottom (21 per cent).48
FIGURE 35: More than a quarter of respondent families have experienced an increase in family incomes since FebruaryChange in family income between February and June 2021, by February 2020 family income quintile
NOTES: Base = 5,500: all adults aged 18+ with valid income data for March 2020 (apart from the ‘all’ category where the base is 8,030). February 2020 incomes have not been equivalised. Quintiles were calculated using mid-points of 20 banded responses from £0 to £5,000. These figures have been analysed independently by the Resolution Foundation.SOURCE: RF analysis of YouGov, UK Adults and The Coronavirus (Covid-19) – June 2021 wave.
48 For further discussion, see: M Brewer et al., The Living Standards Outlook 2021, Resolution Foundation, January 2021.
6%
9%
7%
6%
7%
8%
4%
5%
6%
4%
5%
6%
3%
4%
4%
3%
3%
47%
52%
54%
54%
55%
51%
20%
3%
3%
4%
5%
10%
12%
17%
17%
18%
15%
10%
5%
6%
7%
5%
5%
5%
4%
4%
3%
4%
4%
7%
0% 10% 20% 30% 40% 50% 60% 70% 80% 90% 100%
All
Highest income
4
3
2
Lowest income
Decreased significantly (more than 25%) Decreased moderately (10-25%)Decreased a little (0-10%) Stayed about the sameUnknown Increased a little (0-10%)Increased moderately (10-25%) Increased significantly (more than 25%)
58The Living Standards Audit | 2021
Resolution Foundation

The recovery is not yet complete though: as we showed earlier, there were around 2 million workers still on furlough in May, and the number of payrolled employees is still lower than pre-crisis (and especially so for the young). And when we examine spending data in our survey we find a similar picture: things have improved since the start of 2021, but are not fully back to normal. Figure 36 shows that around one-quarter of people are still spending less than before the pandemic – although one-in-five report spending more.49 In particular, higher-income households are the least likely to have returned to (or exceeded) pre-Covid spending. This might seem counter-intuitive – given that higher-income households have been less affected by the labour market consequences of Covid-19 (see Figure 34) – but it is likely explained by the high discretionary spending power that higher-income households have, and the restrictions that still apply to some areas of expenditure (on foreign travel, for example). These findings are also in line with the ONS real-time indicators: in the week to 17 June, credit and debit card spending was at 90 per cent of pre-crisis levels and retail footfall was at 77 per cent compared to 2019 levels.50 Overall however, this increase in spending is encouraging, and is in contrast to findings from our September 2020 survey, where we found that a third of individuals (33 per cent) had reduced their household spending during the first lockdown.51
FIGURE 36: One quarter of people are still spending less than they did before the pandemicProportion of individuals by change in spending compared to February 2020, by current income quintile: UK, 3-8 June 2021
NOTES: Base = 2,680: all adults aged 18+ with valid income data (apart from the ‘all’ category where the base is 8,030). Family income distribution based on equivalised, disposable benefit unit incomes among 18-65-year-old adults, excluding families containing retired adults or nonworking adult students. These figures have been analysed independently by the Resolution Foundation.SOURCE: RF analysis of YouGov, UK Adults and The Coronavirus (Covid-19) – June 2021 wave.
49 For details on how we calculate current income quintiles, see Annex 1 in: K Handscomb & L Judge, Caught in a (Covid) trap: Incomes, savings and spending through the coronavirus crisis, Resolution Foundation, November 2020.
50 See: Office for National Statistics, Economic activity and social change in the UK, real-time indicators, 24 June 2021.51 See: K Handscomb & L Judge, Caught in a (Covid) trap: Incomes, savings and spending through the coronavirus crisis, Resolution
Foundation, November 2020.
8%
8%
7%
8%
8%
11%
9%
18%
10%
6%
9%
8%
8%
12%
12%
10%
11%
11%
43%
36%
50%
50%
43%
37%
13%
3%
5%
6%
6%
13%
8%
12%
6%
9%
9%
8%
7%
8%
7%
6%
9%
5%
5%
3%
3%
5%
5%
8%
0% 10% 20% 30% 40% 50% 60% 70% 80% 90% 100%
All
Highest income
4
3
2
Lowest income
Decreased significantly (more than 25%) Decreased moderately (10-25%)Decreased a little (0-10%) Stayed about the sameUnknown Increased a little (0-10%)Increased moderately (10-25%) Increased significantly (more than 25%)
59The Living Standards Audit | 2021
Resolution Foundation

The cumulative effect of the crisis on households is not reflected in incomes, but in savings and debts
We have shown in previous work that the particular nature of this crisis52 – with the way it affected opportunities to spend as well as household costs – means that the true distributional impact is only seen if we look at both household income and spending together, and the impact on household balance sheets. We asked people in our survey how their personal balance sheets had changed between February 2020 to June 2021.53
Figure 37 shows that around a quarter (23 per cent) of individuals have seen their savings increase during the crisis, with 8 per cent saying their savings had increased by over 25 per cent. For those who have been able to continue working throughout the pandemic this is most likely a result of reduced consumption possibilities.54 Increased savings put people in a better financial position for the future, and can act to increase living standards – either directly through higher consumption, or indirectly through higher investment income or higher consumption of housing.55 There is also the question of what will people do – if anything – with their accumulated pandemic savings, something we explore in Box 8.
On the other hand, our survey also finds that 16 per cent of individuals saw their savings fall during the pandemic – and looking at savings changes across the distribution we find an alarming distributional slant. Individuals with the lowest incomes were much more likely to have seen savings fall (32 per cent) than rise (12 per cent). The situation is completely reversed for higher-income individuals in our survey – only 10 per cent saw a savings fall, whereas four times as many people (46 per cent) saw their savings rise.
52 See: K Handscomb & L Judge, Caught in a (Covid) trap: Incomes, savings and spending through the coronavirus crisis, Resolution Foundation, November 2020.
53 We asked respondents to exclude student loans, mortgages, and any credit card balances they expected to pay off in full within a month.
54 The ONS estimate of households’ savings ratio increased to 25.9 per cent in the second quarter of 2020 from 8.9 per cent in the previous quarter (ONS series DGD8). See also: M Brewer & R Patrick, Pandemic Pressures: Why families on a low income are spending more during Covid-19, Resolution Foundation, January 2021.
55 For example, see: G Bangham & J Leslie, Rainy days: An audit of household wealth and the initial effects of the coronavirus crisis on saving and spending in Great Britain, Resolution Foundation, June 2020.
60The Living Standards Audit | 2021
Resolution Foundation

FIGURE 37: High-income individuals are four times more likely to have seen their family savings increase during the crisisProportion of individuals by changes in stock of savings over the course of crisis, by current income quintile: UK, 3-8 June 2021
NOTES: Base = 2,680: all adults aged 18+ with valid income data (apart from the ‘all’ category where the base is 8,030). Family income distribution based on equivalised, disposable benefit unit incomes among 18-65-year-old adults, excluding families containing retired adults or nonworking adult students. These figures have been analysed independently by the Resolution Foundation.SOURCE: RF analysis of YouGov, UK Adults and The Coronavirus (Covid-19) – June 2021 wave.
BOX 8: Excess savers are unlikely to create a spending boom in the near future
Evidence from our survey suggests that those who have saved over the course of the pandemic are not planning a spending splurge. Figure 38 shows that only 17 per cent of individuals who have seen their savings increase during the
pandemic are planning on using them for increased spending. And, of those individuals, most are planning to spend on a ‘big-ticket’ item that is unlikely to support extra jobs in the service sector.
8%
4%
6%
16%
18%
4%
4%
4%
5%
5%
4%
5%
3%
5%
3%
9%
39%
40%
43%
45%
41%
35%
22%
4%
7%
9%
13%
23%
8%
16%
14%
11%
9%
3%
7%
14%
11%
8%
5%
4%
8%
17%
14%
12%
8%
5%
0% 10% 20% 30% 40% 50% 60% 70% 80% 90% 100%
All
Highest income
4
3
2
Lowest income
Decreased significantly (more than 25%) Decreased moderately (10-25%)Decreased a little (0-10%) Stayed about the sameUnknown Increased a little (0-10%)Increased moderately (10-25%) Increased significantly (more than 25%)
61The Living Standards Audit | 2021
Resolution Foundation

83%
63%
67%
74%
82%
92%
3%
5%
5%
4%
15%
32%
28%
22%
16%
7%
0% 10% 20% 30% 40% 50% 60% 70% 80% 90% 100%
All
Highest income
4
3
2
Lowest income
No plans to spend additional savingsPlan to spend as much or more on going out, but nothing elsePlan to use additional savings for a new home, holiday, or other major purchase
FIGURE 38: Individuals are five times more likely to spend extra savings on a major purchase than just on going outSpending intentions among those who have accumulated additional savings during the crisis, by income quintile: UK, 3-8 June 2021
NOTES: Base = 2,680: all adults aged 18+ with valid income data (apart from the ‘all’ category where the base is 8,030). Family income distribution based on equivalised, disposable benefit unit incomes among 18-65-year-old adults, excluding families containing retired adults or nonworking adult students. These figures have been analysed independently by the Resolution Foundation.SOURCE: RF analysis of YouGov, UK Adults and The Coronavirus (Covid-19) – June 2021 wave.
Of course, once savings have been depleted, households often have to rely on debt to get by. So, as we would expect, there is a similar distributional pattern to changes in debt over the course of the crisis (see Figure 39). 13 per cent of individuals saw their family debts increase during the pandemic, with 4 percent seeing existing debt levels increase by more than 25 per cent. Similar to the labour market impact of the crisis, those in the second-lowest income quintile have seen debt increase the most – with one-in-five (21 per cent) saying their debts increased.56
Our findings here on balance sheets – which show low-income individuals more negatively affected over the course of the crisis – echo the results from our findings on the labour market and spending changes. Lower-income families (in work) were most likely to experience a labour market shock, but spending changes have been relatively consistent across the distribution, suggesting that at least some families were unable to adjust spending down to account for lower income.
56 This is consistent with Figure 34: those households at the bottom of the income distribution are less likely to be in work than those in the second-lowest quintile and so are less likely to have seen income fall due to the labour market shock.
62The Living Standards Audit | 2021
Resolution Foundation

FIGURE 39: Low-income families are more likely to have seen significant increases to their debt levels over the crisisProportion of individuals with increases in debt since February 2020, by income quintile: UK, 3-8 June 2021
NOTES: Base = 2,680: all adults aged 18+ with valid income data (apart from the ‘all’ category where the base is 8,030). Family income distribution based on equivalised, disposable benefit unit incomes among 18-65-year-old adults, excluding families containing retired adults or nonworking adult students. These figures have been analysed independently by the Resolution Foundation. For debts, we asked respondents to include hire purchases, personal loans, credit or store cards, mail order purchases, DWP social fund loans, overdrafts, payday loans or hire purchases excluding car finance, and exclude any balances due to be repaid in full within a month, student loans and mortgages.SOURCE: RF analysis of YouGov, UK Adults and The Coronavirus (Covid-19) – June 2021 wave.
It is also worth noting that – in line with savings changes – overall debt levels are down. Total consumer credit (excluding student loans) outstanding was £195 billion at the end of April 2021, down 14 per cent from £225 billion in February 2020.57 (14 per cent of individuals in our survey saw debt levels fall during the pandemic, while 57 per cent of respondents’ debt levels stayed the same.)
Lower earnings and higher costs have increased household debt during the pandemic
To examine these debt changes in more detail, we turn to results from questions in our survey which asked respondents who had accumulated more debt during the crisis how important different factors were in creating this extra financial pressure.
57 Bank of England data (series identifier: LPMBI20).
2%
2%
4%
3%
2%
2%
3%
6%
3%
4%
3%
3%
4%
3%
5%
6%
13%
6%
3%
2%
2%
4%
3%
4%
0% 5% 10% 15% 20% 25%
All
Highest income
4
3
2
Lowest income
Increased a little (0-10%) Increased moderately (10-25%) Increased significantly (more than 25%) Newly indebted
63The Living Standards Audit | 2021
Resolution Foundation

Figure 40 shows that, among individuals who reported an increase in debt, over 40 per cent stated that increased spending pressures were at least partly responsible.58 This varied across the income distribution, with individuals in the lowest-income households three times more likely to say it was a very important reason for their increased debt compared to individuals living in the highest-income households (27 per cent vs 6 per cent). This matches our earlier work which showed some examples of the increased costs caused by the pandemic (and especially the periods of lockdown) for some families. In particular, household spending increased for low-income households with children: 36 per cent of families with children on the lowest incomes increased their spending in Summer 2020, whereas 13 per cent of families with children on the highest incomes increased their spending in Summer 2020.59
FIGURE 40: Additional pandemic costs have led to increased debt, especially for lower income familiesProportion of individuals by importance of additional pandemic costs in causing an increase in debt since February 2020, by income quintile: UK, 3-8 June 2021
NOTES: Base = 955: all adults aged 18+ with valid income data where debt increased during the crisis (apart from the ‘all’ category where the base is 2,119). Family income distribution based on equivalised, disposable benefit unit incomes among 18-65-year-old adults, excluding families containing retired adults or nonworking adult students. These figures have been analysed independently by the Resolution Foundation.SOURCE: RF analysis of YouGov, UK Adults and The Coronavirus (Covid-19) – June 2021 wave.
58 We asked respondents to include hire purchases, personal loans, credit or store cards, mail order purchases, DWP social fund loans, overdrafts, payday loans or hire purchases excluding car finance, and exclude any balances due to be repaid in full within a month, excluding student loans and mortgages.
59 M Brewer & R Patrick, Pandemic Pressures: Why families on a low income are spending more during Covid-19, Resolution Foundation, January 2021.
13%
6%
6%
10%
10%
27%
11%
8%
6%
10%
10%
16%
14%
10%
10%
16%
25%
21%
9%
10%
13%
11%
8%
7%
44%
61%
51%
48%
39%
22%
9%
5%
14%
7%
7%
8%
0% 10% 20% 30% 40% 50% 60% 70% 80% 90% 100%
All
Highest income
4
3
2
Lowest income
5 – Very important 4 3 2 1 – Not at all important/ Not applicable Unknown
64The Living Standards Audit | 2021
Resolution Foundation

Another likely cause of higher debt is reduced incomes, and Figure 41 shows that almost half of individuals who saw increasing debt during the pandemic cited lower earnings (or lower partner earnings) as a reason. Across the income distribution, lower earnings were a more important factor for lower-income families with twice as many in the bottom quintile (29 per cent) saying lower earnings were a very important factor as those in the top quintile who had increased debt during the pandemic (14 per cent).
Overall, with both greater spending pressures and greater income pressures over the past 16 months, lower-income families are more likely to have seen unwelcome increases in their debt levels due to necessity.
FIGURE 41: Individuals in lower-income families are twice as likely as those in higher-income families to say loss of earnings in the family was a very important factor causing an increase in debt during the crisisProportion of individuals by importance of falling earnings in causing an increase in debt during the pandemic, by income quintile: UK, 3-8 June 2021
NOTES: Base = 955: all adults aged 18+ with valid income data where debt increased during the crisis (apart from the ‘all’ category where the base is 2,119). Family income distribution based on equivalised, disposable benefit unit incomes among 18-65-year-old adults, excluding families containing retired adults or nonworking adult students. Importance based on the highest importance figure when answering separate questions about own or partner’s falling income. These figures have been analysed independently by the Resolution Foundation.SOURCE: RF analysis of YouGov, UK Adults and The Coronavirus (Covid-19) – June 2021 wave.
Large changes to balance sheets mean changes in future living standards – either as savings are used for purchases, or as debt requiring income to pay back that could have been spent elsewhere. In either case, these balance sheet effects will be a lasting legacy of the Covid-19 crisis, and should feature more prominently in policy discussions
21%
14%
19%
23%
21%
29%
11%
10%
7%
12%
9%
11%
11%
9%
11%
10%
24%
10%
5%
5%
3%
6%
6%
4%
37%
55%
46%
34%
29%
23%
15%
7%
14%
15%
11%
23%
0% 10% 20% 30% 40% 50% 60% 70% 80% 90% 100%
All
Highest income
4
3
2
Lowest income
5 – Very important 4 3 2 1 – Not at all important/ Not applicable Unknown
65The Living Standards Audit | 2021
Resolution Foundation

on poverty and inequality, since the issues are clearly linked. We will examine the effect of the crisis on the distribution of assets in more detail in our upcoming Wealth Audit. For now, we turn to more immediate policy considerations: how to continue to support incomes through the recovery.
66The Living Standards Audit | 2021
Resolution Foundation

Section 5
Government support will remain crucial to the recovery in incomes
Although the end of the Covid-19 crisis appears to be in sight, with restrictions due to be lifted later in July 2021 as the vaccine roll out continues, threats to living standards lie in wait later this year as support mechanisms are removed. Indeed, the some have even called for the support schemes to be withdrawn sooner than planned. However, the risks of doing so are too great, not least as the labour market is running far from hot at the moment. Similarly, the planned reduction in Universal Credit by £20 per week in October could also undermine recovery efforts exactly when unemployment looks set to rise. A decision also needs to be taken on how to uprate the State Pension, where the Government should follow a modified triple lock that averages out earnings growth over the past two years, avoiding an unnecessary increase in spending on the State Pension caused just by extreme volatility in measures of average earnings in the crisis.
So far, this report has looked at living standards before the crisis and provided an updated analysis of incomes through the crisis – focusing especially on how the economic aspects of the pandemic have played out in the labour market. This final Section looks at what can we say about the ongoing recovery. Taking findings from our analysis of the economy today, we consider what lies ahead – and what economic policy would best support a recovery.
Withdrawing the furlough scheme too soon would be taking an unnecessary risk
The JRS has been one of the great economic policy successes of the Covid-19 crisis. Dreamed up in a matter of weeks, and initially intended only to last for a few months, it has protected household incomes for over a year from what would have been very serious falls, and it has allowed employers to stay in business and maintain links with
67The Living Standards Audit | 2021
Resolution Foundation

their employees.60
As we showed in Section 3, as the economy has opened up, so the numbers on furlough have fallen fast. Almost all of those who have left furlough this year are now in work – and a majority of those who remain on furlough are doing some work (through partial furlough). This is what we would expect and want to see from a successful furlough scheme as the labour market strengthens.
But the furlough scheme cannot last forever. From the date this report is published, the phase out of the scheme is beginning, with employers required to pay a share of gross wages to their furloughed workers.61 The Government’s plans are for the employer contribution to rise further over the summer and for the scheme to stop entirely at the end of September 2021.
Our view is that if the reopening of the economy proceeds as planned, then it would seem appropriate to end the furlough scheme at the end of September. There may be some exceptions, however. At the time of writing, the sector that seems at the most risk of ongoing restrictions in the autumn is aviation and international travel as well as some parts of the entertainment industry. Should autumn still see substantial restrictions, then there could be a case for continued support, but it would be much more proportionate to do so through targeted schemes rather than economy-wide.
Some have even suggested that the scheme should be closed early. This would be an over-reaction to anecdotal evidence of labour market tightness that is not borne out by the facts. Total hours worked are still 5 per cent down on pre-crisis levels. Although average earnings appear to be growing at the fastest rate for twenty years, it is actually a result of composition and base effects: two-year pay growth is no higher than pre-crisis, and perceived labour shortages are most likely the result of job-matching frictions as parts of the economy reopen rapidly.62
However, whenever it closes there will, inevitably, be some risks. We showed in Section 3 that just over 55 per cent of workers still on furlough in May will not have worked in over six months, which is particularly problematic among older workers, who history suggests take longer to find new work after redundancy.63 In such situations, the best government response is to provide work search support and coaching through Jobcentre Plus offices and other specialised provision. The numbers of new UC and Jobseeker’s
60 Previous work found that the median income replacement rate under the conventional social security system was 53 per cent, compared to over 90 per cent under the JRS, see: M Brewer & K Handscomb, This time is different – Universal Credit’s first recession: Assessing the welfare system and its effect on living standards during the coronavirus epidemic, May 2020, Resolution Foundation.
61 Employers will continue to pay employer national insurance contributions and pension contributions, as they have been doing for most of the crisis.
62 See: T Bell et al., Understanding the labour market: pandemic not pandemonium - The labour market is normalising, not overheating, June 2021, Resolution Foundation.
63 N Cominetti, A U-shaped crisis, Resolution Foundation, April 2021.
68The Living Standards Audit | 2021
Resolution Foundation

Allowance claims have remained very low since the initial crisis surge in May 2020, but the Department for Work and Pensions should now be prepared for a new wave of claims in the months ahead. Although smaller, this will be a cohort that has effectively been out of the labour market for many months, they will need intensive tailored support to find work, and it should be delivered as soon as possible.
Alongside the end of furlough, planned cuts to Universal Credit of £6 billion per year poses another threat to the recovery this autumn
At the start of the crisis, alongside the furlough scheme, the Government increased the standard allowance on UC by £20 a week. It provided much needed extra support to low-income families – many of whom, as we identified earlier in the report, have faced additional spending pressures. The Government has continued to insist the increase is a temporary measure for the duration of the pandemic and its main purpose was to provide additional support to families working before the pandemic. However, withdrawing the extra support precisely at a time when unemployment might be increasing will undermine the incomes of those families who lose their jobs at the end of the furlough scheme.
FIGURE 42: The most material question for living standards in the short term is whether the Government continues with the £20 per week boost to UCChange in weekly income of reducing Universal Credit and Working Tax Credit by £20 a week, by vingtile: 2021-22
NOTES: We exclude the bottom 5 per cent, due to concerns about the reliability and volatility of data for this group.SOURCE: RF analysis of DWP, Households Below Average Income; and RF forecast.
-10%
-9%
-8%
-7%
-6%
-5%
-4%
-3%
-2%
-1%
0%
-£20
-£18
-£16
-£14
-£12
-£10
-£8
-£6
-£4
-£2
£0
1st 2nd 3rd 4th 5th 6th 7th 8th 9th 10th 11th 12th 13th 14th 15th 16th 17th 18th 19th 20th
Loss of weekly income if there was no £20 a week boost to UC
Proportional (%) change in average income (right axis)
Absolute change in weekly income Proportional change in income
Poorest ← Net equivalised household income vingtile, after housing costs → Richest
69The Living Standards Audit | 2021
Resolution Foundation

Figure 42 shows our estimates of the effect of removing the £20 per week uplift to UC and ending the equivalent boost to Working Tax Credit. Households in the bottom fifth of the income distribution are set to lose 5.7 per cent of their weekly incomes in October: this amounts to an average of £400 for the remaining six months of 2021-22, or £800 on an annual basis.
Reducing income by 5.7 per cent for the bottom fifth of household incomes has obvious implications for the living standards of those families. But it also has clear economic implications as well. Reducing the income of at least 6 million households (at a cost of at least £6 billion per year) in turn reduces their spending power, which could undermine the economic recovery.64 Moreover, by the end of the parliament, 1-in-4 working age households are forecast to be on Universal Credit.65 As we have set out in previous work, the Government should take the public finances seriously – but saving money that then undermines the economic recovery and leads to lower tax revenue is self-defeating. The Government must prioritise securing the recovery first, and deal with the finances later.66
At the same time as it is deciding whether to continue with the £20 uplift to UC, the Government will also have to come to a view on how to interpret its commitment to the triple lock on the State Pension in the light of what look set to be highly unrepresentative statistics on average earnings growth. We discuss this more in Box 9.
64 See: T Bell et al., Macroeconomic Policy Outlook Q4 2020, December 2020, Resolution Foundation.65 RF calculations of: Welfare Trends Report, OBR, March 2021.66 For a more detailed discussion on this point, see: G Bangham et al., Unhealthy finances: How to support the economy today and
repair the public finances tomorrow, November 2020, Resolution Foundation.
BOX 9: The Triple lock in practice
The ‘triple lock’ was introduced in 2010 as a commitment to uprate the basic and new State Pension every April by the higher of:
• Earnings growth, which to date has been based on annual growth in ‘total pay’ (including bonuses), in the ONS’s Average Weekly Earnings (AWE) data, measured for May-July in the previous year;
• Inflation, which to date has been based on annual growth in the CPI series in the previous September; and
• 2.5 per cent.
The introduction of the triple lock has contributed significantly to reduced pensioner poverty, but it has also made the real value of the state pension more sensitive to earnings and inflation volatility. The past two years has
70The Living Standards Audit | 2021
Resolution Foundation

+2.4%
+6.5%
+10.2%
0% +2% +4% +6% +8% +10% +12%
Inflation forecast
Projected earnings growth
State pension increase projection
demonstrated this clearly. Pandemic measures, such as the lockdowns and restrictions on activity, had the effect of driving nominal earnings and inflation down in 2020, while their removal this year will have the reverse effect, leading to sharp increases in year-on-year earnings and price growth.
The low rates of inflation (0.5 per cent) and earnings growth (-1.0 per cent) in 2020 meant that, in April 2021, it was the 2.5 per cent minimum rise that was binding. In 2021, we project that average
weekly earnings could rise by up to 7.5 per cent, as they bounce back from pandemic lows, and if the Government continues to interpret its triple lock as it has done in the past, so the State Pension will follow suit. In this scenario, over the past two upratings, the State Pension would have increased by 10.2 per cent, significantly higher than the rise in prices (2.4 per cent) and earnings (6.5 per cent) that we predict to apply over the same period, as seen in Figure 43.
FIGURE 43: Triple lock will result in a windfall gain for pensioners if implemented under current assumptionsProjected two-year increases in the State Pension, earnings growth in the previous July, and inflation in the previous September: 2020-21 to 2022-23
NOTES: Assumes that earnings growth remains constant from the latest data (Feb-Apr 2021). Inflation forecast from the Bank of England for Q3 2021.SOURCE: RF calculations of ONS, Average Weekly Earnings, and Bank forecasts.
These may seem like small differences but they have non-negligible effects on public spending. The 10.2 per cent
uprating in pensions will add £4 billion more to spending in 202-23 than if
71The Living Standards Audit | 2021
Resolution Foundation

the State pension had kept pace with earnings alone over the two-year period.
Anticipating this pandemic-related earnings volatility, last year we recommended that the triple lock should be adjusted so as to be implemented over a rolled two-year period. It would then track the higher of inflation or average earnings growth over the past two years combined, with a minimum rise of five per cent. Under this rule, the State Pension would
increase by 3.9 per cent next year, rather than 7.5 per cent.
Even with this modification to the triple lock, there would continue to be a growing divergence between the value of the State Pension and working-age benefits. In 2014, the basic State Pension was 56 per cent higher than the main rate of unemployment benefit; in 2019 it was 77 per cent higher; under our proposal it would still be 90 per cent higher, or rising to 95 per cent if the current practice continues.
FIGURE 44: Even a modified triple lock would continue the divergence between the value of the State Pension and working-age benefitsSelected benefit amounts in nominal terms
NOTES: Shaded section represents projections.SOURCE: RF calculations of ONS, Average Weekly Earnings, and Bank forecasts; DWP, Abstract of DWP benefit rate statistics.
£0
£20
£40
£60
£80
£100
£120
£140
£160
1949 1953 1957 1961 1965 1969 1973 1977 1981 1985 1989 1993 1997 2001 2005 2009 2013 2017 2021
Unemployment benefitsBasic State PensionChild benefits (1st child)Child benefits (2nd+ child)Per-child credits (age 1-10)
Exc. two-child limit
72The Living Standards Audit | 2021
Resolution Foundation

Future livings standards challenges await the UK
The Covid-19 pandemic is unprecedented in modern history. And yet, despite that, our evidence shows that, on average, incomes so far have been relatively well protected through the crisis.
However, if there is anything we should conclude from the past 15 years, it is that we cannot take household income growth for granted. There are several challenges that lie ahead:
• First, there is a short-term risk of a significant fall to household incomes as the JRS ends at the same time as UC is due to be cut by £20 a week.
• Second, the crisis has had far from an equal impact. The net effect of income changes and spending pressures has led to unequal changes in household balance sheets, with lower-income families falling behind. Our findings in this report also suggest that older workers on furlough are at a greater risk of being shut-out of the labour market this summer. Both of these factors could have a serious long-lasting impact on living standards of certain groups of the population long after the crisis is over.
• Finally, the next few years will see newer challenges as we negotiate our way into new trading arrangements, as the impact of the UK’s new migration policy become clear, and as decisions on the path to net zero start to have more direct implications for household finances and government spending. These will further complicate the perennial challenge of how to improve the UK’s productivity record to deliver stronger economic growth and raise household living standards – ensuring income growth across the income distribution.67
As we move out of the immediate Covid-19 crisis period, the Government – and the UK as a whole – has much more work to do in the years ahead if we are to prevent another dismal decade of living standards for UK households.
67 For a longer discussion of the future challenges facing the UK economy see: T Bell et al., The UK’s decisive decade: The launch report for The Economy 2030 Inquiry, Resolution Foundation, May 2021.
73The Living Standards Audit | 2021
Resolution Foundation

Annex 1: Low-to-middle income families in 2019-20
The Resolution Foundation’s mission is to improve the living standards of those on low-to-middle incomes, especially those who are in work but still struggling financially. Given the current crisis, this year’s Audit has not focused explicitly on this low-to-middle income group. However, they remain our central long-run consideration and so this Annex presents some key statistics about them.
As set out in earlier Audits, we define the low-to-middle income group by focusing on those in:
• non-pensioner family units – excluding those containing any pensioners, as older households face different sets of challenges;
• the bottom half of the non-pensioner equivalised income distribution (after housing costs) – i.e. below a disposable income of around £32,000 for a couple with children and £23,800 for a couple without children in 2019-20;
• and family units in which at least one person is in (at least part-time) work.
• Table 2 divides the UK population into four groups: pensioner family units; those in non-working family units; those in higher-income family units; and those with low-to-middle incomes. That final group includes 20 million people (31 per cent of the population), including 7 million children (53 per cent of children).
74The Living Standards Audit | 2021
Resolution Foundation

TABLE 2: 20 million people, including over half of all children, lived in ‘low-to-middle income’ family units in 2019-20Numbers and proportions of people / families in our four income categories, 2019-20: UK
Pensioner Total
Non-working (%)
Low-to-middle
income (%)Higher-income (%) (%)
Total population 6,100,000 9% 20,380,000 31% 26,340,000 40% 12,690,000 19% 65,520,000Adults 4,630,000 9% 13,080,000 25% 21,260,000 41% 12,650,000 25% 51,620,000Children 1,470,000 11% 7,300,000 53% 5,080,000 37% 50,000 0% 13,900,000
Total number of families 4,020,000 11% 8,560,000 24% 14,040,000 40% 8,590,000 24% 35,200,000Couple with children 210,000 3% 2,920,000 48% 2,900,000 48% 6,030,000Single with children 550,000 30% 960,000 53% 310,000 17% 1,820,000Couple without children 390,000 6% 1,610,000 25% 4,320,000 68% 6,320,000Single male without children 1,600,000 23% 1,670,000 24% 3,790,000 54% 7,060,000Single female without children 1,280,000 24% 1,400,000 26% 2,720,000 50% 5,390,000Pensioner couple 4,060,000 100% 4,060,000Single male pensioner 1,510,000 100% 1,510,000Single female pensioner 3,010,000 100% 3,010,000
Non-pensioner
SOURCE: RF analysis of DWP, Households Below Average Income.
In 2019-20 the typical (and equivalised) disposable income for the low-to-middle income group, after housing costs, was £16,990. As shown in Figure 45, this is the highest that median incomes have been for this group.
Whilst median income growth for households with low-to-middle incomes has been high in 2019-20 (which should be celebrated), income growth for this group has been stagnant for previous 15 years. One contributing factor to this is that rising employment has increased the size of the low-to-middle income group while shrinking the non-working group, and those who have moved between the groups are more likely to have relatively low earnings (for example, more lone parents now work part-time rather than not at all). This acts as a slight drag on the typical income of this specific group. But weak growth in incomes is also apparent for the non-pensioner group as a whole, and for the poorer 50 per cent in particular. Furthermore, the high income growth in 2019-20 is unlikely to continue, due to the future shock to incomes Covid-19 will pose.
75The Living Standards Audit | 2021
Resolution Foundation

FIGURE 45: The median income of the low-to-middle income group was £16,990 in 2020-21, a new highMedian disposable income, after housing costs, 2019-20 prices, by income category: UK
NOTES: UK from 2002-03, GB before. See text for definitions of these groups.SOURCE: RF analysis of DWP, Households Below Average Income.
As we stress in the main body of this report, the fact that the Covid-19 crisis is coming on top of prolonged weak income growth makes it all the more important that policy delivers a period of sustained, strong real income growth for low-to-middle income working-age households in future.
£0
£5,000
£10,000
£15,000
£20,000
£25,000
£30,000
£35,000
1994-95
1996-97
1998-99
2000-01
2002-03
2004-05
2006-07
2008-09
2010-11
2012-13
2014-15
2016-17
2018-19
Pensioner
All non-pensioner
Higher income(non-pensioner)
Non-working (non-pensioner)
Low-to-middle income (non-pensioner)
76The Living Standards Audit | 2021
Resolution Foundation

Annex 2: Previous income predictions
This report includes a ‘nowcast’ of household incomes in 2020-21.
This nowcast is the latest in a series of Resolution Foundation nowcasts and forecasts, and we now have some outturn data on which to judge these previous projections.
It is important to stress that the outturn data itself (DWP’s Households Below Average Income data) is unlikely to be a perfect record of what has happened. For example, when the 2019/20 figures were published, previous years of HBAI were revised due to child maintenance arranged via the Child Maintenance Service being included – which has meant that more income from child maintenance is included in the figures, which has increased some incomes and reduced low income rates for families that have children.68 This has led to slight changes in the data: for example, median income growth in 2018-19 was -0.5 per cent before the revision, and 0 per cent after. Furthermore, we know there are substantial systematic problems such as an under-reporting of benefit income,69 and some under-reporting of top incomes.70 The DWP’s data might therefore be revised in future.
That said, our nowcasts of growth in median income have typically performed well, as Figure 46 shows. Growth in median income after housing costs has been our headline measure (being less skewed by the very top than mean income) – and we have tended to focus on non-pensioners (though our track record for the overall median is similar). However, our nowcasts did not pick up the 5.4 per cent income growth seen in the 2019-20 HBAI data. As explained in Section 2, the earnings driven rise in incomes in 2019-20 was much larger than other data led us to nowcast. Furthermore, there is considerable uncertainty around the single year changes in incomes. Although our rate of success is high, our predictions should not be expected to be successful every year, given the level of uncertainty in the survey data discussed above. And the current coronavirus crisis is notably more complicated than most time periods. But this does show that we can produce useful income data in advance of HBAI publication (and the ONS have shown the same for their own preliminary income estimates).71
68 DWP, Household below average income series: quality and methodology information report FYE 2020, March 2021. 69 A Corlett et al., The Living Standards Audit 2018, Resolution Foundation, July 2018.70 For discussion, see ONS, Top income adjustment in effects of taxes and benefits data: methodology, February 2020.71 ONS, Average household income, UK: Financial year ending 2019 (provisional), July 2019.
77The Living Standards Audit | 2021
Resolution Foundation

FIGURE 46: Nowcasts of real growth in median household income have typically proved a good indicator of what HBAI will showReal growth in actual and simulated median non-pensioner household income: UK
NOTES: Projections for a given year may change from report to report due to changes in the economic forecast; policy changes; and modelling upgrades.SOURCE: Various RF; and RF analysis of DWP, Households Below Average Income.
Looking beyond the median, the Gini coefficient has been relatively predictable: our Living Standards Audit 2018 and Living Standards Audit 2019 nowcasted a small inequality rise in 2017-18 and then a larger rise in 2018-19, and this is what the DWP data has subsequently shown.72
Our projections for relative poverty have sometimes proved harder to reconcile with outturn survey results. In the Living Standards Outlook 2021,73 we projected that relative poverty would remain at 22 per cent in 2019-20, which was also shown in the HBAI data. However, in the Living Standards Outlook 2019,74 we projected relative child poverty to rise between 2016-17 and 2018-19, while the rate has actually fallen slightly in the DWP data. However, this is not because this group has done particularly well: the real household incomes of roughly the poorest 30 per cent of children actually declined between 2016-17 and 2018-19 in HBAI. But the relative poverty measure is sensitive both to changes in median income and to the exact number of people just above or below the poverty threshold. Additionally, poverty measurement is likely to be particularly affected by the under-reporting of benefit income.75
72 A Corlett et al., The Living Standards Audit 2019, Resolution Foundation, July 2019.73 M Brewer et al., The Living Standards Audit 2021, Resolution Foundation, January 2021. 74 A Corlett et al., The Living Standards Outlook 2019, Resolution Foundation, February 2019.75 A Corlett et al., The Living Standards Audit 2018, Resolution Foundation, July 2018.
-1.0%
0%
+1.0%
+2.0%
+3.0%
+4.0%
+5.0%
+6.0%
RF L
iv. S
tand
. 201
7
DW
P fin
al
RF L
iv. S
tand
. 201
7
RF A
udit
2017
RF O
utlo
ok 2
018
DW
P fin
al
RF O
utlo
ok 2
018
RF A
udit
2018
RF O
utlo
ok 2
019
DW
P fin
al
RF O
utlo
ok 2
018
RF O
utlo
ok 2
019
RF A
udit
2019
DW
P fin
al
RF O
utlo
ok 2
018
RF O
utlo
ok 2
019
RF A
udit
2020
DW
P fin
al
RF O
utlo
ok 2
018
RF O
utlo
ok 2
019
RF O
utlo
ok 2
021
RF A
udit
2021
2015-16 2016-17 2017-18 2018-19 2019-20 2020-21
78The Living Standards Audit | 2021
Resolution Foundation

The Resolution Foundation is an independent research and policy organisation. Our goal is to improve the lives of people with low to middle incomes by delivering change in areas where they are currently disadvantaged.
We do this by undertaking research and analysis to understand the challenges facing people on a low to middle income, developing practical and effective policy proposals; and engaging with policy makers and stakeholders to influence decision-making and bring about change.
For more information on this report, contact: Karl Handscomb Senior Economist [email protected]
Resolution Foundation
2 Queen Anne’s Gate
London SW1H 9AA
Charity Number: 1114839
@resfoundationhttps://www.resolutionfoundation.org/publications/the-living-standards-audit-2021/


