Page 1
1
The Long-run Environmental and Economic Impacts of Electrifying
Waterborne Shipping in the United States
Kenneth Gillingham* and Pei Huang†
July 17, 2020
In Press, Environmental Science & Technology
Abstract
Emissions from ships in and surrounding ports are a major contributor to urban air pollution in
coastal and inland riverside cities. Connecting docked ships to onshore grid electricity and using electric
tugboats are two approaches to reduce pollution damages. This paper examines the effects of widespread
adoption of electrification in waterborne shipping. Our study is novel in the use of an equilibrium model of
the U.S. energy system to capture the effects of increasing electricity generation to electrify waterborne
shipping both with and without a carbon pricing policy. We examine three scenarios—Electrifying in Ports,
Electrifying in Emission Control Areas, and Electrifying all U.S. vessel fuels—as well as an electrification
scenario under carbon pricing, allowing electrification of waterborne shipping to contribute to deeper de-
carbonization. We find that electrification results in slight carbon emissions reductions in early projected
years, and that the reductions increase as the electric grid evolves out to 2050. We also show that an ambi-
tious scenario of electrifying all U.S. fuels results in up to 65% net reduction in air pollution as we approach
2050, even after accounting for the pollution increase from grid generation. Our baseline results indicate
that intensive waterborne shipping electrification can provide considerable social benefits that exceed the
costs, especially as the electric grid decarbonizes.
Keywords: waterborne shipping electrification, ports, air pollution, carbon emission, carbon pricing, costs
and benefits, deep decarbonization.
*Gillingham (corresponding author): [email protected] , Yale University, 195 Prospect St, New Haven,
CT 06511 †Huang: [email protected] , Yale University, 370 Prospect St, New Haven, CT 06511
Page 2
2
1 Introduction
The waterborne transportation sector is essential for global trade, but it also strongly contributes to
CO2 emissions and local air pollution.1–3 Vessels can be among the dirtiest emitters, as they often are burn-
ing low-grade fossil fuels.4–6 Thus, people living or working near ports can be adversely impacted by air
pollution, facing premature mortality and increased hospital visits for respiratory, heart, and lung dis-
eases.7,8 In response to these local health concerns, there has been policy action intended to reduce emissions
in the areas around ports in the United States, including Emission Control Areas (ECA), the Diesel Emis-
sions Reduction Act (DERA), and Congestion Mitigation and Air Quality Improvement (CMAQ) pro-
grams.9
There has been considerable policy discussion in recent years about electrifying port activities us-
ing onshore grid power. For example, vessels can plug into the onshore electric grid while docked, and
electric tugboats can be used for maneuvering into ports and then plugged into the onshore grid. Other
activities can be electrified too, such as cargo handling equipment and short-haul vehicles. Waterborne
shipping electrification has been discussed as having great potential to shift pollution from ports (both in-
land and coastal) and waterways in populated areas to lower-polluting power plants in more remote loca-
tions. This policy is already being implemented in a limited way in several ports. For example, Long Beach
and Los Angeles both have limited electrification programs for ocean-going vessels.10,11 Whether there is a
net reduction in emissions from electrification depends on the emissions intensity (both carbon and local
air pollutants) of the fuels used in shipping versus the electricity grid. Hence, a cleaner electric grid raises
the likelihood of a net reduction.
This paper uses the well-known National Energy Modeling System (hereafter Yale-NEMS) as the
primary research tool. Yale-NEMS is the U.S. Energy Information Administration (EIA)’s NEMS model
run on a server at Yale with minor changes made for our analysis (e.g., adding electricity consumption by
ships from the onshore grid to reflect the current status of waterborne shipping electrification). We address
two main questions in our analysis: (1) would electriying waterborne vessels lead to lower net emissions of
Page 3
3
CO2 and local air pollutants in realistic scenarios of the future energy system, and (2) what are the associated
benefits and costs? We examine three waterborne shipping electrification scenarios in the U.S. energy sys-
tem: (1) electrifying auxiliary power for vessels docked in ports; (2) electrifying auxiliary and primary
engine fuels within the extended areas from the ports (e.g., through additional electrified tugboats); (3)
electrifying all vessel fuels accrued to the U.S. energy system (e.g., perhaps someday through vessels with
electric storage). In this study, we focus on electrifying the vessels themselves, as these are the largest
source of emissions from ports,9 but we note that deeper decarbonization could require electrifying all port
activities.
Our work is novel in several ways. It is the first study that explicitly models the effects of water-
borne shipping electrification into the future using realistic projections of how the future electricity system
in different regions of the United States would evolve out to 2050. Importantly, we examine scenarios with
and without carbon pricing, allowing us to make full use of the capabilities of Yale-NEMS. This paper is
also the first study to explore more intensive electrification of waterborne shipping. As policymakers con-
sider deeper decarbonization across nearly all sectors of the economy, it is important to understand the
effects of such intensive electrification scenarios with carbon pricing.12
Yale-NEMS is a supply-demand general equilibrium model of the U.S. energy markets (interacting
with international energy markets), subject to a set of current policies, resource constraints, and technolog-
ical advancement. Continually developed by the U.S. EIA, the model has a broad geographic scope, detailed
modeling of the energy markets, and comprehensive inclusion of existing policies.13 Importantly for our
study, Yale-NEMS has an established link between the electricity generation and waterborne shipping.
While no model is perfect, the NEMS platform is a deeply vetted, comprehensive platform for modeling
U.S. energy markets and policies.14
Our study has clear policy implications. To date, 16 ports in the United States can supply electricity
to vessels at berth.11 Nevertheless, even in these 16 ports, there is no national requirement that vessels are
powered by onshore electricity, and indeed not all vessels take advantage of the electrification. This state
of affairs has contributed to California’s recent “Shore Power Regulation,” which requires 80% of vessel
Page 4
4
visits to connect to onshore electricity starting in 2020.15 In addition, while it is unclear whether and when
there will be an economy-wide carbon policy in the United States, our analysis is designed to provide in-
sights into the emissions in a future deeper decarbonization scenario of waterborne shipping electrification
under carbon pricing.
2 Literature Review
Reducing fossil fuel consumption from ports has been of growing interest in recent years.16–18 To
achieve the goal environmental sustainability, port authorities and policymakers have been implementing
technological and organizational innovations, such as optimizing port operations,19–24 adopting new tech-
nologies,25–27 and using cleaner fuels (i.e., renewable energy, liquefied natural gas, and biofuel).28–31 There
has also been a transition towards the electrification of port activities using onshore grid.17 Studies have
examined the effect of electrifying vessels at berth (also called cold-ironing, alternative marine power, on-
shore power supply, or shoreside power) on emissions.32–38 Other diesel-powered port-related cargo han-
dling equipment, e.g., quay cranes, automated guided vehicles (AGV), and heavy-duty vehicles, can also
be electrified to achieve deeper emissions reductions.39–42
This paper contributes to the literature of waterborne transportation decarbonization. In related
work, Vaishnav et al.43 use a mixed-integer linear programming model to determine the optimal number of
ships and berths to be electrified to maximize net benefits. While Vaishnav et al. provide important insights
into the net benefits of near-term relatively modest waterborne shipping electrification policies, our paper
differs in examining more intensive electrification policies over a longer time frame (out to the year 2050).
Our work is also distinct in that we examine how potential long-term projections of the source of the gen-
eration in the electricity grid (both with and without carbon pricing) could influence the net impacts of
waterborne shipping electrification going forward, rather than using historical electricity prices and emis-
sions. Earlier studies, such as the 2004 Port of Long Beach study, also provide useful information, but are
dated and do not attempt to look at the broader implications of electrification.10
Page 5
5
This paper also contributes to the growing literature harnessing the well-known National Energy
Modeling System (NEMS). To date, NEMS (including Yale-NEMS) has been widely used to evaluate en-
ergy and environmental policies and market development in the U.S., such as abundant natural gas sup-
ply,44–47 Renewable Portfolio Standards,48–51 cap and trade and carbon pricing,52,53 improved energy effi-
ciency,54–58 and the role of U.S. energy in the global market.59 To our knowledge, this paper is the first to
tackle the electrification of waterborne shipping using a version of NEMS.
3 Methods
To quantitatively estimate the effects of waterborne shipping electrification on net emissions in the
long run, we need a model that simulates waterborne shipping and its interaction with electricity supply.
We also require a model that provides the outputs of interest with sufficient spatial granularity. The Yale-
NEMS platform is ideally suited to help us answer the research questions. Yale-NEMS is a widely-used
large-scale general equilibrium model for the U.S. energy system, consisting of all primary demand and
supply sectors, such as an electricity market module and a transportation sector module that models water-
borne shipping.44 Yale-NEMS projects energy market equilibrium production, consumption, imports, con-
version, and prices from the present to 2050 and incorporates relevant macroeconomic, technology, re-
source availability, behavior choice, policy, and demographic constraints. The model also projects CO2,
SO2, and NOx emissions based on fossil fuel consumption and fuel-specific emissions factors.60
An advanced feature of Yale-NEMS is that it provides a reliable framework representing the com-
plex interactions of energy sectors and technological improvement over time in the U.S. energy system.13
Yale-NEMS also can simulate the market outcomes responding to a wide variety of alternative assumptions
and proposed policies. For example, power plants in the electricity market module endogenously select the
fuel technologies through cost minimization to generate electricity to meet the demand increase from elec-
trification in the waterborne shipping sector. One limitation of Yale-NEMS is that the electricity market
module accounts for detailed factors such as intertemporal operational constraints and interannual variabil-
ity of renewable resources in a simplified reduced-form manner, following the state-of-the-art for long-run
Page 6
6
energy system models. This implies that any short-run projections will not be quite as accurate as detailed
electricity dispatch models.61–63 However, our research question focuses on the long run. See Supporting
Information for the modeling details of Yale-NEMS and our post processing.
3.1 Scenarios
3.1.1 Reference Case
The reference case is based on EIA’s 2017 Annual Energy Outlook (AEO2017). The AEO2017
reference case projects the U.S. energy market and environmental variables out to 2050. The reference case
aims to incorporate all current energy and environmental policies at the state and federal levels until their
sunset dates, such as the Regional Greenhouse Gas Initiative (RGGI), Cross State Air Pollution Rule
(CSAPR), California Assembly Bill 32: California Global Warming Solutions Act of 2006 (AB32), Mer-
cury and Air Toxics Standards (MATS), and Corporate Average Fuel Economy (CAFE) standards set by
the Obama Administration. Any rulemakings expired or newly proposed but not yet implemented are not
included in the AEO2017 reference case.
There are two published projections in AEO2017. One includes the Clean Power Plan (CPP), and
the other excludes it. The CPP was finalized by the Obama Administration in 2015, and it required states
to reduce carbon emissions from the power sector by 32% on average below the 2005 level by 2030.64
However, the Trump Administration has halted implementation of the CPP and has proposed a replacement
rule that most analysts say will lead to few, if any, emissions reductions.65 Thus, we use the AEO2017
without the Clean Power Plan as the reference case for this study.
AEO2017 does not project out waterborne electricity consumption, so we create our projections
based on historical data of berthed vessels in the U.S. ports. We calculate the amount of electricity from the
grid consumed by vessels for each historical year up to 2016 and assume that it scales up based on total
energy consumption in all years going forward. We also include any policies that mandate the use of shore
power in future years, such as the “California Shore Power Regulation.” To prevent double-counting
Page 7
7
electricity consumption, we subtract the added electricity used by vessels from commercial electricity de-
mand (see Supporting Information for the detailed steps).
3.1.2 Electrification Scenarios
We propose three electrification scenarios in this study and are the first to explore the more ambi-
tious second and third scenarios. Because the largest contributor of emissions (e.g., more than 50% of PM2.5
emissions) is directly from the ships,9 we focus on freight and passenger vessel electrification. All types of
ports are included in the analysis, including container, bulk, tanker, general cargo, and cruise ship terminals.
The first scenario, “Electrifying in Ports,” assumes that starting from 2019, waterborne vessels replace
increasing amounts of their in-port auxiliary engine fuel consumption (e.g., distillate oil, residual oil, and
natural gas) with onshore electricity (see Supporting Information for the linear formula used to switch fossil
fuels to electricity). After 2025, vessels replace all in-port auxiliary engine fuel consumption with electricity.
The six-year plan we model for implementing waterborne shipping electrification in all U.S. ports would
require major policy action, but seems plausible based on existing examples. For instance, the construction
of facilities for electrifying the Port of San Diego began in mid-2013 and was completed in February 2014.66
It took five years for the Port of San Francisco to implement shore-side electrification from breaking ground
in 2005 to operation in 2010.67 Our first scenario is the most modest scenario among the three. It follows a
trend towards electrification that has already begun, and it allows the vessel main engines to still be reliant
on fossil fuels.
Our second scenario is an intermediate case intended to uncover the effects of deeper electrification.
This scenario, called “Electrifying in ECA,” electrifies all of the primary and auxiliary fuels that are con-
sumed within the boundary of the North American Emissions Control Area (ECA), which consists of all
marine areas within 200 miles of the shoreline where all vessels (both inland and marine) are required to
use low-sulfur fuels (0.1% mass starting from January 1, 2015) or investing in abatement technologies.68
This implies that ports use electric tugboats to take the ships out to the end of the ECA and/or that the
vessels can power their main and auxiliary engines using battery electric power for at least some number
Page 8
8
of miles. As an example, the Port of Auckland in New Zealand is the first port already deploying full-size
electric tugboats to maneuver large ships outside the port area so that they do not have to turn on their main
engines.69
The ECA region is of particular interest to policymakers, as evidenced by the current policy, which
requires low-sulfur fuels within this area. However, our results scale with the distance from the port, so
these results also provide insight into a scenario where only some fuel use within the ECA is converted to
electricity. Just as in the first electrification scenario, we allow the fuel switch to gradually occur, starting
from 2019 and increasing to 2025 to make the scenarios comparable. From 2025, distillate oil, residual oil,
and natural gas consumption by waterborne shipping are entirely displaced by electricity in this scenario.
The third scenario, “Electrifying All U.S. Fuels,” models the thought experiment of a very ambi-
tious policy that involves dramatic electrification, consistent with deeper decarbonization of shipping. This
scenario electrifies all fossil fuels used by the waterborne shipping sector that are attributed to the U.S.
energy system, including fuels used to power shipping outside of the 200-mile ECA. This includes all en-
ergy consumed or loaded on ships within the borders of the United States. In the scenario, ships would have
to entirely electrify the main and auxiliary engines. Thus, there would have to be not only onshore electric
facilities and electric tugboats, but also large-scale adoption onboard batteries. This would only be possible
with a significant international effort, and thus we view this scenario as an upper bound on what might be
possible.70 As in the previous scenarios, we model vessels steadily switching to electricity from 2019 to
2025, and starting in 2025, full electrification is achieved. Note that the social benefits associated with
electrification in this scenario cannot be entirely attributed to the United States, because the potential emis-
sion reduction may occur far away from the U.S. shoreline. However, in all three scenarios, the electricity
used by waterborne shipping comes from onshore electricity generation in the United States.
3.1.3 Carbon Pricing Scenarios
We further implement two additional scenarios (“Carbon Pricing” and “Electrifying in ECA &
Carbon Pricing”), where a path of gradually increasing carbon prices is imposed on the whole economy.
Page 9
9
While a future national carbon pricing policy is uncertain, we use this carbon policy and its interaction with
electrification as examples that illustrate potential policy implications. Similar to Gillingham and Huang,44
the carbon price path begins in 2020 at around $2 per metric ton of CO2 in 2016 dollars and ramps up
linearly to $46 per metric ton of CO2 in 2040. Subsequently, the price stays constant. As an alternative to
the same price for all ports or firms in each year, some countries have implemented or discussed stepwise
linear carbon taxation.71,72 One could see our carbon pricing scheme as the average price across all ports in
a region, which would permit stepwise linear taxes implemented at individual ports.
Note that the carbon price trajectory provides an illustrative example of what one modest carbon
price path could achieve. Notably, it is below the central case of the social cost of carbon (SCC) estimated
by the Obama Administration,73 but it quickly rises above the estimates of the SCC currently in use by the
Trump Administration.74
3.2 Monetizing Benefits and Costs
This section illustrates the assumptions for estimating the benefits and costs associated with water-
boene shipping electrification. We monetize the social damages caused by pollutant emissions based on the
emissions results from Yale-NEMS and estimates of marginal damages from the literature. For CO2 emis-
sions from the waterborne shipping and power generating sectors, we use the central path of the social cost
of carbon dioxide (SCC) estimates over time, which reflects the Obama Administration’s best effort to
develop a set of estimates.73 Note that this is below the path of carbon prices needed for deeper decarboni-
zation.75
For other local air pollutant emissions from the waterborne shipping and power generating sectors,
we calculate the total social costs by applying estimates of marginal damages per unit of air pollutant emis-
sion from Muller et al. 76 Note that these estimates come with large error bars.77 The impacts of air pollution
in these marginal damage estimates include adverse human health effects, reduced visibility, declined tim-
ber and agricultural yields, reductions in recreation services, and increasing material depreciation. We dis-
aggregate the projected Census division-level emissions to the county level based on the EPA National
Page 10
10
Emission Inventory (NEI) 2014 data, and then apply them to the county-level marginal estimates to com-
pute the total damages (see Section 2 in Supplementary Information (SI) for details).
The change in fuel costs incurred by vessels after electrification may be a cost or benefit depending
on the efficiency of each fuel and the relative retail prices of the fuels. Yale-NEMS projects the retail prices
for distillate oil, residual oil, natural gas, and electricity. We calculate the total fuel costs of waterborne
shipping by multiplying the projected retail fuel prices and consumed quantities.
Electrification also requires retrofitting port berths and vessels, which is a cost in our scenarios.
EPA estimates that retrofitting one berth costs $0.5-2.5 million,11 and we assume that the retrofit cost is
$1.5 million/berth, which includes the costs for retrofitting the necessary electrical distribution network.43
There are 3,200 port berths in the U.S. serving deep-draft ships,78 and we assume that these 3,200 berths
are steadily electrified from 2019 to 2025, following our scenario designs. We also assume that the operat-
ing and maintenance costs per electrified berth are $0.1 million per year.43
EPA estimates retrofitting an average vessel will cost around $0.5 million.11 Of course, vessels are
heterogeneous, and some may be much more or less expensive to retrofit; here we take the average retrofit
cost for all vessels. Between July 2013 and December 2014, 3,300 vessels were called at U.S. ports.43 We
assume that the total number of vessels increase over the years starting from 2014 at the growth rate of
projected waterborne fuel consumption in Yale-NEMS. We then assume the starting number of vessels in
2019 are modified gradually up to 2025, and the vessels newly added to the fleet are modified every year.
In the Electrifying in ECA scenario, the tugboats in place are assumed to be electrified as well. Note
that barges are not included in our analysis. We obtain the total number of tugboats registered in the United
States from U.S. Army Corps of Engineers (USACE). There are 5,809 tug-type workboats operating in the
United States in 2017 including both ocean-going and inland boats. Again, we assume that all the tugboats
are gradually electrified from 2019 to 2025. Since the actual sale prices for electric tugboats are not publicly
available due to confidentiality, we further assume that replacing a traditional diesel-powered tugboat with
an electric one costs $2.5 million on average based on the available evidence. We discuss this evidence and
present the details of estimating the cost of replacing a tugboat in Supporting Information. One caveat of
Page 11
11
our cost estimate for tugboat replacement is that we do not account for the fact that many of these boats
would have been replaced anyway as they aged out of their useful life, and thus our cost estimate is likely
to be an over-estimate.
4 Results
This section presents the primary results for energy consumption, carbon emissions, local air pol-
lutant emissions, and an illustrative cost-benefit analysis across the scenarios.
4.1 Energy Consumption
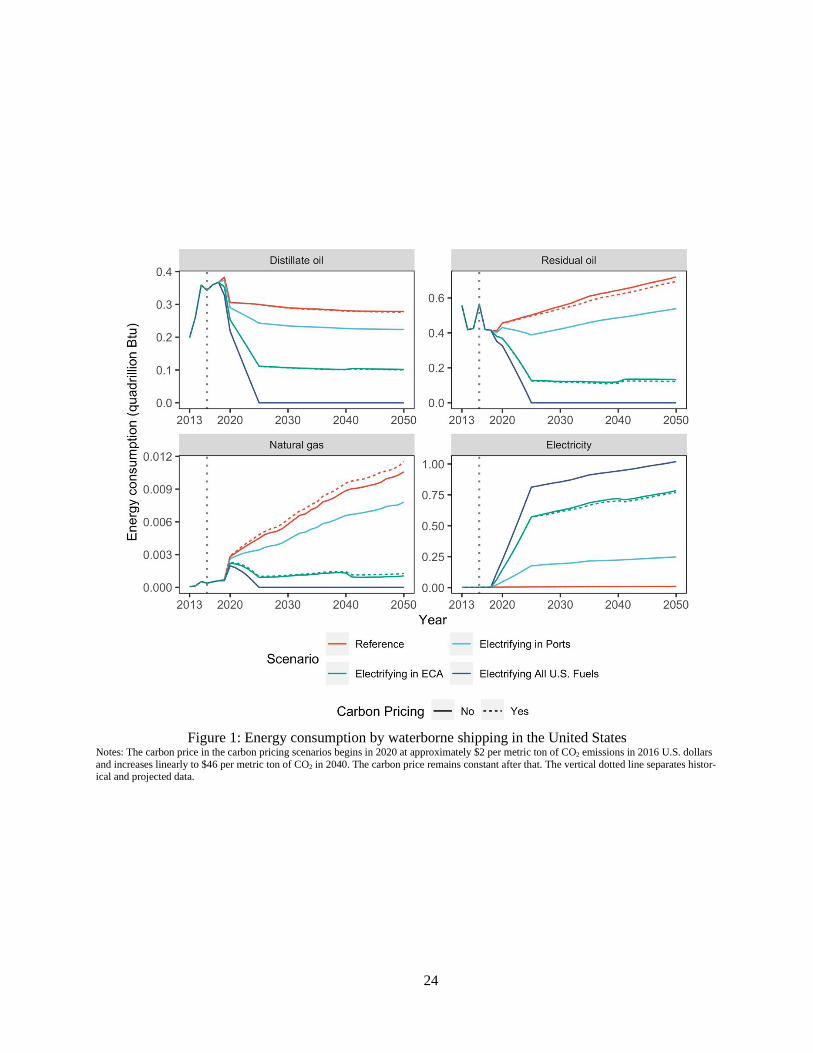
Figure 1 presents total energy consumption from waterborne shipping over time from different
fuels. We see that most energy used by vessels comes from distillate and residual oil in the reference case.
There has been a switch in recent decades from residual oil to distillate oil consumption in waterborne
shipping, primarily driven by policies, such as Annex VI of the 1997 MARPOL. In all three electrification
scenarios (without carbon pricing), from 2019 to 2025, the consumption of fossil fuels is gradually dis-
placed by electricity. The scenarios with carbon pricing lead to substitution from dirty fuels (e.g., residual
oil) to cleaner fuels (e.g., natural gas). Figures S2 and S3 in SI present energy consumption shipping type
(international and domestic) and port type (seaports and inland ports).
The electricity consumption by vessels is generated in the power sector from a variety of fuel
sources through cost minimization in Yale-NEMS. Figure S4 in SI shows that the increased electricity from
waterborne shipping electrification is mainly generated from natural gas and to a lesser extent from renew-
ables and coal.
4.2 Carbon Emissions
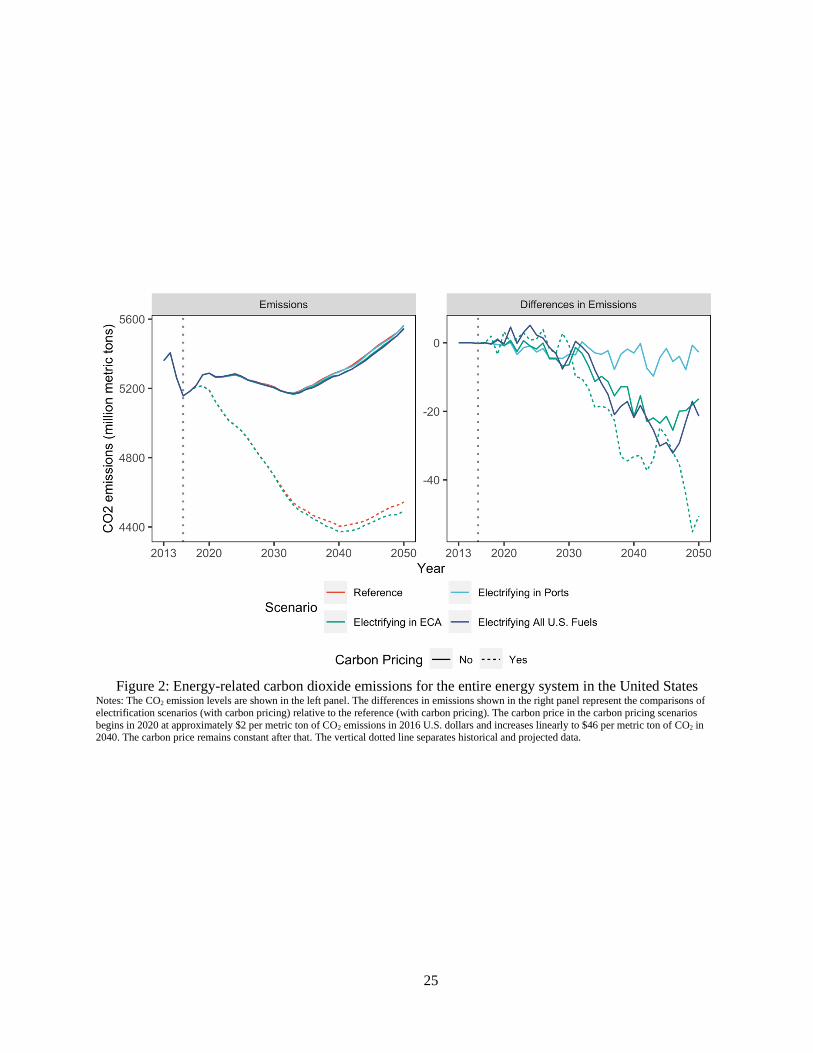
Figure 2 presents the net emissions of CO2 in the entire U.S. energy system, both in levels and
differences between scenarios. We observe that CO2 emissions in the scenarios without carbon pricing de-
crease until around 2030, and then increase to 2050. This occurs because around 2030, many of the envi-
ronmental policies in the U.S. sunset or do not impose further restrictions (e.g., California Global Warming
Page 12
12
Solutions Act of 2006 and the Regional Greenhouse Gas Initiative). This assumption should not change the
relative ordering across the scenarios in the later years, and it is the relative ordering that we care about the
most.
There are no significant CO2 emissions reductions in the three electrification scenarios (without
carbon pricing) in the early years, and starting from 2035, CO2 emissions reductions decline as the electric
grid evolves. In 2050, the decline is 0.05% (2.71 million metric tons (Mt)) in the Electrifying in Ports
scenario, 0.3% (16.33 Mt) in the Electrifying in ECA scenario, and 0.4% (21.38 Mt) in the Electrifying All
U.S. Fuels scenario compared to the reference case. The CO2 emissions reductions are primarily due to
increases in coal- and natural gas-generated electricity and the associated transmission losses.
Figure 2 also displays energy-related CO2 net emissions with a carbon pricing policy (dashed lines).
Relative to the reference case in 2050, the stand-alone Electrifying in ECA scenario and Carbon Pricing
scenario lead to 16.33 Mt and 1,021.11 Mt CO2 emissions reductions, respectively. However, the combined
Electrifying in ECA and Carbon Pricing scenario results in 1071.65 Mt CO2 emissions reductions (relative
to the reference case), which is larger than the sum of individual policy impacts, which is 1,037.44 (16.33
+ 1021.11) Mt. In addition, the Electrifying in ECA scenario under Carbon Pricing leads to higher CO2
emissions reductions (50.54 Mt) than the reference case without Carbon Pricing (16.33 Mt) in 2050. Car-
bon pricing results in a cleaner fuel souces for waterborne shipping electrification, and thus the combined
policies can achieve deeper decarbonization than the the sum of the reductions from carbon pricing or
electrification run separately. This finding of a complementarity in CO2 emission reductions is useful for
policy and only possible because of our integrated modeling approach. Figures S5-7 in SI present CO2
emissions disaggregated by shipping type, port type, and energy sector (waterborne shipping and electric
power).
4.3 Local Air Pollutant Emissions
Figure 3 presents the net emissions of local air pollutants (SO2, NOx, PM2.5, PM10, and VOC). We
project these emissions for the waterborne shipping and electricity sectors only (see Section 1.3 in SI for
Page 13
13
the details of the post-processing approach). Figure 3 shows the drastic decline of local air pollutants (e.g.,
SO2) in historical years, which was mainly driven by reduced coal-fired electricity generation. For the elec-
trification scenarios without carbon pricing (solid lines), we see significant declines in emissions relative
to the reference case because the dirty fuels used by vessels are replaced with electricity generated more
efficiently and from cleaner fuels at power plants.
Relative to the reference case in 2050, Electrifying in Ports leads to about a 8-13% decrease in
emissions across the pollutants, Electrifying in the ECA lowers emissions by 50%, and the Electrifying All
U.S. Fuels scenario results in up to 65% decline in local air pollutant emissions. One important caveat is
that the results for the Electrifying All U.S. Fuels scenario includes emissions over the oceans, so the emis-
sions reductions may not translate as directly into improvements in human health to the United States. The
carbon pricing scenarios (dashed lines) also show significantly lower local air pollutant emission levels due
to the net changes in fossil fuel use, adjusted by the carbon intensity of the fuels.
In contrast to CO2, we do not find a complementarity between carbon pricing and waterborne ship-
ping electrification for local air pollutants. This is primarily because carbon pricing indirectly affects local
air pollution through reduced energy use—so there is less potential for further local air pollution emission
reductions from shipping electrificaition when there is less energy use already in the waterborne shipping
sector due to the carbon pricing. Figure S8 in SI presents the comparisons of local air pollutant emissions
between scenarios.
Figures S9-11 in SI also present disaggregated results for local air pollutant emissions. Table S2
shows the comparisons of CO2 and local air pollutant emissions between scenarios in 2050, and Table S3
contains a summary of major results of energy consumption and emissions between the waterborne shipping
and power sectors.
Page 14
14
4.4 Net Benefits
4.4.1 Illustrative Results of Cost-Benefit Analysis
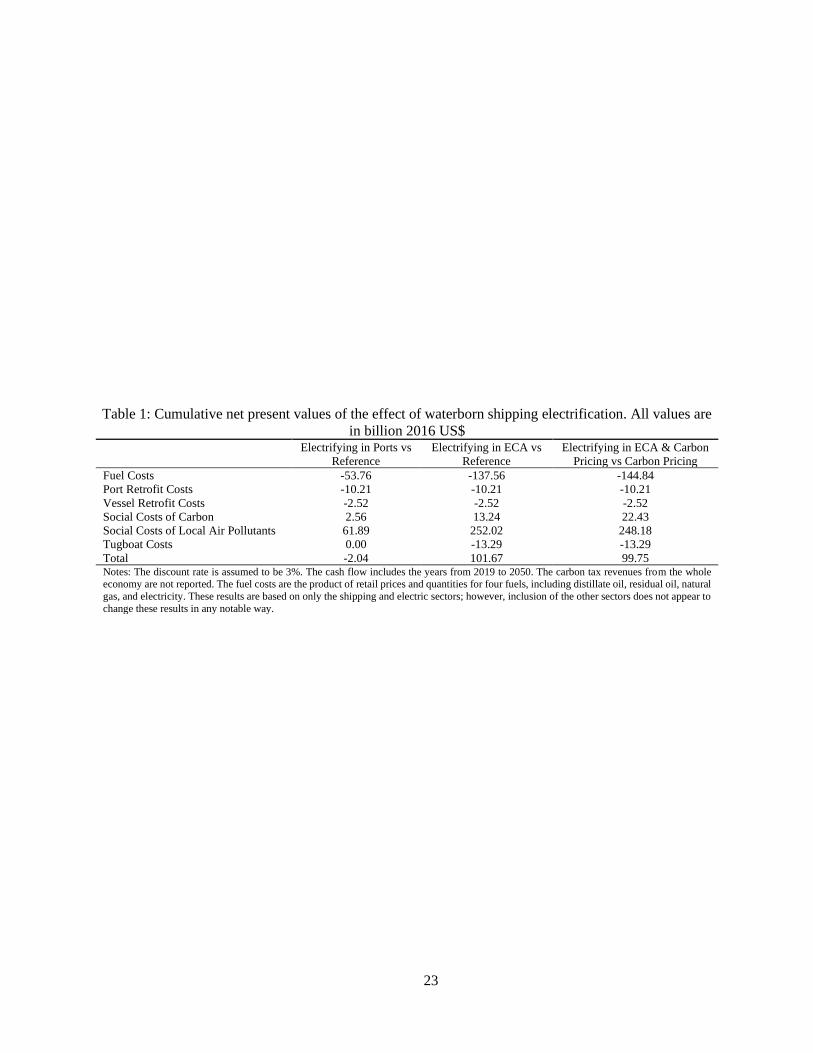
Table 1 presents the illustrative calculations of the cumulative discounted costs and benefits of the
scenarios from 2019 to 2050. All monetary values are in 2016 U.S. dollars. We assume an annual discount
rate of 3%. The first column shows the comparison of the Electrification in Ports scenario to the reference
case, indicating net benefits of -$2.04 billion. Most of the benefits stem from decreased social costs due to
lower air pollutant emissions, however, the benefits are mostly offset by higher electricity prices from elec-
trification (electricity is more expensive than diesel or bunker fuel for shipping). Figure S12 in SI shows
the projected electricity prices out to 2050.
We see considerable positive net benefits of $101.67 billion in the Electrifying in ECA scenario
(the second column of Table 1). These positive net benefits stem from reduced social costs of local air
pollution despite a substantial increase in fuel costs and the capital/maintenance costs of the electrification.
If we simply divide the electrification capital costs by the CO2 emission reductions, we find an average cost
of $77 per metric ton CO2 emissions abated, which is less expensive than estimates of the cost needed for
deeper decarbonization (e.g., >$100 per metric ton of CO2 emissions estimated in Dietz et al.).75 The third
column of Table 1 show the costs and benefits associated with the Electrifying in ECA scenario compared
to the Carbon Pricing scenario, illustrating the effect of electrification under carbon pricing. The net bene-
fits ($99.75 billion) are still positive but smaller than the net benefits in the second column. This finding is
driven by expected higher fuel prices and lower saved social costs of local air pollutant emissions under
carbon pricing.
We do not present the net benefits results for the Electrifying All U.S. Fuels scenario, as many of
the emissions reductions occur far from the coast in the Pacific and Atlantic oceans, and we do not have a
sensible way to attribute these to areas in the United States.
Page 15
15
4.4.2 Spatial Heterogeneity in Reduced Social Costs of Emissions
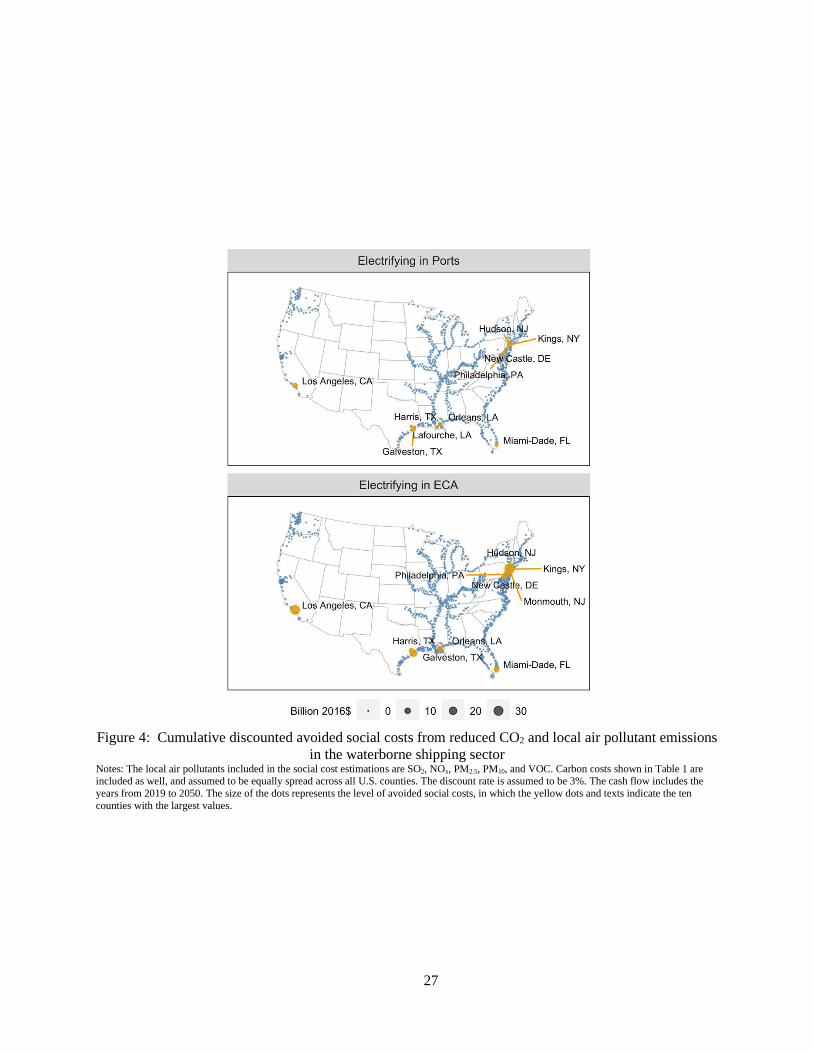
Figure 4 shows a map with the changes in cumulative avoided social costs from 2019 to 2050 in
the two electrification scenarios compared to the reference case. We see that the social benefits from elec-
trification are primarily clustered in the regions along the coast and inland rivers. The counties that benefit
most from waterborne shipping electrification concentrate on the Northeast Coast, Gulf of Mexico, and
West Coast. The magnitude of the net benefits depends on where the ships travel, the population of the
regions, and the fuels used to generate electricity in these regions (it is not simply a function of where the
ports are). Figure S13 in SI shows that including emissions from power plants does not alter the spatial
distribution of social benefits presented in Figure 4. It is out of the scope of this paper to present a detailed
cost-benefit analysis for individual ports, but our findings of the spatial effects can be used by for specific
ports which already have cost numbers in hand.
4.5 Sensitivity Analysis
We conduct a series of sensitivity analyses of our baseline results by varying the key assumptions:
(1) sensitivity to various electrification ramp-up periods, e.g., 2030 and 2035 (Figures S14 and S15 and
Table S4 in SI); (2) sensitivity to different assumptions about the value of SCC used in the cost-benefit
analysis (Table S5); (3) sensitivity to varying costs of electrification (Table S6); (4) sensitivity to the as-
sumption of cumulating avoided social costs in the U.S. county level (Figure S16); and (5) sensitivity to
the alternative assumption for estimating CO2 emissions (Figure S17). Our results show that the baseline
results are not very sensitive to these alternative assumptions.
5 Discussion
This paper explores waterborne shipping electrification and how it can interact with an evolving
electric grid and a carbon pricing policy. Our results show that electrification can bring about significant
net social benefits from curbing local air pollutant emissions and contribute to deeper decarbonization out
to 2050. Moreover, we show that electrification along with economywide carbon pricing is complementary,
Page 16
16
leading to greater CO2 emission reductions together than separately (although the opposite is the case for
local air pollutants).
Thare are several caveats worth mentioning. Yale-NEMS does not capture the latest International
Maritime Organization (IMO) rule 2020 that sets a 0.5% global sulfur cap for marine fuels (in non-ECA
regions) starting from January 1, 2020.5,79 Second, while we focus on electrifying vessels, other port activ-
ities can also be electrified.39,40 Third, our analysis scope is restricted to ports in the United States (i.e., the
fossil fuels and electricity consumption attributed to the U.S. energy system), so transfering our quantitative
results to other regions should be treated cautiously. Lastly, we focus on electrification policy and do not
compare this policy to other technologies or policies, e.g., scrubbers and mandating ultra-low sulfur fuels.80
Future work could explore optimal policy design among additional available options.
There are important challenges to waterborne electrification. This paper simulates the impact of a
hypothetical electrification policy in the United States. To fully implement the policy, the associated tech-
nological barriers and requirements must be addressed, such as proper voltage, grid security, and power
system reliability.17,81,82 Thus, significant policy efforts would likely be required to carry out the electrifi-
cation policy, such as California’s “Shore Power Regulation,” or a government subsidy program.83 As
deeper decarbonization of electricity becomes more likely, future work in this context can shed additional
light on how shipping electrification can be a critical puzzle piece in decarbonization efforts.
Acknowledgments
This publication was developed under Assistance Agreement No. RD835871 awarded by the U.S.
Environmental Protection Agency to Yale University. It has not been formally reviewed by EPA. The views
expressed in this document are solely those of the authors and do not necessarily reflect those of the Agency.
EPA does not endorse any products or commercial services mentioned in this publication. We thank Ben
Hobbs and Emily Fisher for assistance with the emissions factors used for local air pollutant emissions. We
also thank the anonymous referees for their constructive comments.
Page 17
17
Supporting Information
The Supporting Information is available free of charge on the XXXXXX at DOI: XXXXXXX.
Text, figures, and tables with detailed information on modeling methods, calculation of emissions
and costs, supplemental results, and sensitivity analyses
References
(1) Eyring, V.; Isaksen, I. S. A.; Berntsen, T.; Collins, W. J.; Corbett, J. J.; Endresen, O.; Grainger, R.
G.; Moldanova, J.; Schlager, H.; Stevenson, D. S. Transport Impacts on Atmosphere and Climate:
Shipping. Atmos. Environ. 2010, 44 (37), 4735–4771.
https://doi.org/10.1016/J.ATMOSENV.2009.04.059.
(2) Viana, M.; Hammingh, P.; Colette, A.; Querol, X.; Degraeuwe, B.; Vlieger, I. de; van Aardenne, J.
Impact of Maritime Transport Emissions on Coastal Air Quality in Europe. Atmos. Environ. 2014,
90, 96–105. https://doi.org/10.1016/J.ATMOSENV.2014.03.046.
(3) Fu, M.; Liu, H.; Jin, X.; He, K. National- to Port-Level Inventories of Shipping Emissions in China.
Environ. Res. Lett. 2017, 12. https://doi.org/https://doi.org/10.1088/1748-9326/aa897a.
(4) Wan, Z.; Zhu, M.; Chen, S.; Sperling, D. Pollution: Three Steps to a Green Shipping Industry.
Nature 2016, 530 (7590), 275–277. https://doi.org/10.1038/530275a.
(5) Sofiev, M.; Winebrake, J. J.; Johansson, L.; Carr, E. W.; Prank, M.; Soares, J.; Vira, J.; Kouznetsov,
R.; Jalkanen, J.-P.; Corbett, J. J. Cleaner Fuels for Ships Provide Public Health Benefits with Climate
Tradeoffs. Nat. Commun. 2018, 9 (1), 406. https://doi.org/10.1038/s41467-017-02774-9.
(6) Ring, A. M.; Canty, T. P.; Anderson, D. C.; Vinciguerra, T. P.; He, H.; Goldberg, D. L.; Ehrman, S.
H.; Dickerson, R. R.; Salawitch, R. J. Evaluating Commercial Marine Emissions and Their Role in
Air Quality Policy Using Observations and the CMAQ Model. Atmos. Environ. 2018, 173, 96–107.
https://doi.org/10.1016/J.ATMOSENV.2017.10.037.
(7) Corbett, J. J.; Winebrake, J. J.; Green, E. H.; Kasibhatla, P.; Eyring, V.; Lauer, A. Mortality from
Ship Emissions: A Global Assessment. Environ. Sci. Technol. 2007, 41 (24), 8512–8518.
https://doi.org/10.1021/es071686z.
(8) EPA. Third Report to Congress: Highlights from the Diesel Emissions Reduction Program;
Washington, DC, 2016.
(9) EPA. National Port Strategy Assessment: Reducing Air Pollution and Greenhouse Gses at U.S.
Ports; Washington, DC, 2016.
(10) ENVIRON. Cold Ironing Cost Effectiveness Study; Los Angeles, CA, 2004.
(11) EPA. Shore Power Technology Assessment at U.S. Ports; Washington, DC, 2017.
(12) Fernández Astudillo, M.; Vaillancourt, K.; Pineau, P. O.; Amor, B. Human Health and Ecosystem
Impacts of Deep Decarbonization of the Energy System. Environ. Sci. Technol. 2019, 53, 14054–
14062. https://doi.org/10.1021/acs.est.9b04923.
(13) EIA. The National Energy Modeling System: An Overview 2009; Washington, DC, 2009.
(14) Winebrake, J. J.; Sakva, D. An Evaluation of Errors in US Energy Forecasts: 1982–2003. Energy
Policy 2006, 34 (18), 3475–3483. https://doi.org/10.1016/J.ENPOL.2005.07.018.
Page 18
18
(15) California Air Resources Board. Shore Power for Ocean-Going Vessels
https://ww3.arb.ca.gov/ports/shorepower/shorepower.htm (accessed Apr 24, 2020).
(16) Acciaro, M.; Vanelslander, T.; Sys, C.; Ferrari, C.; Roumboutsos, A.; Giuliano, G.; Lam, J. S. L.;
Kapros, S. Environmental Sustainability in Seaports: A Framework for Successful Innovation. Marit.
Policy Manag. 2014, 41 (5), 480–500. https://doi.org/10.1080/03088839.2014.932926.
(17) Iris, Ç.; Lam, J. S. L. A Review of Energy Efficiency in Ports: Operational Strategies, Technologies
and Energy Management Systems. Renew. Sustain. Energy Rev. 2019, 112, 170–182.
https://doi.org/10.1016/j.rser.2019.04.069.
(18) Bouman, E. A.; Lindstad, E.; Rialland, A. I.; Strømman, A. H. State-of-the-Art Technologies,
Measures, and Potential for Reducing GHG Emissions from Shipping – A Review. Transp. Res.
Part D Transp. Environ. 2017, 52, 408–421. https://doi.org/10.1016/j.trd.2017.03.022.
(19) Du, Y.; Chen, Q.; Quan, X.; Long, L.; Fung, R. Y. K. Berth Allocation Considering Fuel
Consumption and Vessel Emissions. Transp. Res. Part E Logist. Transp. Rev. 2011, 47 (6), 1021–
1037. https://doi.org/10.1016/j.tre.2011.05.011.
(20) Venturini, G.; Iris, Ç.; Kontovas, C. A.; Larsen, A. The Multi-Port Berth Allocation Problem with
Speed Optimization and Emission Considerations. Transp. Res. Part D Transp. Environ. 2017, 54,
142–159. https://doi.org/10.1016/j.trd.2017.05.002.
(21) Iris, Ç.; Pacino, D.; Ropke, S.; Larsen, A. Integrated Berth Allocation and Quay Crane Assignment
Problem: Set Partitioning Models and Computational Results. Transp. Res. Part E Logist. Transp.
Rev. 2015, 81, 75–97. https://doi.org/10.1016/j.tre.2015.06.008.
(22) Davarzani, H.; Fahimnia, B.; Bell, M.; Sarkis, J. Greening Ports and Maritime Logistics: A Review.
Transp. Res. Part D Transp. Environ. 2016, 48, 473–487. https://doi.org/10.1016/j.trd.2015.07.007.
(23) Johnson, H.; Styhre, L. Increased Energy Efficiency in Short Sea Shipping through Decreased Time
in Port. Transp. Res. Part A Policy Pract. 2015, 71, 167–178.
https://doi.org/10.1016/j.tra.2014.11.008.
(24) Buhrkal, K.; Zuglian, S.; Ropke, S.; Larsen, J.; Lusby, R. Models for the Discrete Berth Allocation
Problem: A Computational Comparison. Transp. Res. Part E Logist. Transp. Rev. 2011, 47 (4), 461–
473. https://doi.org/10.1016/j.tre.2010.11.016.
(25) Zis, T.; North, R. J.; Angeloudis, P.; Ochieng, W. Y.; Bell, M. G. H. Evaluation of Cold Ironing and
Speed Reduction Policies to Reduce Ship Emissions near and at Ports. Marit. Econ. Logist. 2014,
16 (4), 371–398. https://doi.org/10.1057/mel.2014.6.
(26) Antonelli, M.; Ceraolo, M.; Desideri, U.; Lutzemberger, G.; Sani, L. Hybridization of Rubber Tired
Gantry (RTG) Cranes. J. Energy Storage 2017, 12, 186–195.
https://doi.org/10.1016/j.est.2017.05.004.
(27) Bolonne, S. R. A.; Chandima, D. P. Sizing an Energy System for Hybrid Li-Ion Battery-
Supercapacitor RTG Cranes Based on State Machine Energy Controller. IEEE Access 2019, 7,
71209–71220. https://doi.org/10.1109/ACCESS.2019.2919345.
(28) Bengtsson, S.; Andersson, K.; Fridell, E. A Comparative Life Cycle Assessment of Marine Fuels:
Liquefied Natural Gas and Three Other Fossil Fuels. Proc. Inst. Mech. Eng. Part M J. Eng. Marit.
Environ. 2011, 225 (2), 97–110. https://doi.org/10.1177/1475090211402136.
(29) Geerlings, H.; Van Duin, R. A New Method for Assessing CO2-Emissions from Container
Terminals: A Promising Approach Applied in Rotterdam. J. Clean. Prod. 2011, 19 (6–7), 657–666.
https://doi.org/10.1016/j.jclepro.2010.10.012.
(30) Acciaro, M.; Ghiara, H.; Cusano, M. I. Energy Management in Seaports: A New Role for Port
Page 19
19
Authorities. Energy Policy 2014, 71, 4–12. https://doi.org/10.1016/j.enpol.2014.04.013.
(31) Boile, M.; Theofanis, S.; Sdoukopoulos, E.; Plytas, N. Developing a Port Energy Management Plan:
Issues, Challenges, and Prospects. Transp. Res. Rec. 2016, 2549, 19–28.
https://doi.org/10.3141/2549-03.
(32) Sciberras, E. A.; Zahawi, B.; Atkinson, D. J. Electrical Characteristics of Cold Ironing Energy
Supply for Berthed Ships. Transp. Res. Part D Transp. Environ. 2015, 39, 31–43.
https://doi.org/10.1016/j.trd.2015.05.007.
(33) Hall, W. J. Assessment of CO2 and Priority Pollutant Reduction by Installation of Shoreside Power.
Resour. Conserv. Recycl. 2010, 54 (7), 462–467. https://doi.org/10.1016/j.resconrec.2009.10.002.
(34) Ballini, F.; Bozzo, R. Air Pollution from Ships in Ports: The Socio-Economic Benefit of Cold-
Ironing Technology. Res. Transp. Bus. Manag. 2015, 17, 92–98.
https://doi.org/10.1016/J.RTBM.2015.10.007.
(35) Chang, C. C.; Wang, C. M. Evaluating the Effects of Green Port Policy: Case Study of Kaohsiung
Harbor in Taiwan. Transp. Res. Part D Transp. Environ. 2012, 17 (3), 185–189.
https://doi.org/10.1016/j.trd.2011.11.006.
(36) Tsekouras, G. J.; Kanellos, F. D. Ship to Shore Connection - Reliability Analysis of Ship Power
System. In Proceedings - 2016 22nd International Conference on Electrical Machines, ICEM 2016;
Institute of Electrical and Electronics Engineers Inc., 2016; pp 2955–2961.
https://doi.org/10.1109/ICELMACH.2016.7732944.
(37) Yiğit, K.; Kökkülünk, G.; Parlak, A.; Karakaş, A. Energy Cost Assessment of Shoreside Power
Supply Considering the Smart Grid Concept: A Case Study for a Bulk Carrier Ship. Marit. Policy
Manag. 2016, 43 (4), 469–482. https://doi.org/10.1080/03088839.2015.1129674.
(38) Coppola, T.; Fantauzzi, M.; Miranda, S.; Quaranta, F. Cost/Benefit Analysis of Alternative Systems
for Feeding Electric Energy to Ships in Port from Ashore. In AEIT 2016 - International Annual
Conference: Sustainable Development in the Mediterranean Area, Energy and ICT Networks of the
Future; Institute of Electrical and Electronics Engineers Inc., 2016.
https://doi.org/10.23919/AEIT.2016.7892782.
(39) Schmidt, J.; Meyer-Barlag, C.; Eisel, M.; Kolbe, L. M.; Appelrath, H. J. Using Battery-Electric
AGVs in Container Terminals - Assessing the Potential and Optimizing the Economic Viability.
Res. Transp. Bus. Manag. 2015, 17, 99–111. https://doi.org/10.1016/j.rtbm.2015.09.002.
(40) Yang, Y. C.; Chang, W. M. Impacts of Electric Rubber-Tired Gantries on Green Port Performance.
Res. Transp. Bus. Manag. 2013, 8, 67–76. https://doi.org/10.1016/j.rtbm.2013.04.002.
(41) Yang, Y. C.; Lin, C. L. Performance Analysis of Cargo-Handling Equipment from a Green
Container Terminal Perspective. Transp. Res. Part D Transp. Environ. 2013, 23, 9–11.
https://doi.org/10.1016/j.trd.2013.03.009.
(42) van Duin, J. H. R.; Geerlings, H.; Verbraeck, A.; Nafde, T. Cooling down: A Simulation Approach
to Reduce Energy Peaks of Reefers at Terminals. J. Clean. Prod. 2018, 193, 72–86.
https://doi.org/10.1016/j.jclepro.2018.04.258.
(43) Vaishnav, P.; Fischbeck, P. S.; Morgan, M. G.; Corbett, J. J. Shore Power for Vessels Calling at
U.S. Ports: Benefits and Costs. Environ. Sci. Technol. 2016, 50 (3), 1102–1110.
https://doi.org/10.1021/acs.est.5b04860.
(44) Gillingham, K.; Huang, P. Is Abundant Natural Gas a Bridge to a Low-Carbon Future or a Dead-
End? Energy J. 2019, 40 (2), 1–26. https://doi.org/10.5547/01956574.40.2.kgil.
(45) Brown, S. P. A.; Gabriel, S. A.; Egging, R. Abundant Shale Gas Resources: Some Implications for
Page 20
20
Energy Policy; Washington, DC, 2010.
(46) Brown, S. P. A.; Krupnick, A. J. Abundant Shale Gas Resources: Long-Term Implications for U.S.
Natural Gas Markets; RFF-DP-10-41; Washington, DC, 2010.
(47) Brown, S. P. A.; Krupnick, A. J.; Walls, M. A. Natural Gas: A Bridge to a Low‐Carbon Future?;
RFF-IB-09-11; Washington, DC, 2009.
(48) Nogee, A.; Deyette, J.; Clemmer, S. The Projected Impacts of a National Renewable Portfolio
Standard. Electr. J. 2007, 20 (4), 33–47. https://doi.org/10.1016/J.TEJ.2007.04.001.
(49) Fischer, C. Renewable Portfolio Standards: When Do They Lower Energy Prices? Energy J. 2010,
31 (1), 101–120. https://doi.org/10.5547/ISSN0195-6574-EJ-Vol31-No1-5.
(50) Palmer, K. L.; Sweeney, R.; Allaire, M. Modeling Policies to Promote Renewable and Low-Carbon
Sources of Electricity; Washington, DC, 2010.
(51) Bernow, S.; Dougherty, W.; Duckworth, M. Quantifying the Impacts of a National, Tradable
Renewables Portfolio Standard. Electr. J. 1997, 10 (4), 42–52. https://doi.org/10.1016/s1040-
6190(97)80558-1.
(52) Goulder, L. H. Using Cap and Trade to Reduce Greenhouse Gas Emissions; Washington, DC, 2010.
(53) Brown, M. A.; Li, Y. Carbon Pricing and Energy Efficiency: Pathways to Deep Decarbonization of
the US Electric Sector. Energy Effic. 2019, 12 (2), 463–481. https://doi.org/10.1007/s12053-018-
9686-9.
(54) Brown, M. A.; Kim, G.; Smith, A. M.; Southworth, K. Exploring the Impact of Energy Efficiency
as a Carbon Mitigation Strategy in the U.S. Energy Policy 2017, 109, 249–259.
https://doi.org/10.1016/j.enpol.2017.06.044.
(55) Wang, Y.; Brown, M. A. Policy Drivers for Improving Electricity End-Use Efficiency in the USA:
An Economic-Engineering Analysis. Energy Effic. 2014, 7 (3), 517–546.
https://doi.org/10.1007/s12053-013-9237-3.
(56) Cox, M.; Brown, M. A.; Sun, X. Energy Benchmarking of Commercial Buildings: A Low-Cost
Pathway toward Urban Sustainability. Environ. Res. Lett. 2013, 8 (3), 035018.
https://doi.org/10.1088/1748-9326/8/3/035018.
(57) Auffhammer, M.; Sanstad, A. H. Energy Efficiency in the Residential and Commercial Sectors;
Resources for the Future, 2011.
(58) Wilkerson, J. T.; Cullenward, D.; Davidian, D.; Weyant, J. P. End Use Technology Choice in the
National Energy Modeling System (NEMS): An Analysis of the Residential and Commercial
Building Sectors. Energy Econ. 2013, 40, 773–784. https://doi.org/10.1016/J.ENECO.2013.09.023.
(59) Bordoff, J.; Houser, T. American Gas to the Rescue?: The Impact of US LNG Exports on European
Security and Russian Foreign Policy; New York, NY, 2014.
(60) Kontovas, C. A.; Psaraftis, H. N. Transportation Emissions: Some Basics. In Green Transportation
Logistics: The Quest for Win-Win Solutions; Springer International Publishing, 2016; pp 41–79.
https://doi.org/10.1007/978-3-319-17175-3_2.
(61) Pfenninger, S.; Hawkes, A.; Keirstead, J. Energy Systems Modeling for Twenty-First Century
Energy Challenges. Renewable and Sustainable Energy Reviews. Pergamon May 1, 2014, pp 74–
86. https://doi.org/10.1016/j.rser.2014.02.003.
(62) Ringkjøb, H. K.; Haugan, P. M.; Solbrekke, I. M. A Review of Modelling Tools for Energy and
Electricity Systems with Large Shares of Variable Renewables. Renewable and Sustainable Energy
Reviews. Elsevier Ltd November 1, 2018, pp 440–459. https://doi.org/10.1016/j.rser.2018.08.002.
Page 21
21
(63) Kotzur, L.; Markewitz, P.; Robinius, M.; Stolten, D. Impact of Different Time Series Aggregation
Methods on Optimal Energy System Design. Renew. Energy 2018, 117, 474–487.
https://doi.org/10.1016/j.renene.2017.10.017.
(64) EPA. Overview of the Clean Power Plan: Cutting Carbon Pollution from Power Plants; Washington,
DC, 2015.
(65) Keyes, A. T.; Lambert, K. F.; Burtraw, D.; Buonocore, J. J.; Levy, J. I.; Driscoll, C. T. The
Affordable Clean Energy Rule and the Impact of Emissions Rebound on Carbon Dioxide and
Criteria Air Pollutant Emissions. Environ. Res. Lett. 2019, 14 (4), 044018.
https://doi.org/10.1088/1748-9326/aafe25.
(66) SAFETY4SEA. Port of San Diego celebrates shore power installation https://safety4sea.com/port-
of-san-diego-celebrates-shore-power-installation-2/ (accessed Nov 27, 2019).
(67) Port of San Francisco. Mayor and Port of SF inaugurate Cruise Ship using Shoreside Power
https://sfport.com/article/mayor-and-port-sf-inaugurate-cruise-ship-using-shoreside-power
(accessed Nov 27, 2019).
(68) Carr, E. W.; Corbett, J. J. Ship Compliance in Emission Control Areas: Technology Costs and Policy
Instruments. Environ. Sci. Technol. 2015, 49 (16), 9584–9591.
https://doi.org/10.1021/acs.est.5b02151.
(69) Ports of Auckland. Ports of Auckland buys world first electric tug
http://www.poal.co.nz/media/ports-of-auckland-buys-world-first-electric-tug (accessed Nov 27,
2019).
(70) Filks, I. Batteries included: Sweden’s emissions-free ferries lead the charge
https://www.reuters.com/article/us-denmark-battery-ferry/batteries-included-swedens-emissions-
free-ferries-lead-the-charge-idUSKCN1QV1W7 (accessed Nov 27, 2019).
(71) Wang, T.; Wang, X.; Meng, Q. Joint Berth Allocation and Quay Crane Assignment under Different
Carbon Taxation Policies. Transp. Res. Part B Methodol. 2018, 117, 18–36.
https://doi.org/10.1016/j.trb.2018.08.012.
(72) Flues, F.; Lutz, B. J. The Effect of Electricity Taxation on the German Manufacturing Sector: A
Regression Discontinuity Approach; ZEW Discussion Paper; 15–013; 2015.
(73) IWG. Technical Support Document: Technical Update of the Social Cost of Carbon for Regulatory
Impact Analysis Under Executive Order 12866; Washington, DC, 2016.
(74) EPA. Regulatory Impact Analysis for the Review of the Clean Power Plan: Proposal; Washington,
DC, 2017.
(75) Dietz, S.; Bowen, A.; Doda, B.; Gambhir, A.; Warren, R. The Economics of 1.5°C Climate Change.
Annu. Rev. Environ. Resour. 2018, 43 (1), 455–480. https://doi.org/10.1146/annurev-environ-
102017-025817.
(76) Muller, N. Z.; Mendelsohn, R.; Nordhaus, W. Environmental Accounting for Pollution in the United
States Economy. Am. Econ. Rev. 2011, 101 (5), 1649–1675. https://doi.org/10.1257/aer.101.5.1649.
(77) Dimanchev, E. G.; Paltsev, S.; Yuan, M.; Rothenberg, D.; Tessum, C. W.; Marshall, J. D.; Selin, N.
E. Health Co-Benefits of Sub-National Renewable Energy Policy in the US. Environ. Res. Lett. 2019,
14 (8). https://doi.org/10.1088/1748-9326/ab31d9.
(78) Port Compliance. U.S. Public Port Overview https://www.portcompliance.org/portassociations.php
(accessed Nov 27, 2019).
(79) International Maritime Organization. Sulphur 2020 – cutting sulphur oxide emissions
Page 22
22
http://www.imo.org/en/MediaCentre/HotTopics/Pages/Sulphur-2020.aspx (accessed Apr 24, 2020).
(80) Laursen, W. Is Cold Ironing Redundant Now? https://www.maritime-executive.com/features/is-
cold-ironing-redundant-now (accessed Apr 24, 2020).
(81) Tseng, P. H.; Pilcher, N. A Study of the Potential of Shore Power for the Port of Kaohsiung, Taiwan:
To Introduce or Not to Introduce? Res. Transp. Bus. Manag. 2015, 17, 83–91.
https://doi.org/10.1016/j.rtbm.2015.09.001.
(82) Khersonsky, Y.; Islam, M.; Peterson, K. Challenges of Connecting Shipboard Marine Systems to
Medium Voltage Shoreside Electrical Power. IEEE Trans. Ind. Appl. 2007, 43 (3), 838–844.
https://doi.org/10.1109/TIA.2007.895810.
(83) Wu, L.; Wang, S. The Shore Power Deployment Problem for Maritime Transportation. Transp. Res.
Part E Logist. Transp. Rev. 2020, 135, 101883. https://doi.org/10.1016/j.tre.2020.101883.
Page 23
23
Table 1: Cumulative net present values of the effect of waterborn shipping electrification. All values are
in billion 2016 US$ Electrifying in Ports vs
Reference
Electrifying in ECA vs
Reference
Electrifying in ECA & Carbon
Pricing vs Carbon Pricing
Fuel Costs -53.76 -137.56 -144.84
Port Retrofit Costs -10.21 -10.21 -10.21
Vessel Retrofit Costs -2.52 -2.52 -2.52
Social Costs of Carbon 2.56 13.24 22.43
Social Costs of Local Air Pollutants 61.89 252.02 248.18
Tugboat Costs 0.00 -13.29 -13.29
Total -2.04 101.67 99.75 Notes: The discount rate is assumed to be 3%. The cash flow includes the years from 2019 to 2050. The carbon tax revenues from the whole economy are not reported. The fuel costs are the product of retail prices and quantities for four fuels, including distillate oil, residual oil, natural
gas, and electricity. These results are based on only the shipping and electric sectors; however, inclusion of the other sectors does not appear to
change these results in any notable way.
Page 24
24
Figure 1: Energy consumption by waterborne shipping in the United States Notes: The carbon price in the carbon pricing scenarios begins in 2020 at approximately $2 per metric ton of CO2 emissions in 2016 U.S. dollars
and increases linearly to $46 per metric ton of CO2 in 2040. The carbon price remains constant after that. The vertical dotted line separates histor-ical and projected data.
Page 25
25
Figure 2: Energy-related carbon dioxide emissions for the entire energy system in the United States Notes: The CO2 emission levels are shown in the left panel. The differences in emissions shown in the right panel represent the comparisons of
electrification scenarios (with carbon pricing) relative to the reference (with carbon pricing). The carbon price in the carbon pricing scenarios
begins in 2020 at approximately $2 per metric ton of CO2 emissions in 2016 U.S. dollars and increases linearly to $46 per metric ton of CO2 in 2040. The carbon price remains constant after that. The vertical dotted line separates historical and projected data.
Page 26
26
Figure 3: Energy-related local air pollutant emissions for the waterborne shipping and power sectors in
the United States Notes: The emissions are from fossil fuel combustions in the waterborne shipping sector (distillate oil, residual oil, and natural gas) and the power
sector (coal, oil, and natural gas). Other sources of local air pollutant emissions are not counted. The carbon price begins in 2020 at approxi-
mately $2 per metric ton CO2 in 2016 U.S. dollars and increases linearly to $46 per metric ton CO2 in 2040. The carbon price remains constant
after that. The vertical dotted line separates historical and projected data.
Page 27
27
Figure 4: Cumulative discounted avoided social costs from reduced CO2 and local air pollutant emissions
in the waterborne shipping sector Notes: The local air pollutants included in the social cost estimations are SO2, NOx, PM2.5, PM10, and VOC. Carbon costs shown in Table 1 are
included as well, and assumed to be equally spread across all U.S. counties. The discount rate is assumed to be 3%. The cash flow includes the
years from 2019 to 2050. The size of the dots represents the level of avoided social costs, in which the yellow dots and texts indicate the ten
counties with the largest values.