21
© Yann Arthus-Bertrand / Altitude The main findings of the IPCC 5 th assessment report Axel Timmermann Lead Author, AR5, Chapter 5
© Yann Arthus-Bertrand / Altitude
The main findings of the IPCC 5th assessment report
Axel Timmermann Lead Author, AR5, Chapter 5
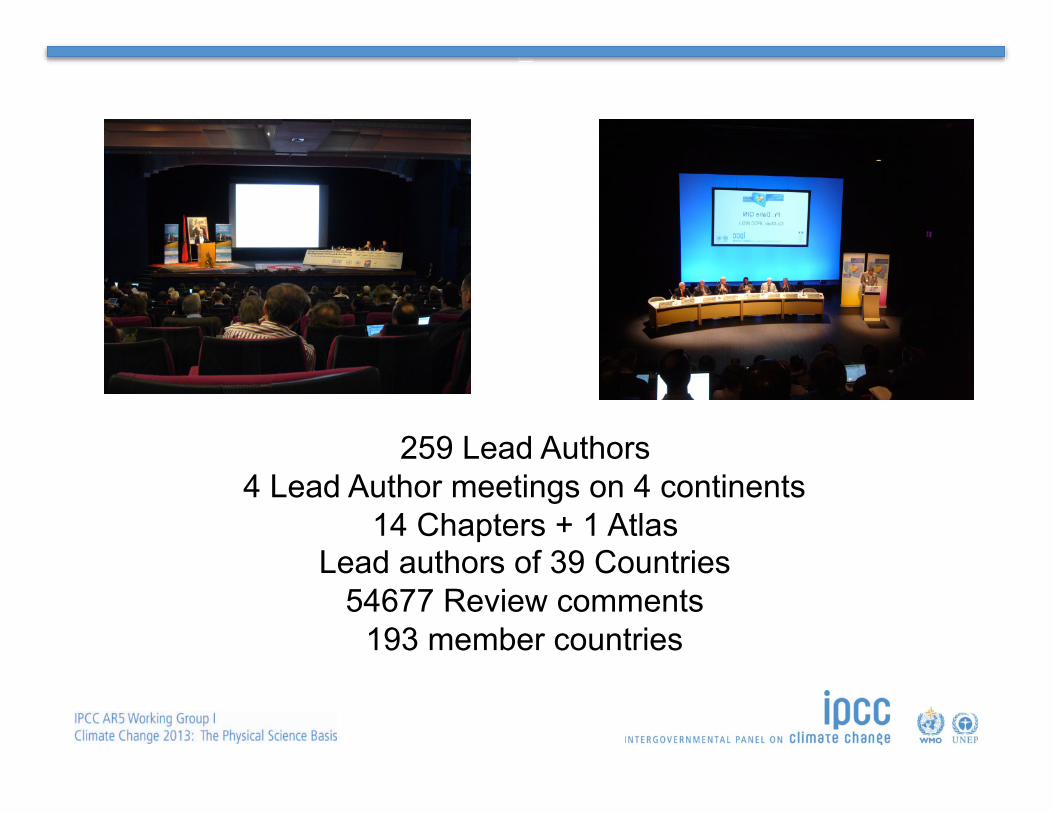
259 Lead Authors 4 Lead Author meetings on 4 continents
14 Chapters + 1 Atlas Lead authors of 39 Countries
54677 Review comments 193 member countries
What is the objective of the report? The objective of the contribution of IPCC Working Group I to the AR5 “Climate Change 2013: The Physical Science Basis” (WGI AR5) is to provide a comprehensive and robust assessment of the physical science basis of climate change. In order to achieve this, the report has 14 topical chapters and a number of Annexes including, for the first time in IPCC, a comprehensive Atlas of Global and Regional Climate Projections, plus supplementary material.
Do IPCC reports offer policy solutions to governments?
IPCC reports are policy-relevant but not policy-prescriptive. It is the role of the IPCC to provide governments with a comprehensive assessment of the most up-to-date scientific technical, and socio- economic knowledge on issues related to climate change. Climate change projections assessed are based on a range of specific scenarios. From this assessment, policymakers obtain information on potential consequences from climate change depending on the scenario.
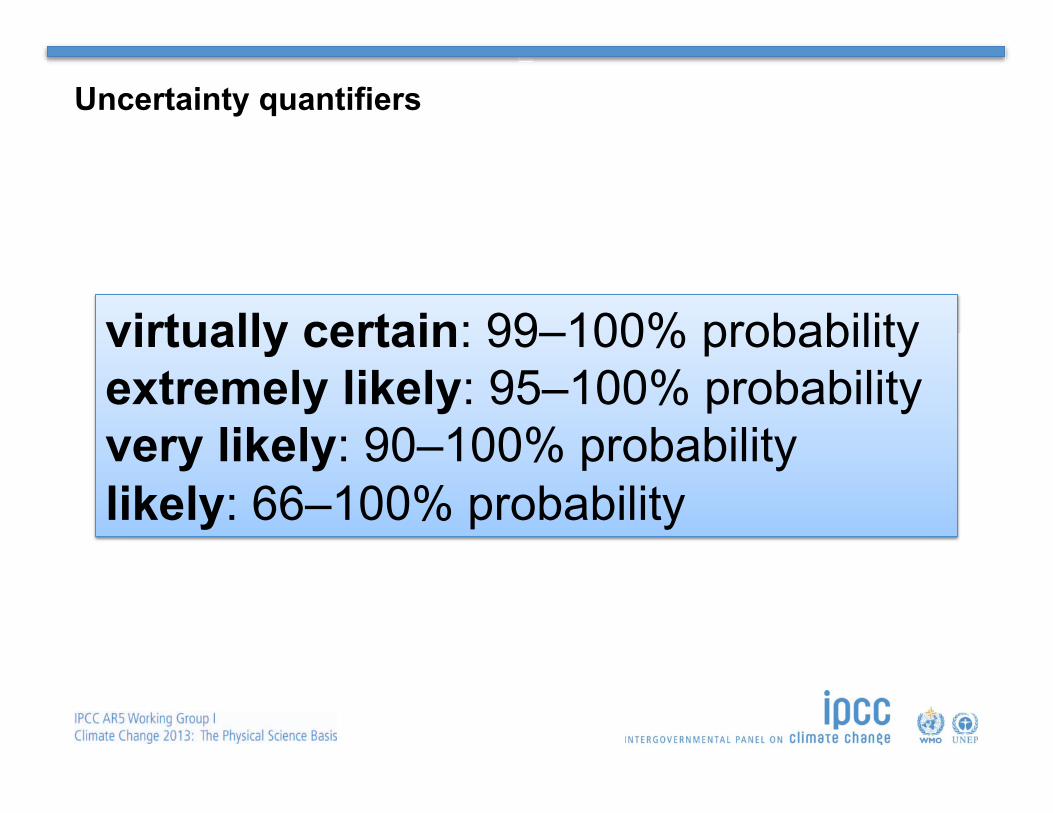
Uncertainty quantifiers
virtually certain: 99–100% probability extremely likely: 95–100% probability very likely: 90–100% probability likely: 66–100% probability
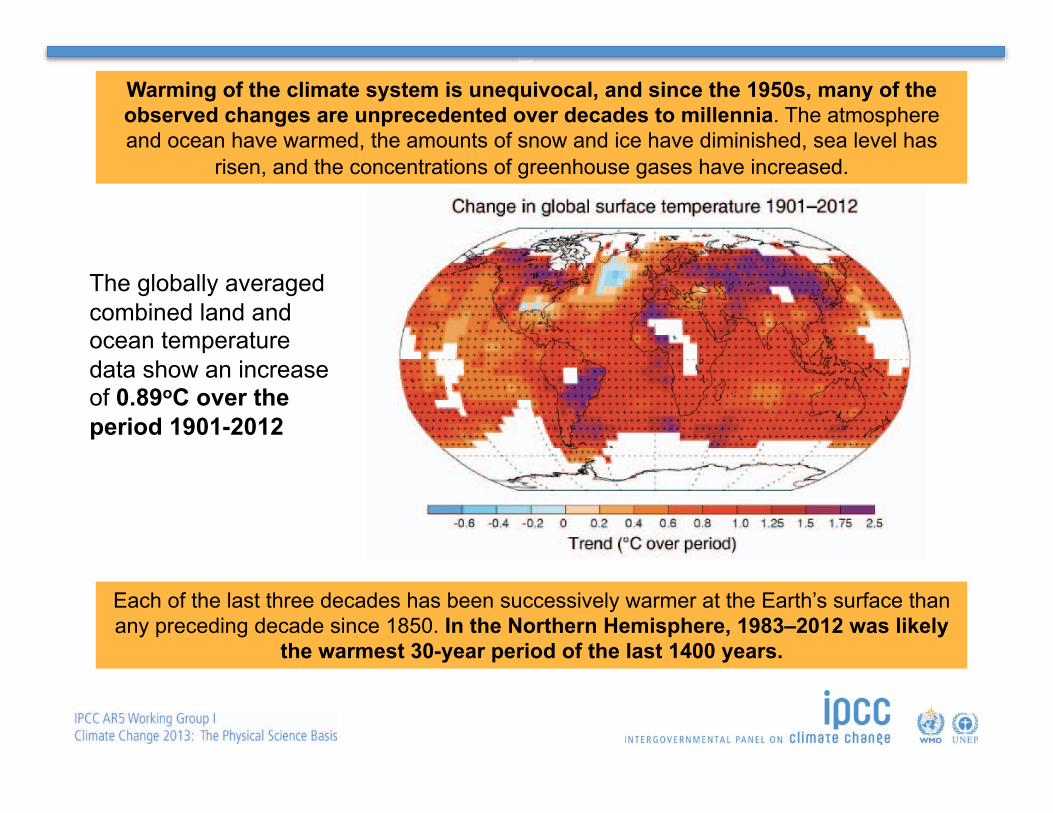
Warming of the climate system is unequivocal, and since the 1950s, many of the observed changes are unprecedented over decades to millennia. The atmosphere and ocean have warmed, the amounts of snow and ice have diminished, sea level has
risen, and the concentrations of greenhouse gases have increased.
Each of the last three decades has been successively warmer at the Earth’s surface than any preceding decade since 1850. In the Northern Hemisphere, 1983–2012 was likely
the warmest 30-year period of the last 1400 years.
The globally averaged combined land and ocean temperature data show an increase of 0.89oC over the period 1901-2012
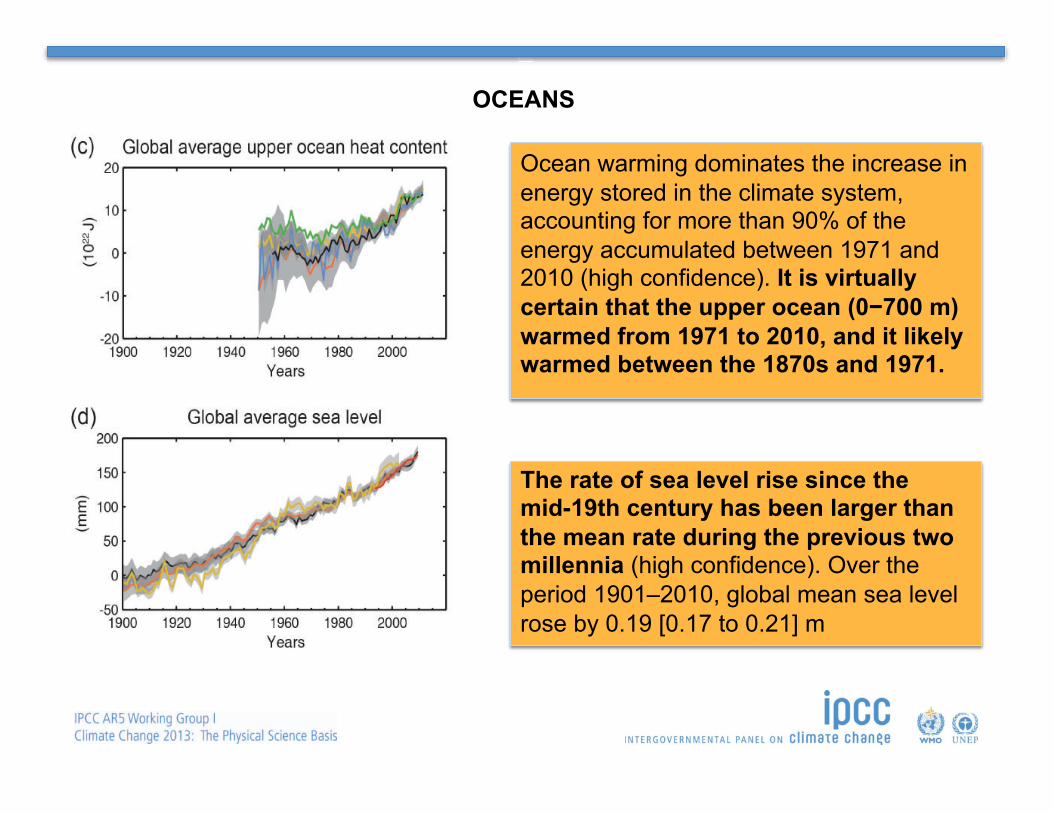
Ocean warming dominates the increase in energy stored in the climate system, accounting for more than 90% of the energy accumulated between 1971 and 2010 (high confidence). It is virtually certain that the upper ocean (0−700 m) warmed from 1971 to 2010, and it likely warmed between the 1870s and 1971.
The rate of sea level rise since the mid-19th century has been larger than the mean rate during the previous two millennia (high confidence). Over the period 1901–2010, global mean sea level rose by 0.19 [0.17 to 0.21] m
OCEANS
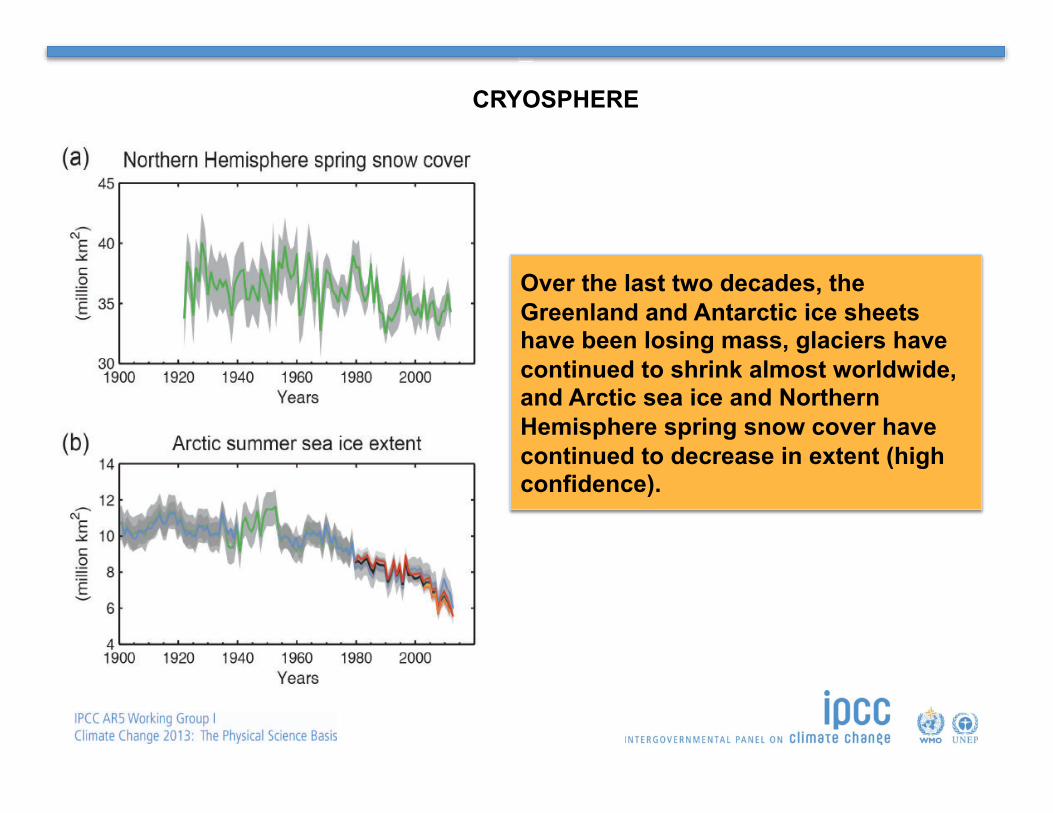
Over the last two decades, the Greenland and Antarctic ice sheets have been losing mass, glaciers have continued to shrink almost worldwide, and Arctic sea ice and Northern Hemisphere spring snow cover have continued to decrease in extent (high confidence).
CRYOSPHERE
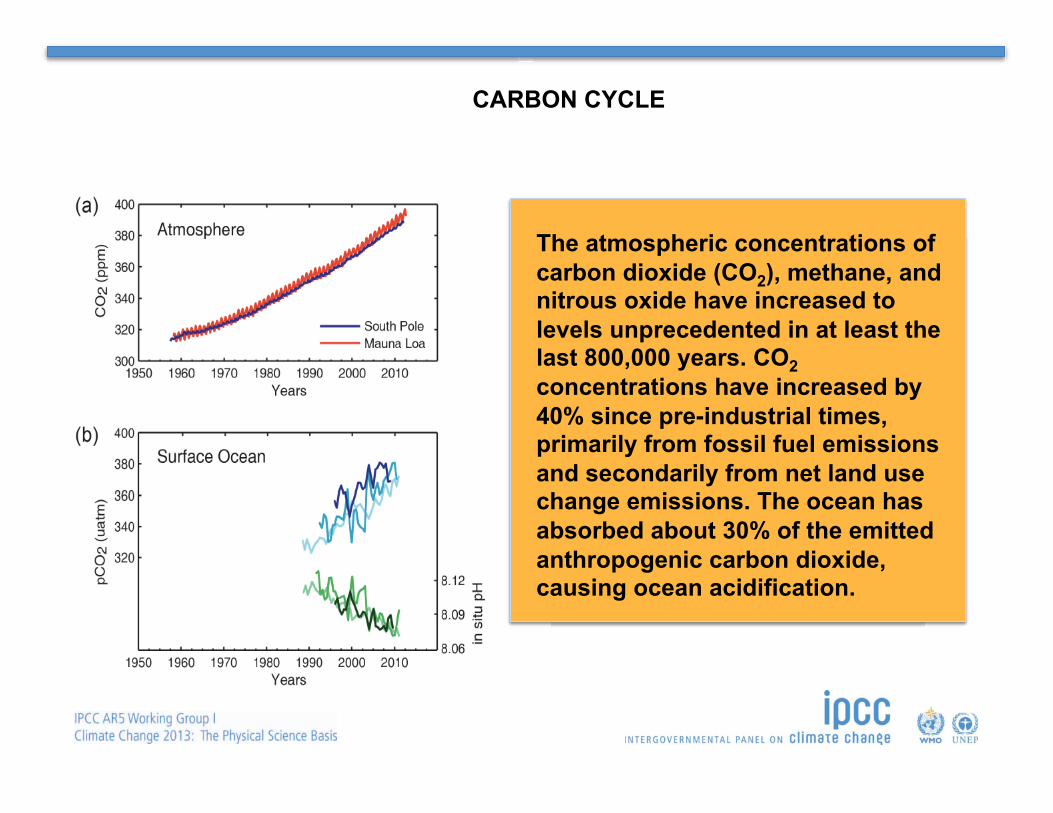
CARBON CYCLE
The atmospheric concentrations of carbon dioxide (CO2), methane, and nitrous oxide have increased to levels unprecedented in at least the last 800,000 years. CO2 concentrations have increased by 40% since pre-industrial times, primarily from fossil fuel emissions and secondarily from net land use change emissions. The ocean has absorbed about 30% of the emitted anthropogenic carbon dioxide, causing ocean acidification.
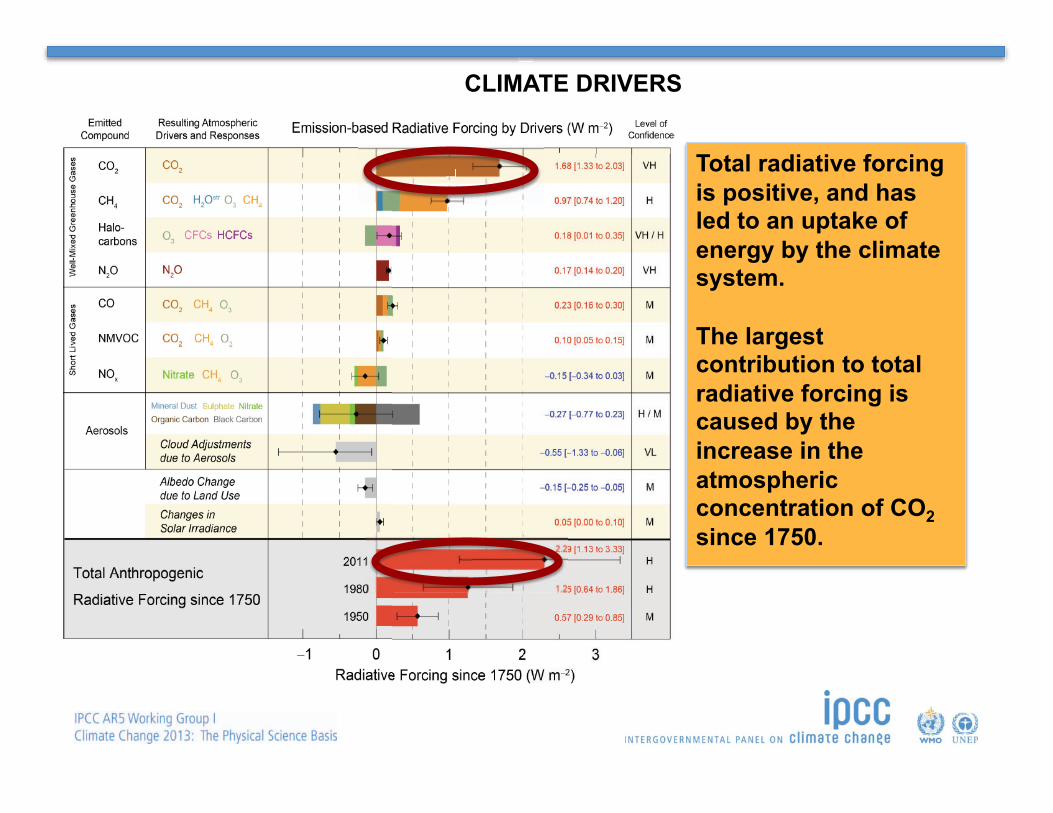
Total radiative forcing is positive, and has led to an uptake of energy by the climate system.
The largest contribution to total radiative forcing is caused by the increase in the atmospheric concentration of CO2 since 1750.
CLIMATE DRIVERS
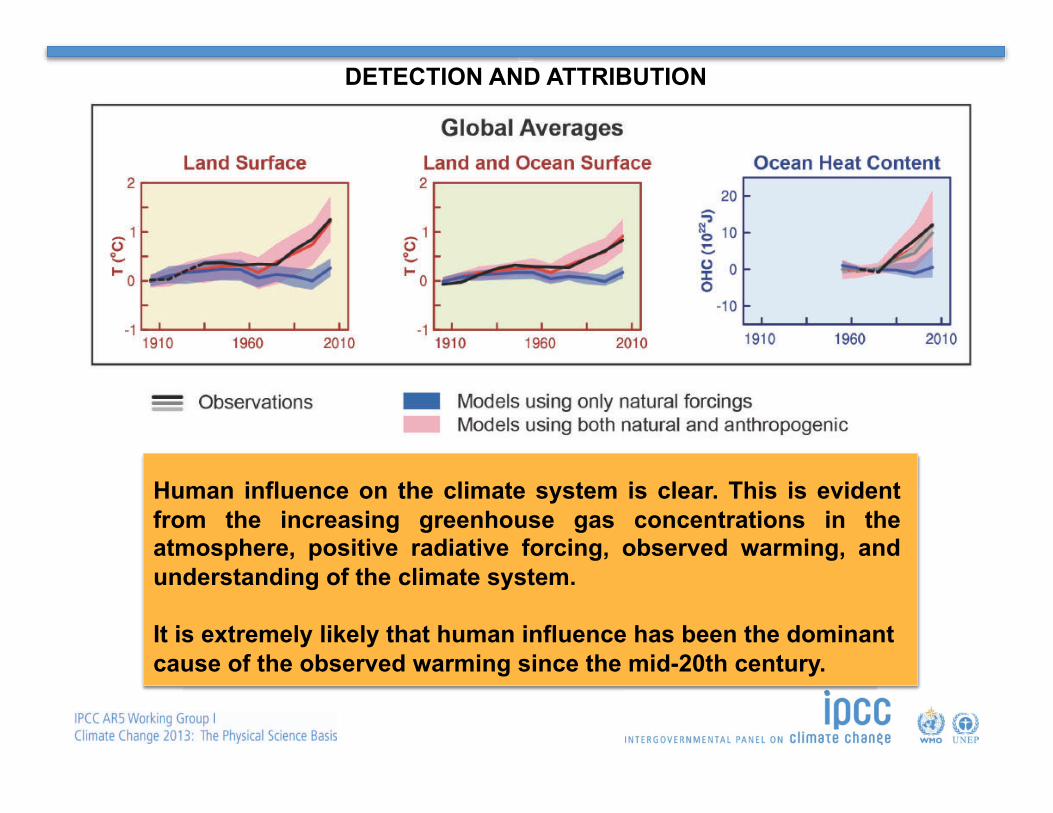
Human influence on the climate system is clear. This is evident from the increasing greenhouse gas concentrations in the atmosphere, positive radiative forcing, observed warming, and understanding of the climate system.
It is extremely likely that human influence has been the dominant cause of the observed warming since the mid-20th century.
DETECTION AND ATTRIBUTION
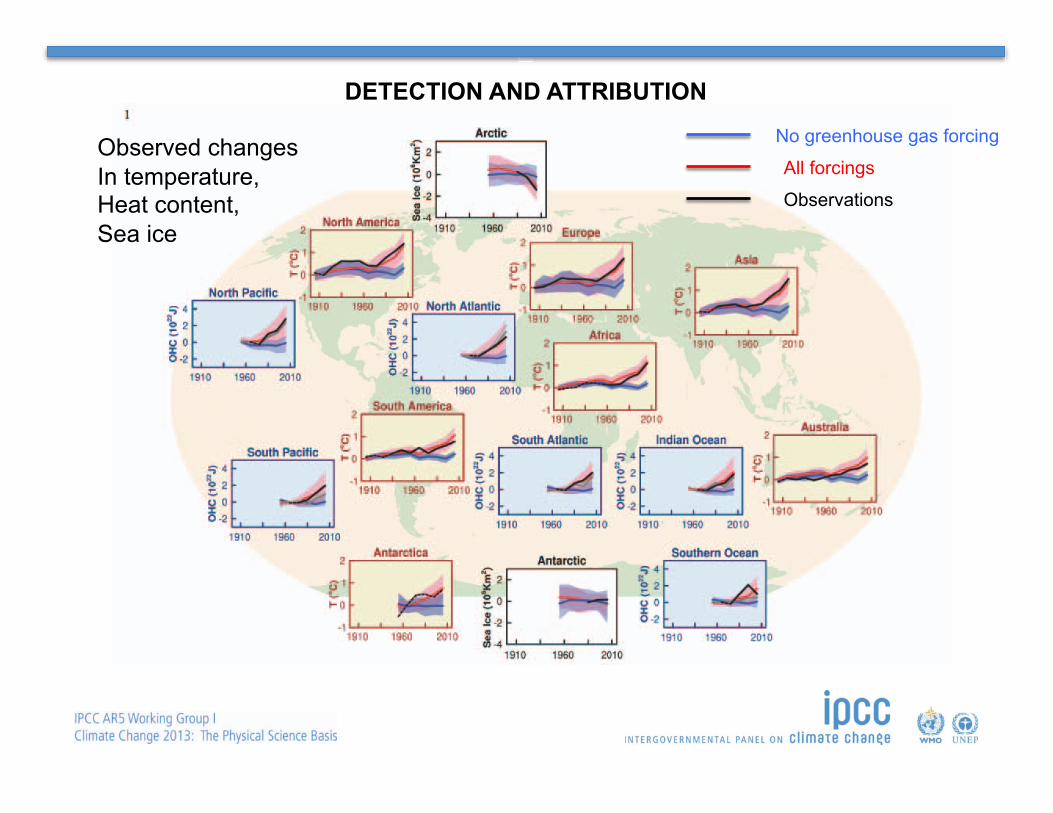
Observed changes In temperature, Heat content, Sea ice
No greenhouse gas forcing
All forcings
Observations
DETECTION AND ATTRIBUTION
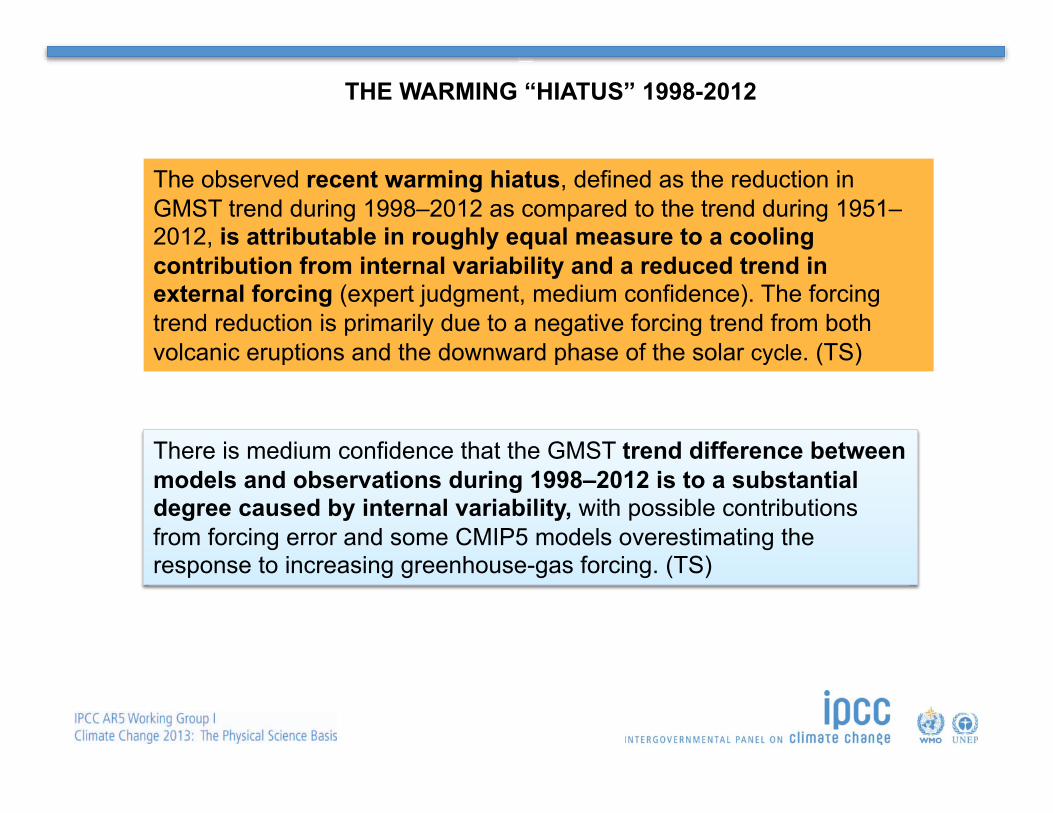
THE WARMING “HIATUS” 1998-2012
The observed recent warming hiatus, defined as the reduction in GMST trend during 1998–2012 as compared to the trend during 1951–2012, is attributable in roughly equal measure to a cooling contribution from internal variability and a reduced trend in external forcing (expert judgment, medium confidence). The forcing trend reduction is primarily due to a negative forcing trend from both volcanic eruptions and the downward phase of the solar cycle. (TS)
There is medium confidence that the GMST trend difference between models and observations during 1998–2012 is to a substantial degree caused by internal variability, with possible contributions from forcing error and some CMIP5 models overestimating the response to increasing greenhouse-gas forcing. (TS)
GW
OA
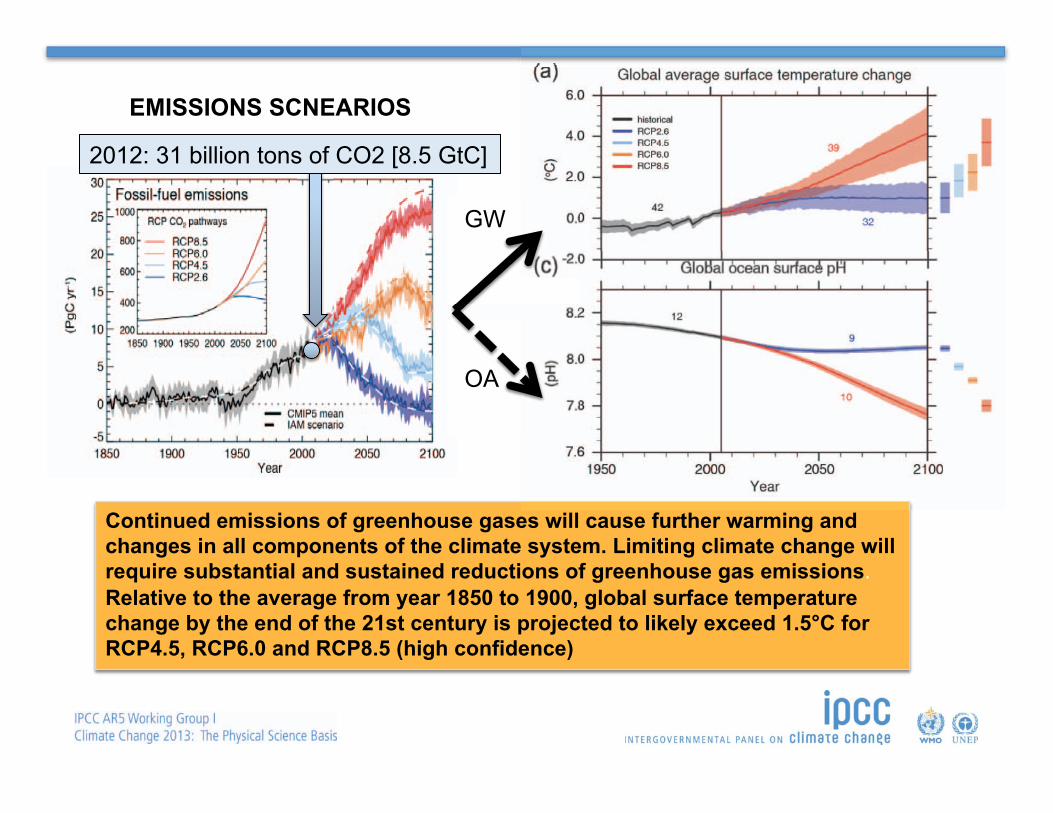
EMISSIONS SCNEARIOS
Continued emissions of greenhouse gases will cause further warming and changes in all components of the climate system. Limiting climate change will require substantial and sustained reductions of greenhouse gas emissions. Relative to the average from year 1850 to 1900, global surface temperature change by the end of the 21st century is projected to likely exceed 1.5°C for RCP4.5, RCP6.0 and RCP8.5 (high confidence)
2012: 31 billion tons of CO2 [8.5 GtC]
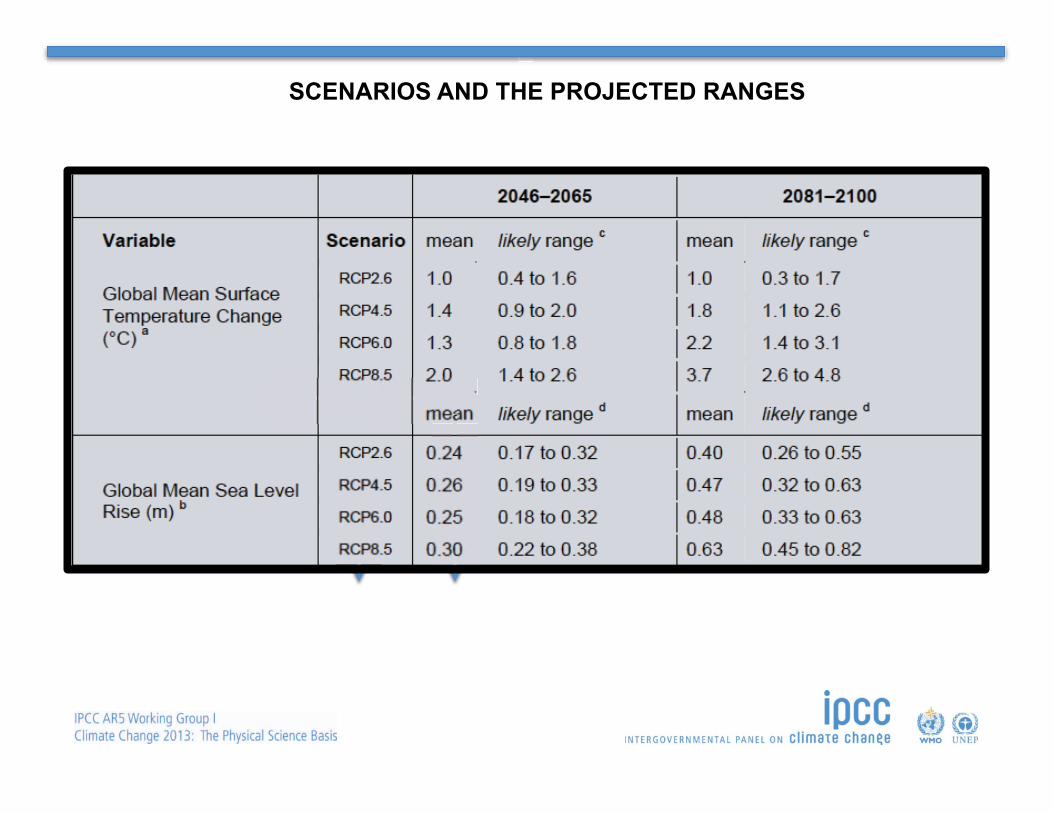
SCENARIOS AND THE PROJECTED RANGES
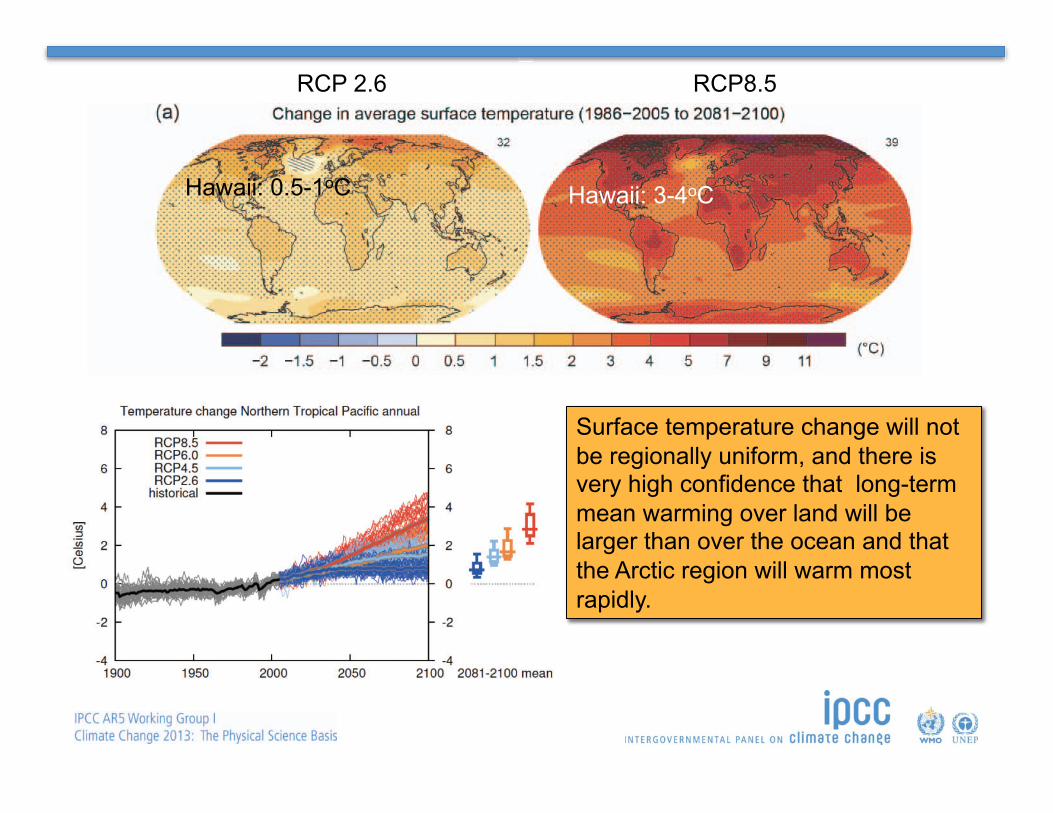
Hawaii: 3-4oC Hawaii: 0.5-1oC
RCP 2.6 RCP8.5
Surface temperature change will not be regionally uniform, and there is very high confidence that long-term mean warming over land will be larger than over the ocean and that the Arctic region will warm most rapidly.
RCP 2.6 RCP8.5
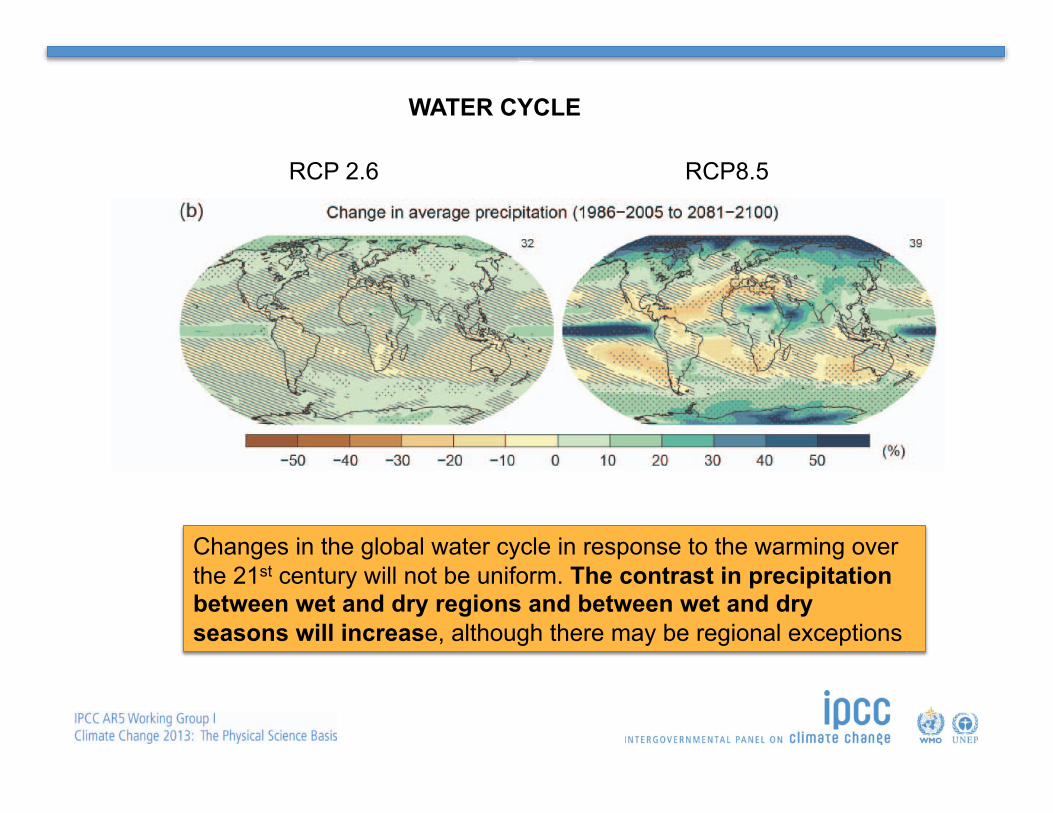
Changes in the global water cycle in response to the warming over the 21st century will not be uniform. The contrast in precipitation between wet and dry regions and between wet and dry seasons will increase, although there may be regional exceptions
WATER CYCLE
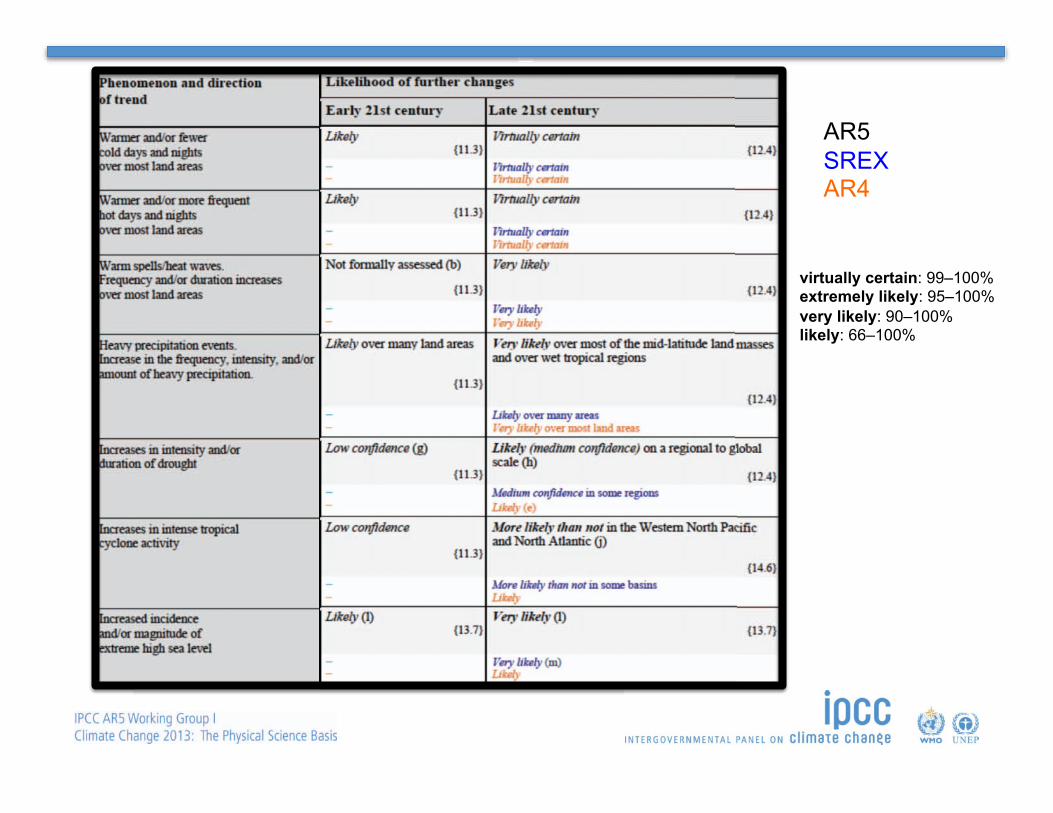
AR5 SREX AR4
virtually certain: 99–100% extremely likely: 95–100% very likely: 90–100% likely: 66–100%
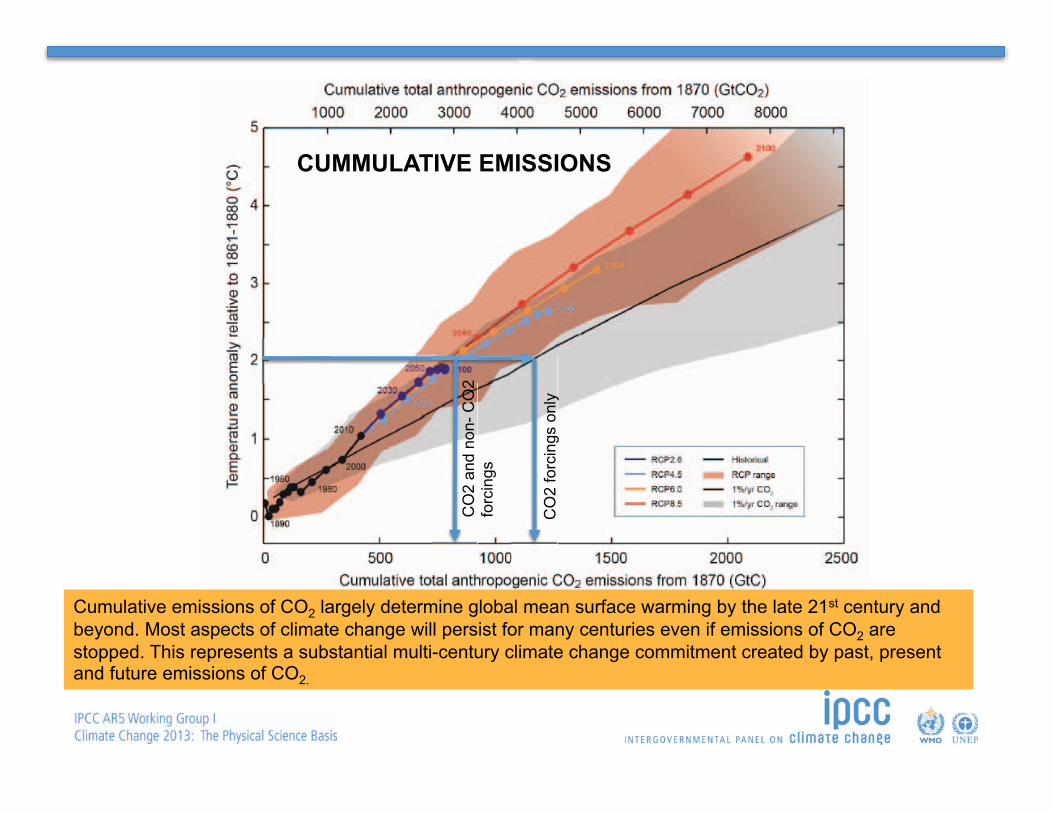
Cumulative emissions of CO2 largely determine global mean surface warming by the late 21st century and beyond. Most aspects of climate change will persist for many centuries even if emissions of CO2 are stopped. This represents a substantial multi-century climate change commitment created by past, present and future emissions of CO2.
CUMMULATIVE EMISSIONS
CO
2 fo
rcin
gs o
nly
CO
2 an
d no
n- C
O2
forc
ings
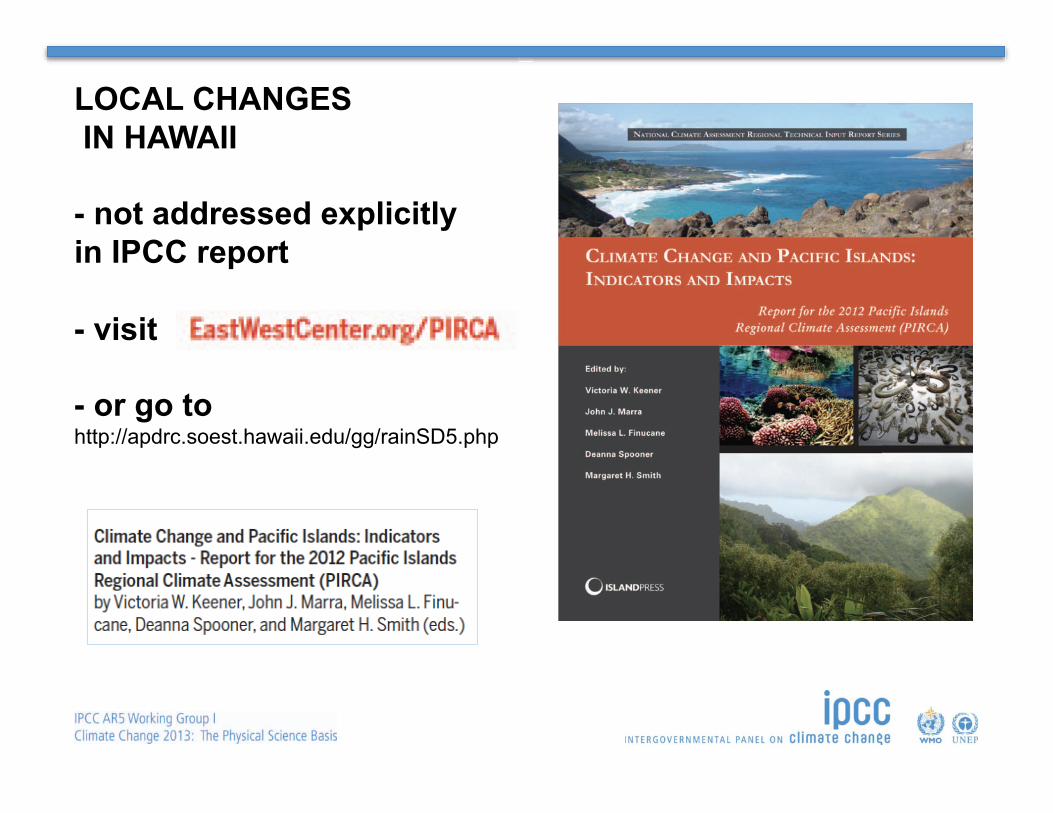
LOCAL CHANGES IN HAWAII
- not addressed explicitly in IPCC report
- visit
- or go to http://apdrc.soest.hawaii.edu/gg/rainSD5.php
© Yann Arthus-Bertrand / Altitude
www.climatechange2013.org www.climatechange2013.org Further Information


