18
1 Electron Cloud Measurements at the Fermilab Main Injector Bob Zwaska Fermilab ECloud07 Workshop April 9, 2007

1
Electron Cloud Measurements
at the Fermilab Main Injector
Bob Zwaska
Fermilab
ECloud07 Workshop
April 9, 2007

2
The Main Injector Program
(Double) Batch 1 (PBar)
Batch 2
Batch 3
Batch 4
Batch 5
Batch 6
Booster
Main Injector
• Provides high power, 120 GeV proton beam 80 kW for antiproton production 180 kW for neutrino production
• Takes 6 or 7 batches from the 8 GeV Booster @ 15 Hz 4-5 × 10¹² protons per Booster batch
• Total cycle time ≥ 1.4 s + batches/15
NuMI

3
Main Injector Operation• 53 MHz beam
• H=588
• 84-500 bunches
6-10 x 1010 protons/bunch
• Bunch length: 0.2-1.5 m
• Transverse size : 1-5 mm
• Ramps 8 – 120 GeV
0.8 s ramp period
• Passes through transition
• 3-D dampers needed for operation
Resistive wall instability
No evidence of e-p
• Linear growth rate scaling
• Operation limited by fractional loss
Losses < 10%
Maximum charge is secondary

4
Upgrade Plans at Fermilab• Medium term Proton Intensity upgrades
Intended for neutrino program (at first)
• Proton Plan (in progress, done by ~ 2008)
Use slip stacking in Main Injector to increase
proton bunch intensity
• NOvA-ANU (planned for ~2011)
Increase cycling rate of MI by using Recycler
for stacking
• SNuMI (early planning)
Increase proton bunch intensity by using
accumulator for stacking
• HINS (Proton Driver, on hold)
Increase proton bunch intensity through new
8 GeV Linac

5
Evolution of Proton Intensities
• Early plans were to go straight from Proton Plan to HINS Start to get big bunch intensities, and worry about electron cloud
• More recently, upgrade path has lengthened First leg, using the Recycler, does not significantly increase bunch intensity
Other legs still involve some increase
• Miguel Furman did initial simulations of the MI w/ Proton Driver Instigated study program at Fermilab
More calculations from LBL (other talks)
6
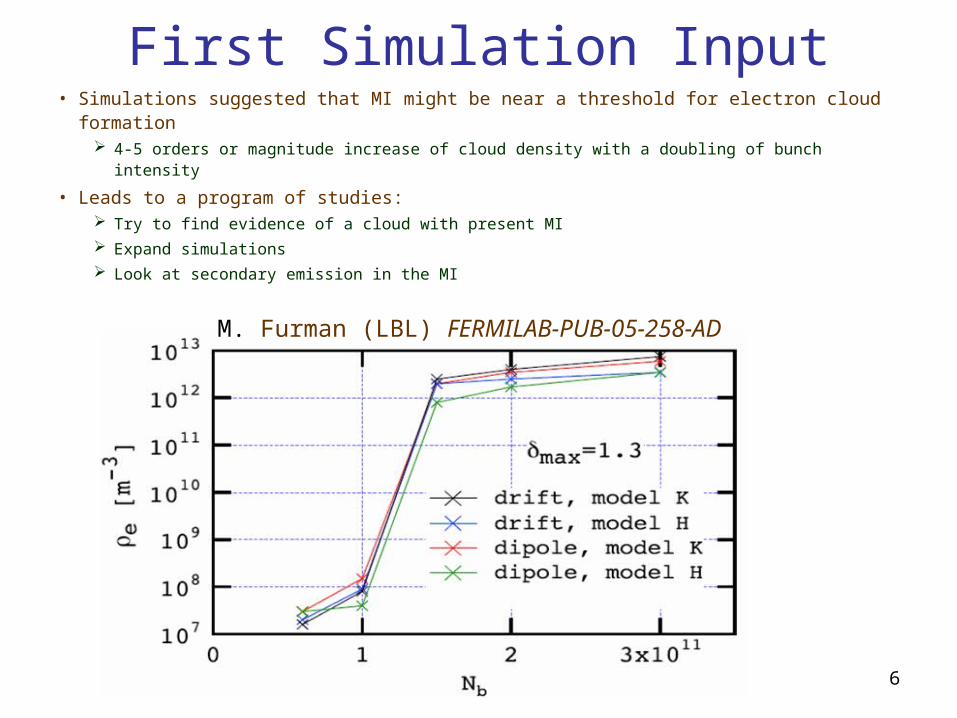
First Simulation Input• Simulations suggested that MI might be near a threshold for electron cloud formation
4-5 orders or magnitude increase of cloud density with a doubling of bunch intensity
• Leads to a program of studies: Try to find evidence of a cloud with present MI
Expand simulations
Look at secondary emission in the MI
M. Furman (LBL) FERMILAB-PUB-05-258-AD

7
Dynamic Pressure Rise
See fast rise over the course of a cycle (1s)
The control system induces delay
Occurs only at location of uncoated ceramic
Ion Pump Current
Ceramic beam pipes
Beam Intensity
8
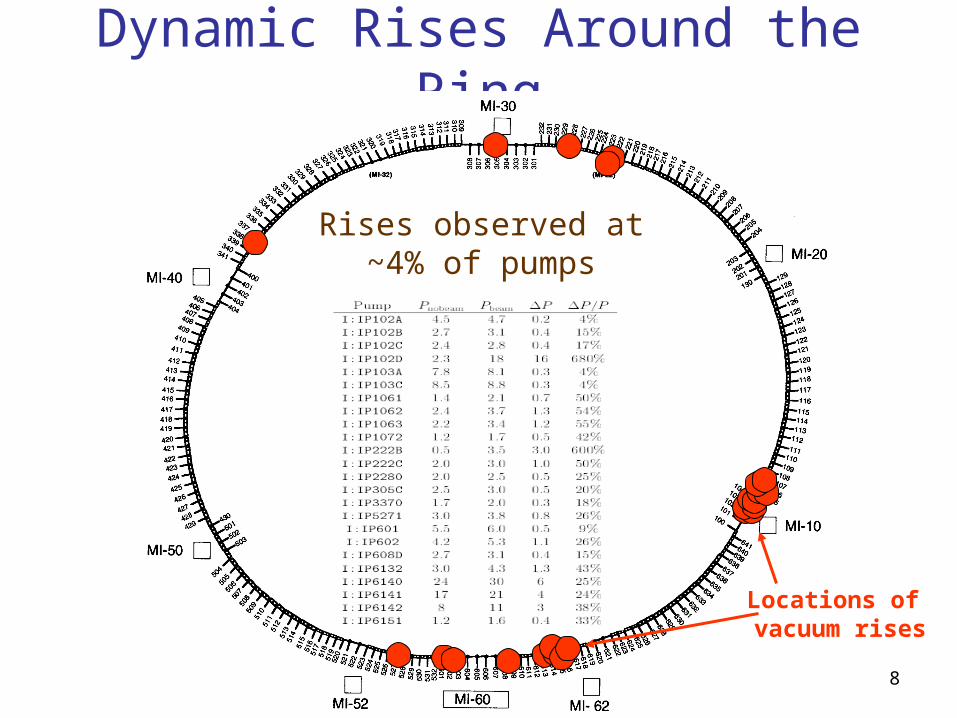
Dynamic Rises Around the Ring
Locations of vacuum rises
Rises observed at ~4% of pumps

9
50 Hz Pump
• Higher bandwidth pump
• Saw more structure
Pressure increases with
injections
Increases and decreases during
cycle
0
20
40
60
80
100
120
140
160
180
0 0.2 0.4 0.6 0.8 1 1.2 1.4 1.6 1.8
Time (s)
Pres
sure
Rise
(nto
rr)
Pressure Difference
Inferred Gas Load
20_02
0 84 168 252 336 420 504 588
1.0 × 10¹¹ / bunch0.5 × 1011 / bunch
Type of pump installed at two locations

10
Electron Probe• Retarding Field Analyzer
Borrowed from Argonne
Installed in drift region
• Have a lot of interferenceMagnet bus (grounds)
RF & beam signals (RF noise)
• Being used as an electron counterNot biasing retarder
Filtered output current
Collector
Retarder

11
Cycle Measurement• DC signal seen to spike at middle of cycle
Around the time of transition
• Rapid increase of signal occurs into accelerationDip occurs at transitionMaximum occurs shortly after transitionElectron count decreases toward the end of the cycle
-0.005
0
0.005
0.01
0.015
0.02
0.025
0.03
0 0.2 0.4 0.6 0.8 1 1.2
Time (s)
Cu
rren
t (u
A)

12
Collected results• Large number of cycles sampled
at maximum current
• Clear turn-on at higher intensities
• Noise is bad due to amplifier/MADC system
• 0.2 uA ~ 1% neutralization
• Expect new measurements with 11-batch structure
More high intensity bunches
13
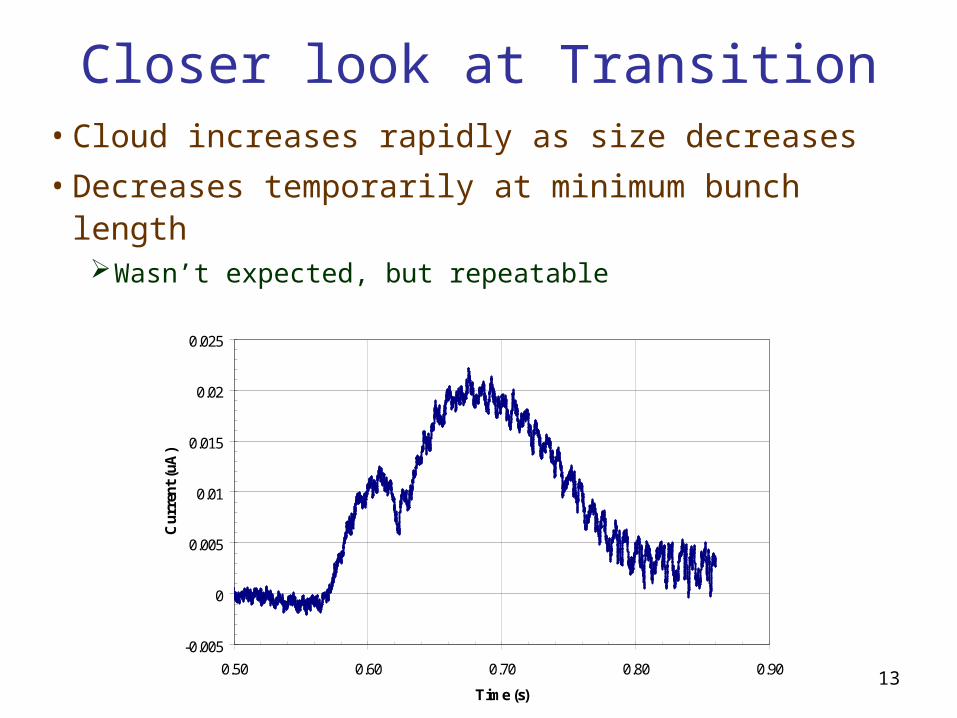
Closer look at Transition• Cloud increases rapidly as size decreases
• Decreases temporarily at minimum bunch lengthWasn’t expected, but repeatable
-0.005
0
0.005
0.01
0.015
0.02
0.025
0.50 0.60 0.70 0.80 0.90
Time (s)
Cu
rren
t (u
A)

14
Another look at Transition• Better filtering/amplifying allow a
closer look Introduces time delay
• Some cloud before transition
• Biggest effect after The dip definitely occurs
• Bunch length dependence looks complicated
Naïve expectation was that shortest bunch length gave highest electron current
• Perhaps due to electron energy or beam pipe geometry (Furman)
15
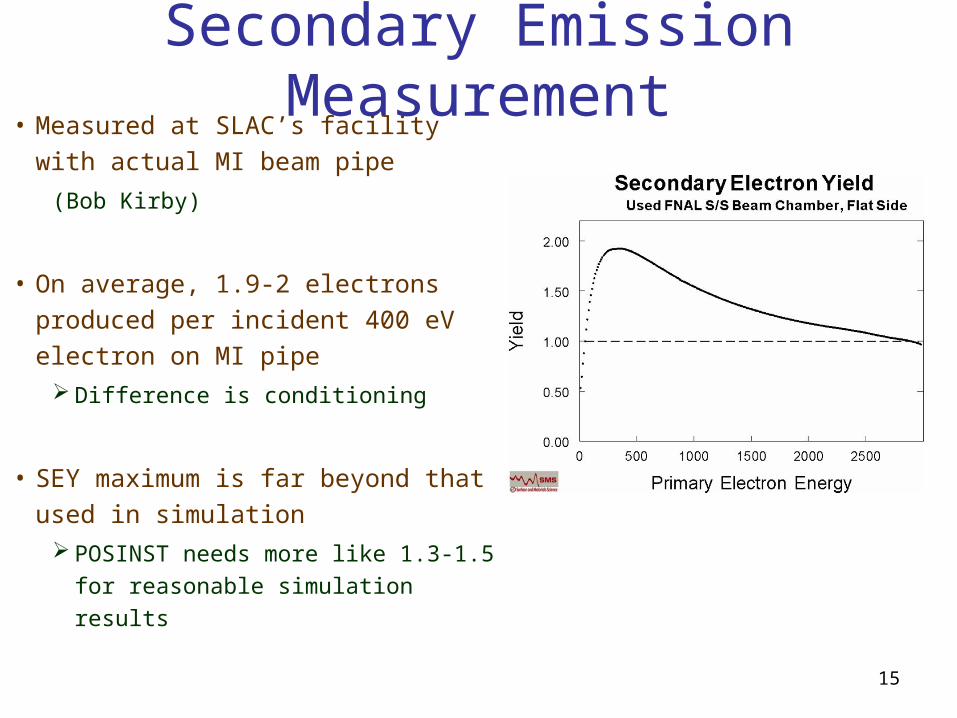
Secondary Emission Measurement• Measured at SLAC’s facility with actual
MI beam pipe
(Bob Kirby)
• On average, 1.9-2 electrons produced per
incident 400 eV electron on MI pipe
Difference is conditioning
• SEY maximum is far beyond that used in
simulation
POSINST needs more like 1.3-1.5 for
reasonable simulation results

16
Future Measurements• Improve MI detector installation
Better shielded cables and groundsBetter electronics/DAQ
• Real-time bunch-by-bunch tune measurementAchieved by manipulating damper system
• Running sums of beam oscillations
• Well suited for FPGA
May see coherent shifts
• Plan to install new detectors in Booster & RR
• Enameled coatings for high resistivity electrodesFritz Caspers ideaLooking into getting MI pipe coated and installed

17
Summary• Measurements of electron cloud formation in MI
Vacuum pressure rise & Direct electron detection• Suggest few % neutralization
• No Instabilities from electrons
• Dip of electron current at transitionPerhaps due to SEY/geometry effects
• Simulations suggest possibility of thresholdSomewhat consistent with observed turn-onHowever, disconnect on SEYMain Injector upgrades may push us past threshold
• However, none of the approved upgrades do so
• Planning to continue measurementsTest new, higher intensity beamsNew instrumentation

18
Electron Cloud Measurements
at the Fermilab Main Injector
Bob Zwaska
Fermilab
ECloud07 Workshop
April 9, 2007


