Page 1
THE MAMDANI FUZZY INFERENCE SYSTEM APPROACH
FOR RISK EVALUATION OF DAIRY PRODUCTS
MANUFACTURING SYSTEMS
A Thesis
Submitted to the Faculty of Graduate Studies and Research
In Partial Fulfillment of the Requirements
For the Degree of
Master of Applied Science
in
Industrial Systems Engineering
University of Regina
By
Dayo Stephen Ogunyale
Regina, Saskatchewan
August 2017
Copyright 2017: D.S Ogunyale
Page 2
UNIVERSITY OF REGINA
FACULTY OF GRADUATE STUDIES AND RESEARCH
SUPERVISORY AND EXAMINING COMMITTEE
Dayo Stephen Ogunyale, candidate for the degree of Master of Applied Science in Industrial Systems Engineering, has presented a thesis titled, The Mamdani Fuzzy Inference System Approach for Risk Evaluation of Diary Products Manufacturing Systems, in an oral examination held on August 14, 2017. The following committee members have found the thesis acceptable in form and content, and that the candidate demonstrated satisfactory knowledge of the subject material. External Examiner: Dr. Kelvin Ng, Environmental Systems Engineering
Supervisor: Dr. Rene Mayorga, Industrial Systems Engineering
Committee Member: *Dr. Wei Peng, General Engineering
Committee Member: Dr. Mohamed Ismail, Industrial Systems Engineering
Chair of Defense: Dr. Sean Tucker, Faculty of Business Administration *Not present at defense
Page 3
i
Abstract
The world is evolving and growing every day and the need for dairy products are becoming
more evident and essential to human. The higher consumption rate of dairy products by
people of different ages has attracted investors because of its economic values. Considering
this growth and its economic benefits, the understanding of the risk involved in dairy
products manufacturing processes is highly required.
The objective of this research is to develop an intelligent system capable of analyzing risk
level of dairy products manufacturing system at different categories (Physical, Biological,
Chemical, and Environmental) of the operation, and the final risk evaluation of the
manufacturing system. Five Mamdani Fuzzy (FIS) Inference System models were proposed
to solve this problem. FIS has been proven to be a great tool to assess risk at different levels.
The first stage of the study involved gathering data to identify the failure modes using data
from operation failures, root-cause analysis log, consumer feedbacks, and expert’s
opinions. These data were used to define the membership functions for the first four FISs,
with the expert’s knowledge and opinions. The output of this first four FISs then fed into
the final FIS to evaluate the risk level of the manufacturing system.
The proposed novel model uses fuzzy logic, experts’ knowledge and quantitative-based
approach on these three criteria (Severity, Occurrence, and Detectability) and linguistic
terms (Very_Small, Small, Medium, High, Very_High) to analyze and evaluate the risk
involved in dairy products manufacturing.
The result of this research work will give both the manufacturers and the consumers
guarantees on the finished products but most importantly, it can make the operation
managers more productive. Since the failures are prioritized, the maintenance team can
Page 4
ii
schedule maintenance to address the most important failure and can employ the approach
of other manufacturers as a benchmark.
It is worthy of note that the model gives a deep insight on how to mitigate the risks involved
in dairy products manufacturing systems. Models were experimented using data provided
by a dairy products manufacturer to validate the model and Graphic User Interfaces were
designed as a platform to provide the inputs to the proposed model.
Keywords: Fuzzy, Mamdani fuzzy inference system, Linguistic terms, Risk evaluation,
Occurrence, Severity, Detectability, Failure Mode and Effects Analysis
Page 5
iii
Acknowledgment
First, I use this medium to honor my Heavenly Father the God Almighty, who in HIS infinite
mercy and glory has blessed me with so many wonderful things, and for helping me throughout
the program.
I profoundly appreciate the support of my wife, who encouraged, motivated, and most especially
show me love, when the going was tough, I could not have achieved this great feat if not for her
support, love, and prayers. I equally thank my parent for always supporting and encouraging me
in every challenge I took on.
My sincere gratitude and utmost thanks go to my supervisor, Dr. Rene V. Mayorga, who has
supported me both financially and academically. I have benefited from his immense knowledge
throughout my graduate program. My gratitude goes to the organizations and Kurt & Ozilgen
(2013) for the failure modes that were used to experiment the proposed models.
I am sincerely indebted to the committee members for their unbiased and constructive criticism
and contributions on the thesis.
In conclusion, I gratefully acknowledge the financial support of the Faculty of Graduate Studies
and Research at the University of Regina through Graduate Studies Scholarships.
Page 6
iv
Dedication
This thesis is dedicated to God Almighty and my late father.
Page 7
v
Table of Contents Abstract .......................................................................................................................................................... i
Acknowledgment .......................................................................................................................................... iii
Dedication ..................................................................................................................................................... iv
List of Figures .............................................................................................................................................. vii
List of Tables ............................................................................................................................................... viii
List of Abbreviations ..................................................................................................................................... ix
CHAPTER ONE: INTRODUCTION ........................................................................................................ 1
1.0 Overview ........................................................................................................................................... 1
1.1 Dairy Products and Its Importance .................................................................................................... 5
1.2 Dairy Products Manufacturing Processes and Associated Risks ....................................................... 6
1.3 Importance of this Research .............................................................................................................. 6
1.4 Summary and Thesis Outlines ........................................................................................................... 7
CHAPTER TWO: LITERATURE REVIEW ............................................................................................ 8
2.1 Dairy Products ................................................................................................................................... 8
2.1.1 Grazing ...................................................................................................................................... 9
2.1.2 Milk Extracting from Animals .................................................................................................. 9
2.1.3 Fortifying ................................................................................................................................. 10
2.1.4 Pasteurization .......................................................................................................................... 11
2.1.5 Homogenizing ......................................................................................................................... 11
2.1.6 Milk Packaging and Cleaning ................................................................................................. 11
2.2 Risk Assessment .............................................................................................................................. 12
2.3 Failure Modes and Effects Analysis approach for risk Assessment and management .................... 13
2.4 Introduction to Fuzzy Logic: Application of Fuzzy Inference systems in research ........................ 16
2.4.1 Fuzzy Set ................................................................................................................................. 16
2.4.2 Fuzzy Inference Systems ......................................................................................................... 18
2.4.2.1 Inputs ................................................................................................................................... 19
2.4.2.2 Fuzzification ........................................................................................................................ 20
2.4.2.3 The Inference Engine .......................................................................................................... 24
2.4.2.4 Defuzzification .................................................................................................................... 24
2.4.3 Fuzzy Rules and Reasoning..................................................................................................... 26
2.5 Mamdani Fuzzy Inference System .................................................................................................. 27
2.6 Summary ......................................................................................................................................... 28
Page 8
vi
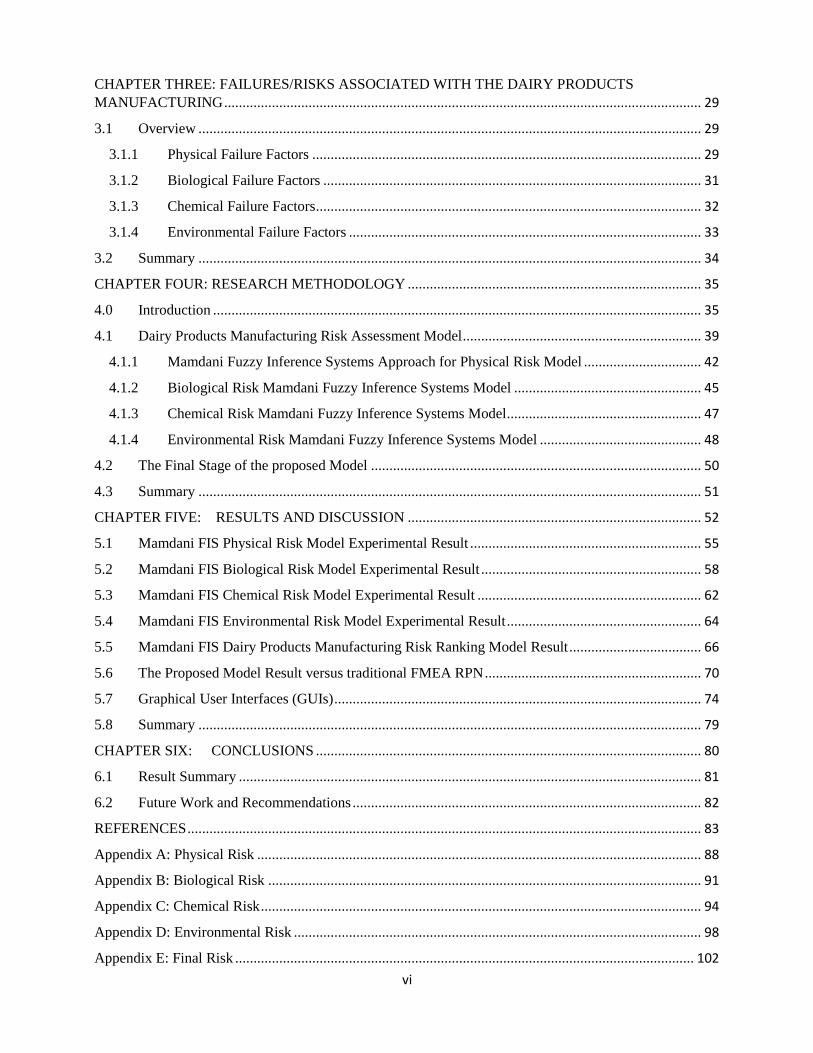
CHAPTER THREE: FAILURES/RISKS ASSOCIATED WITH THE DAIRY PRODUCTS
MANUFACTURING .................................................................................................................................. 29
3.1 Overview ......................................................................................................................................... 29
3.1.1 Physical Failure Factors .......................................................................................................... 29
3.1.2 Biological Failure Factors ....................................................................................................... 31
3.1.3 Chemical Failure Factors ......................................................................................................... 32
3.1.4 Environmental Failure Factors ................................................................................................ 33
3.2 Summary ......................................................................................................................................... 34
CHAPTER FOUR: RESEARCH METHODOLOGY ................................................................................ 35
4.0 Introduction ..................................................................................................................................... 35
4.1 Dairy Products Manufacturing Risk Assessment Model ................................................................. 39
4.1.1 Mamdani Fuzzy Inference Systems Approach for Physical Risk Model ................................ 42
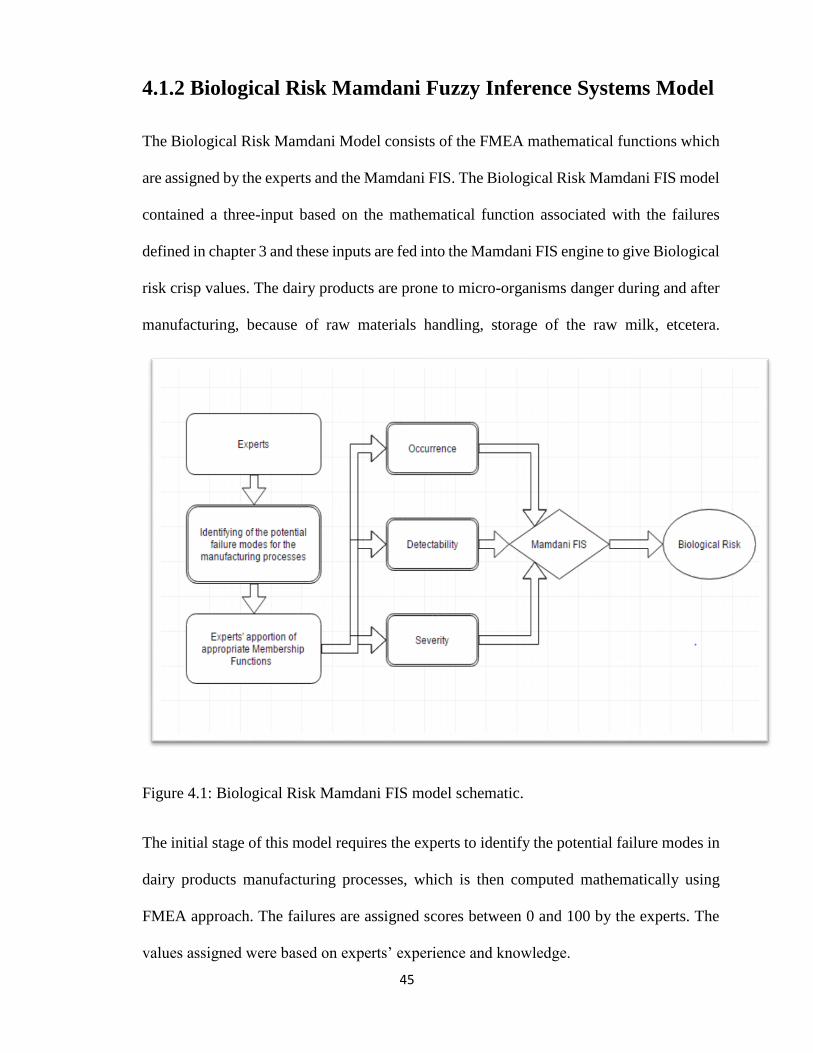
4.1.2 Biological Risk Mamdani Fuzzy Inference Systems Model ................................................... 45
4.1.3 Chemical Risk Mamdani Fuzzy Inference Systems Model ..................................................... 47
4.1.4 Environmental Risk Mamdani Fuzzy Inference Systems Model ............................................ 48
4.2 The Final Stage of the proposed Model .......................................................................................... 50
4.3 Summary ......................................................................................................................................... 51
CHAPTER FIVE: RESULTS AND DISCUSSION ................................................................................ 52
5.1 Mamdani FIS Physical Risk Model Experimental Result ............................................................... 55
5.2 Mamdani FIS Biological Risk Model Experimental Result ............................................................ 58
5.3 Mamdani FIS Chemical Risk Model Experimental Result ............................................................. 62
5.4 Mamdani FIS Environmental Risk Model Experimental Result ..................................................... 64
5.5 Mamdani FIS Dairy Products Manufacturing Risk Ranking Model Result .................................... 66
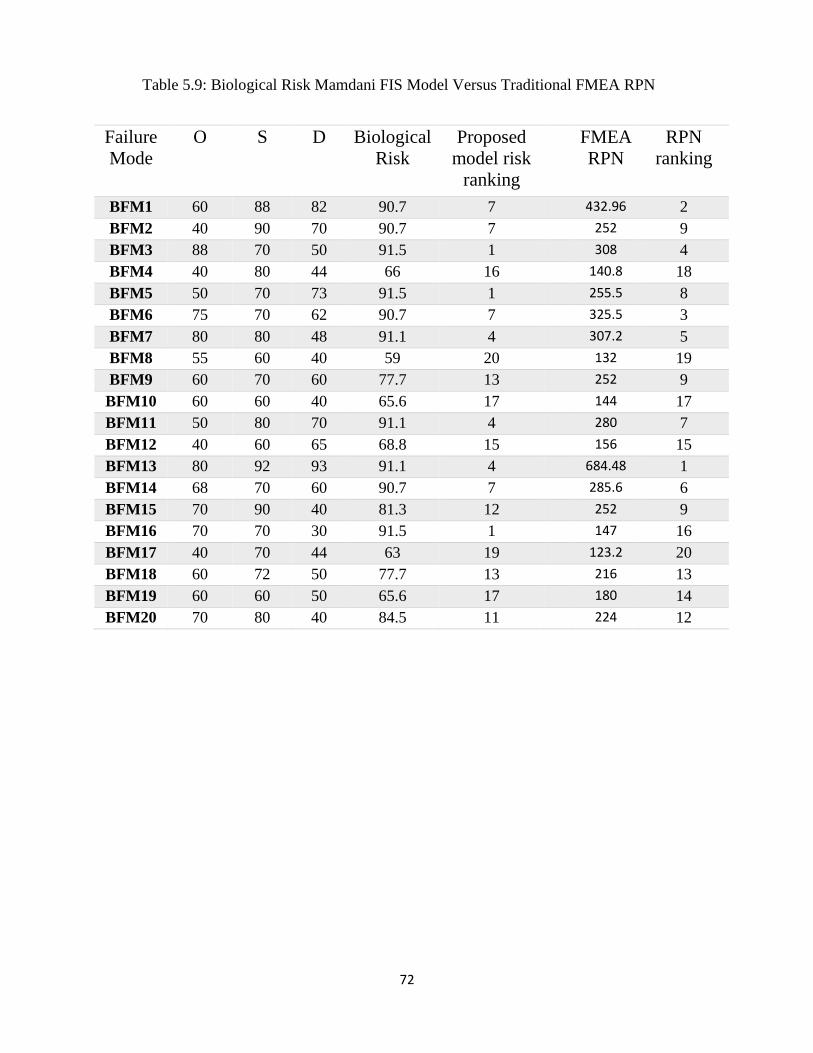
5.6 The Proposed Model Result versus traditional FMEA RPN ........................................................... 70
5.7 Graphical User Interfaces (GUIs) .................................................................................................... 74
5.8 Summary ......................................................................................................................................... 79
CHAPTER SIX: CONCLUSIONS ......................................................................................................... 80
6.1 Result Summary .............................................................................................................................. 81
6.2 Future Work and Recommendations ............................................................................................... 82
REFERENCES ............................................................................................................................................ 83
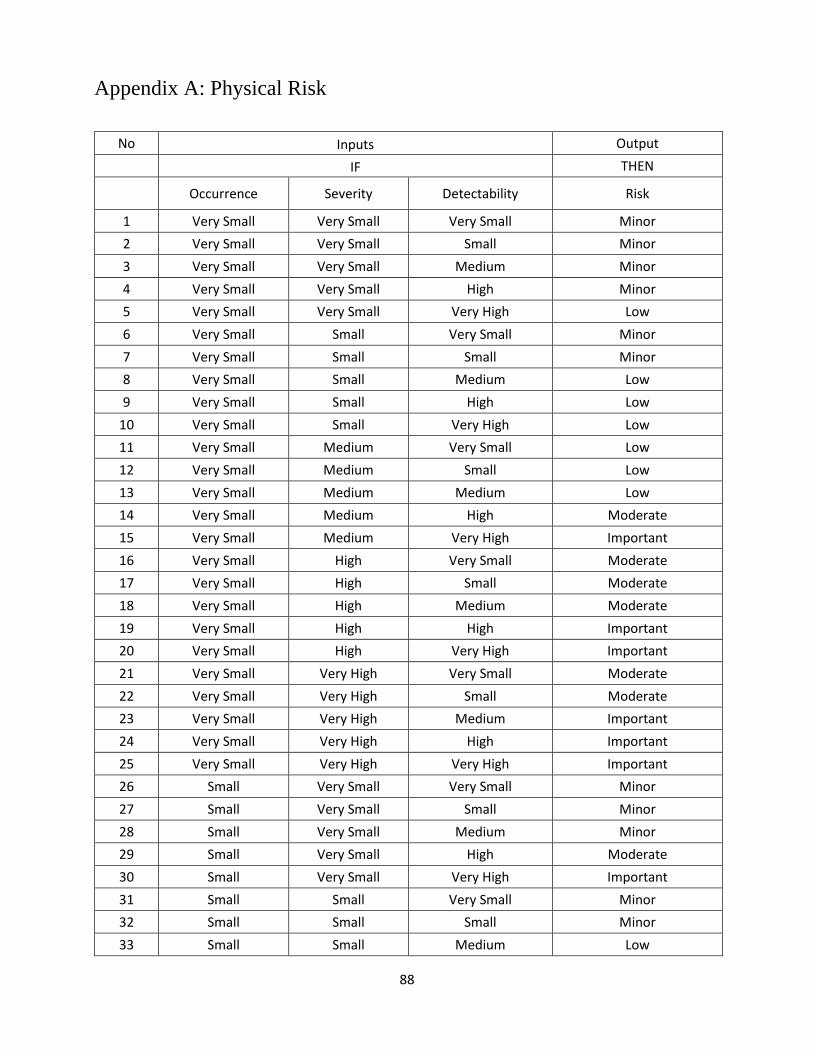
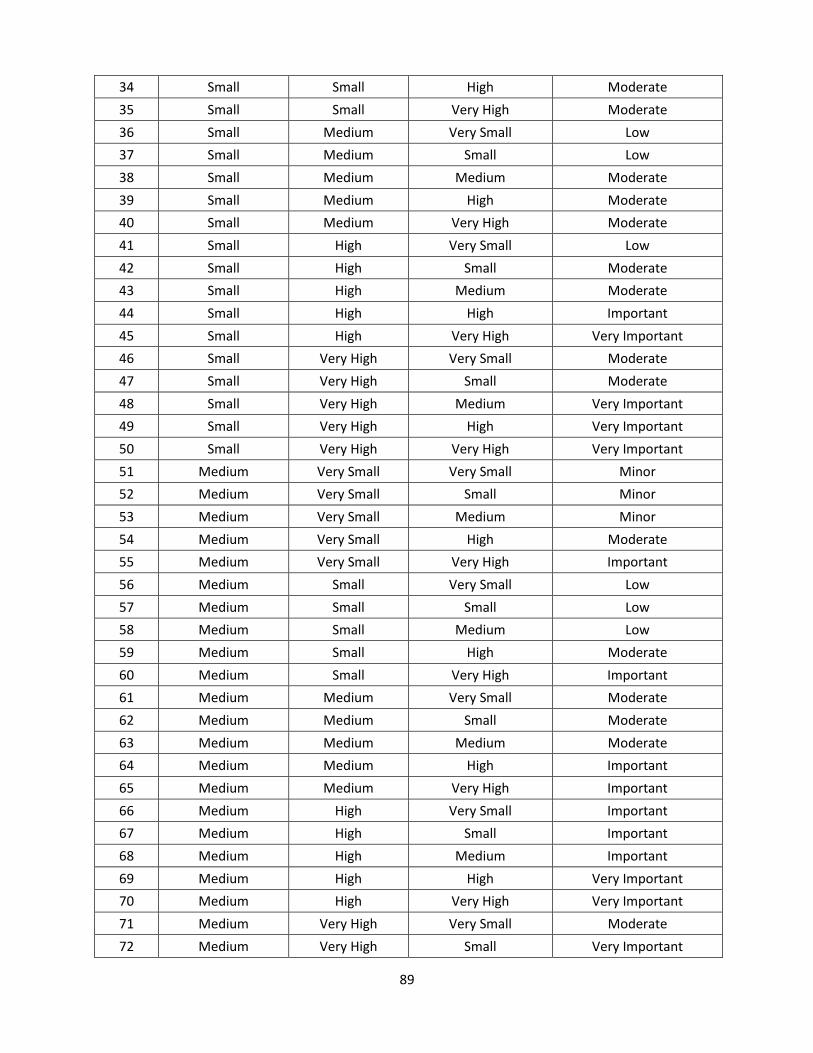
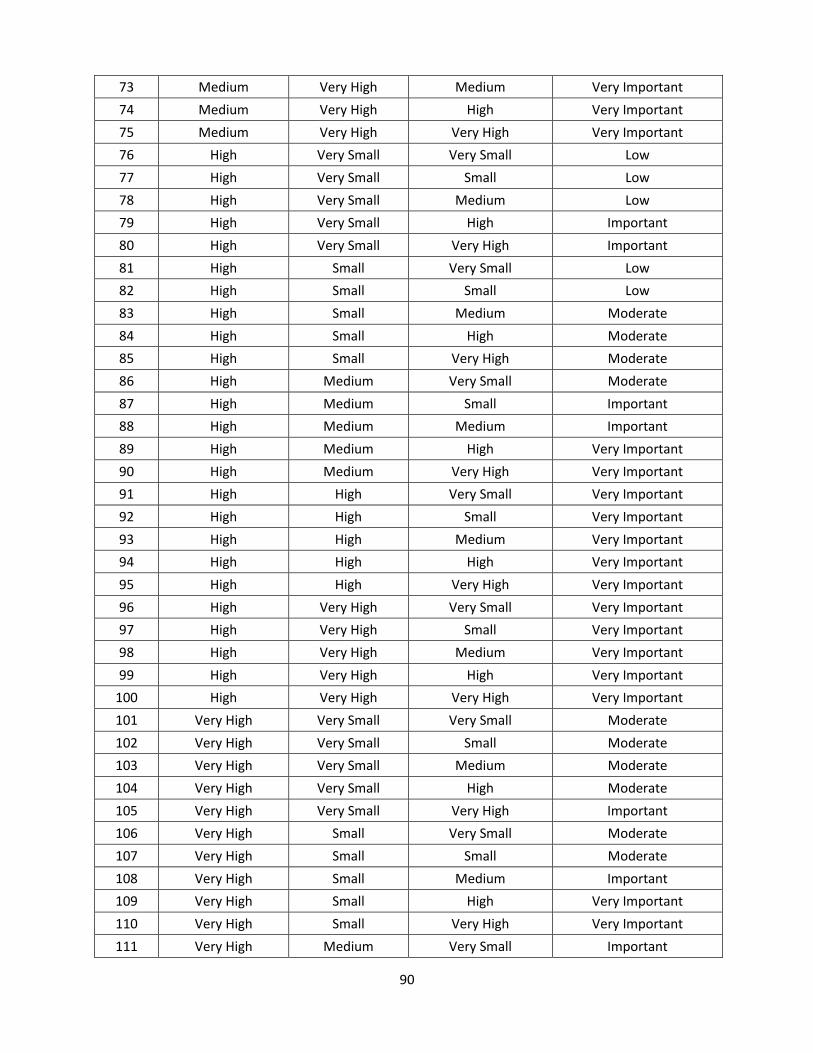
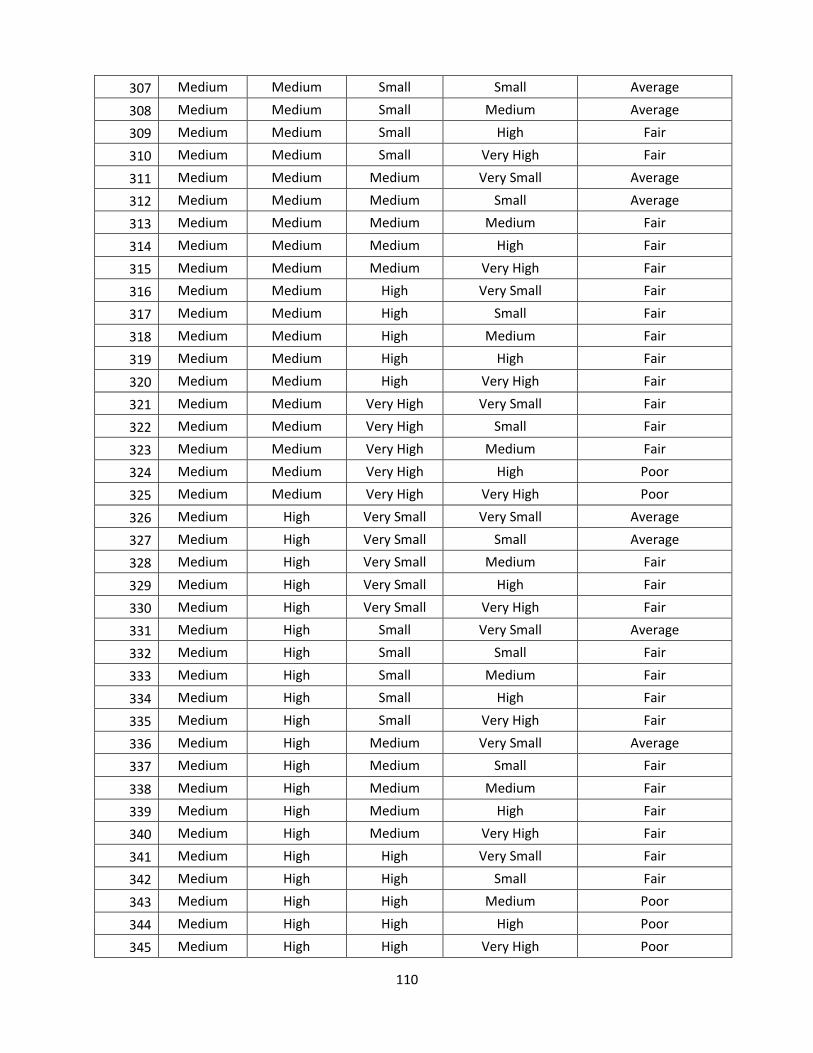
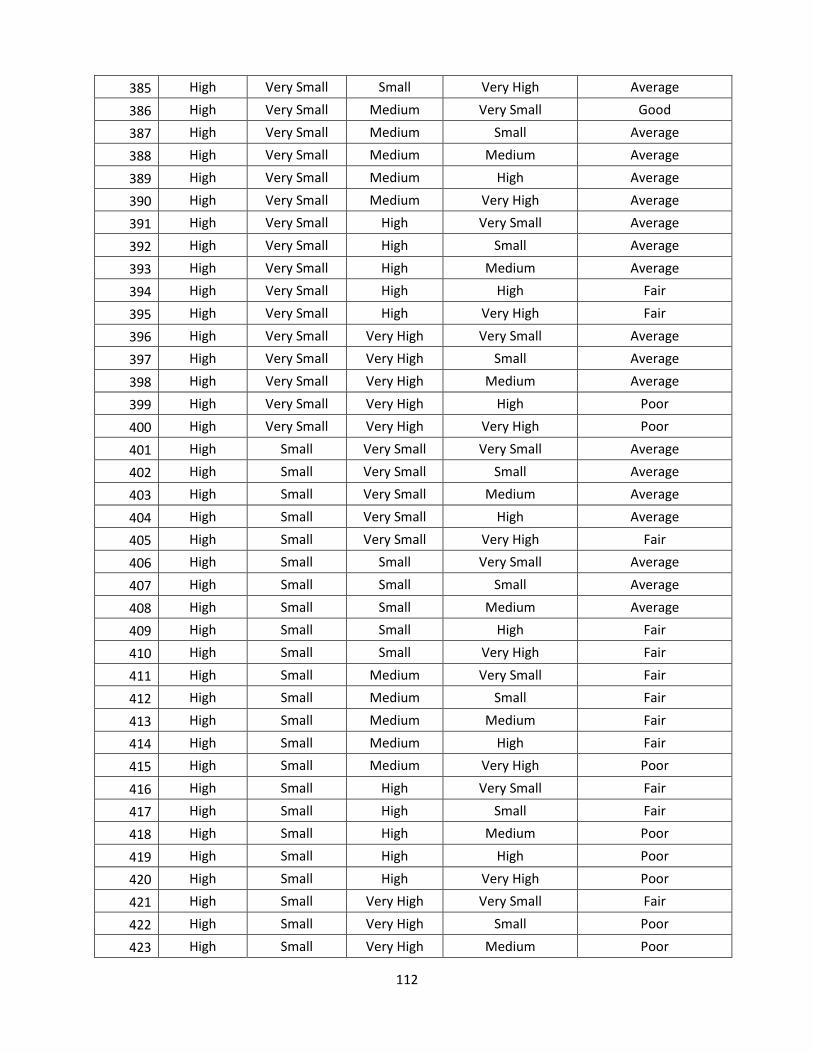
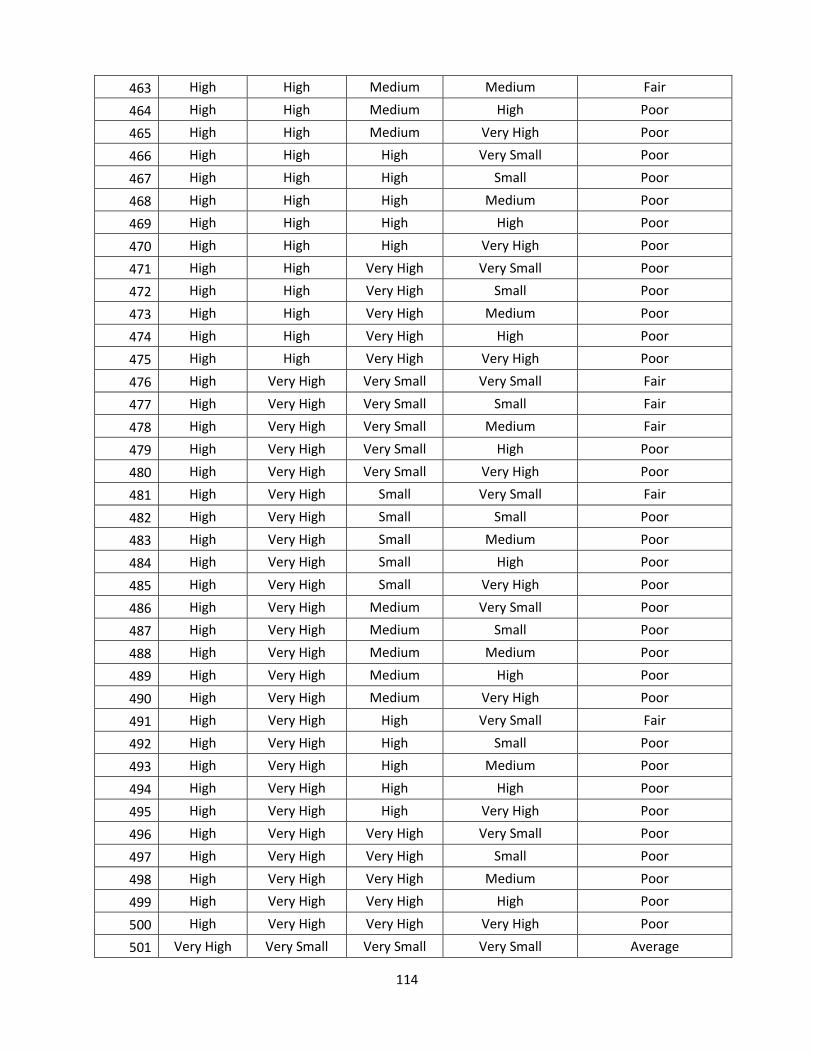
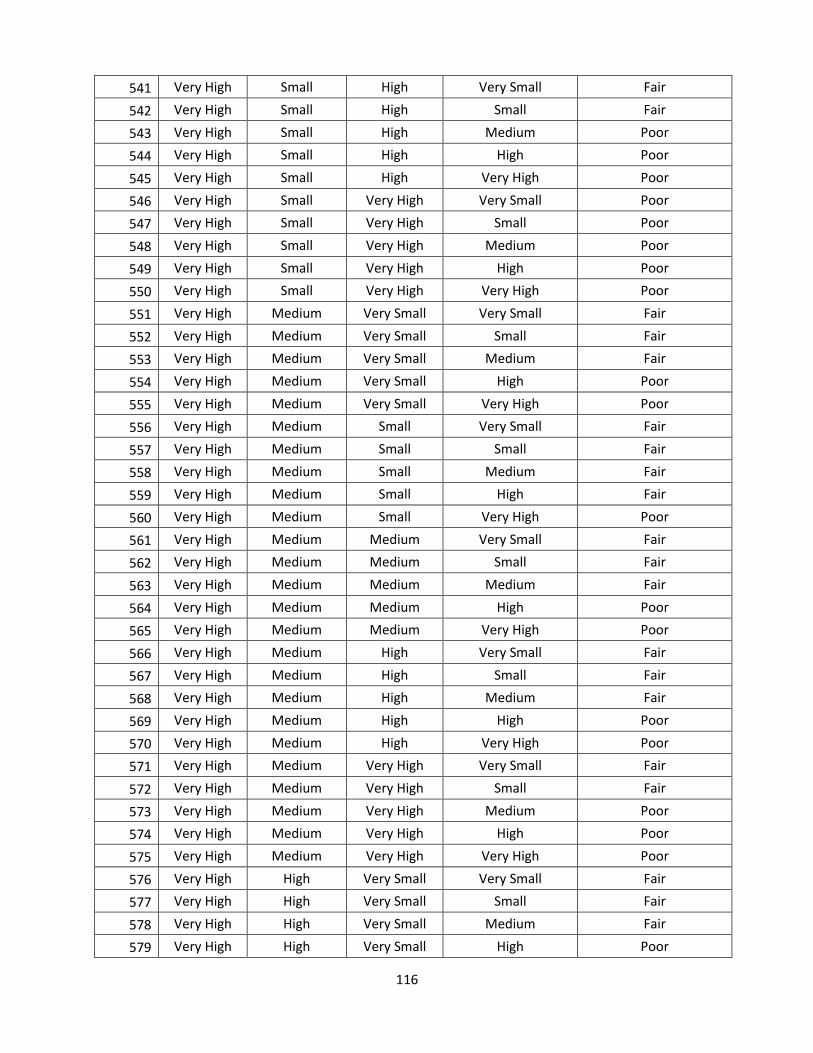
Appendix A: Physical Risk ......................................................................................................................... 88
Appendix B: Biological Risk ...................................................................................................................... 91
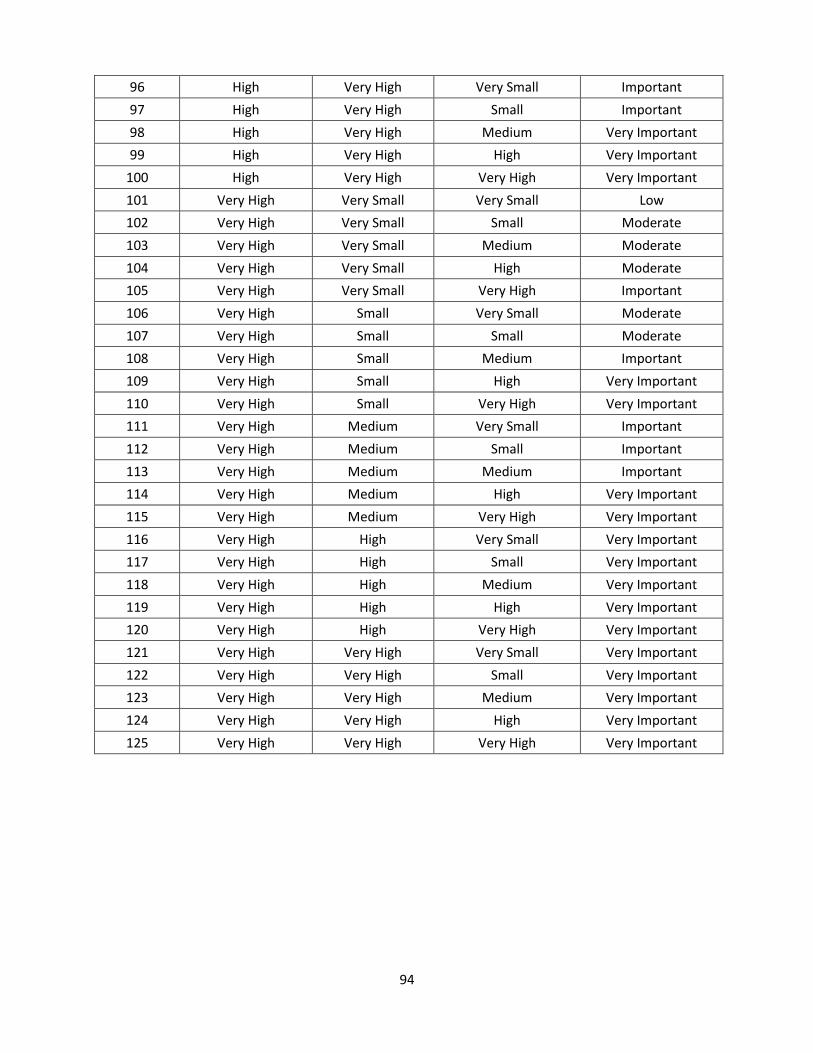
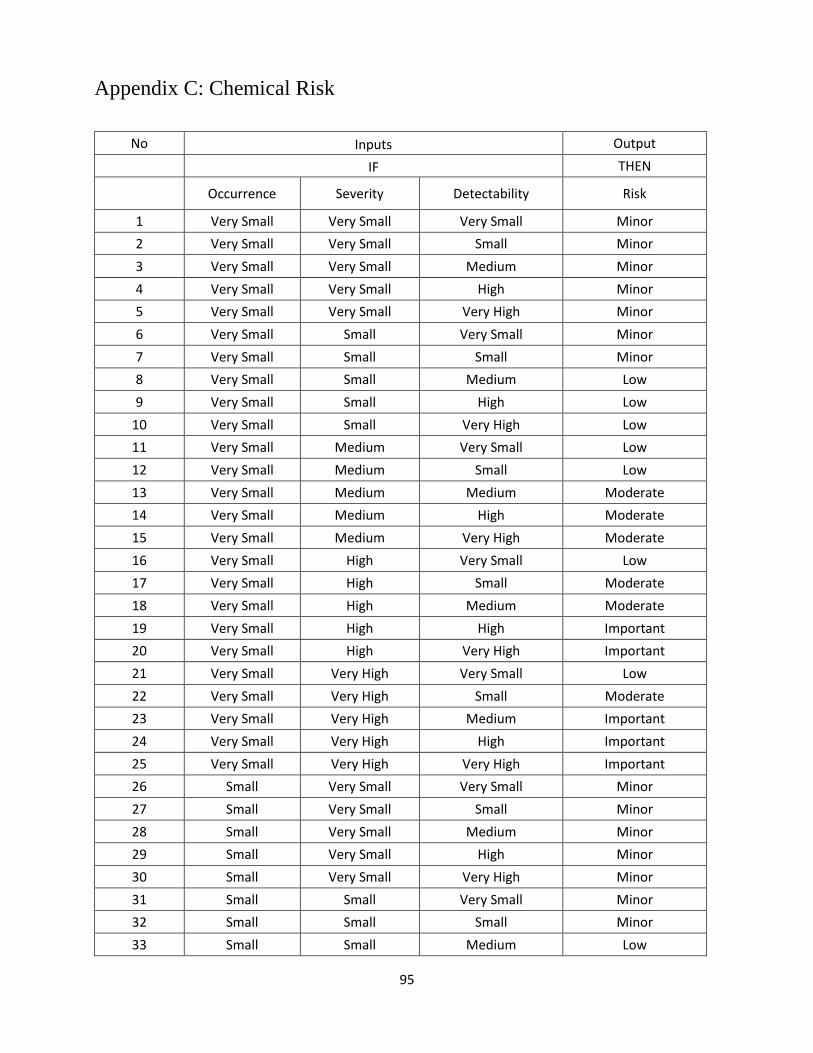
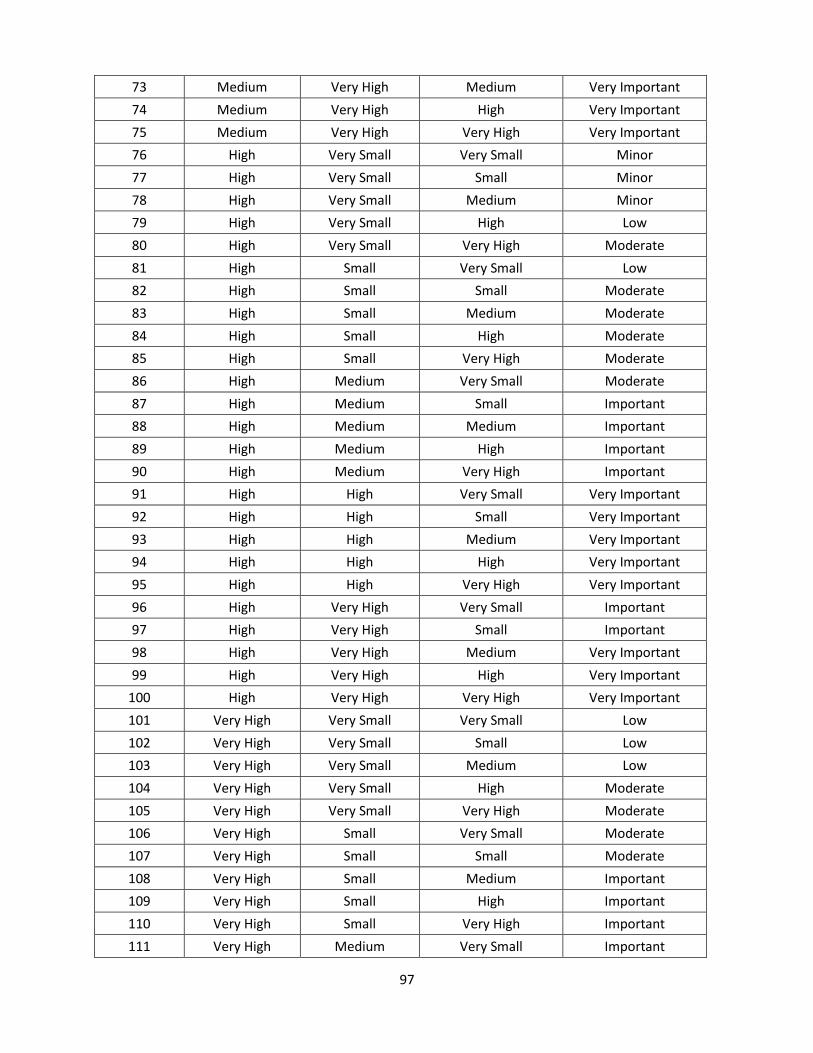
Appendix C: Chemical Risk ........................................................................................................................ 94
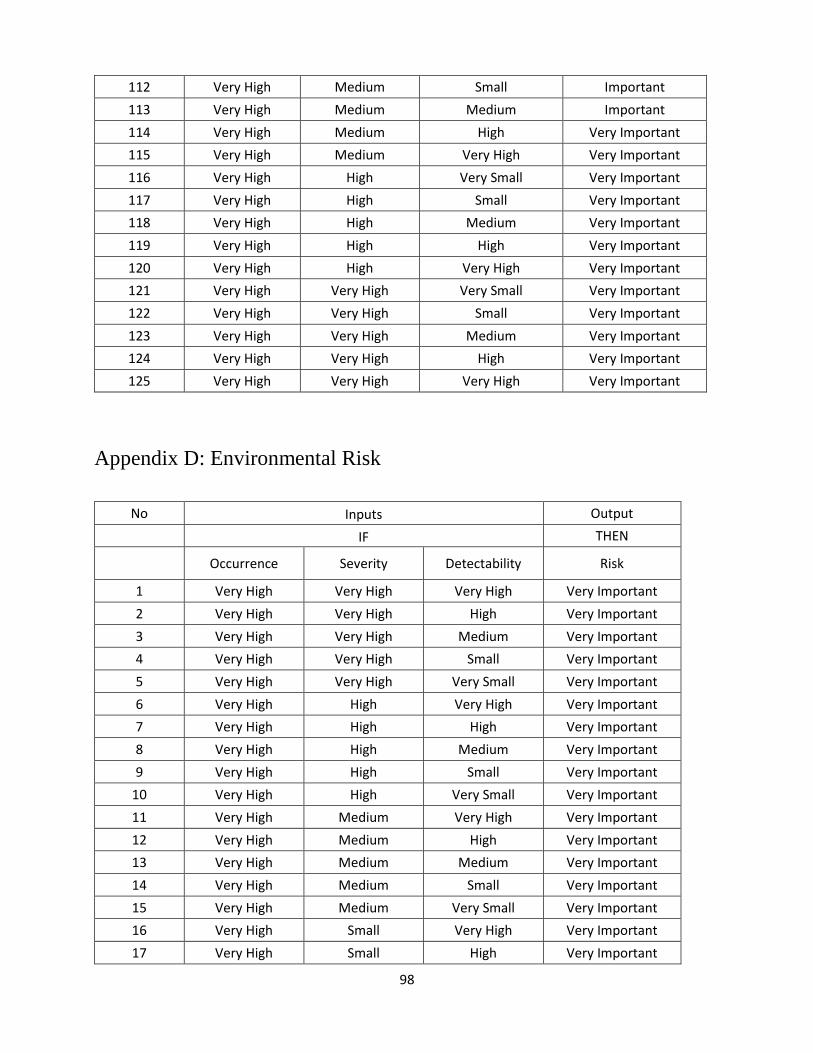
Appendix D: Environmental Risk ............................................................................................................... 98
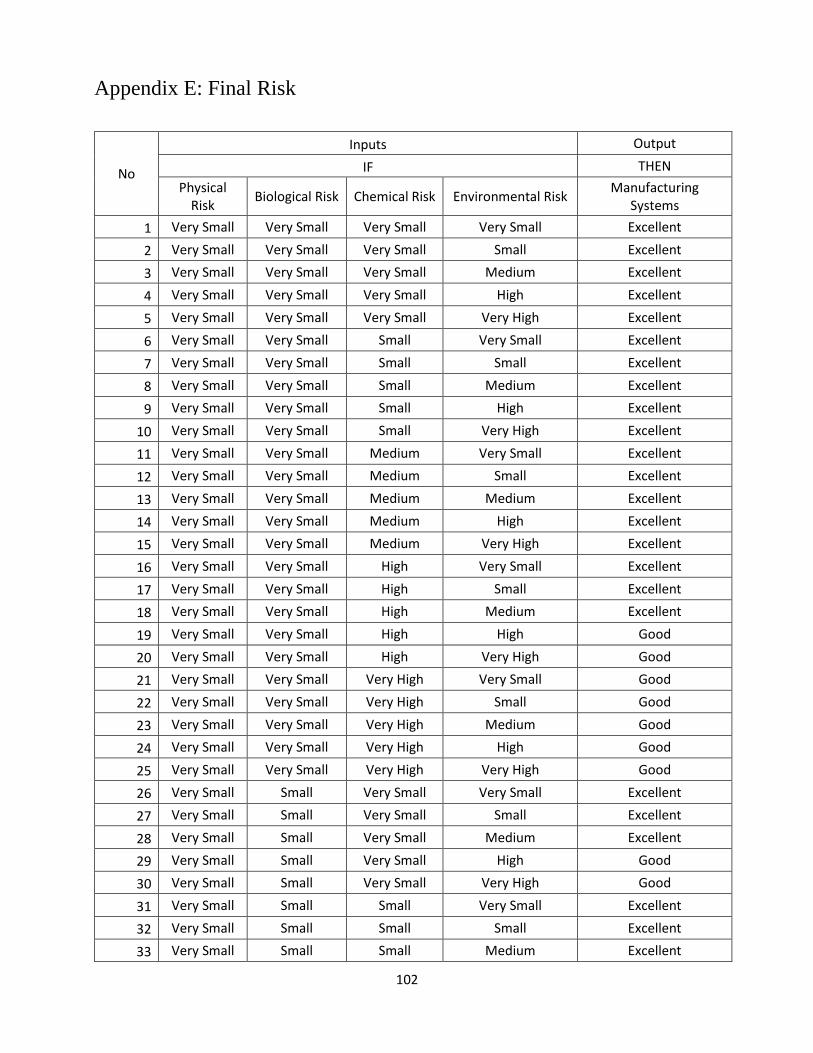
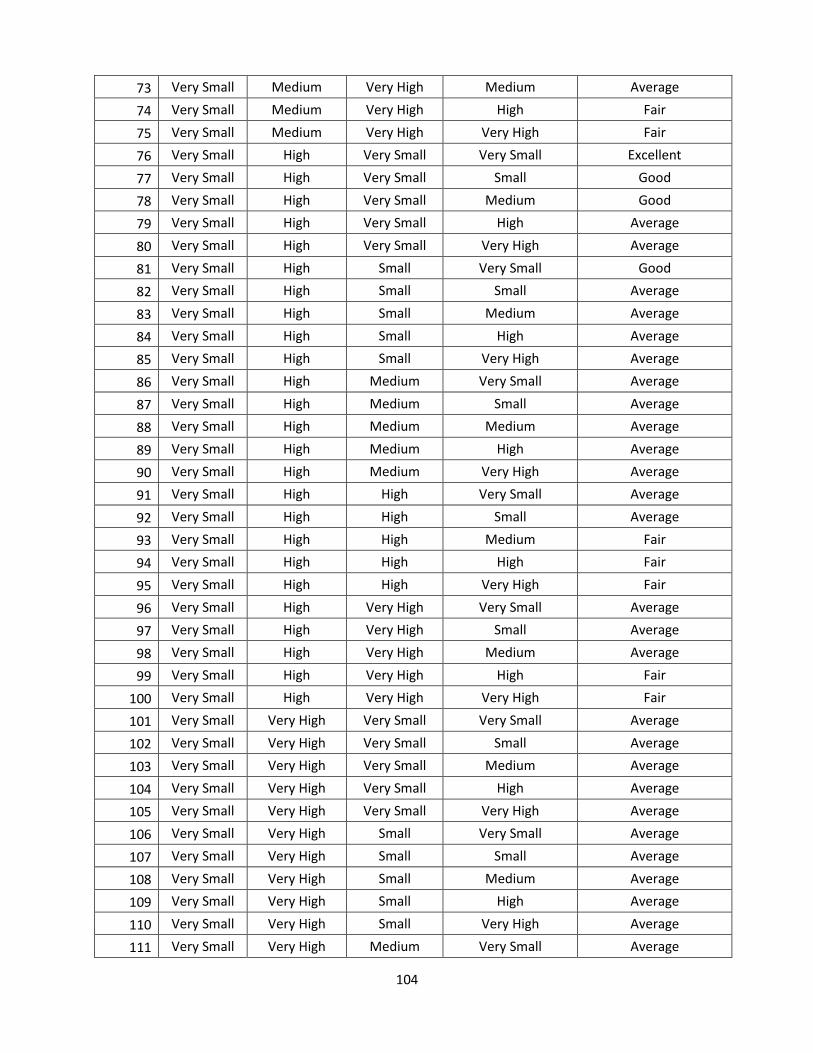
Appendix E: Final Risk ............................................................................................................................. 102
Page 9
vii
List of Figures
Figure 1.0: Failure Mode and Effect Analysis Procedure ................................................................ 5
Figure 2.0: Schematic diagram of Milk production (Ogunyale, 2017) .......................................... 10
Figure 2.1: Fuzzy Inference Systems Model .................................................................................. 19
Figure 2.2: Triangular Membership Function with parameter (x;20,40,60) .................................. 21
Figure 2.3: Gaussian Membership Function with parameter (x; 60,30) ........................................ 22
Figure 2.4: Trapezoidal MF the parameter trapezoid (x; 20, 40, 70, 100) ..................................... 24
Figure 2.5: Defuzzification Methods (Jang et al. 1997) ................................................................. 25
Figure 2.6: The Mamdani FIS using min and max for T-norm and T-conorm operators
respectively (Jang et al. 1997). ....................................................................................................... 28
Figure 4.1: Proposed Mamdani Fuzzy Inference Systems for Risk Analysis in Dairy Products
Manufacturing Systems .................................................................................................................. 41
Figure 4.2: Mamdani Fuzzy Inference Systems Approach for Physical Risk Model .................... 43
Figure 4.3: Membership Function Definitions for both input variables and the Output (Risk). .... 44
Figure 4.4: Biological Risk Mamdani FIS model schematic. ........................................................ 45
Figure 4.5: Biological Risk Mamdani Fuzzy Inference Systems Model Fuzzy Interface ............. 47
Figure 4.6: Chemical Risk Mamdani Fuzzy Inference Systems Model Fuzzy Interface ............... 47
Figure 4.7: Environmental Risk Mamdani Fuzzy Inference Systems Model ................................ 49
Figure 5.1: Graphical Final Output Result ..................................................................................... 70
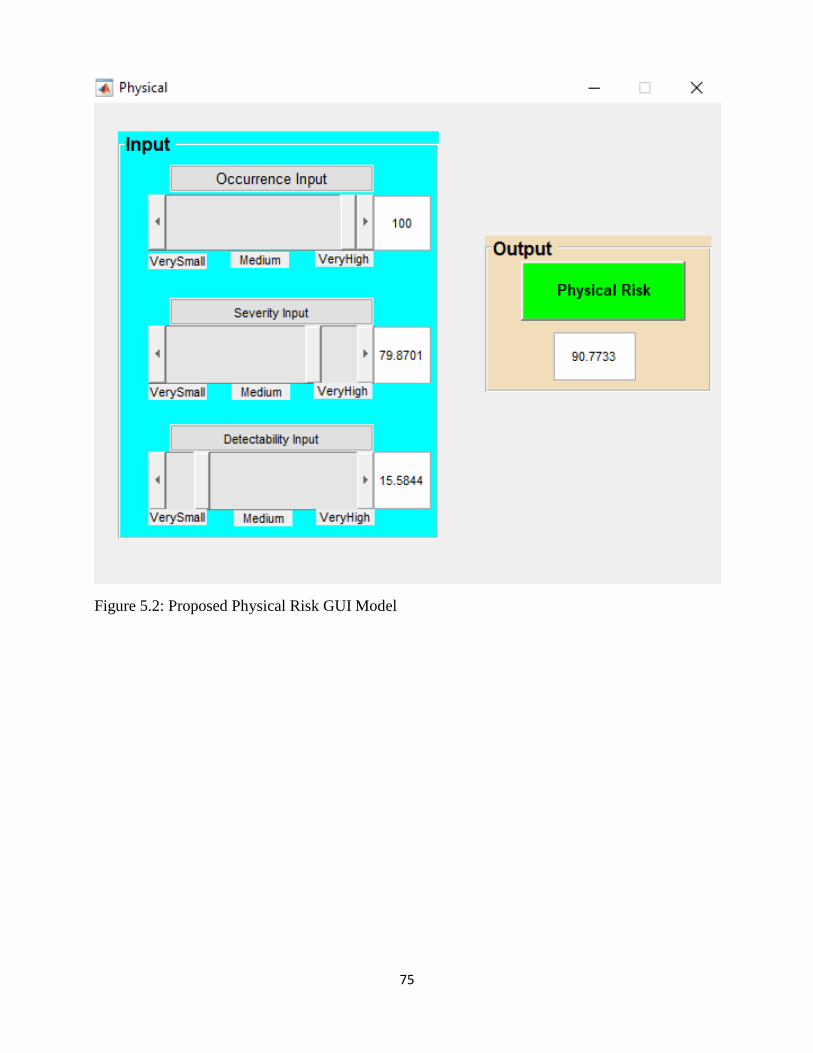
Figure 5.2: Proposed Physical Risk GUI Model ............................................................................ 75
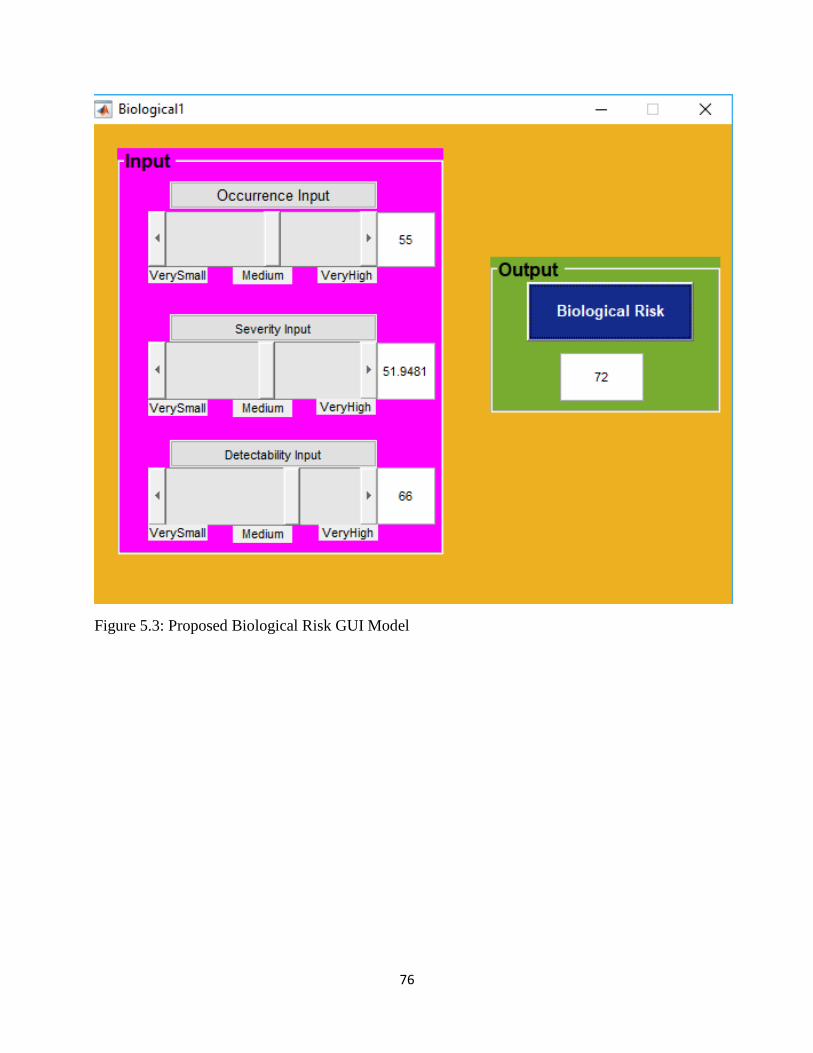
Figure 5.3: Proposed Biological Risk GUI Model ......................................................................... 76
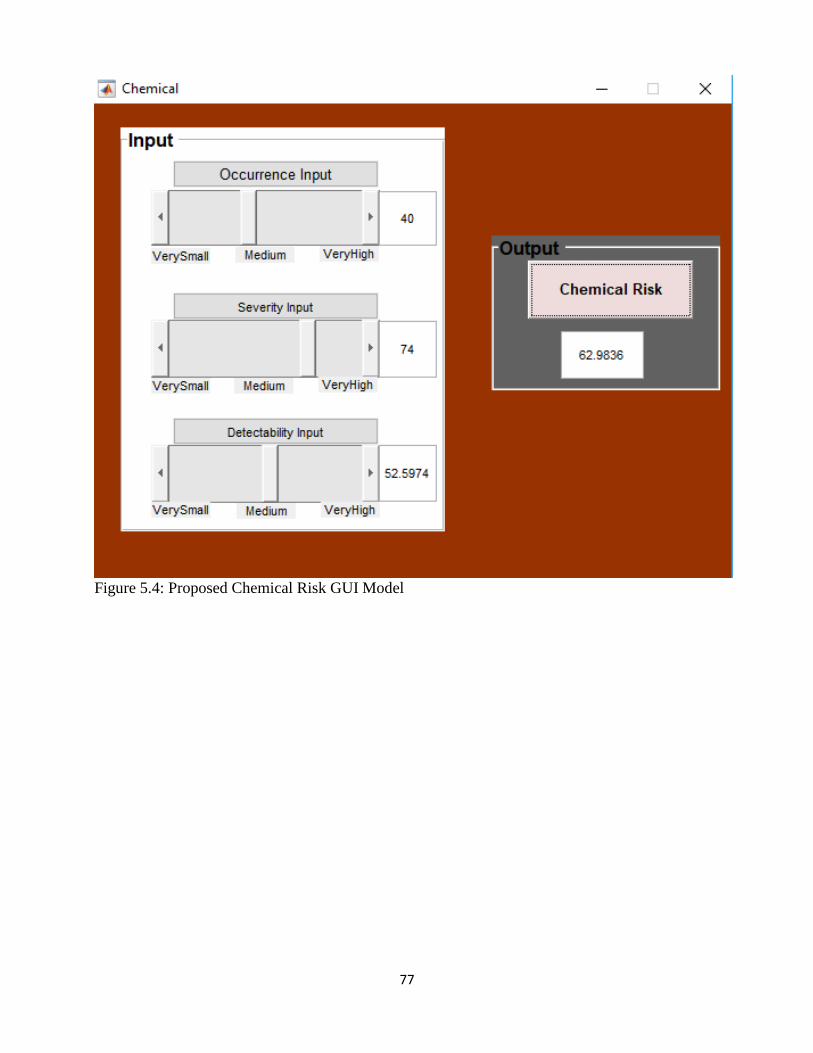
Figure 5.4: Proposed Chemical Risk GUI Model .......................................................................... 77
Figure 5.5: Proposed Environmental Risk GUI Model .................................................................. 78
Figure 5.6: Proposed Final Risk Assessment GUI Model ............................................................. 79
Page 10
viii
List of Tables
Table 1.0: Dairy (Milk) World Production by each Dairy Animal (FAOSTAT, 2015) .................. 2
Table 4.1: The Evaluation Criteria for Occurrence ........................................................................ 36
Table 4.2: The Evaluation Criteria for Severity ............................................................................. 37
Table 4.3: The Evaluation Criteria for Detectability ..................................................................... 38
Table 5.1: Final Risk (DPMRA) ranking interpretation. ............................................................... 54
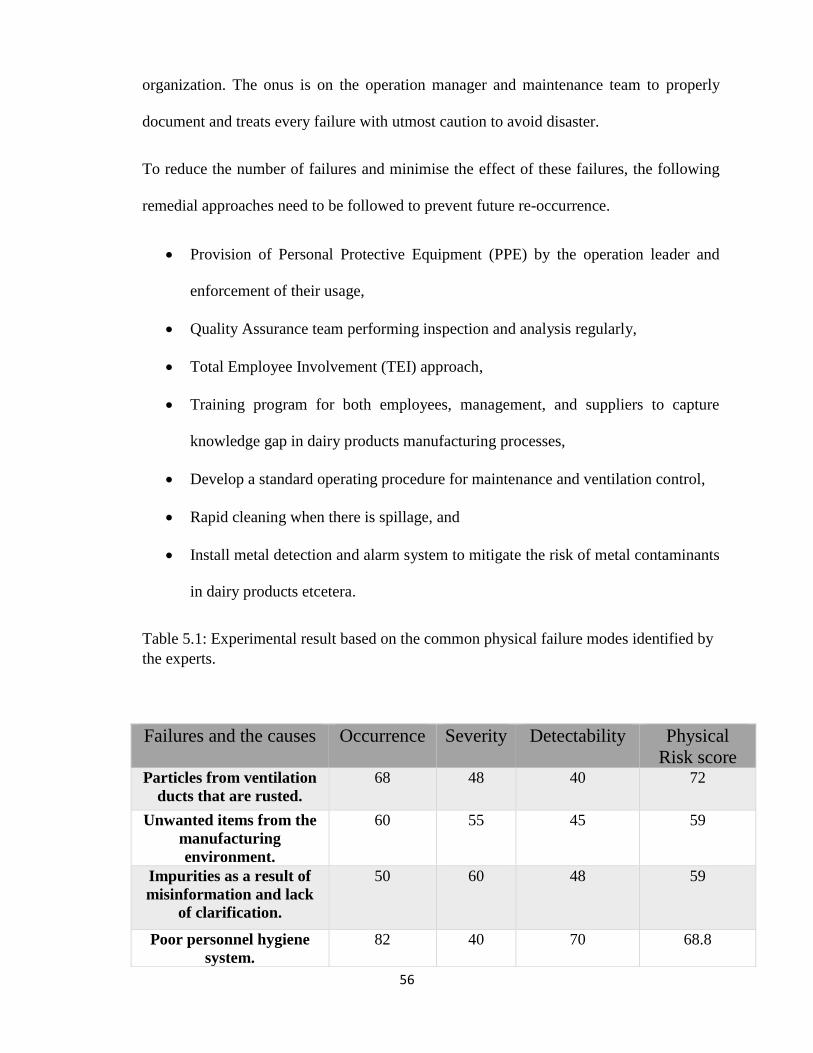
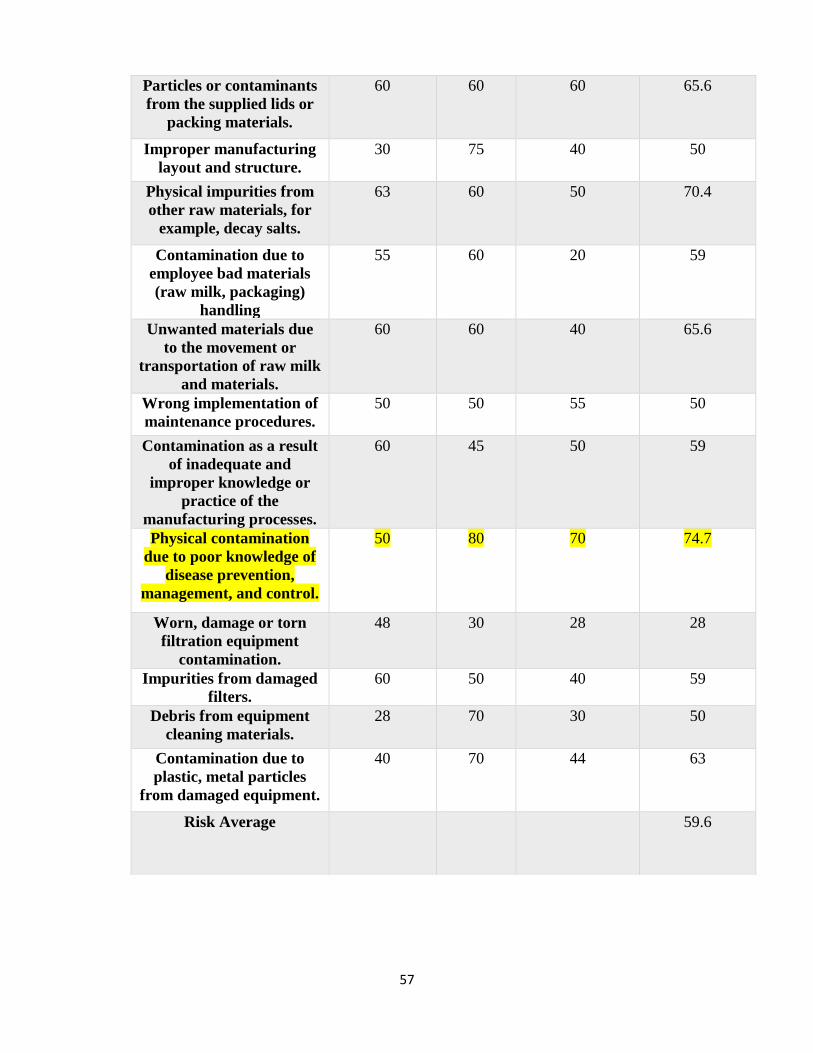
Table 5.2: Experimental result based on the common physical failure modes identified by the
experts. ........................................................................................................................................... 56
Table 5.3: Experimental result based on the common biological failure modes identified by the
experts. ........................................................................................................................................... 59
Table 5.4: Experimental result based on the common chemical failure modes identified by the
experts ............................................................................................................................................ 62
Table 5.5: Experimental result based on the common environmental failure modes identified by
the experts. ..................................................................................................................................... 65
Table 5.6: Experimental Average Risk Level for Company ‘B’. ................................................... 68
Table 5.7: Experimental final output dairy products manufacturing systems risk of company A
versus (Vs) B ranking. .................................................................................................................... 69
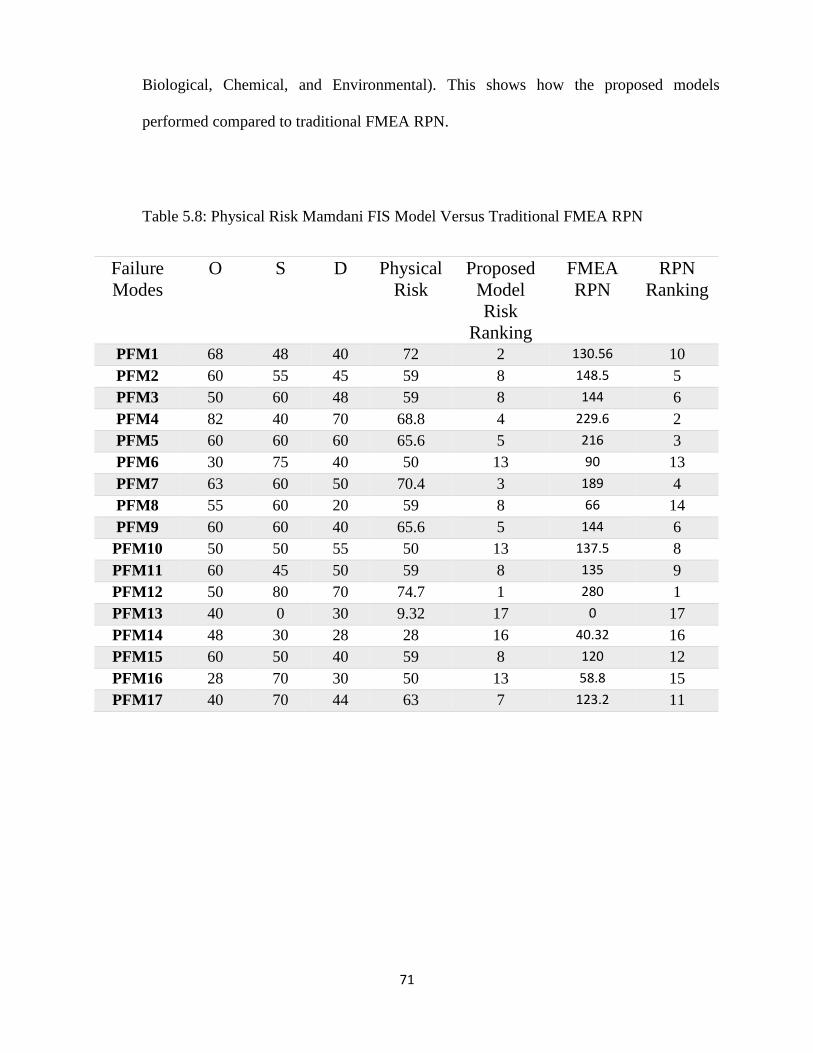
Table 5.8: Physical Risk Mamdani FIS Model Versus Traditional FMEA RPN .......................... 71
Table 5.9: Biological Risk Mamdani FIS Model Versus Traditional FMEA RPN ....................... 72
Table 5.10: Chemical Risk Mamdani FIS Model Versus Traditional FMEA RPN ....................... 73
Table 5.11: Environmental Risk Mamdani FIS Model Versus Traditional FMEA RPN .............. 73
Page 11
ix
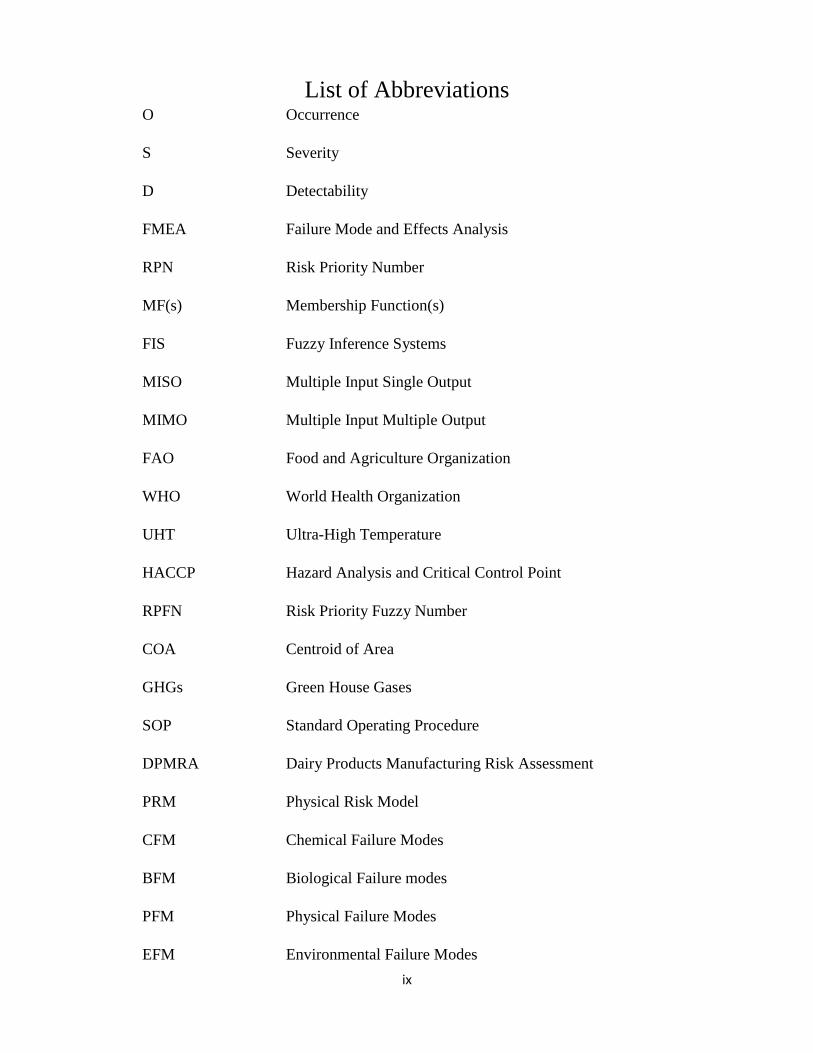
List of Abbreviations O Occurrence
S Severity
D Detectability
FMEA Failure Mode and Effects Analysis
RPN Risk Priority Number
MF(s) Membership Function(s)
FIS Fuzzy Inference Systems
MISO Multiple Input Single Output
MIMO Multiple Input Multiple Output
FAO Food and Agriculture Organization
WHO World Health Organization
UHT Ultra-High Temperature
HACCP Hazard Analysis and Critical Control Point
RPFN Risk Priority Fuzzy Number
COA Centroid of Area
GHGs Green House Gases
SOP Standard Operating Procedure
DPMRA Dairy Products Manufacturing Risk Assessment
PRM Physical Risk Model
CFM Chemical Failure Modes
BFM Biological Failure modes
PFM Physical Failure Modes
EFM Environmental Failure Modes
Page 12
1
CHAPTER ONE: INTRODUCTION
1.0 Overview
The effective and healthy contributions of the dairy products to the modern-day world are
increasing, so the risk associated with it. Dairy products are consumed globally by both the
young ones and the adults (cut across all generations), this high rate of consumption (over
6 billion people) is influenced by powerful market demand for dairy products due to its
benefits.
The effect of high rate of consumption also contributes to the 4% annual increase of dairy
(Milk) production across the globe. Food and Agriculture Organization of United Nations
(FAO) statistics show a steady increase in the dairy products consumption for the past
decades and that continues with the world total dairy production sitting at 805 million
tons in the year 2015. Following this high consumption, investors venture into the
business. Thus, it becomes necessary to understand the production processes as well as
the associated risks.
Devendra (2002) listed some of the benefits of dairy products today; ranging from nutrient
support to the children, socio-economical benefits, to generating income and assets to the
dairy products manufacturers. Milk and milk products contribute highest protein nutrient
for children and second highest for the adults (Food Standard Agency, 2002).
Milk products represent the larger percentile of dairy products and according to FAO, about
150 million households are involved in milk production. Milk is mostly extracted from
dairy cattle, buffalo, goats’ etcetera. Table 1.0 illustrates the percentages of the contribution
of each breed of animal to dairy production. However, raw milk passes through different
Page 13
2
stages of production to reduce fat content in the milk, add diverse vitamins, and destroy any
potentially harmful bacteria before it can be edible or consumed (Chris, 2006). Other dairy
products can be obtained from milk by transforming into products like butter, cheese, and
yogurts.
The manufacturing processes of dairy production entail a cascaded industrial process which
includes extraction, processing, sanitation, storage etcetera. Thus, the need to produce a
highly hygienic final product is required since dairy products are perishable. Kurt and
Ozilgen (2013) explained that contaminated and infected dairy products had and will
continue to cause negative impacts on consumers if the manufacturing processes failures
are not properly studied and accessed.
Table 1.0: Dairy (Milk) World Production by each Dairy Animal (FAOSTAT, 2015)
In 2007, World Health Organization (WHO) reported that little less than 2 million people
lost their lives in 2005 because of diarrheal diseases caused by contaminated foods with
Animals Milk Tons (Million) Percentage
Cow/Cattles 667.3 83%
Goats 16.08 2%
Camels 8.04 1%
Sheep 3.2 0.4%
Buffaloes 104.5 13%
Others 4.88 0.6%
Total 804 100
Page 14
3
dairy products inclusive. These hazardous contaminated foods are causing foodborne
diseases globally (both in emerging market and economically strong markets). Around
8.3% of the universe biological related foodborne disease outbreaks are directly caused by
dairy products (Hassan et al., 2010).
Additionally, over thirteen thousand individuals became ill from sustenance hurting
consequent to eating up polluted dairy products in Japan (Asao et al., 2003). Food Safety
(2012), says 200,000 people in 1985 with 16,000 research focus certified cases contracted
salmonellosis from contaminated dairy products dispersed by a Chicago dairy product
manufacturing plant. According to Centers for Disease Control and Prevention, children
and seniors (65 years old and above) are people with the highest risk of foodborne diseases
if they take unpasteurized dairy products.
A paramount step to minimizing these cases of foodborne diseases is to identify and analyze
the risks associated with dairy products manufacturing from start to finish products. Kurt
and Ozilgen (2013) in their research categorized these risks using traditional Failure Mode
and Effects Analysis (FMEA) Risk Priority Number (RPN) into three categories namely;
Physical, Chemical and Biological failure factors that affect quality assured dairy products
being shipped to the shelves for the human consumption. Their work was marred with many
shortcomings.
Nevertheless, it is challenging to quantify these factors by numbers or build a model
(because of its qualitative form) to know how these factors contribute to failures in dairy
products manufacturing that result in foodborne diseases or finally damage the face of the
organization that produced contaminated dairy products if shipped to consumers.
Moreover, industries are faced with this dilemma of not knowing which failure contributed
Page 15
4
major risk or how to prioritize failures since it is not crisp/numbers. The end results of this
research will help eliminate or minimize these dilemmas.
It is therefore important to implement a tool that can efficiently assess failures or risks more
accurately using linguistic parameters. Fuzzy Logic has proven records of successes in
conquering challenges of data limitation and mechanism internal uncertainty (Jhy-Shing,
1997). The fuzzy methodology is one of the best tools for risk management and risk analysis
in manufacturing industries (Azadegan et al. 2011).
Failure Mode and Effect Analysis (FMEA) was used to identify and document these failures
based on the three criteria which are 1.) Severity: how serious is the failure? 2.) Occurrence:
how often did the failure occur? and 3.) Detectability: how possible is it to detect the failure?
The FMEA procedure is shown in figure 1.0
The proposed novel model uses fuzzy logic, experts’ knowledge and quantitative-based
approach on these three criteria (Severity, Occurrence, and Detectability) defined above
and qualitative methods to provide a highly dependable and complete risk analysis with
values to give meaningful data source for operation manager whenever it’s required.
Page 16
5
Figure 0.0: Failure Mode and Effect Analysis Procedure
The developing nations represent over 60% of the global milk production, which make
them the major producer. In this research, expert’s knowledge and opinions from that part
of the world (developing nations) were used to analyze the risks in dairy products
manufacturing.
1.1 Dairy Products and Its Importance
Dairy products are basically the milk and milk products (Cheese, Dry Milk, Yogurt,
etcetera.). Milk is extracted from dairy animals such as cattle/cow, goats, buffalo, etcetera.
Milk extraction started a thousand-year ago and became more prominent to the daily living
System Identification
and functions
Documentation of
the Failure Mode and
effects analysis
(FMEA)
Identify the root-
cause of the Failure
Know the effects of
the Failure
Failure modes
Identification
Page 17
6
because of its healthy nutrient benefits. Dairy products have been a source of nutrition for
many children’s growth, as well as adults.
1.2 Dairy Products Manufacturing Processes and
Associated Risks
Dairy Products manufacturing systems is a process that involves numerous steps of farm
designs and management practices for manufacturing of milk, cheese, cream, yogurt, and
other milk products (Mongeon and Summerhayes, 2012). The processes include extraction,
grazing, pasteurizing, homogenizing, separation, packaging, and cleaning. The major cause
of these risks in dairy products manufacturing is of human, equipment, material, and the
processes.
Since the system is cascaded, understanding each stage of the process and the failures
associated with that stage will eradicate transfer of issues to the next stage. In this research,
the emphasis was placed on each failure at each stage of operation; because it is critical for
next stage and other stages. In the next chapter, each stage of the manufacturing processes
will be elaborated upon.
1.3 Importance of this Research
Due to high consumption of milk and milk products in the world today, it will be beneficial
to both the consumers and producers of dairy products to trust the products that are being
displayed on the shelves. As a matter of fact, the manufacturing processes of dairy products
for the consumption of human should be implemented through the implementation of
proper quality hygienic control of milk and milk products from start to finish. This goal
will be attained through this research work.
Page 18
7
This research will produce a novel risk assessment evaluation of dairy products
manufacturing systems by Mamdani Fuzzy Inference Systems using these categories
(physical, biological, chemical, and environmental hazards) to address some of the
shortcomings highlighted.
The proposed model will be generic to all dairy products manufacturers irrespective of their
geographic location since the data used is based on real failures in manufacturing practice.
At the end of this work, the results will serve as a resource for manufacturing manager,
maintenance team, and management of dairy products. This research will undermine
failures and risk associated with the dairy products manufacturing to greatly minimize the
risks across all categories.
1.4 Summary and Thesis Outlines
The objective of this chapter is to introduce the dairy products manufacturing, the
importance of dairy products to the society (developed and developing nations), the
manufacturing processes of dairy products, and possible risks associated with the
production of dairy products.
The remaining chapters will cover broader insight knowledge of the literature reviews, the
detailed risk associated with dairy products based on expert’s opinions, proposed research
methodology, result analysis, and conclusion.
Page 19
8
CHAPTER TWO: LITERATURE REVIEW
In this chapter, an overview of a thorough related research topic in dairy products manufacturing
risk assessment using fuzzy was examined to give a wider understanding of the proposed model.
Some definitions will be introduced and some will be emphasized in the following chapters.
2.1 Dairy Products
Milk extraction from animals was first discovered many centuries ago in Asia as a means
of food provision for the family lacking food support. The idea of the lactating animal was
not fully known to the society but was later known when female animals produce sufficient
milk (food) for their offspring. Earlier, animals were used for transportation and clothing
(King, 2017). The innovation of the dairy products (milk and milk products e.g. cheese,
yogurt, cream etcetera.) came later.
Milk and milk products have gone through different phases since it evolved, and the
challenges facing the industry have not been clearly dealt with. There are several issues of
foodborne diseases coming from dairy products as recorded by (Asao et al., 2003). A most
recent multi-state case of listeria that was reported in Pennsylvania was linked to
unpasteurized raw milk. The need to monitor every stage of the manufacturing process
using risk level of each stage thus becomes pertinent.
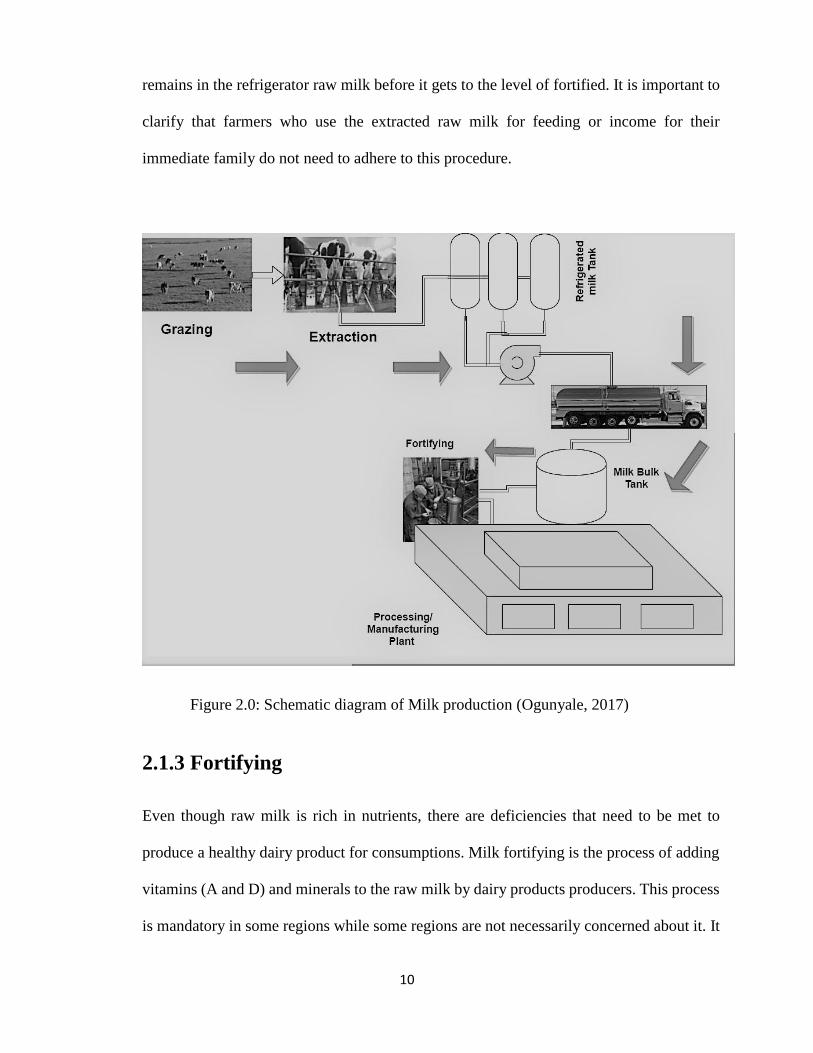
The manufacturing process of the dairy products starts with grazing, milk extraction from
the animals, pasteurizing, separation, homogenizing, fortifying, to packaging and cleaning,
and each stage entails complicated and sophisticated industrial process. Since the study
focused on the failures (risks) of each stage of the process, a brief explanation of each stage
Page 20
9
of the manufacturing processes will be necessary to give adequate understanding before
proceeding further.
2.1.1 Grazing
It is the process of feeding the dairy animal which can either be controlled or uncontrolled.
An uncontrolled grazing gives liberty to the animal to feed in an open pasture. However,
the danger in this approach is that the animals cannot be monitored. On the other hand, a
controlled grazing allows proper monitoring of the animals and produce better output. The
effect of uncontrolled grazing can be poisonous and result in contaminated raw milk during
the extraction. Figure 2.0 shows the schematic diagram of the whole dairy products
manufacturing process.
2.1.2 Milk Extracting from Animals
A process predetermined (once or twice a day) by the farmer to extract (take out) the raw
milk from dairy animals (cows, buffaloes, goat etcetera.). The procedure is carried out by
connecting a glass pipe or steel to the lactating source (breast) of the animal which channels
the raw milk into a refrigerated or unrefrigerated milk tank almost immediately for
preservation. The quantity of the raw milk determines if it is stored in a refrigerated milk
tank or not. Most larger dairy farmers follow this procedure since the processed raw milk
is taken to another stage of the dairy products processes.
This raw milk is then transported by a refrigerated truck to the dairy products processing
plant within a couple of hours of storage in the milk bulk tank (Cavette, 2006). At the
manufacturing site, the transported refrigerated raw milk is subjected to separation process
either by separator or clarifier which remove any particles, bacteria, or dirt present or
Page 21
10
remains in the refrigerator raw milk before it gets to the level of fortified. It is important to
clarify that farmers who use the extracted raw milk for feeding or income for their
immediate family do not need to adhere to this procedure.
Figure 2.0: Schematic diagram of Milk production (Ogunyale, 2017)
2.1.3 Fortifying
Even though raw milk is rich in nutrients, there are deficiencies that need to be met to
produce a healthy dairy product for consumptions. Milk fortifying is the process of adding
vitamins (A and D) and minerals to the raw milk by dairy products producers. This process
is mandatory in some regions while some regions are not necessarily concerned about it. It
Page 22
11
is worth noting that some physicians disagreed with milk fortification since it could be a
source of vitamins overdose. This stage is crucial in the dairy products manufacturing
process for the regions that mandate it because it helps in reducing chemical failures (Jacob,
2015).
2.1.4 Pasteurization
At this stage of the process, the milk passes through heating treatment to increase the milk
lifespan and diminishes the quantities of conceivable pathogenic micro-organisms.
Pasteurization significantly reduces health hazard in milk consumption (FAO, 2017). Smith
(1981) believes that milk pasteurization destroys most disease-producing organism in
liquids. However, a bad handling of the pasteurized milk can result in recontamination.
There are many milk pasteurization methods but the most effective used method is the
Ultra-high temperature (UHT). The higher the temperature level, the quicker the milk is
pasteurized.
2.1.5 Homogenizing
Homogenizing is the reduction of milk particles under extreme condition of pressure,
turbulence, and accelerate the impact to allow it to have a better texture (Dhankhar, 2014).
The milk fat is prevented from separating and floating to the surface as cream and uniformly
distribute the fat in the milk. This process is not applicable to all milk products, but it is
essential to liquid milk production.
2.1.6 Milk Packaging and Cleaning
After all the above procedures have been fully followed, the last stage of the milk and milk
products production is the packaging and cleaning of the equipment. At this stage, the milk
Page 23
12
is packaged in different quantities and batched with the manufacturing date and best before
the date to keep the retailers in balance while shelving the products. The cleaning of the
equipment is done by sterilizing tools used in the process of production to keep a hygienic
facility that is safe for dairy products consumers and the manufacturing personnel.
2.2 Risk Assessment
The aim of risk assessment in any industry or field of life is to swiftly minimize the effects
or consequences of failure. The importance of risk assessment and management in every
area of life is becoming more announced. Risk can be described by the degree of probability
of loss, by the possible amount of loss, and by the magnitude of severity of the effects.
The risk is the product of the probability that contrary event will occur and the severity of
the event after the occurrence. A change to these two components (combination) will result
in a change of the risk values. There are many acceptable approaches to assess or analyze
risk. Many researchers defined risk mathematically (quantitative) using the parameters
mentioned above. (Kaplan et al., 1981; Van Ryzin, 1980) define risk as the product of the
probability of an event to occur and the consequences in value (environmental, physical,
social, and monetary) (equation 2.1). Since risk does not exist if there is no exposure to this
potential hazard.
Risk = Probability of Occurrence × Consequence (2.1)
In manufacturing industries, the risks need to be identified before they occurred and that is
why Failure Modes and Effects Analysis Risk Priority Number (FMEA- RPN) is widely
used in automotive and manufacturing industries. This approach defined risk as the product
of the probability of Occurrence (O) (like-hood), the Severity (S) of the consequences and
Page 24
13
the probability of detecting the failure or risk if happened (Detectability, (D)) (equation
2.2). The value which ranges from 10 (Worse) to 1 (Best) is given to the RPN components
or parameters to calculate the value of the risk (FMEA –FMCEA, 2017).
(Dagsuyu et al., 2016; Yang, 2008; Yang, & Wang, 2015) argued that the quantitative
approach alone is not the best approach to represent the effect of the risk. They proposed a
linguistic term (Fuzzy logic) approach to define and analyze risk.
Risk = Occurrence × Severity × Detectability (2.2)
A combination of qualitative (linguistic term) and quantitative gives a more accurate
representation of the risk consequences according to (Gargama, and Chaturvedi, 2011). The
application of this approach is used for this thesis.
2.3 Failure Modes and Effects Analysis approach for
risk Assessment and management
Failure Mode and Effect Analysis (FMEA) approach in risk assessment is a renowned
approach that has been incorporated in every area of life. FMEA was first introduced by
the aerospace industry in the 1960s and this approach focused mainly to control safety
incidents. FMEA is a system of giving weight value to identified failures based on expert’s
knowledge and the severity or consequence of the failure. Many researchers have used this
approach in almost every field of life.
FMEA assigned value to failures based on the probability of the Occurrence (O) (like-
hood), the Severity (S) of the consequences and the probability of detecting the failure or
risk if happened (Detectability, (D)). O, S and D values usually range from 1 to 10, but in
some cases, different values have been used depending on the user (Renu et al. 2016). These
Page 25
14
values are assigned by the expert and people of insight knowledge of the systems in a
manner that best describe the situation. FMEA is the best good for situations where the
analyst only has qualitative data (linguistic term).
Trafialek and Kolanowski, (2014) ranked food industries (Bakeries) on the level of
conformity and nonconformity. FMEA approach was used in a Hazard Analysis and
Critical Control Point (HACCP) audit on how the company performed based on the
requirements. Point 5 (the maximum) indicate fulfillment of all requirements and point 2
(lowest) for nonconformity to the requirements. The approach enabled food industry to
know which element of their operation pose more risks to food security having compared
two identical bakeries with the same HACCP system.
A knowledge-based system on flexible vehicle components was analyzed using FMEA
(Renu et al., 2016). The researchers used FMEA to identify and document failures and rules
for automobile flexible components which helps the organization in decision-making
regarding these components. A water treatment plant implements FMEA for risk analysis
of water gasification systems used for sludge treatment. The proposed method was done to
reduce the environmental impact of this solid composition sludge waste and develop a way
to operate the system with minimal risk (Adar et al., 2017).
Fuzzy FMEA methodology has a long record of success. Wessiani and Sarwoko (2015)
made use of fuzzy FMEA approach to analyze risk in poultry feed production. The
mechanism allows farmers to identify the potential risks and develop a robust system to
mitigate these risks. They employed the Risk Priority Fuzzy Number (RPFN) to address
the drawbacks of traditional crisp FMEA (RPN).
Page 26
15
Risks are commonly represented in linguistic forms; that is why Yang and Wang (2015)
adopted Fuzzy evidential reasoning FMEA approach for the problematic offshore
engineering systems risk analysis that enabled a constant unified model for cases of random
data, precise data, and opinion based uncertainty.
Mandal and Maiti (2014) proposed a FMEA Fuzzy numerical technique that minimizes the
challenges of crisp (Risk Priority Numbers) FMEA and fuzzy rule-based FMEA
approaches, though the latter gives more risk assessment accuracy. However, Liu et al.
(2013) compared the results of FMEA Fuzzy and FMEA using risk priority number (RPN)
via a literature review of 75 journals. RPN FMEA gives crisp values as output because of
it scalar nature and simplicity (less computational). Nevertheless, Liu et al. (2011) argued
that, in actual sense, risk implications cannot be rightly justified using the product of the
three risk parameters since different arrangements of the Occurrence, Severity, and
Detectability gives the same level of RPN result.
(Gargama, & Chaturvedi, 2011; Yang at al., 2008) also claimed that RPN approach is expert
dependent and that experts face difficulties when quantifying the actual values that
represent the RPN three risk parameters which are O, S, and D. While computing the RPN
results, the importance of each risk parameter is neglected. Fuzzy FMEA approach
addresses these concerns since it is based on linguistic terms (Low, Medium or Average,
High etc.). The Fuzzy linguistic term FMEA was used for this research.
Page 27
16
2.4 Introduction to Fuzzy Logic: Application of Fuzzy
Inference systems in research
Numerous researches have been conducted since Lotfi A. Zadeh first proposed a fuzzy set
theory in 1965, so it would be a challenge if not almost impossible to cover everything. The
objective of this aspect of the thesis is to give an introduction to the concepts of fuzzy logic.
Fuzzy Logic is well-known for its ability to represent situation or event in a more precise
and humanly comprehensible form that has been applicable in addressing complicated
issues which cannot otherwise be expressed using crisp values or numbers.
Fuzzy Logic introduced the reasoning concept Wu (2015) for inconclusive humanly
understandable (linguistic) terms instead of fixed crisp values which have been proven to
lack accuracy and consistency in dealing with many areas of studies except in the field of
mathematics and computer science. Fuzzy Logic depends on the possibility that all things
concede to degrees. Jang (1997) identified that Fuzzy Logic comprises three components;
Fuzzy Sets, Fuzzy Inference Systems (FIS), and Fuzzy Reasoning and Fuzzy Rules.
Mamdani is the most used Fuzzy Inference Systems and this approach was used to evaluate
the risks in dairy products manufacturing.
2.4.1 Fuzzy Set
A Fuzzy Set gives a step-by-step transition from a set belonging to a membership function
or not. Fuzzy Set gives a flexible boundary that is gradual rather than fixed a crisp number
that changes from 1 to 0 or 0 to 1 with the sharp transition (Jang, 1997). A Fuzzy Set is
made up of a degree value between 0 and 1. For example, the value of 1 represents Very
Page 28
17
High Pressure, value 0.8 represent High Pressure, and value 0.3 represents Low-Pressure
etcetera.
There are three fuzzy operators namely; Union or Disjunction, Intersection or Conjunction,
and Complement also known as Negation, which is crucial to a successful implementation
of a Fuzzy operation. A mathematical (equation 2.3) representation of Fuzzy Set as defined
by Jang (1997) introduces the relationship between the fuzzy set and the membership
function (MF), and the definition that states that If Y entails every object assigned in general
by y, then a fuzzy set Z in Y is described as ordered pairs of a set.
Z = {(y, μZ(y))| y ∈ Y } (2.3)
Where 𝝁𝒁(𝒚) is Membership function for the fuzzy set Z with the degree of membership
ranges between 0 and 1 (Jang, 1997). From the above equation, a Fuzzy set is a crisp set
that allows the membership function to have any range of values from zero and one instead
of either 1 or 0. A quantitative, analytical, and reasoning data integrated evenly are
permitted in Fuzzy Logic rule based system (Bocaniala et al. 2004).
Humans express their thoughts by linguistic terms. For example, a man is described as very
tall, tall, short, and very short. These terms are used when describing the height of a man
and each one of the terms are assigned with the degree of membership. For better
understanding, a certain value was allocated to these terms (Very short, Short, Tall and
Very Tall) to describe a man’s height.
• If the height of a man is between 0 and 4, then the man is regarded as Very Short.
• If the height of a man is between 4 and 5, then the man is regarded as Short.
• If the height of a man is between 5.8 and 6.6, then the man is regarded as Tall.
Page 29
18
• If the height of a man is between 6.8 and more, then the man is regarded as Very
Tall.
From this example, it is obvious that the transition is smooth instead of sharp movement
between absolute true to completely false that crisp set always provides. A fuzzy set is
characterized by the membership function (Wu, 2015). Many membership functions have
been implemented globally (Triangular, Gaussian, Trapezoidal, Sigmodal, Generalized
Bell membership functions etc.). The name of each membership function is relatively
related to their shapes and Trapezoidal membership function (trapmf) will be used for the
proposed novel model.
2.4.2 Fuzzy Inference Systems
Fuzzy Inference Systems (FIS) was first introduced in the 1970s when it was used as a
controller for the steam engine based on fuzzy linguistic variables (MathWorks1). FIS is a
fuzzy rule-based system based on fuzzy set theory and reasoning approach (Jang, 1997),
that first convert the input value into a fuzzy value then apply the rules, which later converts
the result into a crisp value. The two majorly used FIS reasoning model is Mamdani and
Sugeno. Mamdani FIS becomes the widely used approach and this approach will be
implored for the proposed model.
Even though these approaches were named after the pioneers, nevertheless, it is important
to emphasize that the approaches use the same basic structure or phases (Fuzzification,
Inference Unit or Engine and Defuzzification) in analyzing Fuzzy Inference systems (Wu,
2015) as shown in figure 2.1 below. In the diagram, it is noticeable that the patterns of the
model are subjected to the need. For example, Multiple Input Single Output (MISO) or
Page 30
19
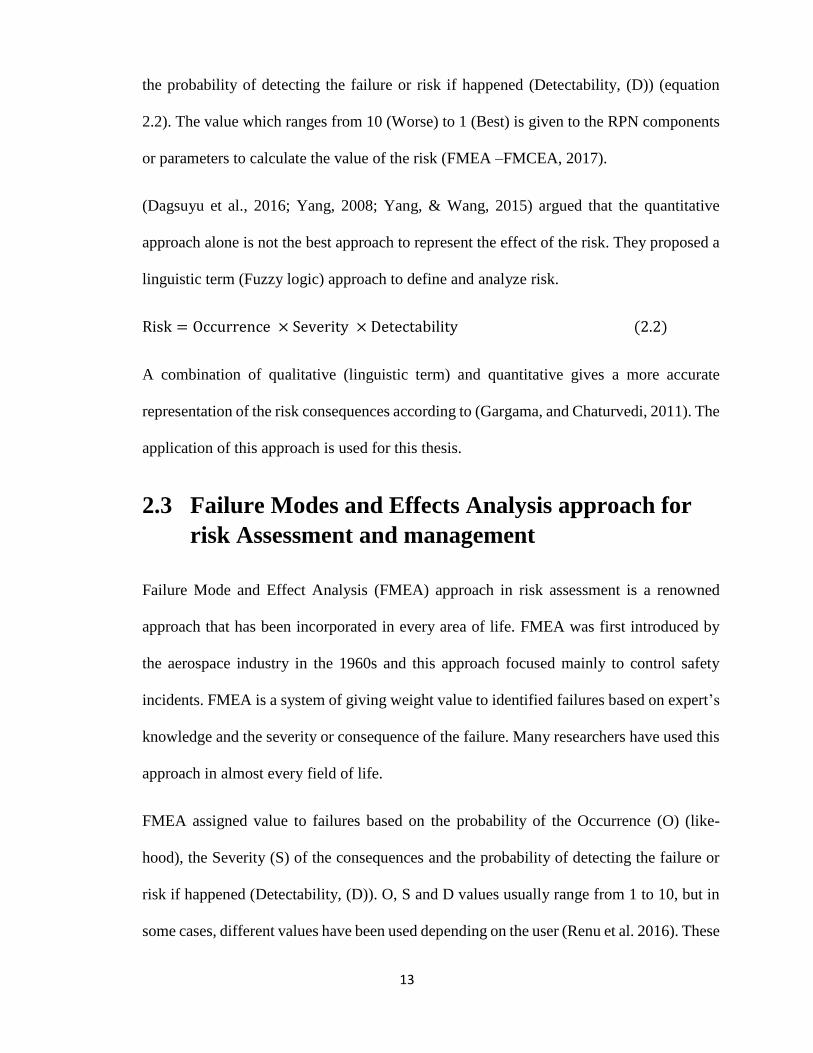
Multiple Input Multiple Output (MIMO) can be employed when designing a Fuzzy
Inference Systems model without compromising the value and quality of the final outputs.
Figure 2.1: Fuzzy Inference Systems Model
2.4.2.1 Inputs
The Fuzzy Inference systems inputs can be crisp values or linguistic terms. The input is
mostly built by the expert based on working models or systems or something new entirely.
A fuzzy output can serve as an input to another fuzzy inference systems model. A single
input, as well as multiple inputs, are allowed when designing FIS input. These inputs are
then passed through fuzzifier.
Page 31
20
2.4.2.2 Fuzzification
Fuzzification stage or phase (fuzzifier) converts crisp input(s) into the fuzzy (linguistic)
values with the support of the membership functions that are matched with the set rules.
The membership functions which ranges between 0 and 1, adopt the range of input values
corresponding to fuzzy linguistic values, that gives the “degree” to which some data is a
part of a set.
The overlap of the membership functions is allowed for a steady interpolation of the input.
Since the Fuzzification is done through the membership functions, the curve that joins the
inputs to the degree of membership is called membership function. Using optimization
approach to filter parameterized membership functions to yield greater output is paramount
when designing a membership function to minimize the human misjudgment (Jang, 1997).
There are many types of membership functions available as mentioned above, and each of
the membership function is well explained by Jang et al. (1997) in their book titled Neural-
Fuzzy and Soft Computing. The most frequently used membership functions by researchers
are Triangular, Gaussian, and Trapezoidal MFs because of their easy computations.
➢ Triangular Membership Function
Triangular MF is described by 𝛼, 𝛽, 𝑎𝑛𝑑 𝛾 parameters. The value of 𝛼 must less than 𝛽 and
𝛽 less than 𝛾; (𝛼 < 𝛽 < 𝛾). The parameters are expressed as follows;
𝑇𝑟𝑖𝑎𝑛𝑔𝑙𝑒(𝑥; 𝛼, 𝛽, 𝛾) =
{
0, 𝑥 ≤ 𝛼.𝑥 − 𝛼
𝛽 − 𝛼 𝛼 ≤ 𝑥 ≤ 𝛽.
𝛾 − 𝑥
𝛾 − 𝛽 𝛽 ≤ 𝑥 ≤ 𝛾.
0, 𝛾 ≤ 𝑥.
(2.4)
𝜶 𝑟𝑒𝑝𝑟𝑒𝑠𝑒𝑛𝑡 𝑚𝑖𝑛𝑖𝑚𝑢𝑚,𝜷 𝑟𝑒𝑝𝑟𝑒𝑠𝑒𝑛𝑡 𝑡ℎ𝑒 𝑝𝑒𝑎𝑘 𝑣𝑎𝑙𝑢𝑒 𝑎𝑛𝑑 𝜸 𝑖𝑠 𝑡ℎ𝑒 𝑚𝑎𝑥𝑖𝑚𝑢𝑚 𝑣𝑎𝑙𝑢𝑒.
Page 32
21
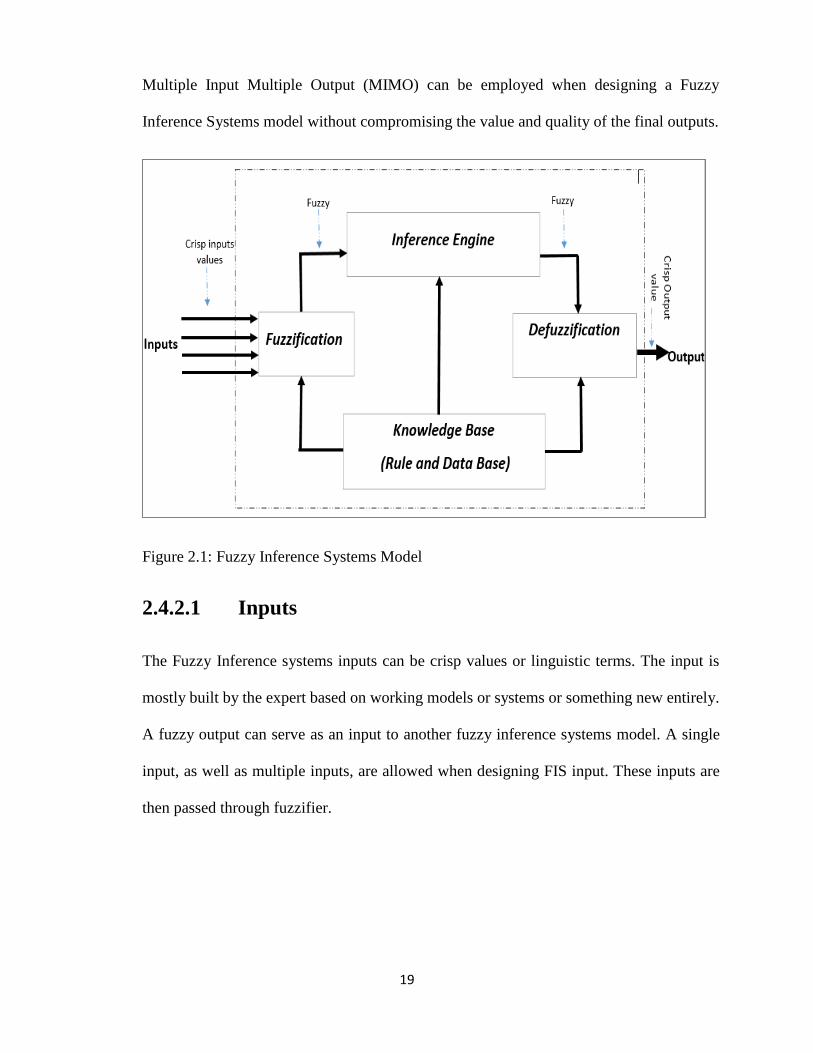
The equation 2.4 can be defined using min and max according to (Jang et al. 1997). Figure
2.2 shows a plot of triangular MF (drawn with MatLab® toolbox).
𝑇𝑟𝑖𝑎𝑛𝑔𝑙𝑒(𝑥; 𝛼, 𝛽, 𝛾) = 𝑚𝑎𝑥 [𝑚𝑖𝑛 (𝑥 − 𝛼
𝛽 − 𝛼 ,𝛾 − 𝑥
𝛾 − 𝛽, 0)] (2.5)
Figure 2.2: Triangular Membership Function with parameter (x;20,40,60)
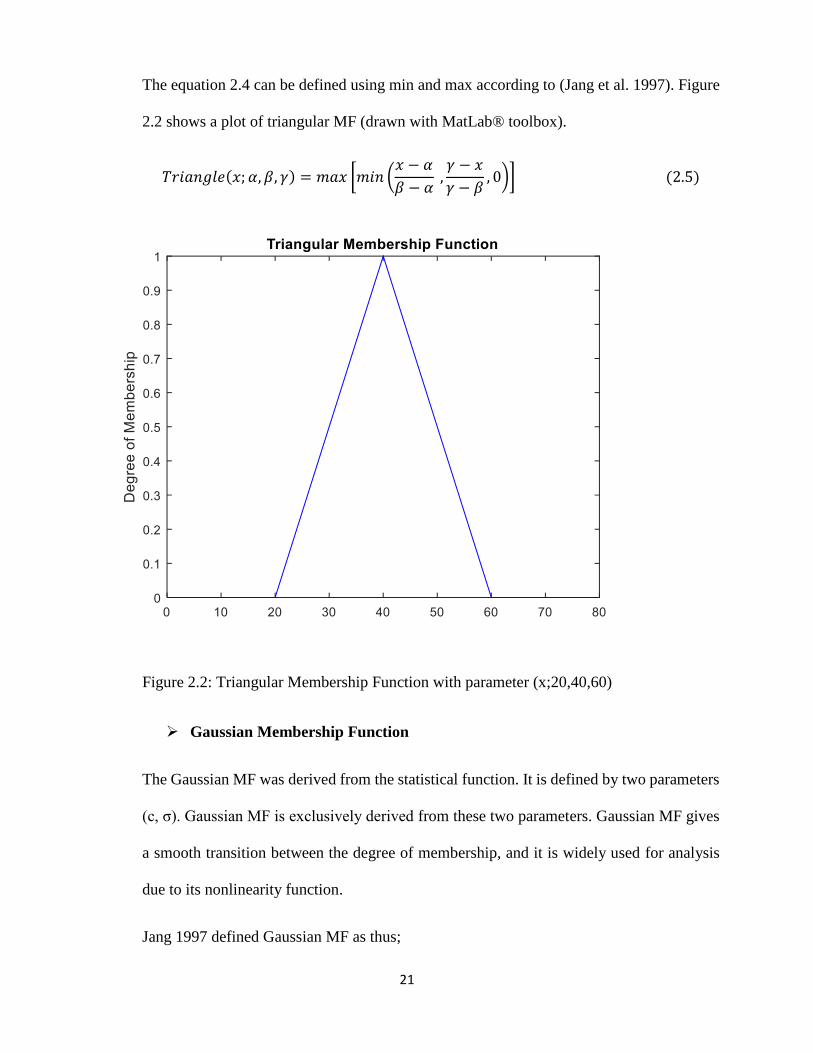
➢ Gaussian Membership Function
The Gaussian MF was derived from the statistical function. It is defined by two parameters
(c, σ). Gaussian MF is exclusively derived from these two parameters. Gaussian MF gives
a smooth transition between the degree of membership, and it is widely used for analysis
due to its nonlinearity function.
Jang 1997 defined Gaussian MF as thus;
Page 33
22
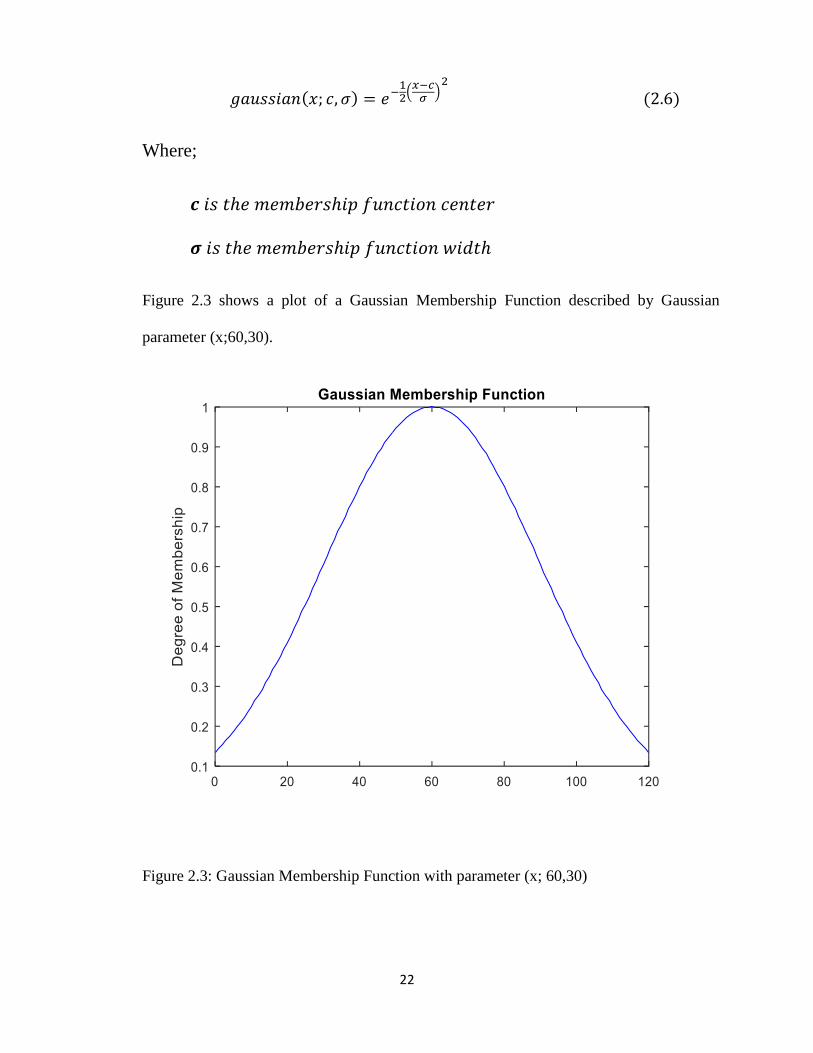
𝑔𝑎𝑢𝑠𝑠𝑖𝑎𝑛(𝑥; 𝑐, 𝜎) = 𝑒−12(𝑥−𝑐𝜎)2
(2.6)
Where;
𝒄 𝑖𝑠 𝑡ℎ𝑒 𝑚𝑒𝑚𝑏𝑒𝑟𝑠ℎ𝑖𝑝 𝑓𝑢𝑛𝑐𝑡𝑖𝑜𝑛 𝑐𝑒𝑛𝑡𝑒𝑟
𝝈 𝑖𝑠 𝑡ℎ𝑒 𝑚𝑒𝑚𝑏𝑒𝑟𝑠ℎ𝑖𝑝 𝑓𝑢𝑛𝑐𝑡𝑖𝑜𝑛 𝑤𝑖𝑑𝑡ℎ
Figure 2.3 shows a plot of a Gaussian Membership Function described by Gaussian
parameter (x;60,30).
Figure 2.3: Gaussian Membership Function with parameter (x; 60,30)
Page 34
23
➢ Trapezoidal Membership Function
Trapezoidal Membership Function has four parameters to describe its MF. Gaussian MF is
simply formulated and computational easy to compute (Jang et al. 1997). Like triangular
MF, it has been implemented for real-time usage. Trapezoidal MF can be defined by two
expressions and all the definitions are based on Jang et al. (1997) book. Trapezoidal MF
can be briefly defined by min and max as thus;
𝑡𝑟𝑎𝑝𝑒𝑧𝑜𝑖𝑑(𝑥; 𝛼, 𝛽, 𝛾, 𝛿) = max (𝑚𝑖𝑛 (𝑥 − 𝛼
𝛽 − 𝛼, 1,𝛿 − 𝑥
𝛿 − 𝛾) , 0) (2.7)
𝑎 𝑙𝑖𝑡𝑡𝑙𝑒 𝑐𝑜𝑚𝑝𝑙𝑖𝑐𝑎𝑡𝑒𝑑 𝑒𝑥𝑝𝑟𝑒𝑠𝑠𝑖𝑜𝑛 𝑜𝑓 𝑡𝑟𝑎𝑝𝑒𝑧𝑜𝑖𝑑𝑎𝑙 𝑀𝐹 𝑖𝑠 𝑑𝑒𝑓𝑖𝑛𝑒𝑑 𝑎𝑠 𝑓𝑜𝑙𝑙𝑜𝑤𝑠;
𝑡𝑟𝑎𝑝𝑒𝑧𝑜𝑖𝑑(𝑥; 𝛼, 𝛽, 𝛾, 𝛿) =
{
0, 𝑥 ≤ 𝛼𝑥 − 𝛼
𝛽 − 𝛼, 𝛼 ≤ 𝑥 ≤ 𝛽
1, 𝛽 ≤ 𝑥 ≤ 𝛾𝛿 − 𝑥
𝛿 − 𝛾, 𝛾 ≤ 𝑥 ≤ 𝛿
0, 𝛿 ≤ 𝑥
(2.8)
From equation 2.7 and 2.8, it is obvious that, to fulfill trapezoid rule, 𝛼 < 𝛽 ≤ 𝛾 < 𝛿 must
be true. A plot of a trapezoidal MF in figure 2.4 with the parameter trapezoid (x; 20, 40, 70,
100) is defined by the parameters graphically. Trapezoidal MF Mamdani FIS is used for
the proposed model.
Page 35
24
Figure 2.4: Trapezoidal MF the parameter trapezoid (x; 20, 40, 70, 100)
These three types were discussed briefly because of their implementations and impartation
in numerous research.
2.4.2.3 The Inference Engine
This is the heart of Fuzzy inference systems and it contains both the rule-based and data
based. It processes the inputs through the rules and the membership members. Further
explanation of the fuzzy rules and reasoning is discussed in the next section.
2.4.2.4 Defuzzification
The last stage of Fuzzy Inference systems is the defuzzification. At this stage, the fuzzy
final output set is converted to crisp values for easy readability and understanding.
Defuzzification method is the stage of combining and weighing fuzzy sets derived from the
Fuzzy Inference Systems (Jang et al. 1997). This process is needed because FIS always
Page 36
25
produces fuzzy sets. For example, when FIS is used as a controller, a crisp output value is
always necessary.
There are five types of defuzzification methods as mostly described by researchers; (1)
Centroid of Area (COA), (2) Mean of Maximum (MOM), (3) Bisector of Area (BOA), (4)
Largest of Maximum (LOM), and (5) Smallest of Maximum (SOM). The defuzzification
methods are shown in figure 2.5. The method selected to defuzzifying the proposed model
is Centroid of Area because of its even distribution of expected probability values, which
make it the most adopted and implemented method of defuzzification (Jang et al., 1997)
Figure 2.5: Defuzzification Methods (Jang et al. 1997)
Page 37
26
2.4.3 Fuzzy Rules and Reasoning
Fuzzy rules and reasoning are sometimes referred to as knowledge-based systems that
comprise the rule base and data base, it is the most integral part of the Fuzzy Inference
Systems. Fuzzy rules are generally expressed as “IF-THEN” rule and it could be expanded
to “If-and/or-Then” depending on the expert’s opinions and reasoning. “AND” and “OR”
operators are used to combining Fuzzy rules.
The rule base holds the learning as a course of action of guideline for the entire system.
Fuzzy rules are developed through human knowledge and expert of the system. It is fair to
say the more understanding of the system an expert has, the better the rules developed to
solve issues related to that system. And the inputs and outputs of a fuzzy inference system
are dependent on the if-then rule set, even though Jang, (1997) argued that the fuzzy rules
might be not applicable in every application because it may not be accurate enough.
The data based aspect of fuzzy inference system provides the required data for both the
Fuzzification and the Defuzzification operation. For example, fuzzy set, the membership
functions, the variable of inputs and outputs etcetera. (Smolova and Pech, 2010). A typical
example of an “IF-THEN” Fuzzy rule can be described as thus; ‘IF the food is great AND
the service is average, THEN the tip is Average’ and it can also be described without the
operator; IF the food is Great THEN the tip is Good. These rules explained the correlation
between Great (Antecedent) and Good (Consequence) which is the output of the Great
(Antecedent) after passing through Fuzzification and Defuzzification (Jang, 1997).
Fuzzy rules can be derived through numerous approaches. However, there are two widely
used approaches (Takagi and Sugeno, 1983). These two approaches are mutually inclusive,
Page 38
27
which gives the most accurate approach to derive the fuzzy rule base (Bowles and Peláez,
1995). The approaches are listed below:
• The opinion and knowledge of the experts
• The process of Fuzzy Mode.
2.5 Mamdani Fuzzy Inference System
Mamdani Fuzzy Inference System produces a fuzzy set output that needs to be defuzzified
to give a crisp value output and the figure 2.5 itemised the types of defuzzification. T-norm
and T-conorm operators are used for Mamdani FIS rather than traditional max-min
composition (Jang et al. 1997). The most common and widely used defuzzification method
is Centroid of Area (COA) and it is employed for the proposed model.
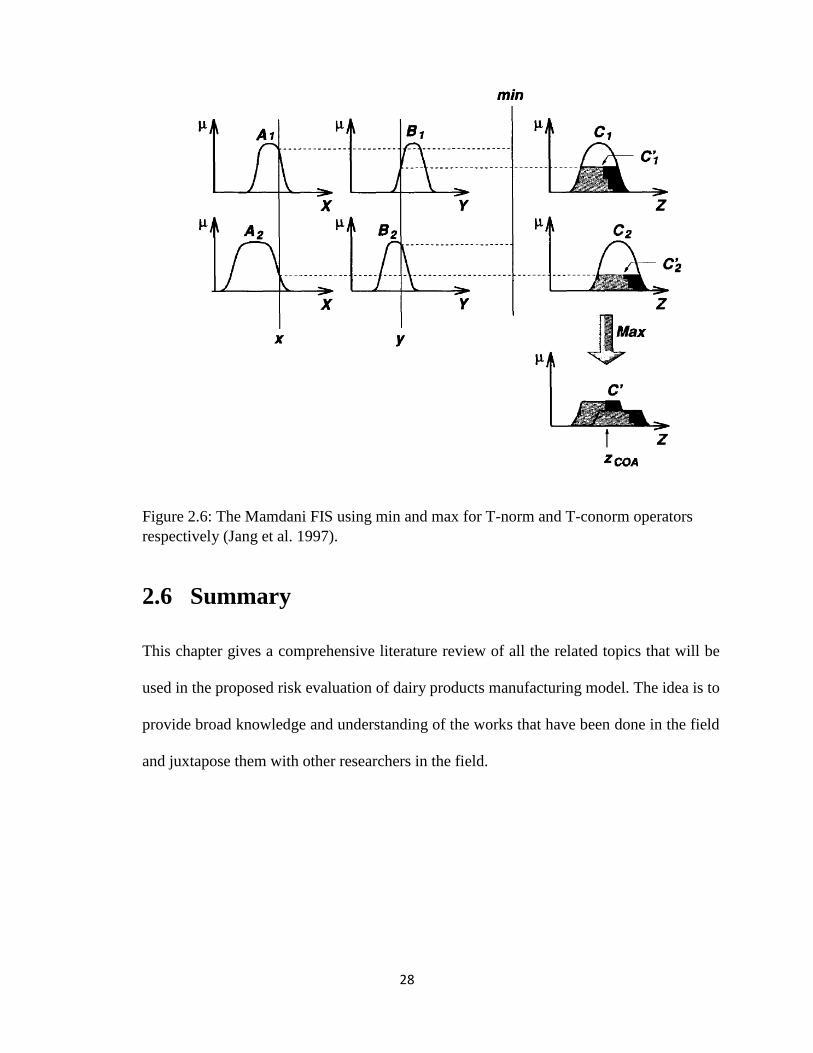
Figure 2.6 described a Mamdani Fuzzy Inference System of two rules with input X and Y
and Z the output. This example diagram uses a defuzzification approach to defuzzify the
fuzzy output to give a crisp final result. The Centroid of Area which is defined by Jang et
al. (1997) mathematically below was used to defuzzify the output.
𝐶𝑒𝑛𝑡𝑟𝑜𝑖𝑑 𝑜𝑓 𝐴𝑟𝑒𝑎 𝑜𝑓 𝑎 𝑍 𝑜𝑢𝑡𝑝𝑢𝑡:
𝑍𝐶𝑂𝐴 = ∫ 𝝁𝑨(𝑧)𝑍 𝑑𝑧𝑍
∫ 𝝁𝑨(𝑧) 𝑑𝑧𝑍
, (2.9)
Where 𝝁𝑨(z) is the aggregated output membership function.
Page 39
28
Figure 2.6: The Mamdani FIS using min and max for T-norm and T-conorm operators
respectively (Jang et al. 1997).
2.6 Summary
This chapter gives a comprehensive literature review of all the related topics that will be
used in the proposed risk evaluation of dairy products manufacturing model. The idea is to
provide broad knowledge and understanding of the works that have been done in the field
and juxtapose them with other researchers in the field.
Page 40
29
CHAPTER THREE: FAILURES/RISKS ASSOCIATED
WITH THE DAIRY PRODUCTS MANUFACTURING
3.1 Overview
In this chapter, the issues and failures associated with dairy products (milk and milk
products) manufacturing processes will be established. The data are based on real data from
the experts in the industries and equal criteria are given to each failure that is ranked based
on knowledge and expert’s opinions. Even though (Gargama and Chaturvedi, 2011; Yang
et al., 2008) have argued the bias nature of giving criteria weight to failures by experts,
which sometimes may not truly represent the true state or extent of the issues or failures,
the proposed model will help reduce the effect of double standard (biases) in allocating
weight to failures due to its novel approach of running each failure through different stages
before prioritizing it.
The itemized failures are grouped into four categories as mentioned in the introduction
3.1.1 Physical Failure Factors
The interaction of human on the equipment in the processes is regarded as physical failures.
The actual cause of these failures could be as a result of inadequate hygiene of the
personnel, lack of industrial environment experiences, and employee attitude to the
manufacturing processes which is paramount to safe operating procedure etcetera. The
physical failures which were addressed based on expert’s knowledge are highlighted as
follows:
• Particles from ventilation ducts that are rusted,
• Unwanted items from the manufacturing environment,
Page 41
30
• Impurities due to misinformation and lack of clarification,
• Poor personal hygiene system,
• Particles or contaminants from the supplied lids or packing materials,
• Improper manufacturing layout and structure,
• Physical impurities from other raw materials, (for example decay salts),
• Contamination due to employee’s bad materials (raw milk, packaging) handling,
• Unwanted materials due to the movement or transportation of raw milk and
materials,
• Wrong implementation of maintenance procedures,
• Contamination due to inadequate and improper knowledge or practice of the
manufacturing processes,
• Physical contamination due to poor knowledge of disease prevention, management,
and control,
• Worn, damaged or torn filtration equipment contamination,
• Impurities from damaged filters,
• Debris from equipment cleaning materials, and
• Contamination due to plastic and metal particles from damaged equipment.
The above-listed failures are in correlation with what Kurt and Ozilgen (2013) discovered
in their publication that was based on a seven-year industrial audit on six dairy products
manufacturers in Turkey and this journal served as a great resource to this research. Their
identified failure modes were used as a starting point to get more from the organization
discussed in the later chapter.
Page 42
31
3.1.2 Biological Failure Factors
Due to its nutrient and perishable nature, the dairy products are prone to micro-organisms
during and after the manufacturing process. Manufacturing processes of dairy products
normally endangered through poor raw materials handling, storage of the raw milk etcetera.
The following failures listed below are generally common biological failures in the dairy
products manufacturing:
• Micro-organisms pathogenic from the water.
• Micro-organisms pathogenic in the milk from an unhealthy dairy animal.
• Improper handling of the raw milk during and after receiving contribute to the
micro-organisms decay.
• Contamination from poor operation/manufacturing procedures.
• Microbiological contamination due to packaging materials.
• Microbiological contamination due to an inconsistent temperature within the
operation and the transportation of both raw or/and finished products.
• Pathogenic bacteria caused by lack of proper covers sealing practices.
• Microbial growth from insufficient cleaning of the machinery.
• Pathogenic contamination due to the environment.
• The time delay in the manufacturing processes resulted in the pathogenic
microorganisms growth.
• Wrong cleaning tools for right job microbiological contamination.
• Limited quality feed of the dairy animals.
• Microbiological contamination caused by improper handling of the milk.
Page 43
32
• Microbial growth due to bad equipment use for storage.
• Micro-organisms contaminations due to poor knowledge of food hygiene, milk
handling by the dairy farmers.
• Poor pests control pathogenic microorganisms contamination e.g. flies, bugs
etcetera.
• Microbial growth from unregulated raw and finished products storage condition.
• Microbiological contamination caused by wrong storage temperature.
• Pathogenic micro-organisms from the products mismanagement, and
• Contamination due to poor shelves management.
These failures represent what is it obtainable in the operation chain of the dairy products
and it is common to almost all the manufacturing systems.
3.1.3 Chemical Failure Factors
If not properly managed, the addictive or chemical used during the manufacturing processes
could result in failures or risks to both the manufacturer and the consumers. In dairy
products manufacturing, the following chemical failures factors are itemized and they are
based on the experience of the experts and some publications.
• Chemical residues caused by raw milk adulteration,
• Chemicals movement to-fro packaging resources,
• Toxic fungi in raw milk caused by contaminated dairy animal feed,
• Chemical contamination from wrong education in dairy agricultural practices,
• Residual chemical contamination from equipment and tools through improper
cleaning (detergent, chemical etcetera.),
• Metal contamination due to storage materials,
Page 44
33
• Chemical contamination due to mislabeling of containers,
• Contamination due to contaminated animal feed (solid and liquid),
• Direct and indirect heavily preservative chemical usage,
• Metal remnants from water used in the manufacturing processes, and
• Chemical remnants due to inappropriate veterinary medicines administer.
Kurt and Ozilgen, (2013) explained that all these potential failures required proper handling
and management to control the quality of the finished products available on the shelves for
the consumers.
3.1.4 Environmental Failure Factors
The environmental crisis is the most controversial aspect of the twenty-first-century
manufacturing systems. Many organizations and governments have been restricted by the
obligations and laws of the regions in which they operate. Like every other industry, dairy
products manufacturers are concerned about the effect of their operations on the the
environment and as well as the potential risks faced by the industry if they failed to optimize
their systems to conform with the regulations, which may result in the closure of the
business or high capital investment to correct this failure.
The highlights below show the environmental failures based on the opinion of the experts
in the field;
• Lack of proper environmental education (training) by the top management,
operation managers, and operators,
• Land use change release Green House Gases (GHGs) to the atmosphere,
Page 45
34
• Improper manufacturing processes e.g. using wrong processes parameters during
the manufacturing,
• The effect of waste disposal after production causes the reduction in the level of
production,
• High-energy consumption during the dairy products production,
• High power/electricity consumption for the finished products storage (Shelve
refrigerators), and
• Dairy animals waste disposal.
The inability to properly manage these failures could endanger the existence of the failed
industry or cause excessive capital spending to bring the operation back to acceptable
operation level.
3.2 Summary
In this chapter, commonly experienced failures or risk factors in dairy products
manufacturing systems were introduced. These failures are based on the experts’ opinions
and knowledge. It is important to emphasize that many of these failures are in line with
what Kurt and Ozilgen (2013) discussed in their publication of a seven-year industrial audit
data from different dairy products manufacturers in Turkey.
Page 46
35
CHAPTER FOUR: RESEARCH METHODOLOGY
4.0 Introduction
The importance of risk associated with dairy products manufacturing or processes cannot
be overemphasized; and so, as the unique contribution of the dairy products to the society
and the economy, as a result of massive demand or usage of the dairy products in day-to-
day human consumption. This work proposed a noble Mamdani FIS approach for Risk
evaluation of dairy products manufacturing systems that will mitigate the risks and
challenges in dairy products manufacturing.
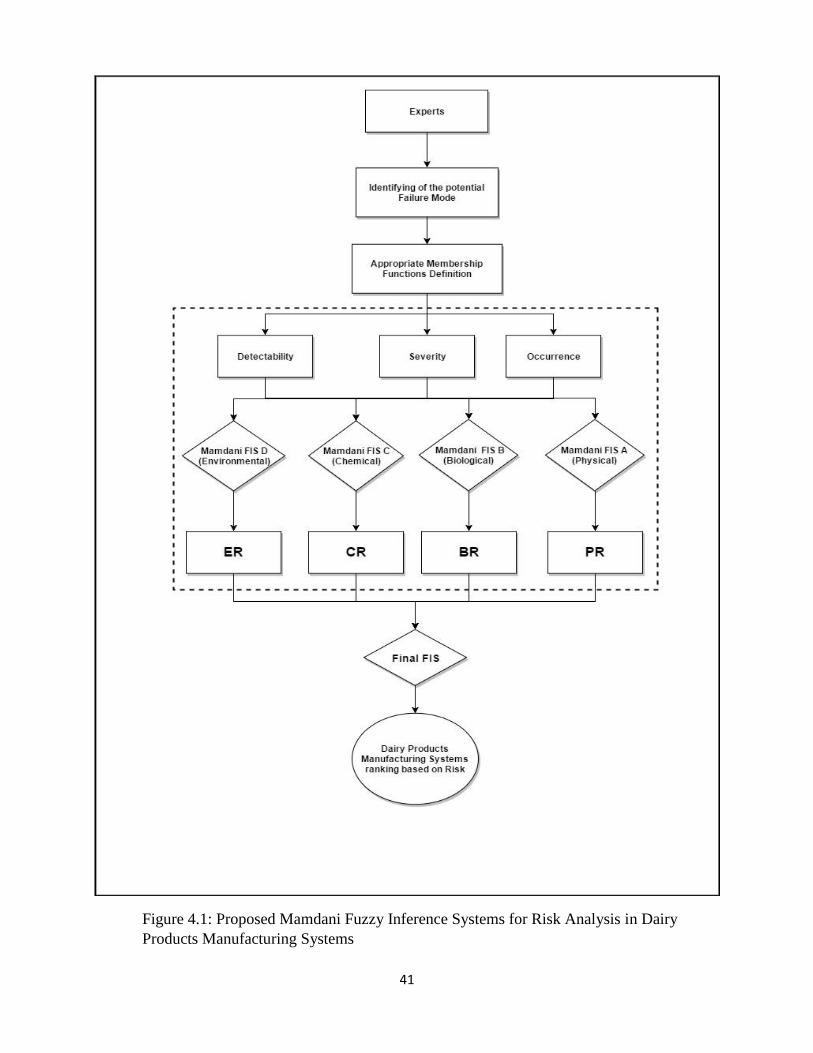
The proposed model is implemented by two-stage five-FIS systems. The first stage (consist
of four FISs) analysis of dairy products risks using the FMEA criteria (Occurrence, Severity
and Detectability) with expert’s knowledge and opinion, the output of each one of the
Physical, Chemical, Biological and Environmental Failure as described in chapter 3 in the
first stage will be fed as input to the final stage FIS, where the final manufacturing system
ranking is done. In the planning of a manufacturing system, it is of the best interest of
operation, maintenance, and plant managers to identify potential failures and develop a
Standard Operating Procedure (SOPs) before diving into any task.
In the FMEA approach, the criteria connected to model or evaluate a criticality of the failure
mode of an item is the seriousness, severity or consequences of the failure impacts, its
recurrence of the event (Occurrence) and the probability that the proposed solution will
capture the envisaged failures when it happens. The interpretations and the ranking of the
factors are based on expert opinion and knowledge and likewise the RPN analysis definition
that has been adopted by many researchers.
Page 47
36
The parameters are defined and ranked based on FMEA methodology to give equal weight
to all the criteria. It is important to emphasize on the drawbacks of traditional FMEA. The
traditional FMEA methodology uses the output of RPN (i.e. the product or multiplication
of the Occurrence, Severity, and Detectability) to rank level of risk of a process
(manufacturing or other processes), which is not appropriate since the different
arrangement of the criteria will give the same results, with different risk consequences
(Narayanagounder and Gurusami 2009). Traditional FMEA RPN approach ignores
different opinions and ideas of the experts and performs better only in safety evaluation
while depleting the quality and environmental impacts on the systems. The proposed model
using fuzzy inference system will eradicate this shortcoming of traditional FMEA RPN
methodology.
The tables below indicate the variables for a linguistic term which define the term factors
and as well as the range to classify the level of the risk. These tables also serve as a reference
point to define the membership function for the proposed model. The range between 0 and
100 are used for easy understanding of the output result so that each person can understand
the results irrespective of their educational level or understanding.
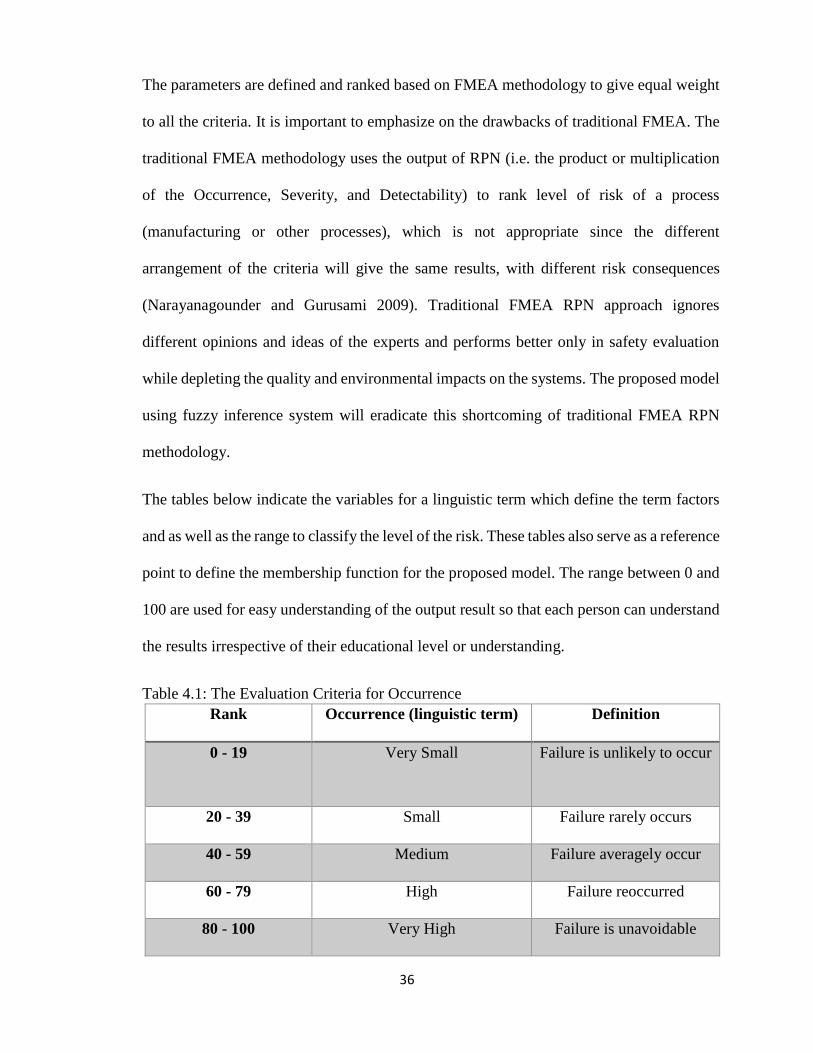
Table 4.1: The Evaluation Criteria for Occurrence
Rank Occurrence (linguistic term) Definition
0 - 19 Very Small Failure is unlikely to occur
20 - 39 Small Failure rarely occurs
40 - 59 Medium Failure averagely occur
60 - 79 High Failure reoccurred
80 - 100 Very High Failure is unavoidable
Page 48
37
The occurrence is the number of unforeseen failures during production to the final
consumers, which are ranked based on failure like-hood or probability (Narayanagounder
and Gurusami 2009). The frequency of the failure mode is defined by the linguistic terms
and the values range as shown in the above table 4.1
Table 4.2: The Evaluation Criteria for Severity
Rank Severity (linguistic
term)
Definition
0 - 19 Very Small The impact is very
minimal
20 - 39 Small IF occurs, the impact on
consumption is minimal
40 - 59 Medium If occurs, the impact on
consumption is moderate
60 - 79 High If occurs, the impact on
consumer is enormous
80 - 100 Very High If occurs, the impact on
consumption is
detrimental
Page 49
38
The above table 4.2 shows the evaluation criteria used to rank failure severities and the
corresponding linguistic terms. Severity is evaluated with respect to the seriousness (how
enormous the consequences are) of the effect of the failure mode of a manufacturing process
or the consumers. According to Ravi Sankar and Prabhu (2001), the major yardstick used
to determine the severity of a failure is the outcome effects on the users or consumers of
the final products.
Detectability is the evaluation of the robustness of the proposed model capacity to
distinguish a manufacturing or process’s likely shortcoming before it is released to the
consumers (Ravi et al. 2001). It is a method of checking and balancing a system to give the
desired result. The table 4.3 below indicates the evaluation criteria used for detectability
ranking and the linguistic terms.
Table 4.3: The Evaluation Criteria for Detectability
Rank Detectability (linguistic
term)
Definition
0 - 19 Very High Systems almost certain to
detect failure
20 - 39 High Systems have a better
chance to detect failure
40 - 59 Medium Systems may detect failure
60 - 79 Small Systems may not detect
failure
80 - 100 Very Small Systems very likely will not
detect failure
Page 50
39
The conventional risk assessment and analysis adopted a mathematical (crisp) approach for
the risk analysis and assessment. However, many researchers have argued the accuracy of
the output results because of its lack of knowledge and opinion of the experts which makes
it less intrigued because of the lack of in-depth knowledge of the system. However, the
proposed noble Mamdani FIS approach for Risk evaluation of dairy products
manufacturing systems adopts the knowledge and opinion of the experts, intelligent system
and mathematical methods.
4.1 Dairy Products Manufacturing Risk Assessment
Model
Dairy Products Manufacturing Risk Assessment (DPMRA) model is implemented by two-
stage five FISs systems. First stage (consist of four FISs) analysis dairy products risks using
the RPN FMEA criteria (Occurrence, Severity, and Detectability) and fuzzy inference
systems. The output of each one of the Physical, Chemical, Biological and Environmental
Failures is fed into manufacturing systems ranking based on risk Mamdani Fuzzy Inference
Systems as input to give a comprehensive and decisive benchmarking performance ranking
of the dairy products manufacturing systems. Figure 4.1 shows the schematic diagram of
the proposed model and methodology.
The first step of this model required the opinions and inputs from the experts in identifying
the failure modes, assign the linguistic terms corresponding to each case of the failures in
the system based on their occurrences, severities, and degree of detection if the failure
occurs. The membership functions (MFs) are assigned appropriately based on the linguistic
Page 51
40
terms defined by the experts, these linguistic terms were used to design the MFs of the
proposed models.
As illustrated in Table 4.1, 4.2, and 4.3, the evaluation criteria used in the proposed model
follows the sequence of the traditional FMEA (O, S, and D) in the ranking of the linguistic
term and the MFs evaluation of the failures. Since the approach adopted a fuzzy based IF-
THEN rules, the Fuzzy Logic toolbox (Mamdani Fuzzy Inference System) and MATLAB
Graphic User Interface were used to design the proposed model, to simulate, and to assess
and analyze the risks in dairy products manufacturing systems.
The experts were an important component of this work, however, their knowledge and
opinions are limited to identifying the failure modes for each category and provided
information on the occurrence, severity, and detectability of those identified failure modes.
The experts were formed based on their in-depth knowledge of the manufacturing system
and a total of six (6) committee is appropriate for a medium problem. The committee
(experts) includes the Operation manager, Maintenance manager, two (2) Senior Operators,
and two (2) Line leaders (Supervisors).
Page 52
41
Figure 4.1: Proposed Mamdani Fuzzy Inference Systems for Risk Analysis in Dairy
Products Manufacturing Systems
Page 53
42
This proposed model incorporates the opinion of the experts and their knowledge,
quantitative risk assessment (mathematical), and Fuzzy methodology to give an easy to read
and understand the output. These are the parameters used in designing the mechanism
Fwhich gives better results than the traditional RPN FMEA approaches. As indicated
above, MATLAB and Fuzzy Logic toolbox were adopted because of the interface that is
easy to compute. This mechanism allows input of different sets which the outputs are based
on proposed model methodology. Some of the importance of this research are;
1. This noble model proposed a risk evaluation of dairy products manufacturing
system for risk ranking and prioritizing,
2. It analyses dairy products manufacturing systems for benchmarking, which reduces
cost of operation because of less second guesses in the operation, and
3. The proposed model result is general and applicable to any dairy products
manufacturing systems.
As shown in the schematic diagram (Figure 4.1), the model comprises five Mamdani Fuzzy
Inference System Models namely; Physical Risk model, Biological Risk model, Chemical
Risk model, Environmental Risk model, and Dairy Products Manufacturing Risk
Assessment (DPMRA) model.
4.1.1 Mamdani Fuzzy Inference Systems Approach for Physical
Risk Model
Physical Risk Model (PRM) is proposed to analyze the risks (effects) of human interaction
with manufacturing systems. Most potential physical risks are due inadequate hygiene of
the personnel, lack of industrial environment experiences, and employee attitude to the
manufacturing processes which is paramount to the safe operating procedure as defined
Page 54
43
above. Although some failures or risks are inevitable, this model will help identify those
risks and mitigate against it. The frequency of a failure should prompt a better fit to mitigate
or contain it using Kaizen method of lean manufacturing. In this work, the commonly
experienced failures will be used to evaluate the physical risk and these failures are
provided by the expert. PRM uses FMEA criteria (O, S, and D) as inputs and the output is
Physical Risk (Figure 4.2). The O, S, and D inputs factor-in a Five-level (Very Small,
Small, Medium, High, and Very High) and the output (PhysicalRisk) a Five-level (Minor,
Low, Moderate, Important, and Very Important) trapezoidal membership function with 125
expert-driven IF-THEN rules as shown in Appendix A.
Figure 4.1: Mamdani Fuzzy Inference Systems Approach for Physical Risk Model
Page 55
44
The input variables O, S, and D membership functions are defined evenly (equal weight)
as well as the output to give equal meaning to the model (Figure 4.3). Each of the first Four
Sub-Mamdani Fuzzy Inference Systems is designed using this approach. It is important to
state here that the rules of each model are different since the consequences also differ.
Figure 4.2: Membership Function Definitions for both input variables and the Output
(Risk).
The failures highlighted in chapter 3 are passed through this model to get some crisp values
as an output (PhysicalRisk) after the defuzzification.
Page 56
45
4.1.2 Biological Risk Mamdani Fuzzy Inference Systems Model
The Biological Risk Mamdani Model consists of the FMEA mathematical functions which
are assigned by the experts and the Mamdani FIS. The Biological Risk Mamdani FIS model
contained a three-input based on the mathematical function associated with the failures
defined in chapter 3 and these inputs are fed into the Mamdani FIS engine to give Biological
risk crisp values. The dairy products are prone to micro-organisms danger during and after
manufacturing, because of raw materials handling, storage of the raw milk, etcetera.
Figure 4.1: Biological Risk Mamdani FIS model schematic.
The initial stage of this model requires the experts to identify the potential failure modes in
dairy products manufacturing processes, which is then computed mathematically using
FMEA approach. The failures are assigned scores between 0 and 100 by the experts. The
values assigned were based on experts’ experience and knowledge.
Page 57
46
The Occurrence, Severity, and Detectability are the Fuzzy inputs. The input values are
derived from the like-hood probability, the severity of the consequences due to the failure
and the degree of detecting the failure when it occurs. It is important to state that the values
assigned to each failure were inspired by the opinion of the experts based on their exposure
to the manufacturing system and failure log book. These values can be changed by the
experts if the conditions to which this model was designed changes to match the current
condition.
The three input variables with five MFs attribute are then fed into the Mamdani FIS. The
output (Biological Risk which is classified as Minor, Low, Moderate, Important, and Very
Important) was derived using the three input variables which are calculated using the IF-
THEN built-in Fuzzy rule. The Fuzzy output will then defuzzified to give crisp values as
outputs for better understanding. A total of 125 fuzzy rules were deduced as a result of 3
inputs and five trapezoidal MFs (5*5*5) as shown in Figure 4.3. The IF-THEN rules are
given in Appendix B.
Page 58
47
Figure 4.2: Biological Risk Mamdani Fuzzy Inference Systems Model Fuzzy Interface
4.1.3 Chemical Risk Mamdani Fuzzy Inference Systems Model
A Chemical Risk model approach using Mamdani fuzzy inference system is fundamentally
used by both the fuzzy model of the process and the knowledge of the expert and their
opinions Bowles and Peláez (1995) to give a robust output.
Although the approach is like Biological risk model in designing, however, the fuzzy rules
were defined differently because of their different consequences. Figure 4.5 shows the
fuzzy interface of the proposed model to analyze chemical risks associated with dairy
products manufacturing processes.
Figure 4.1: Chemical Risk Mamdani Fuzzy Inference Systems Model Fuzzy Interface
Page 59
48
4.1.4 Environmental Risk Mamdani Fuzzy Inference Systems
Model Environmental Risk/Impact analysis is nowadays required by every organization with no
exception to dairy products manufacturing. There are many tools available to evaluate the
consequences for the risk or impact on socioeconomic, human health, and bio-geophysical.
Ramanathan (2001) used the analytic hierarchy process for the environmental impact
assessment (EIA), One major challenge of the EIA approach is the multidimensional
complexity process (Economic, Social, Political, and Biological impacts data are collected
Marttunen and Hämäläinen (1995) which makes the EIA implementation unsatisfactory
(Moon, 1998).
The most intriguing part of this approach is that it uses quantitative, qualitative, and
required the expert knowledge. However, the proposed Environmental Risk Mamdani FIS
model required qualitative and expert opinions. The assessment of environmental risk or
impact is the consequences of implementing the by-law agreement, plans, and policies set
by the government legislators, which is problematic due to the numerous stakeholders.
In figure 4.6, the procedure for the proposed model is itemised. This procedure was used in
designing the Mamdani FIS and fuzzy rules-based on expert’s knowledge and the opinions
of stakeholders. A fuzzy approach to evaluating the environmental risk/impact is less
problematic and the results are easy to read and understand.
In dairy products manufacturing, the environmental issues are complicated due to the
cascaded processes that cut across the dairy farmers to final products on the shelves. That
said, the proposed Mamdani FIS is easy to use and play with since the expert and
stakeholders opinion have been factored in, while in turn determine the rules. The
Page 60
49
environmental risk is subject to three important elements namely; Exposure, Receptors, and
the Contaminant.
Figure 4.1: Environmental Risk Mamdani Fuzzy Inference Systems Model
Page 61
50
4.2 The Final Stage of the proposed Model
At this stage, the analysis of the physical, biological, chemical and environmental risks has
been done to get the crisp value outputs that are fed into the final Mamdani Fuzzy Inference
Systems Engine as shown in figure 4.7. These new inputs are fuzzified to fuzzy inputs, that
calculates the degree of membership in each input class. Then the fuzzy inputs are evaluated
utilizing fuzzy logic operators and the fuzzy rule base to classify the degree of membership
within the bracket of the risk and the risk level of the failures. The prioritization of the
failures is given through the defuzzified fuzzy output that produced crisp values.
The objective of this model is to capture every area of the manufacturing processes and the
risks posed by each phase of the process to effectively rank dairy products manufacturing
system based on risk.
Figure 4.8: Risk Analysis in Dairy Products Manufacturing Systems Mamdani FIS interface
Page 62
51
4.3 Summary
This chapter presented the proposed model to analyze risks associated with dairy products
manufacturing system. The model consists of a FIVE-Mamdani FIS to give a reliable and
optimum risk ranking in order to channel resources appropriately. The first stage considered
the physical, biological, chemical, and environmental failures (FIS A – D) are based on the
highlighted failure modes by the experts and the results of the first stage then serves as
inputs to the second stage (Final FIS) to give the final ranking of the dairy products
manufacturing systems based on risk.
The next chapter discussed the experimental results of the identified failure modes by the
experts which were based on the Fuzzy Inference System methodology. The proposed
model and results were simulated using MATLAB Fuzzy Toolbox.
Page 63
52
CHAPTER FIVE: RESULTS AND DISCUSSION
In this chapter, the experimental and simulated results from the proposed two-phase
Mamdani Fuzzy Inference Systems model is derived and discussed. The result from each
stage is discussed and analyzed in the later part of this chapter. At each stage of the model,
the procedures of mitigating or containing the risks are suggested to help the operation
managers to ease up the burden.
All the results are derived based on the proposed Mamdani FIS model using MATLAB
Mamdani Fuzzy Inference Systems toolbox. As discussed in chapter 4, the fuzzy rules are
in the Appendix A-E.
The finished products of dairy products pass through many processes to make it consumable
for the consumer. Thus, making the consumers the paramount element to consider during
the processes. Although many approaches have been explored to get to the root-cause of
these failures associated with dairy products manufacturing that may affect the intent
consumers (which cut across all generation due to dairy products nutrient benefits), this
research analyzed the risk of the failure modes in dairy products manufacturing to provide
a well improved failure ranking will which result in proper channelling of resources to the
most important failures which will in turn reduce operation cost, rework time, extract
information about risks to mitigate such failures in the future, and most importantly yield
safe dairy products to the consumers.
Occurrence, Severity, and Detectability were used as the fuzzy inputs to the first Four FISs
(FIS A-D) to analyze the failure modes in each category (Physical, Biological, Chemical,
and Environmental) and give outputs of each risk level. The defuzzified outputs were then
used as inputs to the second phase FIS to rank the dairy products manufacturing system.
Page 64
53
At this stage, the process can be repeated to see if there will be changes in the output results
before fed into the second phase (final FIS). In the experimental result, the system went
through two iterations and the results were the same as long as the inputs remained the
same. The final outputs are then used to develop a countermeasure on how to correct and
improve the failures through the result implementation. The risks (results) were ranked
from highest to lowest values for every failure category in a dairy product manufacturing
system. The highest values represent the highest level of risk while lowest values indicate
a system that is free or less of risk (good manufacturing system).
From the result analysis, the physical risk has the lowest risk level; chemical and
environmental risks almost gave the same weighted average risk level; while the biological
risks have the highest risk level, thus showing the importance of the microorganisms related
contamination in the dairy products processes.
Dairy farming is the main integral of the dairy products manufacturing. Without raw milk,
it would be a challenge to manufacture or produce dairy products. The more emphasizes
given to the raw milk sourcing, treatment, and handling, the safer and lessen the negative
impact on the consumers. Ozilgen and Kurt (2013) stated that the samples of most raw milk
from the dairy farm used for dairy products manufacturing in Turkey failed the requirement
test which gave birth to dairy products manufacturer owning dairy farm themselves to
minimise these unwelcoming results.
The outcomes from this research work help manufacturers to realize that both the wellness
of the dairy animal from where the raw milk is extracted and clean operating facility
contribute to the quality sterile of the raw milk. The undesirable dairy products
manufacturing represents an extraordinary hazard to the shoppers and the unfortunate
creatures are the significant wellspring of pathogenic microorganism, which comes about
Page 65
54
into the accompanying cases such as osteoporosis, cardiovascular illness, tumor, diabetes,
cancer etcetera.
The failure modes used to analyse this experimental result was obtained from dairy products
manufacturer (with over 50 years of dairy products manufacturing) in Nigeria (The
company want to remain undisclosed) which are almost identical with what Ozilgen and
Kurt (2013) identified in their research of a seven-year audit of dairy products
manufacturing in Turkey. This ascertains the importance of the result of this work and how
it can be used in any part of the world since the processes of dairy products manufacturing
is almost universal.
The results of the first (Four FISs) stage or phase of the proposed model (FIS A-D) is
discussed first follow by the result of the final FIS (DPMRA) ranking. The DPMRA result
is explained in an opposite manner as the first four FISs. The Excellent (Low-risk level)
means the great manufacturing systems while Poor represents a manufacturing system with
high-risk level. The table 5.1 below shows how the final risk (DPMRA) ranking is been
interpreted.
Table 5.1: Final Risk (DPMRA) ranking interpretation.
Range Definition
0 - 19 Poor
20 - 39 Fair
40 - 59 Average
60 - 79 Good
80 - 100 Excellent
Page 66
55
The experts were formed based on their in-depth knowledge of the manufacturing system
and a total of six (6) committee is appropriate for a medium problem. The committee
(experts) includes the Operation manager, Maintenance manager, two (2) Senior Operators,
and two (2) Line leaders (Supervisors) with over 40 years collective industry experiences.
Production failures log book, root-cause analysis reports and customer feedbacks system
were also reviewed for the accuracy data collected and to expedite the process.
5.1 Mamdani FIS Physical Risk Model Experimental
Result
The consequences of this physical risk expound greatly on the most condemnatory disaster
and the remedial measures needed an incredible diminishment on the hazard that this failure
postured. The examination of the physical risks instigated the criticality of the consecutive
procedures of the dairy products to the customer. At whatever time, the workforce has
contact with the raw milk or altered the procedure parameters without a doubt influences
the final results. The major causes of this unwanted finished products are (1) absence of
appropriate preparation, (2) corroded facility, (3) Personal hygiene, and (4) deficient dairy
products manufacturing background.
The Physical, Biological, Chemical, and Environmental Risk scores are derived from the
proposed model. The scores (outputs) required an input value between 0 and 100 or
Very_Small and Very_High to the three input criteria (O, S, and D).
Table 5.2 highlights the failure modes that need the highest attention. Although, physical
risk contributes lowest risk level to the dairy products manufacturing process, however, it
is important to know that every uncaught failure can result in major damage to the
Page 67
56
organization. The onus is on the operation manager and maintenance team to properly
document and treats every failure with utmost caution to avoid disaster.
To reduce the number of failures and minimise the effect of these failures, the following
remedial approaches need to be followed to prevent future re-occurrence.
• Provision of Personal Protective Equipment (PPE) by the operation leader and
enforcement of their usage,
• Quality Assurance team performing inspection and analysis regularly,
• Total Employee Involvement (TEI) approach,
• Training program for both employees, management, and suppliers to capture
knowledge gap in dairy products manufacturing processes,
• Develop a standard operating procedure for maintenance and ventilation control,
• Rapid cleaning when there is spillage, and
• Install metal detection and alarm system to mitigate the risk of metal contaminants
in dairy products etcetera.
Table 5.1: Experimental result based on the common physical failure modes identified by
the experts.
Failures and the causes Occurrence Severity Detectability Physical
Risk score Particles from ventilation
ducts that are rusted.
68 48 40 72
Unwanted items from the
manufacturing
environment.
60 55 45 59
Impurities as a result of
misinformation and lack
of clarification.
50 60 48 59
Poor personnel hygiene
system.
82 40 70 68.8
Page 68
57
Particles or contaminants
from the supplied lids or
packing materials.
60 60 60 65.6
Improper manufacturing
layout and structure.
30 75 40 50
Physical impurities from
other raw materials, for
example, decay salts.
63 60 50 70.4
Contamination due to
employee bad materials
(raw milk, packaging)
handling
55 60 20 59
Unwanted materials due
to the movement or
transportation of raw milk
and materials.
60 60 40 65.6
Wrong implementation of
maintenance procedures.
50 50 55 50
Contamination as a result
of inadequate and
improper knowledge or
practice of the
manufacturing processes.
60 45 50 59
Physical contamination
due to poor knowledge of
disease prevention,
management, and control.
50 80 70 74.7
Worn, damage or torn
filtration equipment
contamination.
48 30 28 28
Impurities from damaged
filters.
60 50 40 59
Debris from equipment
cleaning materials.
28 70 30 50
Contamination due to
plastic, metal particles
from damaged equipment.
40 70 44 63
Risk Average 59.6
Page 69
58
These and more proactive measures will drastically reduce the physical failure mode in
dairy products. The correct execution of the above-recorded points will guarantee the well-
being of the dairy products, make insignificant the outside bodies and diminish superfluous
operation break down or shut down. The physical contamination due to poor knowledge of
disease prevention, management, and control gives the highest risk level accord to the result
in table 5.2. Therefore, adequate training is important to have a smooth-running operation.
Any institution that applies those systems in their operation will record lower risk cases
from both their customers and within their operation.
The risk level in table 5.2 is the simulated or experimental result based on the common
physical failure modes identified by the experts. This result can be used by any dairy
products manufacturers to mitigate the risks; however, the model is user-friendly, which
allows the input to be typed manually and can be changed easily if a new failure mode is
detected.
5.2 Mamdani FIS Biological Risk Model Experimental
Result
The biological risk is the second Mamdani FIS proposed model to analyze biological risk
in dairy products manufacturing. The model consists of three inputs (O, S, and D) and one
output (Biological Risk) as described in chapter four. Although the first four FISs have the
same inputs, the fuzzy rules (125 rules) are different from each other, since the category of
risk differs in terms of their consequences.
Milk products conserve an assortment of microorganisms such as viruses (Cytomegalic and
retroviruses) and microbes (Kaufmann et al., 2002). Jay et al. (2013) discovered that the
normal inhibitory frameworks in milk products keep a huge ascent in a microbial cell means
Page 70
59
the initial 3 or 4 hours at encompassing temperatures. It is vital to note that microorganisms
can likewise navigate their way through numerous means; for example, when it is exposed
to equipment, human, water, air, and so forth (Muehlhoff et al. 2013).
The healthy dairy animals contribute hugely to the extraction of safe raw milk and lesser
biological risk while unhealthy dairy animals give rapid cases of biological risk.
From the experimental result, the biological risk connotes the highest and critical failure
modes to the manufacturing processes of dairy products. Because of its inclination, it turns
out to investigate each phase of this inability to guarantee negligible reduction of the risk.
Human effect on these failure modes is consequential to risk level. So, focusing on both the
dairy animals and personnel is important to the reduction of the risk level posed by
biological risk to the manufacturing processes and consumers as shown in table 5.3.
Table 5.3 shows the experimental results with the crisp inputs based on expert opinions.
The highlighted yellow font indicates the comparison between the physical and biological
risk, as stated above. The crisp inputs are the same but the output is far-fetched different
due to the fuzzy rules variance.
Table 5.1: Experimental result based on the common biological failure modes identified
by the experts.
Failures and the causes Occurrence Severity Detectability Biological
Risk
Micro-organisms
pathogenic from the water.
60 88 82 90.7
Micro-organisms
pathogenic in the milk from
an unhealthy dairy animal.
40 90 70 90.7
Improper handling of the
raw milk during and after
receiving contribute to the
micro-organisms decay.
88 70 50 91.5
Page 71
60
Contamination from poor
operation/manufacturing
procedures.
40 80 44 66
Microbiological
contamination due to
packaging materials.
50 70 73 91.5
Microbiological
contamination as a result of
inconsistency temperature
within the operation and the
transportation of both raw
or/and finished products.
75 70 62 90.7
Pathogenic bacteria caused
by lack of proper covers
sealing practices.
80 80 48 91.1
Microbial growth from
insufficient cleaning of the
machinery.
55 60 40 59
Pathogenic contamination
due to the environment.
60 70 60 77.7
The time delay in the
manufacturing processes
resulted in the pathogenic
microorganisms growth.
60 60 40 65.6
Wrong cleaning tools for
right job microbiological
contamination.
50 80 70 91.1
Limited quality feed of the
dairy animals
40 60 65 68.8
Microbiological
contamination caused by
improper handling of the
milk.
80 92 93 91.1
Microbial growth due to
bad equipment used for
storage.
68 70 60 90.7
Micro-organisms
contaminations due to poor
knowledge of food hygiene,
milk handling by the dairy
farmers.
70 90 40 81.3
Poor pests control
pathogenic microorganisms
contamination e.g. flies,
bugs etc.
70 70 30 91.5
Microbial growth from
unregulated raw and
40 70 44 63
Page 72
61
finished products storage
condition.
Microbiological
contamination caused by
wrong storage temperature.
60 72 50 77.7
Pathogenic micro-
organisms from the
products mismanagement.
60 60 50 65.6
Contamination due to poor
shelves management.
70 80 40 84.5
Risk Average
80.99
The risks level can be minimized to the certain degree provided the procedures listed below
are implemented and encouraged among the employees and the management.
• Personal hygiene program and training for both employees and the suppliers,
• Develop a Standard Operating Procedure for all activities,
• Implement pest control management,
• The water treatment should be occasionally done to reduce micro-organism,
• Develop a farmer education system to educate the farmers on the dairy animal
management,
• Standardize the regulating parameters (pneumatic, pressure, temperature) with the
visual control for easy identification once it’s out of scope,
• Extensive acquisition frameworks ought to be received to encourage qualified
supplier’s selection,
• Raw milk must be investigated and analyzed periodically for possible
microorganism contamination,
• Thorough cleaning must be done at every manufacturing stage, and
Page 73
62
• Implement a standardized maintenance tool to uncover any deviations in the
manufacturing processes.
The risk scores help the operation manager, maintenance team, and the management to
understand the uniqueness of each failure mode and their risk level to distribute resources
prudently.
5.3 Mamdani FIS Chemical Risk Model Experimental
Result
Chemical usage during and after the manufacturing process can be problematic if not
properly measured. The contaminants could be from the packaging materials, animal
feeding, air and water chemistry discrepancy. Deliberate adulteration could also be a source
of contamination.
Table 5.1: Experimental result based on the common chemical failure modes identified by
the experts
Failures and the
causes
Occurrence Severity Detectability Chemical
Risk Chemical residues caused
by raw milk adulteration.
60 80 65 87
Chemicals movement to
and fro packaging
resources.
50 78 76 91.5
Toxic fungi in raw milk
caused by contaminated
dairy animal feed.
40 70 90 90.7
Chemical contamination
from wrong education in
dairy agricultural
practices.
40 50 15 41
Residual chemical
contamination from
equipment and tools
through improper cleaning
(detergent, chemical etc.).
38 75 60 65.6
Page 74
63
Although chemical risk level is relatively lower to biological risk, it is a major concern for
the operation team to know how to further minimise and mitigate the risks. As shown in
Table 5.4, the highest risk level in chemical risk experimental is due to people. So,
development of a systematic training for the personnel and suppliers will significantly
reduce the risk level. Proper labeling, visualized tools storage, material handling, and
hygiene will also help control the risk level.
Chemical contamination
as a result of mislabeling
of containers.
25 95 50 91.5
Metal contamination due
to storage materials.
57 70 40 73.7
Contamination as a result
of contaminated animal
feed (solid and liquid).
30 65 40 46.7
Direct and indirect heavily
preservative chemical
usage.
50 80 70 91.1
Metal remnants from
water used in the
manufacturing processes.
40 75 80 81.4
Chemical remnants as a
result of inappropriate
veterinary medicines
administer.
68 80 73 91.1
Risk Average
77.4
Page 75
64
5.4 Mamdani FIS Environmental Risk Model
Experimental Result
The effect of carbon dioxide (CO2) emission on the environment has been widely studied
by many researchers and government agencies. The resulted outcomes have introduced
many legislative and policies to regulate the greenhouse emission. The dairy products
manufacturing industries are not exempted from these policies. Many organizations have
been fined tremendously by the government for noncompliance which had, in turn,
instigated others into actions. The introduction of these policies in the last decades has
caused a major facility restructure in numerous industries.
Due to the nature of dairy products that need to be refrigerated throughout its lifespan, the
disposal of the waste products during the extraction of milk and manufacturing etcetera
have shown the importance of the effect of environmental policies on dairy products
manufacturing.
As discussed in section 3.4, the common failure modes were identified by the experts and
were fed into the proposed model and gave a defuzzified output for the environmental risk
level.
Page 76
65
Table 5.5: Experimental result based on the common environmental failure modes identified by
the experts.
From the table 5.5 above, it is evident that the causes of processes deviation that contributes
to the highest risk level are due to improper manufacturing process parameters and the high-
power consumption. One of the major factors why operators manipulate the parameters is
to either speed up the processes or as a catalyst, especially if huge downtime has been
Failures and the
causes
Occurrence Severity Detectability Environmental
Risk
Lack of proper
environmental education
(training) by the top
management, operation
managers, and
operators.
65 70 60 87
Land use change release
Green House Gases
(GHGs) to the
atmosphere.
40 85 10 64.4
Improper
manufacturing processes
e.g. using wrong
processes parameters
during the
manufacturing.
70 80 60 90.7
The effect of waste
disposal after production
causes the reduction in
the level of production.
40 50 20 50
High-energy
consumption during the
dairy products
production.
80 60 45 77.7
High power/electricity
consumption for the
finished products
storage (Shelve
refrigerators).
75 70 40 90.7
Dairy animals waste
disposal.
70 40 25 72
Risk Average 76.1
Page 77
66
accumulated as a result of the failure, which in turn, increases the power consumption or
CO2 emission.
Inadequate environmental impact training for the employees and the management
reluctance to invest in educating operating team might come back to hurt the organization.
Unlike the other risks, the environmental risk might be difficult to manage since the
tolerance ranges are being set through the legislative channel. Nevertheless, regulatory
manufacturing process parameters managed energy consumption, and employees’
enlightenment will minimise the environmental risk level.
5.5 Mamdani FIS Dairy Products Manufacturing Risk
Ranking Model Result
This is the last stage of the proposed model and it is important to state here that the model
can work independently but works exceptionally depended. The first four FISs (FIS A – D)
models are suitable for risk analysis of any of kind of system, however, the inputs to the
final FIS are manually typed. At this last stage of the dairy products manufacturing system
ranking model, the FIS (A – D) outputs are fed as inputs to the proposed Mamdani FIS
engine to give a system ranking based on risk.
One of the advantages of this approach is to enable industries benchmark on good working
manufacturing system with lower risk level for the betterment and improvement of the
systems with higher risk level. For consolidated consensus methodology for the
probabilistic assessment of safe operation, benchmarking practices have been proven to be
exceptionally effective (Amendola, 1986). Not only will this model be a handful for
benchmarking, it is also a reference point to every dairy product manufacturer as a resource.
Page 78
67
Two different dairy products manufacturers are compared to give an idea of the
experimental results. These organizations have been in operation for over 50 years with
various experiences that range from milk extraction to the finished products. Meanwhile,
even though these organizations are multinationals, the data used are from their plants in
Nigeria.
As mentioned previously, the organizations chose to be anonymous. The company will be
represented as company ‘A’ and ‘B’ to protect their identities. Company ‘A’ with (Kurt &
Ozilgen 2013) data were used to obtain the experimental result of physical, biological,
chemical, and environmental common failure modes shown in (table 5.2, 5.3, 5.4, and
5.5) above.
Each category risk level results are averaged to deduce the input data for the final risk
assessment. Using each failure mode on every category will not be appropriate as an input
for the final FIS system risk ranking because each category is not necessarily the same in
terms of consequences or fuzzy rules. So, it is advisable to optimize the input data by getting
the average risk value of each category before being fed as an input into the last model for
ranking.
The average risk level for the company ‘A’ is higher (Table 5.2, 5.3, 5.4, and 5.5) compared
to company “B” and the major reason is that they currently operate in a more traditional
way without implementing the new manufacturing methodologies. For example, company
‘A’ is in the phase of implementing a lean manufacturing and continuous improvement to
their manufacturing processes.
That being said, the results from this work would highlight pathways to improving their
operation and use company ‘B’ as a benchmark due to its lower average risk level as shown
in Table 5.6. Company ‘B’ is another multinational dairy product manufacturing firm in
Page 79
68
Nigeria. The firm has a great training platform for their employees and working
manufacturing methodologies.
The idea was that the common failure modes identified by the experts as mentioned in
chapter 3 were used as a yardstick to know how the organization is performing. The data
was fed into the proposed model (FIS A – D) to derive the risk level average. The average
risk level (company ‘A’ and ‘B’) are run through the final FIS to rank the manufacturing
systems in Table 5.7. In most cases, the average risk level crisp output values are not easy
to obtain until the final stage of the proposed model. Compared to the company ‘A’,
company ‘B’ area of improvement is environmental risk followed by biological risk.
Table 5.1: Experimental Average Risk Level for Company ‘B’.
Average Risk Level
Company B
Physical Risk 44
Biological Risk 51.2
Chemical Risk 28
Environmental Risk 56.3
Page 80
69
Table 5.2: Experimental final output dairy products manufacturing systems risk of
company A versus (Vs) B ranking.
It is worth mentioning that the proposed model is not only for benchmarking dairy
manufacturers, it is a perfect system for any industry to analyze the risk level of their
operations. Although the fuzzy rules were designed specifically to evaluate and analyze
dairy products manufacturing risk, with some twist to the rule, it can work perfectly for
other operations.
The table 5.7 gives a comparison between two companies with respect to their risk levels
and figure 5.1 shows the graphical representation of the terminal result. The inputs are the
physical, biological, chemical, and environmental risk and the final output result. From the
result, it is evident that company ‘A’ has a poor dairy manufacturing system due to their
manufacturing approaches, which have contributed to the higher risk level on every facet
of their operation.
Final Result Company “A” Vs Company “B”
Company A Company B
Physical Risk 59.6 44
Biological Risk 81 51.2
Chemical Risk 77.4 28
Environmental Risk 76.1 56.3
Final Output Result 9.23 49.2
Page 81
70
Figure 5.1: Graphical Final Output Result
5.6 The Proposed Model Result versus traditional
FMEA RPN
The traditional FMEA RPN for risk evaluation is marred with different shortcomings and
a typical example is what happens when any of the criteria has a value of zero (0) which
gives a zero-risk level as shown in Table 5.8. The Mamdani FIS models proposed is capable
of analyzing the risk even if any of the components in the criteria is zero (0), and also give
a different result if the criteria value is re-arranged differently, unlike traditional FMEA
RPN.
The proposed models are generally suited to analyze and evaluate risk level using linguistic
terms, or quantitative data, which FMEA RPN only rely on the quantitative data. Table 5.8,
5.9, 5.10, and 5.11 also ranked each failure mode in each failure category (Physical,
0
10
20
30
40
50
60
70
80
90
Ph
ysic
al R
isk
Bio
logi
cal R
isk
Ch
em
ical
Ris
k
Envi
ron
me
nta
l Ris
k
Fin
al O
utp
ut
Res
ult
Final Result Company "A" Vs "B"
Company A Company B
Page 82
71
Biological, Chemical, and Environmental). This shows how the proposed models
performed compared to traditional FMEA RPN.
Table 5.8: Physical Risk Mamdani FIS Model Versus Traditional FMEA RPN
Failure
Modes
O S D Physical
Risk
Proposed
Model
Risk
Ranking
FMEA
RPN
RPN
Ranking
PFM1 68 48 40 72 2 130.56 10
PFM2 60 55 45 59 8 148.5 5
PFM3 50 60 48 59 8 144 6
PFM4 82 40 70 68.8 4 229.6 2
PFM5 60 60 60 65.6 5 216 3
PFM6 30 75 40 50 13 90 13
PFM7 63 60 50 70.4 3 189 4
PFM8 55 60 20 59 8 66 14
PFM9 60 60 40 65.6 5 144 6
PFM10 50 50 55 50 13 137.5 8
PFM11 60 45 50 59 8 135 9
PFM12 50 80 70 74.7 1 280 1
PFM13 40 0 30 9.32 17 0 17
PFM14 48 30 28 28 16 40.32 16
PFM15 60 50 40 59 8 120 12
PFM16 28 70 30 50 13 58.8 15
PFM17 40 70 44 63 7 123.2 11
Page 83
72
Table 5.9: Biological Risk Mamdani FIS Model Versus Traditional FMEA RPN
Failure
Mode
O S D Biological
Risk
Proposed
model risk
ranking
FMEA
RPN
RPN
ranking
BFM1 60 88 82 90.7 7 432.96 2
BFM2 40 90 70 90.7 7 252 9
BFM3 88 70 50 91.5 1 308 4
BFM4 40 80 44 66 16 140.8 18
BFM5 50 70 73 91.5 1 255.5 8
BFM6 75 70 62 90.7 7 325.5 3
BFM7 80 80 48 91.1 4 307.2 5
BFM8 55 60 40 59 20 132 19
BFM9 60 70 60 77.7 13 252 9
BFM10 60 60 40 65.6 17 144 17
BFM11 50 80 70 91.1 4 280 7
BFM12 40 60 65 68.8 15 156 15
BFM13 80 92 93 91.1 4 684.48 1
BFM14 68 70 60 90.7 7 285.6 6
BFM15 70 90 40 81.3 12 252 9
BFM16 70 70 30 91.5 1 147 16
BFM17 40 70 44 63 19 123.2 20
BFM18 60 72 50 77.7 13 216 13
BFM19 60 60 50 65.6 17 180 14
BFM20 70 80 40 84.5 11 224 12
Page 84
73
Table 5.10: Chemical Risk Mamdani FIS Model Versus Traditional FMEA RPN
Failure
Modes
O S D Chemical
Risk
Proposed
model risk
ranking
FMEA
RPN
RPN
ranking
CFM1 60 80 65 87 6 312 2
CFM2 50 78 76 91.5 3 296.4 3
CFM3 40 70 90 90.7 1 252 5
CFM4 40 50 15 41 11 30 11
CFM5 38 75 60 65.6 7 171 7
CFM6 25 95 50 91.5 8 118.75 9
CFM7 57 70 40 73.7 9 159.6 8
CFM8 30 65 40 46.7 9 78 10
CFM9 50 80 70 91.1 5 280 4
CFM10 40 75 80 81.4 2 240 6
CFM11 68 80 73 91.1 4 397.12 1
Table 5.11: Environmental Risk Mamdani FIS Model Versus Traditional FMEA RPN
Failure
Modes
O S D Environmental
Risk
Proposed
model risk
ranking
FMEA
RPN
RPN
ranking
EFM1 65 70 60 87 3 273 2
EFM2 40 85 10 64.4 6 34 7
EFM3 70 80 60 90.7 1 336 1
EFM4 40 50 20 50 7 40 6
EFM5 80 60 45 77.7 4 216 3
EFM6 75 70 40 90.7 1 210 4
EFM7 70 40 25 72 5 70 5
Page 85
74
5.7 Graphical User Interfaces (GUIs)
The graphical user interfaces (GUIs) are designed to give a platform for easy entering of
input data and perform extensive understanding. The Physical, Biological, Chemical, and
Environmental GUI allow the user to slide between Very_Small to Very_High, while the
values are displayed to give crisp values. The important aspect of that is that the users do
not need to know the value but users can slide within the variable (Very_Small, Small,
Medium, High, and Very_High) to click on the button (Physical Risk, Biological Risk,
Chemical Risk, and Environmental Risk as shown in the figures below) to get the output
crisp value of the risk. The GUIs were designed using MATLAB GUIDE.
The Final GUI indicates the final proposed FIS model designed to analyze risk level of
the dairy products manufacturing system. The average risk level of each category is
inputted, to get a final score of the risk level of the manufacturing system. These proposed
models can be used as an audit tool within the organization to analyze the risk level of the
manufacturing processes.
Page 86
75
Figure 5.2: Proposed Physical Risk GUI Model
Page 87
76
Figure 5.3: Proposed Biological Risk GUI Model
Page 88
77
Figure 5.4: Proposed Chemical Risk GUI Model
Page 89
78
Figure 5.5: Proposed Environmental Risk GUI Model
Page 90
79
Figure 5.6: Proposed Final Risk Assessment GUI Model
5.8 Summary
In this chapter, the experimental results of all the proposed models were discussed. With
the knowledge of experts, the degree of occurrence, severity, and detectability for each
failure mode, which was used as the inputs that fed into the Mamdani FIS engines, a
trapezoidal membership function was used for all the proposed models with all the fuzzy
rules presented in Appendix A - E. A total of 1125 rules were developed for all the model
and the Fuzzy Inference System is optimized to the parameters to give an accurate fuzzy
set. The Graphic User Interfaces were developed and experimented to give the users an
easy to operate interface.
Page 91
80
CHAPTER SIX: CONCLUSIONS
The objectives of this thesis are to develop an intelligent system capable of analyzing and
evaluating risks in dairy products manufacturing systems. The traditional risk assessment
strategies manage deficient or ambiguous data due to inadequate knowledge of the system
and no involvement of the experts in the risk assessment and lack of obvious inner failures
system to furnish experts with an accurate and dependable risk ranking. Intelligent systems
are capable of managing these shortcomings of traditional risk assessment strategies and
incorporate the expert opinions into the mechanism to give reliable outcomes. To navigate
through these hurdles, a robust model of five Mamdani Fuzzy Inference System was
proposed and developed. The models were tested with an experimental data to provide the
model’s verification and insight on how the model works.
This thesis provided an insight into dairy products and the processes in the first chapter and
highlighted what is expected during this work. In this section, the importance and health
benefits of dairy products are briefly discussed, as well as the contributions of this research
work. This brief introduction led to the second section of the thesis where a comprehensive
literature review of relevant works was carried out to give a deeper knowledge on risk
assessment.
The important element of this research was elaborated in the third chapter, where the
common failure modes were identified by the experts using the operation failure log,
consumer feedback mechanism, and root-cause analysis logs as resources. With an
understanding of what to expect in dairy products manufacturing processes, the proposed
models were explained in the fourth chapter. In this stage, the most crucial aspect of the
thesis was well discussed to introduce the working mechanism of the proposed Mamdani
Page 92
81
Fuzzy Inference System models which are to give more accurate, workable, and dependable
results to the experts. The fifth stage of this thesis provides the simulation and analysis of
the identified common failure modes using the degree of occurrence, severity, and
detectability as inputs for the proposed models in each category to get the experimental
results to show the importance and productivity of the models. The proposed models are
designed using MATLAB™ Fuzzy Toolbox and MATLAB™ GUIDE having been proven
to give accurate and reliable results in risk assessment.
6.1 Result Summary
The result of this work will give both the manufacturers and the consumers guarantees on
the finished products but most importantly, the operation managers can operate more
productively. Since the failures are prioritized, the maintenance team can schedule
maintenance to address the most important failure and can employ the approach of other
manufacturers as a benchmark. It is important to say that the model gives an in-depth
knowledge on how to mitigate the risks involved in dairy products manufacturing systems,
given that the risk level of each failure mode has been analyzed and the allocation of
resources becomes easy.
From the experimental results, it is evident that both the biological and environmental
failures have the highest and higher risk respectively and the results also suggest the most
important areas to allocate resources to reduce the risk level.
The Mamdani Fuzzy Inference System models have been proposed and designed to
accurately analyze risk level of dairy products manufacturing systems. The proposed
models are found to provide more reliability and easy to understand results. These proposed
Page 93
82
models also incorporated expert’s opinions and use real manufacturing methodologies to
assess the common failure modes in dairy products manufacturing.
The experimental results of the models provide an insightful outlook on how to reduce risk
level in each category (physical, biological, chemical, and environmental) to propel more
effective dairy products manufacturing processes and to increase the operation productivity.
In summary, this thesis had used physical, biological, chemical, and environmental risks to
rank dairy products manufacturing system using Mamdani FIS.
6.2 Future Work and Recommendations
Political risk is one very important risk to research about in the future especially with the
current issues on dairy products import and export between the United States and Canada.
Although it poses no risk to the manufacturing processes directly, however, it reduces the
production level. The lower the production level the more likely the operation cost increases
which overall jeopardizes the industry cash flow and could lead to losing best heads or
downsizing. These and more should be examined in detail to know the real impact of
political risk on dairy products industry.
Page 94
83
REFERENCES
Adar, E., İnce, M., Karatop, B., & Bilgili, M. S. (2017). The risk analysis by failure mode
and effect analysis (FMEA) and fuzzy-FMEA of supercritical water gasification system
used in the sewage sludge treatment. Journal of Environmental Chemical Engineering, 5(1),
1261-1268.
Amendola, A. (1986). Uncertainties in systems reliability modeling: Insight gained through
European Benchmark exercises. Nuclear Engineering and Design, 93(2-3), 215-225.
Asao, T., Kumeda, Y., Kawai, T., Shibata, T., Oda, H., Haruki, K., Nakazawa, H., Kozyki,
S. (2003). An extensive outbreak of staphylococcal food poisoning due to low-fat milk in
Japan.
Azadegan, A., Porobic, L., Ghazinoory, S., Samouei, P., & Kheirkhah, A. S. (2011). Fuzzy
logic in manufacturing: a review of the literature and a specialized
application. International Journal of Production Economics, 132(2), 258-270.
Bocaniala, C. D., et al. (2004). A novel fuzzy classification solution for fault diagnosis.
Journal of Intelligent and Fuzzy Systems, 15, 195–205.
Bowles, J. B., & Peláez, C. E. (1995). Fuzzy logic prioritization of failures in a system
failure mode, effects and criticality analysis. Reliability Engineering & System Safety,
50(2), 203-213.
Cavette, Chris 2006. “How milk is made” Accessed January 2017,
http://www.madehow.com/Volume-4/Milk.html
Devendra, C., 2002, Smallholder Dairy Production Systems in East and South-East Asia;
Dhankhar, P. (2014). Homogenization fundamentals. IOSR J Eng, 4(5), 1-8.
Page 95
84
Expanding Importance, Environmental impacts, and Opportunities, International livestock
FMEA – FMECA http://www.fmea-fmeca.com/fmea-rpn.html accessed 2017-03-20
2.55pm)
Food and Agriculture Organization of the United Nations (FAO 2017). Dairy Production
and Products. Accessed January 2017, http://www.fao.org/agriculture/dairy-
gateway/dairy-home/en/#.WNmAfzsrJaQ
Gargama, H., & Chaturvedi, S. K. (2011). Criticality assessment models for failure mode
effects and criticality analysis using fuzzy logic. IEEE Transactions on Reliability, 60(1),
102-110.
King, Gordon 2017 Department of Animal & Poultry Science, University of Guelph: Dairy
Production Introduction, Background, Planning and Housing.
http://www.aps.uoguelph.ca/~gking/Ag_2350/dairy1.htm accessed Jan 21, 2017.
Jacob 2015. “What is the milk Fortification?” Accessed January 2017,
http://www.livestrong.com/article/342869-what-are-the-causes-of-upper-arm-muscle-
ache/
Jang, J. S. R., Sun, C. T., & Mizutani, E. (1997). Neuro-fuzzy and soft computing; a
computational approach to learning and machine intelligence.
Jang, Jhy-Shing Roger (1997) Neuro-Fuzzy and Soft Computing: A Computational
Approach to Learning and Machine Intelligence, Upper Saddle River, NJ, USA: Prentice
Hall, 1997.
Jay, J. M., Loessner, M. J., & Golden, D. A. (2005). Modern food microbiology 7th Edition.
NY, USA, Springer July 1983, pp. 55-60.
Page 96
85
Kaplan, S., Garrick, B. J., & Apostolakis, G. (1981). Advances in Quantitative Risk
Assessment--The Maturing of a Discipline. IEEE Transactions on Nuclear Science, 28(1),
944-946
Kaufmann, S. H., Sher, A., & Ahmed, R. (2002). Immunology of infectious diseases.
American Society for Microbiology (ASM).
Kurt, L., & Ozilgen, S. (2013). Failure mode and effect analysis for dairy product
manufacturing: Practical safety improvement action plan with cases from Turkey. Safety
Science, 55, 195-206.
Liu, H. C., Liu, L., & Liu, N. (2013). Risk evaluation approaches in failure mode and effects
analysis: A literature review. Expert systems with applications, 40(2), 828-838.
Liu, H. C., Liu, L., Bian, Q. H., Lin, Q. L., Dong, N., & Xu, P. C. (2011). Failure mode and
effects analysis using fuzzy evidential reasoning approach and gray theory. Expert Systems
with Applications, 38(4), 4403-4415.
Mandal, S., & Maiti, J. (2014). Risk analysis using FMEA: Fuzzy similarity value and
possibility theory based approach. Expert Systems with Applications, 41(7), 3527-3537.
Marttunen, M., & Hämäläinen, R. P. (1995). Decision analysis interviews in environmental
impact assessment. European journal of operational research, 87(3), 551-563.
Mathworks Inc. “Mamdani Inference Systems” Accessed February 2017,
https://www.mathworks.com/help/fuzzy/what-is-mamdani-type-fuzzy-inference.html
Mongeon, M. & Summerhayes, B./OMAFRA, 2012, Organic Dairy production
(http://www.omafra.gov.on.ca/english/livestock/dairy/facts/10-087.htm accessed
02.01.2017)
Page 97
86
Moon, B. (1998). Environmental impact assessment in Queensland, Australia: a
governmental massacre! Impact Assessment and Project Appraisal, 16(1), 33-47.
Muehlhoff, E., Bennett, A., & McMahon, D. (2013). Milk and dairy products in human
nutrition. Food and Agriculture Organization of the United Nations (FAO).
Narayanagounder, S., & Gurusami, K. (2009). A new approach for prioritization of failure
modes in design FMEA using ANOVA. World Academy of Science, Engineering, and
Technology, 49(524-31).
Ramanathan, R. (2001). A note on the use of the analytic hierarchy process for
environmental impact assessment. Journal of environmental management, 63(1), 27-35.
Ravi Sankar, N., & Prabhu, B. S. (2001). A Modified approach for prioritization of failures
in a system failure mode and effects analysis. International Journal of Quality & Reliability
Management, 18(3), 324-336.
Renu, R., Visotsky, D., Knackstedt, S., Mocko, G., Summers, J. D., & Schulte, J. (2016).
A Knowledge Based FMEA to Support Identification and Management of Vehicle Flexible
Component Issues. Procedia CIRP, 44, 157-162.
Smith, P. W., (August 1981), “Milk Pasteurization” Fact Sheet Number 57, U.S.
Department of Agriculture Research Service, Washington, D.C.
Smolova, J., & Peach, M. (2010). Fuzzy Expert System for Evaluating of Bargaining Power
of Customers in SC. Center for inVestigations into Information Systems. ISSN, 1214-9489.
Takagi, T. & Sugeno, M., Derivation of fuzzy control rules from human operator's control
actions. In Proc. IFAC Symp. on Fuzzy Information, Knowledge Representation, and
Decision Analysis, Marseilles, France,
Page 98
87
Trafialek, J., & Kolanowski, W. (2014). Application of Failure Mode and Effect Analysis
(FMEA) for an audit of HACCP system. Food Control, 44, 35-44.
Van Ryzin, J. (1980). Quantitative risk assessment. Journal of Occupational and
Environmental Medicine, 22(5), 321-hyhen.
Wessiani, N. A., & Sarwoko, S. O. (2015). Risk Analysis of Poultry Feed Production Using
Fuzzy FMEA. Procedia Manufacturing, 4, 270-281.
Wu, W. (2015). Oil and Gas Pipeline Risk Assessment Model by Fuzzy Inference Systems
and Artificial Neural Network (Doctoral dissertation, Faculty of Graduate Studies and
Research, University of Regina).
Yang, Z., & Wang, J. (2015). Use of fuzzy risk assessment in FMEA of offshore
engineering systems. Ocean Engineering, 95, 195-204.
Yang, Z., Bonsall, S., & Wang, J. (2008). Fuzzy rule-based Bayesian reasoning approach
for prioritization of failures in FMEA. IEEE Transactions on Reliability, 57(3), 517-528.
Zadeh, L. A. (1965). Fuzzy sets. Information and control, 8(3), 338-353.
Page 99
88
Appendix A: Physical Risk
No Inputs Output
IF THEN
Occurrence Severity Detectability Risk
1 Very Small Very Small Very Small Minor
2 Very Small Very Small Small Minor
3 Very Small Very Small Medium Minor
4 Very Small Very Small High Minor
5 Very Small Very Small Very High Low
6 Very Small Small Very Small Minor
7 Very Small Small Small Minor
8 Very Small Small Medium Low
9 Very Small Small High Low
10 Very Small Small Very High Low
11 Very Small Medium Very Small Low
12 Very Small Medium Small Low
13 Very Small Medium Medium Low
14 Very Small Medium High Moderate
15 Very Small Medium Very High Important
16 Very Small High Very Small Moderate
17 Very Small High Small Moderate
18 Very Small High Medium Moderate
19 Very Small High High Important
20 Very Small High Very High Important
21 Very Small Very High Very Small Moderate
22 Very Small Very High Small Moderate
23 Very Small Very High Medium Important
24 Very Small Very High High Important
25 Very Small Very High Very High Important
26 Small Very Small Very Small Minor
27 Small Very Small Small Minor
28 Small Very Small Medium Minor
29 Small Very Small High Moderate
30 Small Very Small Very High Important
31 Small Small Very Small Minor
32 Small Small Small Minor
33 Small Small Medium Low
Page 100
89
34 Small Small High Moderate
35 Small Small Very High Moderate
36 Small Medium Very Small Low
37 Small Medium Small Low
38 Small Medium Medium Moderate
39 Small Medium High Moderate
40 Small Medium Very High Moderate
41 Small High Very Small Low
42 Small High Small Moderate
43 Small High Medium Moderate
44 Small High High Important
45 Small High Very High Very Important
46 Small Very High Very Small Moderate
47 Small Very High Small Moderate
48 Small Very High Medium Very Important
49 Small Very High High Very Important
50 Small Very High Very High Very Important
51 Medium Very Small Very Small Minor
52 Medium Very Small Small Minor
53 Medium Very Small Medium Minor
54 Medium Very Small High Moderate
55 Medium Very Small Very High Important
56 Medium Small Very Small Low
57 Medium Small Small Low
58 Medium Small Medium Low
59 Medium Small High Moderate
60 Medium Small Very High Important
61 Medium Medium Very Small Moderate
62 Medium Medium Small Moderate
63 Medium Medium Medium Moderate
64 Medium Medium High Important
65 Medium Medium Very High Important
66 Medium High Very Small Important
67 Medium High Small Important
68 Medium High Medium Important
69 Medium High High Very Important
70 Medium High Very High Very Important
71 Medium Very High Very Small Moderate
72 Medium Very High Small Very Important
Page 101
90
73 Medium Very High Medium Very Important
74 Medium Very High High Very Important
75 Medium Very High Very High Very Important
76 High Very Small Very Small Low
77 High Very Small Small Low
78 High Very Small Medium Low
79 High Very Small High Important
80 High Very Small Very High Important
81 High Small Very Small Low
82 High Small Small Low
83 High Small Medium Moderate
84 High Small High Moderate
85 High Small Very High Moderate
86 High Medium Very Small Moderate
87 High Medium Small Important
88 High Medium Medium Important
89 High Medium High Very Important
90 High Medium Very High Very Important
91 High High Very Small Very Important
92 High High Small Very Important
93 High High Medium Very Important
94 High High High Very Important
95 High High Very High Very Important
96 High Very High Very Small Very Important
97 High Very High Small Very Important
98 High Very High Medium Very Important
99 High Very High High Very Important
100 High Very High Very High Very Important
101 Very High Very Small Very Small Moderate
102 Very High Very Small Small Moderate
103 Very High Very Small Medium Moderate
104 Very High Very Small High Moderate
105 Very High Very Small Very High Important
106 Very High Small Very Small Moderate
107 Very High Small Small Moderate
108 Very High Small Medium Important
109 Very High Small High Very Important
110 Very High Small Very High Very Important
111 Very High Medium Very Small Important
Page 102
91
112 Very High Medium Small Important
113 Very High Medium Medium Important
114 Very High Medium High Very Important
115 Very High Medium Very High Very Important
116 Very High High Very Small Very Important
117 Very High High Small Very Important
118 Very High High Medium Very Important
119 Very High High High Very Important
120 Very High High Very High Very Important
121 Very High Very High Very Small Very Important
122 Very High Very High Small Very Important
123 Very High Very High Medium Very Important
124 Very High Very High High Very Important
125 Very High Very High Very High Very Important
Appendix B: Biological Risk
No Inputs Output
IF THEN
Occurrence Severity Detectability Risk
1 Very Small Very Small Very Small Minor
2 Very Small Very Small Small Minor
3 Very Small Very Small Medium Minor
4 Very Small Very Small High Minor
5 Very Small Very Small Very High Minor
6 Very Small Small Very Small Minor
7 Very Small Small Small Minor
8 Very Small Small Medium Low
9 Very Small Small High Low
10 Very Small Small Very High Low
11 Very Small Medium Very Small Low
12 Very Small Medium Small Low
13 Very Small Medium Medium Low
14 Very Small Medium High Moderate
15 Very Small Medium Very High Moderate
16 Very Small High Very Small Moderate
17 Very Small High Small Moderate
Page 103
92
18 Very Small High Medium Moderate
19 Very Small High High Important
20 Very Small High Very High Important
21 Very Small Very High Very Small Moderate
22 Very Small Very High Small Moderate
23 Very Small Very High Medium Important
24 Very Small Very High High Important
25 Very Small Very High Very High Important
26 Small Very Small Very Small Minor
27 Small Very Small Small Minor
28 Small Very Small Medium Minor
29 Small Very Small High Low
30 Small Very Small Very High Low
31 Small Small Very Small Minor
32 Small Small Small Minor
33 Small Small Medium Low
34 Small Small High Low
35 Small Small Very High Low
36 Small Medium Very Small Low
37 Small Medium Small Low
38 Small Medium Medium Moderate
39 Small Medium High Moderate
40 Small Medium Very High Moderate
41 Small High Very Small Low
42 Small High Small Moderate
43 Small High Medium Moderate
44 Small High High Important
45 Small High Very High Very Important
46 Small Very High Very Small Moderate
47 Small Very High Small Moderate
48 Small Very High Medium Very Important
49 Small Very High High Very Important
50 Small Very High Very High Very Important
51 Medium Very Small Very Small Minor
52 Medium Very Small Small Minor
53 Medium Very Small Medium Minor
54 Medium Very Small High Low
55 Medium Very Small Very High Moderate
56 Medium Small Very Small Low
Page 104
93
57 Medium Small Small Low
58 Medium Small Medium Low
59 Medium Small High Moderate
60 Medium Small Very High Important
61 Medium Medium Very Small Moderate
62 Medium Medium Small Moderate
63 Medium Medium Medium Moderate
64 Medium Medium High Important
65 Medium Medium Very High Important
66 Medium High Very Small Important
67 Medium High Small Important
68 Medium High Medium Important
69 Medium High High Very Important
70 Medium High Very High Very Important
71 Medium Very High Very Small Important
72 Medium Very High Small Very Important
73 Medium Very High Medium Very Important
74 Medium Very High High Very Important
75 Medium Very High Very High Very Important
76 High Very Small Very Small Minor
77 High Very Small Small Minor
78 High Very Small Medium Low
79 High Very Small High Moderate
80 High Very Small Very High Moderate
81 High Small Very Small Low
82 High Small Small Moderate
83 High Small Medium Moderate
84 High Small High Moderate
85 High Small Very High Moderate
86 High Medium Very Small Moderate
87 High Medium Small Important
88 High Medium Medium Important
89 High Medium High Important
90 High Medium Very High Important
91 High High Very Small Very Important
92 High High Small Very Important
93 High High Medium Very Important
94 High High High Very Important
95 High High Very High Very Important
Page 105
94
96 High Very High Very Small Important
97 High Very High Small Important
98 High Very High Medium Very Important
99 High Very High High Very Important
100 High Very High Very High Very Important
101 Very High Very Small Very Small Low
102 Very High Very Small Small Moderate
103 Very High Very Small Medium Moderate
104 Very High Very Small High Moderate
105 Very High Very Small Very High Important
106 Very High Small Very Small Moderate
107 Very High Small Small Moderate
108 Very High Small Medium Important
109 Very High Small High Very Important
110 Very High Small Very High Very Important
111 Very High Medium Very Small Important
112 Very High Medium Small Important
113 Very High Medium Medium Important
114 Very High Medium High Very Important
115 Very High Medium Very High Very Important
116 Very High High Very Small Very Important
117 Very High High Small Very Important
118 Very High High Medium Very Important
119 Very High High High Very Important
120 Very High High Very High Very Important
121 Very High Very High Very Small Very Important
122 Very High Very High Small Very Important
123 Very High Very High Medium Very Important
124 Very High Very High High Very Important
125 Very High Very High Very High Very Important
Page 106
95
Appendix C: Chemical Risk
No Inputs Output
IF THEN
Occurrence Severity Detectability Risk
1 Very Small Very Small Very Small Minor
2 Very Small Very Small Small Minor
3 Very Small Very Small Medium Minor
4 Very Small Very Small High Minor
5 Very Small Very Small Very High Minor
6 Very Small Small Very Small Minor
7 Very Small Small Small Minor
8 Very Small Small Medium Low
9 Very Small Small High Low
10 Very Small Small Very High Low
11 Very Small Medium Very Small Low
12 Very Small Medium Small Low
13 Very Small Medium Medium Moderate
14 Very Small Medium High Moderate
15 Very Small Medium Very High Moderate
16 Very Small High Very Small Low
17 Very Small High Small Moderate
18 Very Small High Medium Moderate
19 Very Small High High Important
20 Very Small High Very High Important
21 Very Small Very High Very Small Low
22 Very Small Very High Small Moderate
23 Very Small Very High Medium Important
24 Very Small Very High High Important
25 Very Small Very High Very High Important
26 Small Very Small Very Small Minor
27 Small Very Small Small Minor
28 Small Very Small Medium Minor
29 Small Very Small High Minor
30 Small Very Small Very High Minor
31 Small Small Very Small Minor
32 Small Small Small Minor
33 Small Small Medium Low
Page 107
96
34 Small Small High Low
35 Small Small Very High Low
36 Small Medium Very Small Low
37 Small Medium Small Low
38 Small Medium Medium Moderate
39 Small Medium High Moderate
40 Small Medium Very High Moderate
41 Small High Very Small Low
42 Small High Small Moderate
43 Small High Medium Moderate
44 Small High High Important
45 Small High Very High Important
46 Small Very High Very Small Moderate
47 Small Very High Small Moderate
48 Small Very High Medium Very Important
49 Small Very High High Very Important
50 Small Very High Very High Very Important
51 Medium Very Small Very Small Minor
52 Medium Very Small Small Minor
53 Medium Very Small Medium Minor
54 Medium Very Small High Low
55 Medium Very Small Very High Low
56 Medium Small Very Small Low
57 Medium Small Small Low
58 Medium Small Medium Low
59 Medium Small High Low
60 Medium Small Very High Moderate
61 Medium Medium Very Small Moderate
62 Medium Medium Small Moderate
63 Medium Medium Medium Moderate
64 Medium Medium High Moderate
65 Medium Medium Very High Important
66 Medium High Very Small Important
67 Medium High Small Important
68 Medium High Medium Important
69 Medium High High Important
70 Medium High Very High Important
71 Medium Very High Very Small Important
72 Medium Very High Small Important
Page 108
97
73 Medium Very High Medium Very Important
74 Medium Very High High Very Important
75 Medium Very High Very High Very Important
76 High Very Small Very Small Minor
77 High Very Small Small Minor
78 High Very Small Medium Minor
79 High Very Small High Low
80 High Very Small Very High Moderate
81 High Small Very Small Low
82 High Small Small Moderate
83 High Small Medium Moderate
84 High Small High Moderate
85 High Small Very High Moderate
86 High Medium Very Small Moderate
87 High Medium Small Important
88 High Medium Medium Important
89 High Medium High Important
90 High Medium Very High Important
91 High High Very Small Very Important
92 High High Small Very Important
93 High High Medium Very Important
94 High High High Very Important
95 High High Very High Very Important
96 High Very High Very Small Important
97 High Very High Small Important
98 High Very High Medium Very Important
99 High Very High High Very Important
100 High Very High Very High Very Important
101 Very High Very Small Very Small Low
102 Very High Very Small Small Low
103 Very High Very Small Medium Low
104 Very High Very Small High Moderate
105 Very High Very Small Very High Moderate
106 Very High Small Very Small Moderate
107 Very High Small Small Moderate
108 Very High Small Medium Important
109 Very High Small High Important
110 Very High Small Very High Important
111 Very High Medium Very Small Important
Page 109
98
112 Very High Medium Small Important
113 Very High Medium Medium Important
114 Very High Medium High Very Important
115 Very High Medium Very High Very Important
116 Very High High Very Small Very Important
117 Very High High Small Very Important
118 Very High High Medium Very Important
119 Very High High High Very Important
120 Very High High Very High Very Important
121 Very High Very High Very Small Very Important
122 Very High Very High Small Very Important
123 Very High Very High Medium Very Important
124 Very High Very High High Very Important
125 Very High Very High Very High Very Important
Appendix D: Environmental Risk
No Inputs Output
IF THEN
Occurrence Severity Detectability Risk
1 Very High Very High Very High Very Important
2 Very High Very High High Very Important
3 Very High Very High Medium Very Important
4 Very High Very High Small Very Important
5 Very High Very High Very Small Very Important
6 Very High High Very High Very Important
7 Very High High High Very Important
8 Very High High Medium Very Important
9 Very High High Small Very Important
10 Very High High Very Small Very Important
11 Very High Medium Very High Very Important
12 Very High Medium High Very Important
13 Very High Medium Medium Very Important
14 Very High Medium Small Very Important
15 Very High Medium Very Small Very Important
16 Very High Small Very High Very Important
17 Very High Small High Very Important
Page 110
99
18 Very High Small Medium Very Important
19 Very High Small Small Very Important
20 Very High Small Very Small Very Important
21 Very High Very Small Very High Very Important
22 Very High Very Small High Very Important
23 Very High Very Small Medium Very Important
24 Very High Very Small Small Very Important
25 Very High Very Small Very Small Very Important
26 High Very High Very High Very Important
27 High Very High High Very Important
28 High Very High Medium Very Important
29 High Very High Small Very Important
30 High Very High Very Small Very Important
31 High High Very High Very Important
32 High High High Very Important
33 High High Medium Very Important
34 High High Small Very Important
35 High High Very Small Very Important
36 High Medium Very High Very Important
37 High Medium High Important
38 High Medium Medium Important
39 High Medium Small Important
40 High Medium Very Small Important
41 High Small Very High Important
42 High Small High Important
43 High Small Medium Important
44 High Small Small Important
45 High Small Very Small Moderate
46 High Very Small Very High Important
47 High Very Small High Important
48 High Very Small Medium Moderate
49 High Very Small Small Moderate
50 High Very Small Very Small Moderate
51 Medium Very High Very High Important
52 Medium Very High High Important
53 Medium Very High Medium Important
54 Medium Very High Small Important
55 Medium Very High Very Small Important
56 Medium High Very High Important
Page 111
100
57 Medium High High Important
58 Medium High Medium Important
59 Medium High Small Important
60 Medium High Very Small Important
61 Medium Medium Very High Important
62 Medium Medium High Moderate
63 Medium Medium Medium Moderate
64 Medium Medium Small Moderate
65 Medium Medium Very Small Moderate
66 Medium Small Very High Moderate
67 Medium Small High Low
68 Medium Small Medium Low
69 Medium Small Small Low
70 Medium Small Very Small Low
71 Medium Very Small Very High Low
72 Medium Very Small High Low
73 Medium Very Small Medium Low
74 Medium Very Small Small Low
75 Medium Very Small Very Small Low
76 Small Very High Very High Very Important
77 Small Very High High Very Important
78 Small Very High Medium Very Important
79 Small Very High Small Important
80 Small Very High Very Small Important
81 Small High Very High Important
82 Small High High Important
83 Small High Medium Moderate
84 Small High Small Moderate
85 Small High Very Small Moderate
86 Small Medium Very High Moderate
87 Small Medium High Moderate
88 Small Medium Medium Moderate
89 Small Medium Small Moderate
90 Small Medium Very Small Moderate
91 Small Small Very High Moderate
92 Small Small High Low
93 Small Small Medium Low
94 Small Small Small Minor
95 Small Small Very Small Minor
Page 112
101
96 Small Very Small Very High Minor
97 Small Very Small High Minor
98 Small Very Small Medium Minor
99 Small Very Small Small Minor
100 Small Very Small Very Small Minor
101 Very Small Very High Very High Important
102 Very Small Very High High Moderate
103 Very Small Very High Medium Moderate
104 Very Small Very High Small Moderate
105 Very Small Very High Very Small Low
106 Very Small High Very High Low
107 Very Small High High Low
108 Very Small High Medium Low
109 Very Small High Small Low
110 Very Small High Very Small Low
111 Very Small Medium Very High Moderate
112 Very Small Medium High Low
113 Very Small Medium Medium Low
114 Very Small Medium Small Low
115 Very Small Medium Very Small Low
116 Very Small Small Very High Low
117 Very Small Small High Low
118 Very Small Small Medium Low
119 Very Small Small Small Minor
120 Very Small Small Very Small Minor
121 Very Small Very Small Very High Minor
122 Very Small Very Small High Minor
123 Very Small Very Small Medium Minor
124 Very Small Very Small Small Minor
125 Very Small Very Small Very Small Minor
Page 113
102
Appendix E: Final Risk
No
Inputs Output
IF THEN
Physical Risk
Biological Risk Chemical Risk Environmental Risk Manufacturing
Systems
1 Very Small Very Small Very Small Very Small Excellent
2 Very Small Very Small Very Small Small Excellent
3 Very Small Very Small Very Small Medium Excellent
4 Very Small Very Small Very Small High Excellent
5 Very Small Very Small Very Small Very High Excellent
6 Very Small Very Small Small Very Small Excellent
7 Very Small Very Small Small Small Excellent
8 Very Small Very Small Small Medium Excellent
9 Very Small Very Small Small High Excellent
10 Very Small Very Small Small Very High Excellent
11 Very Small Very Small Medium Very Small Excellent
12 Very Small Very Small Medium Small Excellent
13 Very Small Very Small Medium Medium Excellent
14 Very Small Very Small Medium High Excellent
15 Very Small Very Small Medium Very High Excellent
16 Very Small Very Small High Very Small Excellent
17 Very Small Very Small High Small Excellent
18 Very Small Very Small High Medium Excellent
19 Very Small Very Small High High Good
20 Very Small Very Small High Very High Good
21 Very Small Very Small Very High Very Small Good
22 Very Small Very Small Very High Small Good
23 Very Small Very Small Very High Medium Good
24 Very Small Very Small Very High High Good
25 Very Small Very Small Very High Very High Good
26 Very Small Small Very Small Very Small Excellent
27 Very Small Small Very Small Small Excellent
28 Very Small Small Very Small Medium Excellent
29 Very Small Small Very Small High Good
30 Very Small Small Very Small Very High Good
31 Very Small Small Small Very Small Excellent
32 Very Small Small Small Small Excellent
33 Very Small Small Small Medium Excellent
Page 114
103
34 Very Small Small Small High Good
35 Very Small Small Small Very High Good
36 Very Small Small Medium Very Small Excellent
37 Very Small Small Medium Small Excellent
38 Very Small Small Medium Medium Excellent
39 Very Small Small Medium High Good
40 Very Small Small Medium Very High Good
41 Very Small Small High Very Small Excellent
42 Very Small Small High Small Good
43 Very Small Small High Medium Good
44 Very Small Small High High Good
45 Very Small Small High Very High Good
46 Very Small Small Very High Very Small Good
47 Very Small Small Very High Small Good
48 Very Small Small Very High Medium Good
49 Very Small Small Very High High Good
50 Very Small Small Very High Very High Average
51 Very Small Medium Very Small Very Small Excellent
52 Very Small Medium Very Small Small Excellent
53 Very Small Medium Very Small Medium Good
54 Very Small Medium Very Small High Good
55 Very Small Medium Very Small Very High Good
56 Very Small Medium Small Very Small Good
57 Very Small Medium Small Small Good
58 Very Small Medium Small Medium Good
59 Very Small Medium Small High Average
60 Very Small Medium Small Very High Average
61 Very Small Medium Medium Very Small Good
62 Very Small Medium Medium Small Good
63 Very Small Medium Medium Medium Good
64 Very Small Medium Medium High Average
65 Very Small Medium Medium Very High Average
66 Very Small Medium High Very Small Average
67 Very Small Medium High Small Average
68 Very Small Medium High Medium Average
69 Very Small Medium High High Average
70 Very Small Medium High Very High Average
71 Very Small Medium Very High Very Small Average
72 Very Small Medium Very High Small Average
Page 115
104
73 Very Small Medium Very High Medium Average
74 Very Small Medium Very High High Fair
75 Very Small Medium Very High Very High Fair
76 Very Small High Very Small Very Small Excellent
77 Very Small High Very Small Small Good
78 Very Small High Very Small Medium Good
79 Very Small High Very Small High Average
80 Very Small High Very Small Very High Average
81 Very Small High Small Very Small Good
82 Very Small High Small Small Average
83 Very Small High Small Medium Average
84 Very Small High Small High Average
85 Very Small High Small Very High Average
86 Very Small High Medium Very Small Average
87 Very Small High Medium Small Average
88 Very Small High Medium Medium Average
89 Very Small High Medium High Average
90 Very Small High Medium Very High Average
91 Very Small High High Very Small Average
92 Very Small High High Small Average
93 Very Small High High Medium Fair
94 Very Small High High High Fair
95 Very Small High High Very High Fair
96 Very Small High Very High Very Small Average
97 Very Small High Very High Small Average
98 Very Small High Very High Medium Average
99 Very Small High Very High High Fair
100 Very Small High Very High Very High Fair
101 Very Small Very High Very Small Very Small Average
102 Very Small Very High Very Small Small Average
103 Very Small Very High Very Small Medium Average
104 Very Small Very High Very Small High Average
105 Very Small Very High Very Small Very High Average
106 Very Small Very High Small Very Small Average
107 Very Small Very High Small Small Average
108 Very Small Very High Small Medium Average
109 Very Small Very High Small High Average
110 Very Small Very High Small Very High Average
111 Very Small Very High Medium Very Small Average
Page 116
105
112 Very Small Very High Medium Small Average
113 Very Small Very High Medium Medium Average
114 Very Small Very High Medium High Fair
115 Very Small Very High Medium Very High Fair
116 Very Small Very High High Very Small Average
117 Very Small Very High High Small Average
118 Very Small Very High High Medium Average
119 Very Small Very High High High Fair
120 Very Small Very High High Very High Fair
121 Very Small Very High Very High Very Small Average
122 Very Small Very High Very High Small Average
123 Very Small Very High Very High Medium Fair
124 Very Small Very High Very High High Fair
125 Very Small Very High Very High Very High Fair
126 Small Very Small Very Small Very Small Good
127 Small Very Small Very Small Small Good
128 Small Very Small Very Small Medium Good
129 Small Very Small Very Small High Good
130 Small Very Small Very Small Very High Good
131 Small Very Small Small Very Small Good
132 Small Very Small Small Small Good
133 Small Very Small Small Medium Good
134 Small Very Small Small High Good
135 Small Very Small Small Very High Good
136 Small Very Small Medium Very Small Good
137 Small Very Small Medium Small Good
138 Small Very Small Medium Medium Good
139 Small Very Small Medium High Average
140 Small Very Small Medium Very High Average
141 Small Very Small High Very Small Average
142 Small Very Small High Small Average
143 Small Very Small High Medium Average
144 Small Very Small High High Average
145 Small Very Small High Very High Average
146 Small Very Small Very High Very Small Average
147 Small Very Small Very High Small Average
148 Small Very Small Very High Medium Average
149 Small Very Small Very High High Fair
150 Small Very Small Very High Very High Fair
Page 117
106
151 Small Small Very Small Very Small Good
152 Small Small Very Small Small Good
153 Small Small Very Small Medium Good
154 Small Small Very Small High Average
155 Small Small Very Small Very High Average
156 Small Small Small Very Small Good
157 Small Small Small Small Good
158 Small Small Small Medium Good
159 Small Small Small High Average
160 Small Small Small Very High Average
161 Small Small Medium Very Small Good
162 Small Small Medium Small Good
163 Small Small Medium Medium Good
164 Small Small Medium High Average
165 Small Small Medium Very High Average
166 Small Small High Very Small Average
167 Small Small High Small Average
168 Small Small High Medium Average
169 Small Small High High Average
170 Small Small High Very High Fair
171 Small Small Very High Very Small Average
172 Small Small Very High Small Average
173 Small Small Very High Medium Fair
174 Small Small Very High High Fair
175 Small Small Very High Very High Fair
176 Small Medium Very Small Very Small Good
177 Small Medium Very Small Small Good
178 Small Medium Very Small Medium Average
179 Small Medium Very Small High Average
180 Small Medium Very Small Very High Average
181 Small Medium Small Very Small Good
182 Small Medium Small Small Good
183 Small Medium Small Medium Average
184 Small Medium Small High Average
185 Small Medium Small Very High Average
186 Small Medium Medium Very Small Average
187 Small Medium Medium Small Average
188 Small Medium Medium Medium Average
189 Small Medium Medium High Average
Page 118
107
190 Small Medium Medium Very High Fair
191 Small Medium High Very Small Fair
192 Small Medium High Small Fair
193 Small Medium High Medium Fair
194 Small Medium High High Fair
195 Small Medium High Very High Fair
196 Small Medium Very High Very Small Fair
197 Small Medium Very High Small Fair
198 Small Medium Very High Medium Fair
199 Small Medium Very High High Fair
200 Small Medium Very High Very High Fair
201 Small High Very Small Very Small Average
202 Small High Very Small Small Average
203 Small High Very Small Medium Average
204 Small High Very Small High Fair
205 Small High Very Small Very High Fair
206 Small High Small Very Small Fair
207 Small High Small Small Fair
208 Small High Small Medium Fair
209 Small High Small High Fair
210 Small High Small Very High Fair
211 Small High Medium Very Small Fair
212 Small High Medium Small Fair
213 Small High Medium Medium Fair
214 Small High Medium High Fair
215 Small High Medium Very High Fair
216 Small High High Very Small Average
217 Small High High Small Average
218 Small High High Medium Fair
219 Small High High High Fair
220 Small High High Very High Fair
221 Small High Very High Very Small Fair
222 Small High Very High Small Fair
223 Small High Very High Medium Fair
224 Small High Very High High Fair
225 Small High Very High Very High Poor
226 Small Very High Very Small Very Small Average
227 Small Very High Very Small Small Average
228 Small Very High Very Small Medium Average
Page 119
108
229 Small Very High Very Small High Fair
230 Small Very High Very Small Very High Fair
231 Small Very High Small Very Small Fair
232 Small Very High Small Small Fair
233 Small Very High Small Medium Fair
234 Small Very High Small High Fair
235 Small Very High Small Very High Fair
236 Small Very High Medium Very Small Fair
237 Small Very High Medium Small Fair
238 Small Very High Medium Medium Fair
239 Small Very High Medium High Fair
240 Small Very High Medium Very High Poor
241 Small Very High High Very Small Fair
242 Small Very High High Small Fair
243 Small Very High High Medium Fair
244 Small Very High High High Fair
245 Small Very High High Very High Poor
246 Small Very High Very High Very Small Poor
247 Small Very High Very High Small Poor
248 Small Very High Very High Medium Poor
249 Small Very High Very High High Poor
250 Small Very High Very High Very High Poor
251 Medium Very Small Very Small Very Small Excellent
252 Medium Very Small Very Small Small Excellent
253 Medium Very Small Very Small Medium Excellent
254 Medium Very Small Very Small High Good
255 Medium Very Small Very Small Very High Good
256 Medium Very Small Small Very Small Good
257 Medium Very Small Small Small Good
258 Medium Very Small Small Medium Good
259 Medium Very Small Small High Average
260 Medium Very Small Small Very High Average
261 Medium Very Small Medium Very Small Good
262 Medium Very Small Medium Small Good
263 Medium Very Small Medium Medium Good
264 Medium Very Small Medium High Average
265 Medium Very Small Medium Very High Average
266 Medium Very Small High Very Small Average
267 Medium Very Small High Small Average
Page 120
109
268 Medium Very Small High Medium Average
269 Medium Very Small High High Average
270 Medium Very Small High Very High Fair
271 Medium Very Small Very High Very Small Average
272 Medium Very Small Very High Small Average
273 Medium Very Small Very High Medium Average
274 Medium Very Small Very High High Fair
275 Medium Very Small Very High Very High Fair
276 Medium Small Very Small Very Small Good
277 Medium Small Very Small Small Good
278 Medium Small Very Small Medium Good
279 Medium Small Very Small High Good
280 Medium Small Very Small Very High Average
281 Medium Small Small Very Small Good
282 Medium Small Small Small Good
283 Medium Small Small Medium Good
284 Medium Small Small High Average
285 Medium Small Small Very High Average
286 Medium Small Medium Very Small Good
287 Medium Small Medium Small Average
288 Medium Small Medium Medium Average
289 Medium Small Medium High Fair
290 Medium Small Medium Very High Fair
291 Medium Small High Very Small Average
292 Medium Small High Small Fair
293 Medium Small High Medium Fair
294 Medium Small High High Fair
295 Medium Small High Very High Fair
296 Medium Small Very High Very Small Average
297 Medium Small Very High Small Fair
298 Medium Small Very High Medium Fair
299 Medium Small Very High High Fair
300 Medium Small Very High Very High Fair
301 Medium Medium Very Small Very Small Good
302 Medium Medium Very Small Small Good
303 Medium Medium Very Small Medium Good
304 Medium Medium Very Small High Fair
305 Medium Medium Very Small Very High Fair
306 Medium Medium Small Very Small Good
Page 121
110
307 Medium Medium Small Small Average
308 Medium Medium Small Medium Average
309 Medium Medium Small High Fair
310 Medium Medium Small Very High Fair
311 Medium Medium Medium Very Small Average
312 Medium Medium Medium Small Average
313 Medium Medium Medium Medium Fair
314 Medium Medium Medium High Fair
315 Medium Medium Medium Very High Fair
316 Medium Medium High Very Small Fair
317 Medium Medium High Small Fair
318 Medium Medium High Medium Fair
319 Medium Medium High High Fair
320 Medium Medium High Very High Fair
321 Medium Medium Very High Very Small Fair
322 Medium Medium Very High Small Fair
323 Medium Medium Very High Medium Fair
324 Medium Medium Very High High Poor
325 Medium Medium Very High Very High Poor
326 Medium High Very Small Very Small Average
327 Medium High Very Small Small Average
328 Medium High Very Small Medium Fair
329 Medium High Very Small High Fair
330 Medium High Very Small Very High Fair
331 Medium High Small Very Small Average
332 Medium High Small Small Fair
333 Medium High Small Medium Fair
334 Medium High Small High Fair
335 Medium High Small Very High Fair
336 Medium High Medium Very Small Average
337 Medium High Medium Small Fair
338 Medium High Medium Medium Fair
339 Medium High Medium High Fair
340 Medium High Medium Very High Fair
341 Medium High High Very Small Fair
342 Medium High High Small Fair
343 Medium High High Medium Poor
344 Medium High High High Poor
345 Medium High High Very High Poor
Page 122
111
346 Medium High Very High Very Small Poor
347 Medium High Very High Small Poor
348 Medium High Very High Medium Poor
349 Medium High Very High High Poor
350 Medium High Very High Very High Poor
351 Medium Very High Very Small Very Small Average
352 Medium Very High Very Small Small Average
353 Medium Very High Very Small Medium Average
354 Medium Very High Very Small High Average
355 Medium Very High Very Small Very High Average
356 Medium Very High Small Very Small Average
357 Medium Very High Small Small Average
358 Medium Very High Small Medium Fair
359 Medium Very High Small High Fair
360 Medium Very High Small Very High Fair
361 Medium Very High Medium Very Small Fair
362 Medium Very High Medium Small Fair
363 Medium Very High Medium Medium Fair
364 Medium Very High Medium High Poor
365 Medium Very High Medium Very High Poor
366 Medium Very High High Very Small Fair
367 Medium Very High High Small Poor
368 Medium Very High High Medium Poor
369 Medium Very High High High Poor
370 Medium Very High High Very High Poor
371 Medium Very High Very High Very Small Fair
372 Medium Very High Very High Small Poor
373 Medium Very High Very High Medium Poor
374 Medium Very High Very High High Poor
375 Medium Very High Very High Very High Poor
376 High Very Small Very Small Very Small Good
377 High Very Small Very Small Small Good
378 High Very Small Very Small Medium Good
379 High Very Small Very Small High Average
380 High Very Small Very Small Very High Average
381 High Very Small Small Very Small Good
382 High Very Small Small Small Good
383 High Very Small Small Medium Average
384 High Very Small Small High Average
Page 123
112
385 High Very Small Small Very High Average
386 High Very Small Medium Very Small Good
387 High Very Small Medium Small Average
388 High Very Small Medium Medium Average
389 High Very Small Medium High Average
390 High Very Small Medium Very High Average
391 High Very Small High Very Small Average
392 High Very Small High Small Average
393 High Very Small High Medium Average
394 High Very Small High High Fair
395 High Very Small High Very High Fair
396 High Very Small Very High Very Small Average
397 High Very Small Very High Small Average
398 High Very Small Very High Medium Average
399 High Very Small Very High High Poor
400 High Very Small Very High Very High Poor
401 High Small Very Small Very Small Average
402 High Small Very Small Small Average
403 High Small Very Small Medium Average
404 High Small Very Small High Average
405 High Small Very Small Very High Fair
406 High Small Small Very Small Average
407 High Small Small Small Average
408 High Small Small Medium Average
409 High Small Small High Fair
410 High Small Small Very High Fair
411 High Small Medium Very Small Fair
412 High Small Medium Small Fair
413 High Small Medium Medium Fair
414 High Small Medium High Fair
415 High Small Medium Very High Poor
416 High Small High Very Small Fair
417 High Small High Small Fair
418 High Small High Medium Poor
419 High Small High High Poor
420 High Small High Very High Poor
421 High Small Very High Very Small Fair
422 High Small Very High Small Poor
423 High Small Very High Medium Poor
Page 124
113
424 High Small Very High High Poor
425 High Small Very High Very High Poor
426 High Medium Very Small Very Small Average
427 High Medium Very Small Small Average
428 High Medium Very Small Medium Average
429 High Medium Very Small High Fair
430 High Medium Very Small Very High Fair
431 High Medium Small Very Small Fair
432 High Medium Small Small Fair
433 High Medium Small Medium Fair
434 High Medium Small High Fair
435 High Medium Small Very High Fair
436 High Medium Medium Very Small Fair
437 High Medium Medium Small Fair
438 High Medium Medium Medium Fair
439 High Medium Medium High Fair
440 High Medium Medium Very High Poor
441 High Medium High Very Small Fair
442 High Medium High Small Fair
443 High Medium High Medium Poor
444 High Medium High High Poor
445 High Medium High Very High Poor
446 High Medium Very High Very Small Poor
447 High Medium Very High Small Poor
448 High Medium Very High Medium Poor
449 High Medium Very High High Poor
450 High Medium Very High Very High Poor
451 High High Very Small Very Small Fair
452 High High Very Small Small Fair
453 High High Very Small Medium Fair
454 High High Very Small High Fair
455 High High Very Small Very High Poor
456 High High Small Very Small Fair
457 High High Small Small Fair
458 High High Small Medium Fair
459 High High Small High Poor
460 High High Small Very High Poor
461 High High Medium Very Small Fair
462 High High Medium Small Fair
Page 125
114
463 High High Medium Medium Fair
464 High High Medium High Poor
465 High High Medium Very High Poor
466 High High High Very Small Poor
467 High High High Small Poor
468 High High High Medium Poor
469 High High High High Poor
470 High High High Very High Poor
471 High High Very High Very Small Poor
472 High High Very High Small Poor
473 High High Very High Medium Poor
474 High High Very High High Poor
475 High High Very High Very High Poor
476 High Very High Very Small Very Small Fair
477 High Very High Very Small Small Fair
478 High Very High Very Small Medium Fair
479 High Very High Very Small High Poor
480 High Very High Very Small Very High Poor
481 High Very High Small Very Small Fair
482 High Very High Small Small Poor
483 High Very High Small Medium Poor
484 High Very High Small High Poor
485 High Very High Small Very High Poor
486 High Very High Medium Very Small Poor
487 High Very High Medium Small Poor
488 High Very High Medium Medium Poor
489 High Very High Medium High Poor
490 High Very High Medium Very High Poor
491 High Very High High Very Small Fair
492 High Very High High Small Poor
493 High Very High High Medium Poor
494 High Very High High High Poor
495 High Very High High Very High Poor
496 High Very High Very High Very Small Poor
497 High Very High Very High Small Poor
498 High Very High Very High Medium Poor
499 High Very High Very High High Poor
500 High Very High Very High Very High Poor
501 Very High Very Small Very Small Very Small Average
Page 126
115
502 Very High Very Small Very Small Small Average
503 Very High Very Small Very Small Medium Average
504 Very High Very Small Very Small High Average
505 Very High Very Small Very Small Very High Fair
506 Very High Very Small Small Very Small Average
507 Very High Very Small Small Small Average
508 Very High Very Small Small Medium Average
509 Very High Very Small Small High Fair
510 Very High Very Small Small Very High Fair
511 Very High Very Small Medium Very Small Average
512 Very High Very Small Medium Small Average
513 Very High Very Small Medium Medium Fair
514 Very High Very Small Medium High Fair
515 Very High Very Small Medium Very High Fair
516 Very High Very Small High Very Small Fair
517 Very High Very Small High Small Fair
518 Very High Very Small High Medium Fair
519 Very High Very Small High High Fair
520 Very High Very Small High Very High Poor
521 Very High Very Small Very High Very Small Fair
522 Very High Very Small Very High Small Fair
523 Very High Very Small Very High Medium Poor
524 Very High Very Small Very High High Poor
525 Very High Very Small Very High Very High Poor
526 Very High Small Very Small Very Small Fair
527 Very High Small Very Small Small Fair
528 Very High Small Very Small Medium Fair
529 Very High Small Very Small High Fair
530 Very High Small Very Small Very High Poor
531 Very High Small Small Very Small Fair
532 Very High Small Small Small Fair
533 Very High Small Small Medium Fair
534 Very High Small Small High Poor
535 Very High Small Small Very High Poor
536 Very High Small Medium Very Small Fair
537 Very High Small Medium Small Fair
538 Very High Small Medium Medium Poor
539 Very High Small Medium High Poor
540 Very High Small Medium Very High Poor
Page 127
116
541 Very High Small High Very Small Fair
542 Very High Small High Small Fair
543 Very High Small High Medium Poor
544 Very High Small High High Poor
545 Very High Small High Very High Poor
546 Very High Small Very High Very Small Poor
547 Very High Small Very High Small Poor
548 Very High Small Very High Medium Poor
549 Very High Small Very High High Poor
550 Very High Small Very High Very High Poor
551 Very High Medium Very Small Very Small Fair
552 Very High Medium Very Small Small Fair
553 Very High Medium Very Small Medium Fair
554 Very High Medium Very Small High Poor
555 Very High Medium Very Small Very High Poor
556 Very High Medium Small Very Small Fair
557 Very High Medium Small Small Fair
558 Very High Medium Small Medium Fair
559 Very High Medium Small High Fair
560 Very High Medium Small Very High Poor
561 Very High Medium Medium Very Small Fair
562 Very High Medium Medium Small Fair
563 Very High Medium Medium Medium Fair
564 Very High Medium Medium High Poor
565 Very High Medium Medium Very High Poor
566 Very High Medium High Very Small Fair
567 Very High Medium High Small Fair
568 Very High Medium High Medium Fair
569 Very High Medium High High Poor
570 Very High Medium High Very High Poor
571 Very High Medium Very High Very Small Fair
572 Very High Medium Very High Small Fair
573 Very High Medium Very High Medium Poor
574 Very High Medium Very High High Poor
575 Very High Medium Very High Very High Poor
576 Very High High Very Small Very Small Fair
577 Very High High Very Small Small Fair
578 Very High High Very Small Medium Fair
579 Very High High Very Small High Poor
Page 128
117
580 Very High High Very Small Very High Poor
581 Very High High Small Very Small Fair
582 Very High High Small Small Fair
583 Very High High Small Medium Fair
584 Very High High Small High Poor
585 Very High High Small Very High Poor
586 Very High High Medium Very Small Fair
587 Very High High Medium Small Fair
588 Very High High Medium Medium Poor
589 Very High High Medium High Poor
590 Very High High Medium Very High Poor
591 Very High High High Very Small Fair
592 Very High High High Small Poor
593 Very High High High Medium Poor
594 Very High High High High Poor
595 Very High High High Very High Poor
596 Very High High Very High Very Small Poor
597 Very High High Very High Small Poor
598 Very High High Very High Medium Poor
599 Very High High Very High High Poor
600 Very High High Very High Very High Poor
601 Very High Very High Very Small Very Small Poor
602 Very High Very High Very Small Small Poor
603 Very High Very High Very Small Medium Poor
604 Very High Very High Very Small High Poor
605 Very High Very High Very Small Very High Poor
606 Very High Very High Small Very Small Poor
607 Very High Very High Small Small Poor
608 Very High Very High Small Medium Poor
609 Very High Very High Small High Poor
610 Very High Very High Small Very High Poor
611 Very High Very High Medium Very Small Poor
612 Very High Very High Medium Small Poor
613 Very High Very High Medium Medium Poor
614 Very High Very High Medium High Poor
615 Very High Very High Medium Very High Poor
616 Very High Very High High Very Small Poor
617 Very High Very High High Small Poor
618 Very High Very High High Medium Poor
Page 129
118
619 Very High Very High High High Poor
620 Very High Very High High Very High Poor
621 Very High Very High Very High Very Small Poor
622 Very High Very High Very High Small Poor
623 Very High Very High Very High Medium Poor
624 Very High Very High Very High High Poor
625 Very High Very High Very High Very High Poor