The Manchester Self-Harm Project Self-Harm in Manchester 1 st September 2005 to 31 st August 2007 Stella Dickson, Sarah Steeg, Iain Donaldson, Victoria Matthews, Maria Healey, Jayne Cooper, Navneet Kapur, Elizabeth Murphy The Centre for Suicide Prevention, Department of Psychiatry University of Manchester, Oxford Road, Manchester, M13 9PL www.manchester.ac.uk/mash
Transcript
The Manchester Self-Harm Project
Self-Harm in Manchester 1st September 2005 to 31st August 2007
Stella Dickson, Sarah Steeg, Iain Donaldson, Victoria Matthews, Maria Healey, Jayne Cooper, Navneet Kapur, Elizabeth Murphy
The Centre for Suicide Prevention, Department of Psychiatry University of Manchester, Oxford Road, Manchester, M13 9PL
www.manchester.ac.uk/mash
Funding Bodies Manchester Mental Health and Social Care Trust and the Department of Health
Acknowledgements We wish to thank staff in the Emergency Departments, mental health liaison teams and other psychiatric staff
for their contributions to the project. We would specifically like to thank Dr Jim Butler (at North Manchester
General Hospital), Prof Kevin Mackway-Jones (Manchester Royal Infirmary), Mr Nick Payne (Wythenshawe
Hospital), Clive Turpin (the SAFE Team) and Dr Damien Longson (Manchester Mental Health and Social
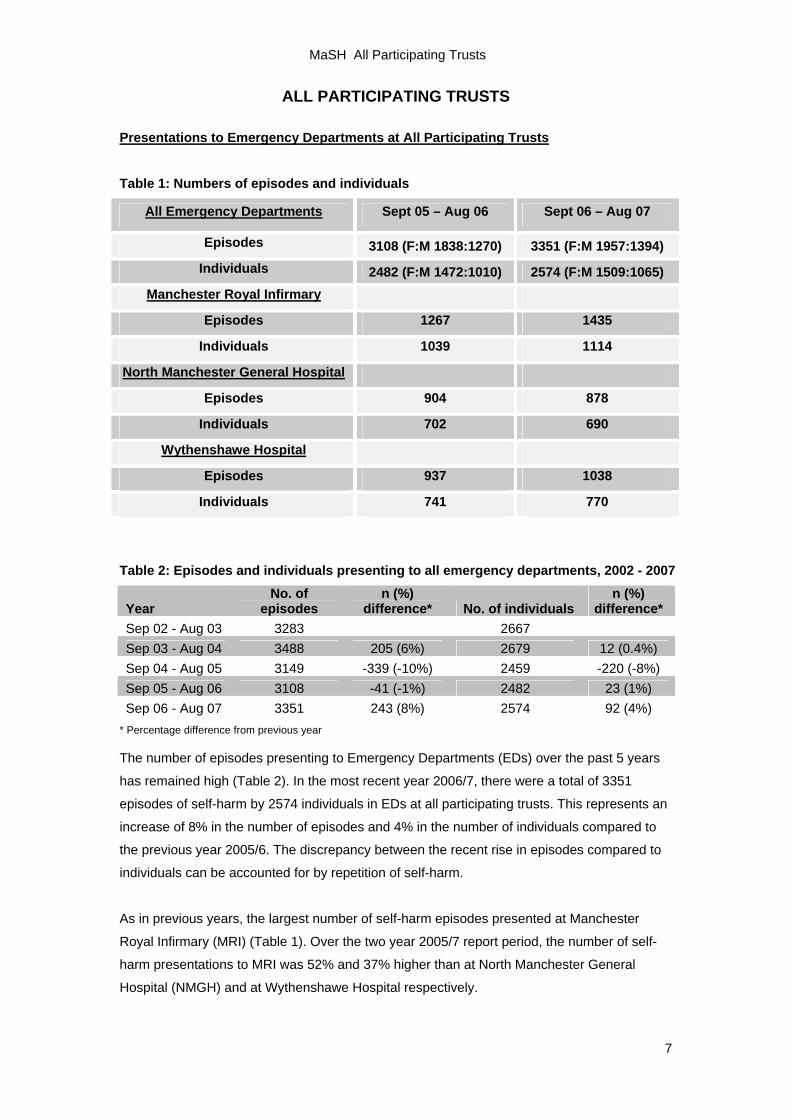
The number of episodes presenting to Emergency Departments (EDs) over the past 5 years
has remained high (Table 2). In the most recent year 2006/7, there were a total of 3351
episodes of self-harm by 2574 individuals in EDs at all participating trusts. This represents an
increase of 8% in the number of episodes and 4% in the number of individuals compared to
the previous year 2005/6. The discrepancy between the recent rise in episodes compared to
individuals can be accounted for by repetition of self-harm.
As in previous years, the largest number of self-harm episodes presented at Manchester
Royal Infirmary (MRI) (Table 1). Over the two year 2005/7 report period, the number of self-
harm presentations to MRI was 52% and 37% higher than at North Manchester General
Hospital (NMGH) and at Wythenshawe Hospital respectively.
MaSH All Participating Trusts
8
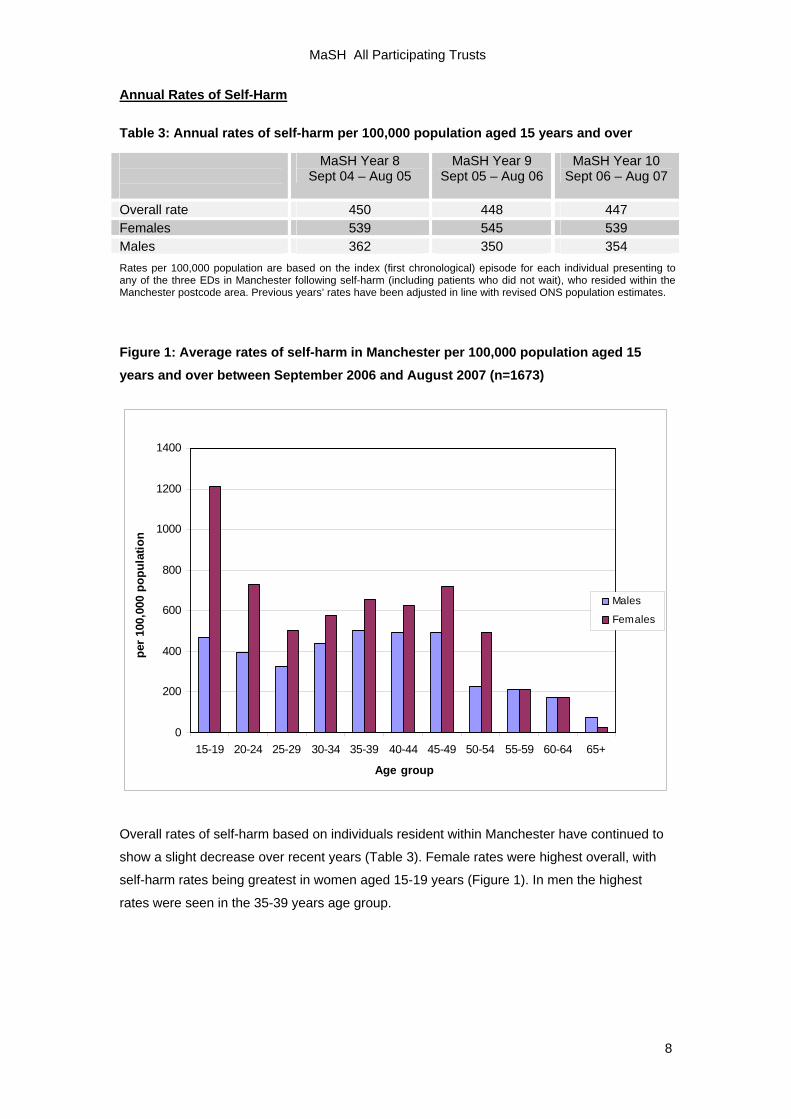
Annual Rates of Self-Harm Table 3: Annual rates of self-harm per 100,000 population aged 15 years and over
MaSH Year 8 Sept 04 – Aug 05
MaSH Year 9 Sept 05 – Aug 06
MaSH Year 10 Sept 06 – Aug 07
Overall rate 450 448 447 Females 539 545 539 Males 362 350 354 Rates per 100,000 population are based on the index (first chronological) episode for each individual presenting to any of the three EDs in Manchester following self-harm (including patients who did not wait), who resided within the Manchester postcode area. Previous years’ rates have been adjusted in line with revised ONS population estimates.
Figure 1: Average rates of self-harm in Manchester per 100,000 population aged 15 years and over between September 2006 and August 2007 (n=1673)
Overall rates of self-harm based on individuals resident within Manchester have continued to
show a slight decrease over recent years (Table 3). Female rates were highest overall, with
self-harm rates being greatest in women aged 15-19 years (Figure 1). In men the highest
rates were seen in the 35-39 years age group.
MaSH All Participating Trusts
9
Suicide and Self-Harm in Manchester
Although rates appear to have declined recently, Manchester continues to have high rates of
self-harm and suicide per head of population in comparison to other regions. The Multicentre
Investigation of Self-Harm (see p. 31), involving data from the MaSH Project, reported female
self-harm rates of 587 per 100,000 population in Manchester compared to 374 in Leeds and
342 in Oxford; and male rates of 460 in Manchester compared to 291 in Leeds and 285 in
Oxford (Hawton et al, 2007).
With respect to suicide, in 2005 the suicide rates in Manchester were 25 per 100,000 in men
aged 15 years and over, and 9 per 100,000 in women aged 15 years and over. These
compare to UK suicide rates in 2005 of 17.5 per 100,000 in males and 5.3 per 100,000 in
females aged at least 15 (Source: ONS).
The increased prevalence of suicidal behaviour in Manchester compared to other regions
may be associated with the city’s high level of socio-economic deprivation. Manchester is
ranked the 4th most deprived local authority area out of 354 in England based on the Index of
Multiple Deprivation (2007). Previous research has shown that suicidal behaviour is
associated with socio-economic deprivation, both at the individual and area level (e.g. Hawton
et al, 2001; Johnston et al, 2006; Corcoran et al, 2007). Changes in socio-economic
conditions have also been associated with increased self-harm rates (Gunnell et al, 2000). In
the context of the current economic recession, this emphasises the importance of sufficient
resources and appropriate clinical management of self-harm by services that may see
increased demands.
MaSH All Participating Trusts
10
Social and Demographic Characteristics of Self-Harming Individuals
Based on index episode across the two-year study period, 4738 individuals presented with
self-harm. 328 individuals (7%) did not wait (DNW) and did not return to be treated.
Table 4: Age and Gender (n = 4723)
N (Valid cases) 4723
59% female
Median age = 30 years, ranging from 9 to 93 years.
The group of patients with the highest frequency of self-harm were aged 15-19 years for females and 20-24 years for males although frequency was high in males from aged 20-39 years and females aged 15-24 years (based on frequency of presentation alone, and not per local population).
Table 5: Marital Status (n=4176) and Living Circumstances (n = 3202)
Marital Status and Living Circumstances
N (Valid cases) 4176 N (valid cases) 3202
Most patients were single (60%), 11% were separated or divorced, 2% were widowed and 27% were married or partnered. 21% lived alone, 21% with a parent/sibling and 10% with friends or other relatives. 7% were homeless or lived in hostels/lodgings.
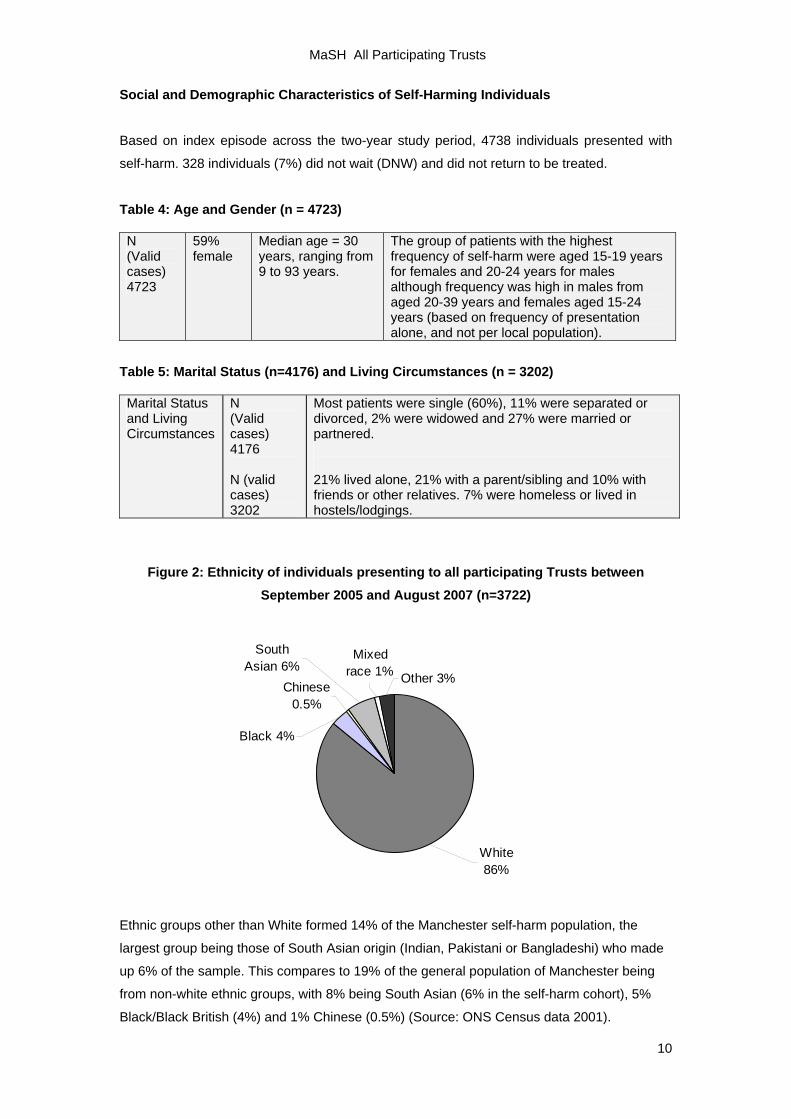
Figure 2: Ethnicity of individuals presenting to all participating Trusts between September 2005 and August 2007 (n=3722)
Other 3%
Mixed race 1%
South Asian 6%
Chinese 0.5%
Black 4%
White 86%
Ethnic groups other than White formed 14% of the Manchester self-harm population, the
largest group being those of South Asian origin (Indian, Pakistani or Bangladeshi) who made
up 6% of the sample. This compares to 19% of the general population of Manchester being
from non-white ethnic groups, with 8% being South Asian (6% in the self-harm cohort), 5%
Black/Black British (4%) and 1% Chinese (0.5%) (Source: ONS Census data 2001).
MaSH All Participating Trusts
11
Figure 3: Employment status of individuals presenting to all participating Trusts
between September 2005 and August 2007 (n=3129)
House Person/
Carer 5.2%Retired 2.8%
Student 12.6%
Registered Sick 12.6%
Unemployed35.2%
Employed 29.8%
Other 1.9%
The most frequently reported employment status by self-harming individuals was being
registered unemployed (35%), and 77% of these reported being unemployed for over 26
weeks. This compares to an unemployment rate of 7% in the general population of
Manchester between 2006 and 2007 (ONS). The proportion of self-harming individuals
registered as sick (13%) was slightly higher than the proportion claiming incapacity
benefit/severe disablement allowance in Manchester as a whole (8%) (ONS).
Unemployment is therefore highly overrepresented in the Manchester self-harm cohort.
Research suggests that individual level factors, such as unemployment, are stronger risk
factors for the incidence of suicidal behaviour than area level measures of deprivation
(O'Reilly et al, 2008). However, the mechanisms of area level risk and their interaction with
individual level factors need to be understood in more detail (Johnston et al, 2006). Of note,
unemployment at the individual level is an independent risk factor for a repetition of self-harm
(Kapur et al, 2006), although deprivation was not a predictor of repetition at the area level
(Johnston et al, 2006).
MaSH All Participating Trusts
12
Clinical Characteristics of Self-Harming Individuals (data on individuals by index episode with completed forms, September 2005 - August 2007) (n = 3332).
Current and previous psychiatric treatment
3072 individuals (92% of those with forms) were assessed for their psychiatric history. 44% of
these were receiving current psychiatric treatment (including treatment by a GP) and a further
15% had received psychiatric treatment in the past (but were not currently receiving
treatment).
Alcohol Misuse
3078 individuals (92% of those with forms) were assessed for their use of alcohol, and 33% of
these (43% of males and 25% of females) were classified as abusing alcohol, i.e. current
harmful alcohol use or drinking 7 or more units a day. Analysis by age group revealed alcohol
misuse to be more common in those aged over 35 years (45% vs. 25% under the age of 35).
Males over 35 years were the group who were most likely to be classified as misusing alcohol
(55%).
Alcohol use in conjunction with an act of self-harm was also common. Analysis of all episodes
revealed alcohol to be used at time of self-harm in 56% of cases (61% for male episodes,
52% for females). The use of alcohol at the time of self-harm was also more common in
episodes involving individuals aged 35 or over (67% vs. 48% under the age of 35). Of note,
for those over 35 years there was no gender difference in the proportion of episodes involving
alcohol (68% of male vs. 66% of female episodes).
Substance Misuse
3098 individuals (95% of those with forms) were assessed for their use of street drugs, and
16% of these (22% of males and 12% of females) were classified as misusing drugs (use on
a regular basis or classified as harmful use by a clinician). In contrast to alcohol misuse, drug
misuse was more common in those under 35 years (20% vs. 10% of those aged 35 or over).
The group most likely to misuse drugs were males under the age of 35 years, of whom a third
were using street drugs on a regular basis in 2006/7.
MaSH All Participating Trusts
13
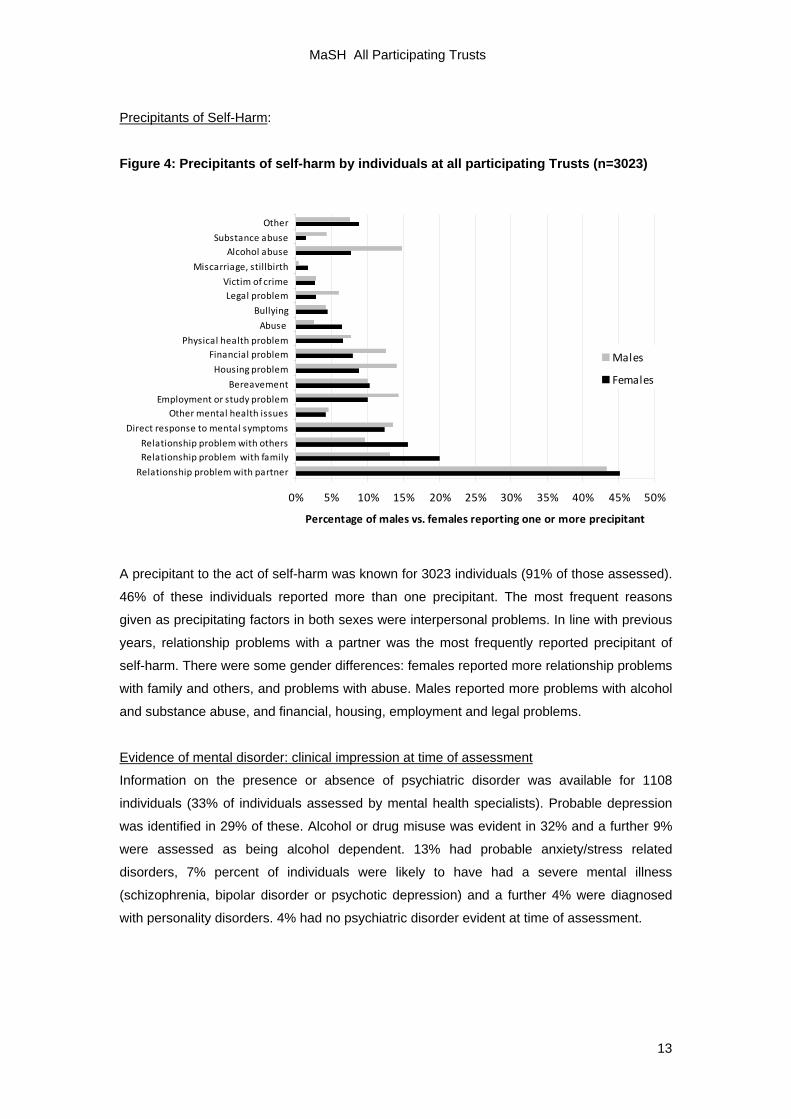
Precipitants of Self-Harm:
Figure 4: Precipitants of self-harm by individuals at all participating Trusts (n=3023)
0% 5% 10% 15% 20% 25% 30% 35% 40% 45% 50%
Relationship problem with partner
Relationship problem with familyRelationship problem with others
Direct response to mental symptoms
Other mental health issuesEmployment or study problem
Bereavement
Housing problem
Financial problemPhysical health problem
Abuse
Bullying
Legal problemVictim of crime
Miscarriage, stillbirth
Alcohol abuseSubstance abuse
Other
Percentage of males vs. females reporting one or more precipitant
Males
Females
A precipitant to the act of self-harm was known for 3023 individuals (91% of those assessed).
46% of these individuals reported more than one precipitant. The most frequent reasons
given as precipitating factors in both sexes were interpersonal problems. In line with previous
years, relationship problems with a partner was the most frequently reported precipitant of
self-harm. There were some gender differences: females reported more relationship problems
with family and others, and problems with abuse. Males reported more problems with alcohol
and substance abuse, and financial, housing, employment and legal problems.
Evidence of mental disorder: clinical impression at time of assessment
Information on the presence or absence of psychiatric disorder was available for 1108
individuals (33% of individuals assessed by mental health specialists). Probable depression
was identified in 29% of these. Alcohol or drug misuse was evident in 32% and a further 9%
were assessed as being alcohol dependent. 13% had probable anxiety/stress related
disorders, 7% percent of individuals were likely to have had a severe mental illness
(schizophrenia, bipolar disorder or psychotic depression) and a further 4% were diagnosed
with personality disorders. 4% had no psychiatric disorder evident at time of assessment.
MaSH All Participating Trusts
14
Repetition of Self-Harm
Self-reported previous self-harm:
3332 individuals were assessed for self-reported previous self-harm. 1892 individuals (57%)
reported previous self-harm with or without medical treatment. Of the 3332 assessed, 1050
(32%) reported self-harming within the last year.
Percentage of repeat episodes:
From September 2005 to end of August 2007 a total of 4738 individuals presented with 6459
episodes, which means that approximately 1 in 4 episodes over the two-year report period
were repeat presentations of self-harm (1731, 27%). There was no gender difference in the
percentage of repeat episodes.
Percentage of individuals repeating:
6 month repetition rate
The 6 month repetition rate could be calculated on all individuals who presented before 1st
March 2007 during Year 10 (allowing all individuals a six month follow-up period). There were
3602 individuals who presented during this time; amongst these 14% (459) re-presented with
an episode of self-harm within 6 months of their first episode.
12 month repetition rate
The repetition rate within 12 months of the index episode could be calculated for individuals
who presented during Year 9 (allowing a full 12 months follow-up period during Year 10).
There were 2482 individuals who presented during Year 9 of which 18% (451) re-presented
with an episode of self-harm within 12 months of their first episode.
MaSH All Participating Trusts
15
Characteristics of self-harm episodes Method of Self-Harm
Figure 5: Method of Self-Harm by all episodes at all participating Trusts between
September 2005 and August 2007 (n=6443)
Self-injury17%
Poison other1%
Poison drugs78%
Other4%
A method of self-harm was recorded for 6443 of 6459 episodes (99.8% of all episodes on the
MaSH Project database). The most common method of self-harm was self-poisoning with
drugs (78%) followed by self-injury, for example cutting or piercing, (17%). Other methods
such as drowning and asphyxiation were used in 4% of episodes.
Further analysis of those 284 episodes involving ‘other’ methods of self-harm revealed the
most common method to be hanging or strangulation (23%), followed by jumping from a
height (13%), traffic related incidents (8%), burning self (8%), swallowing a foreign body (7%)
and hitting (7%).
Analysis of all episodes revealed little gender difference in method of self-harm, although
males were more likely to use other methods of self-injury such as hanging and asphyxiation
than females (6% vs. 4%). With respect to gender difference in the specific type of method
used within this subgroup, men were more likely to use hanging/strangulation (27% vs. 18%
of women) and women were more likely to swallow a foreign body (14% vs. 1% of men).
Analysis at the individual level, based on a person’s index episode, revealed that men were
more likely to cut (16% vs. 12%), and women were more likely to self-poison (85% vs. 77%).
This discrepancy between individuals and episodes might be due to subsequent repetition; for
example, although the incidence of poisoning based on individuals was more common
amongst women, more repeat episodes of poisoning occurred by men. Similarly, although
MaSH All Participating Trusts
16
individual men were more likely to initially present with cutting, there were more repeat
episodes of cutting by women.
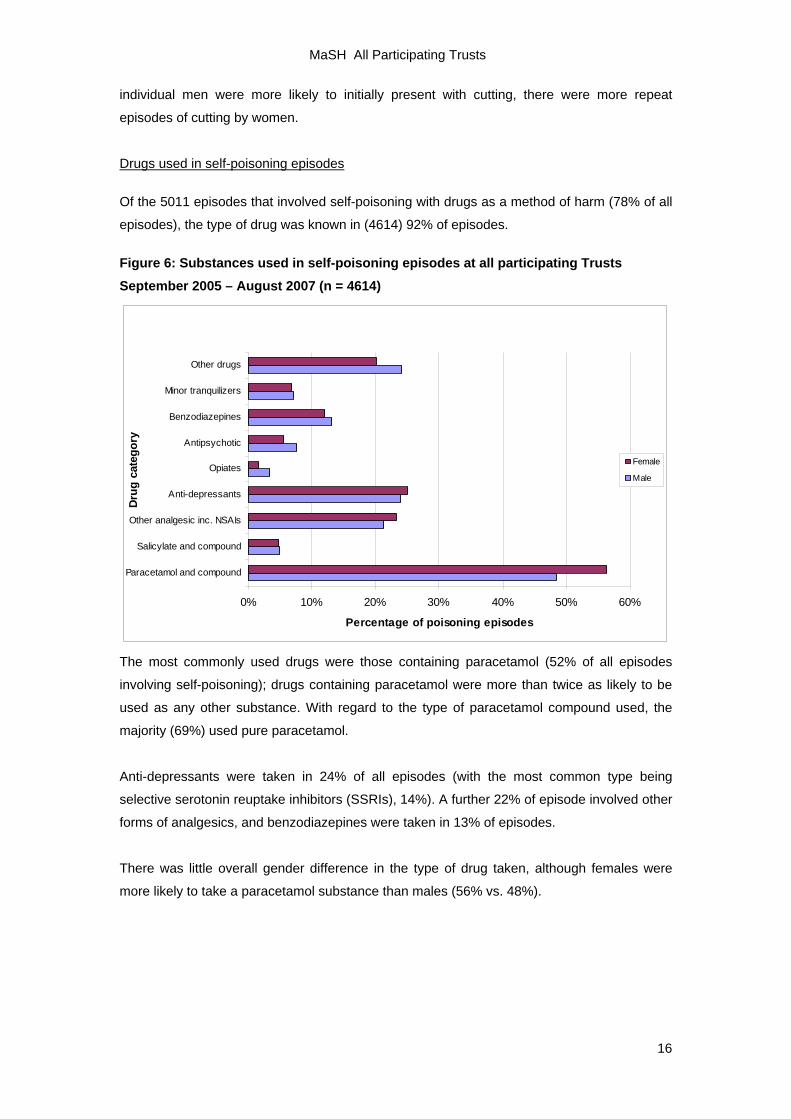
Drugs used in self-poisoning episodes
Of the 5011 episodes that involved self-poisoning with drugs as a method of harm (78% of all
episodes), the type of drug was known in (4614) 92% of episodes.
Figure 6: Substances used in self-poisoning episodes at all participating Trusts September 2005 – August 2007 (n = 4614)
0% 10% 20% 30% 40% 50% 60%
Paracetamol and compound
Salicylate and compound
Other analgesic inc. NSAIs
Anti-depressants
Opiates
Antipsychotic
Benzodiazepines
Minor tranquilizers
Other drugs
Drug
cat
egor
y
Percentage of poisoning episodes
Female
Male
The most commonly used drugs were those containing paracetamol (52% of all episodes
involving self-poisoning); drugs containing paracetamol were more than twice as likely to be
used as any other substance. With regard to the type of paracetamol compound used, the
majority (69%) used pure paracetamol.
Anti-depressants were taken in 24% of all episodes (with the most common type being
selective serotonin reuptake inhibitors (SSRIs), 14%). A further 22% of episode involved other
forms of analgesics, and benzodiazepines were taken in 13% of episodes.
There was little overall gender difference in the type of drug taken, although females were
more likely to take a paracetamol substance than males (56% vs. 48%).
MaSH All Participating Trusts
17
Table 6: Type of paracetamol taken where self-poisoning involved the use of a paracetamol product (n=2462)
Pure paracetamol
(n=1700)
Co-proxamol (n=31)
Paracetamol and salicylate
(n=15)
Other paracetamol compound
(n=716)
Male 70% 1% 0.9% 28%
Female 68% 1% 0.4% 30%
Of self-poisoning episodes with paracetamol compounds, pure paracetamol was the product
most commonly used (69% of all paracetamol poisonings). There were minimal gender
differences in the subtype of paracetamol compounds used.
Table 7: Type of analgesic taken where self-poisoning involved the use of an analgesic product (not paracetamol) (n=1268)
Pure salicylate (n=142)
Salicylate compound
(n=83) NSAIDs (n=714)
Opiate analgesic (n=329)
Male 13% 6% 52% 30%
Female 10% 7% 59% 24%
Amongst those episodes involving other types of analgesics, non-steroidal anti-inflammatory
drugs (NSAIDs) (e.g. ibuprofen) were the most commonly used subtype (used in 56% of all
other analgesic self-poisonings) followed by opiate analgesics (26%). With regards to gender
differences, women were more likely than men to use NSAIDs (59% vs. 52%) whilst a higher
proportion of males used opiate analgesics (30% vs. 24%).
Table 8: Type of antidepressant taken where self-poisoning involved the use of an antidepressant product (n=1137)
Tricylics (n=282)
SSRIs (n=722)
MAOIs (n=4)
Other antidepressants
(n=129)
Male 29% 59% 0.5% 12%
Female 22% 67% 0.3% 11%
As shown in Table 8 the most commonly used antidepressants were SSRIs (used in 64% of
all antidepressant self-poisoning episodes). Women were most likely to use SSRIs (67% vs.
59%) whilst men were more likely to use tricyclics (29% vs. 22%). Monoamine oxidase
inhibitors (MAOIs) were only used in a minority of episodes (0.4%).
MaSH All Participating Trusts
18
Drugs, Age and Gender
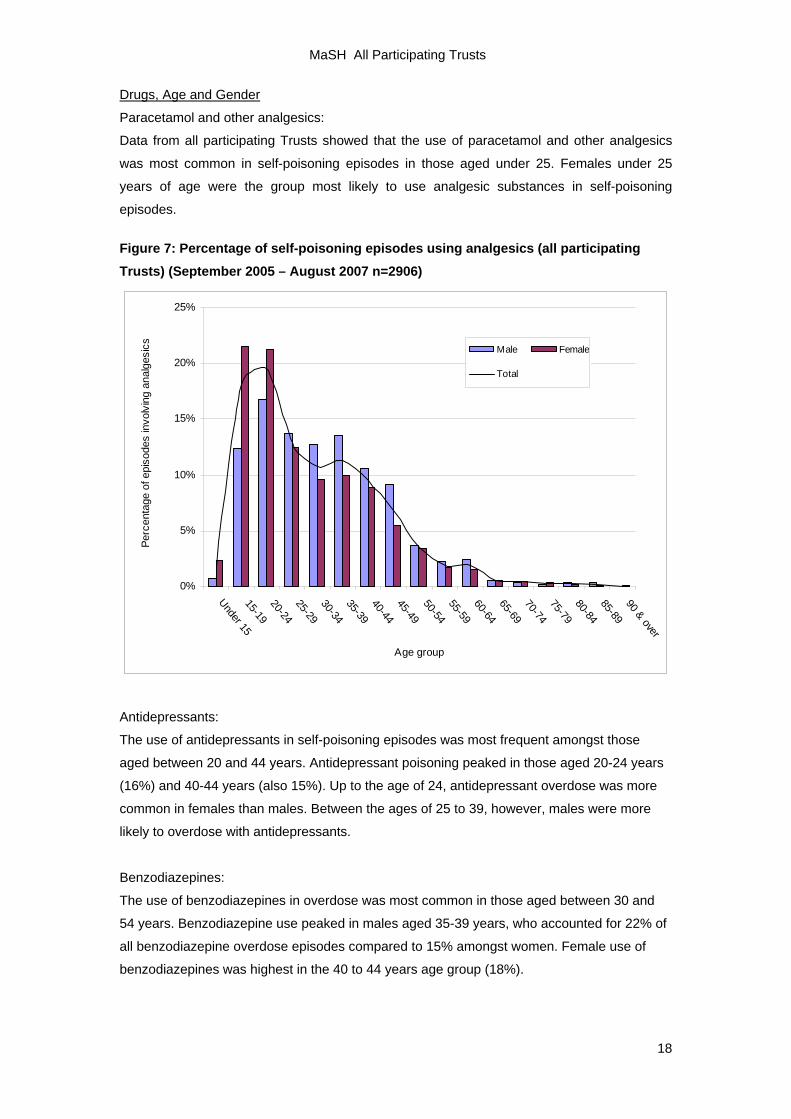
Paracetamol and other analgesics:
Data from all participating Trusts showed that the use of paracetamol and other analgesics
was most common in self-poisoning episodes in those aged under 25. Females under 25
years of age were the group most likely to use analgesic substances in self-poisoning
episodes.
Figure 7: Percentage of self-poisoning episodes using analgesics (all participating Trusts) (September 2005 – August 2007 n=2906)
0%
5%
10%
15%
20%
25%
Under 1515-1920-2425-2930-3435-3940-4445-4950-5455-5960-6465-6970-7475-7980-8485-8990 & over
Age group
Perc
enta
ge o
f epi
sode
s in
volv
ing
anal
gesi
cs Male Female
Total
Antidepressants:
The use of antidepressants in self-poisoning episodes was most frequent amongst those
aged between 20 and 44 years. Antidepressant poisoning peaked in those aged 20-24 years
(16%) and 40-44 years (also 15%). Up to the age of 24, antidepressant overdose was more
common in females than males. Between the ages of 25 to 39, however, males were more
likely to overdose with antidepressants.
Benzodiazepines:
The use of benzodiazepines in overdose was most common in those aged between 30 and
54 years. Benzodiazepine use peaked in males aged 35-39 years, who accounted for 22% of
all benzodiazepine overdose episodes compared to 15% amongst women. Female use of
benzodiazepines was highest in the 40 to 44 years age group (18%).
MaSH All Participating Trusts
19
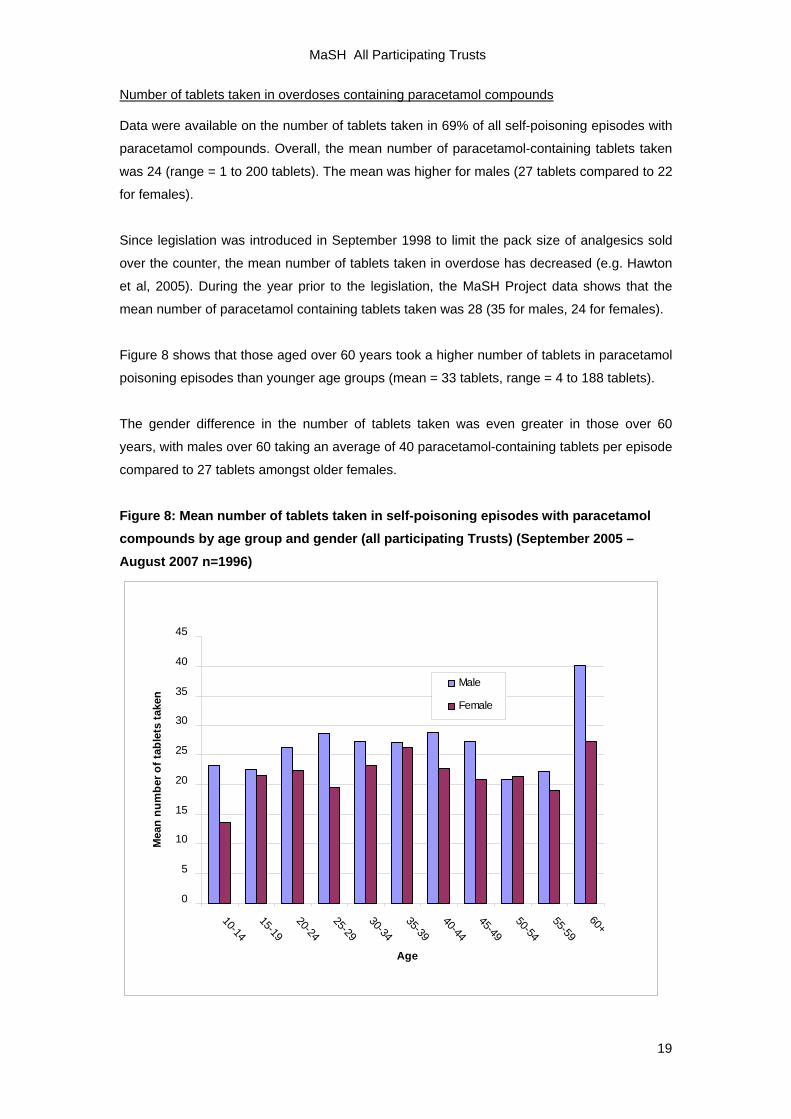
Number of tablets taken in overdoses containing paracetamol compounds
Data were available on the number of tablets taken in 69% of all self-poisoning episodes with
paracetamol compounds. Overall, the mean number of paracetamol-containing tablets taken
was 24 (range = 1 to 200 tablets). The mean was higher for males (27 tablets compared to 22
for females).
Since legislation was introduced in September 1998 to limit the pack size of analgesics sold
over the counter, the mean number of tablets taken in overdose has decreased (e.g. Hawton
et al, 2005). During the year prior to the legislation, the MaSH Project data shows that the
mean number of paracetamol containing tablets taken was 28 (35 for males, 24 for females).
Figure 8 shows that those aged over 60 years took a higher number of tablets in paracetamol
poisoning episodes than younger age groups (mean = 33 tablets, range = 4 to 188 tablets).
The gender difference in the number of tablets taken was even greater in those over 60
years, with males over 60 taking an average of 40 paracetamol-containing tablets per episode
compared to 27 tablets amongst older females.
Figure 8: Mean number of tablets taken in self-poisoning episodes with paracetamol compounds by age group and gender (all participating Trusts) (September 2005 – August 2007 n=1996)
0
5
10
15
20
25
30
35
40
45
10-14
15-19
20-24
25-29
30-34
35-39
40-44
45-49
50-54
55-59
60+
Age
Mea
n nu
mbe
r of t
able
ts ta
ken
Male
Female
MaSH All Participating Trusts
20
Time of presentation
Amongst the 6242 episodes (97%) where time of presentation at the ED was recorded, the
majority of patients presented during the evening and night (58% between the hours of 6pm
and 4am). Presentations peaked between the hours of 8pm and 2am (38%) and declined
during the early hours of the morning (Figure 9).
Figure 9: Number of episodes by time of presentation at all participating Trusts (September 2005 – August 2007 n=6242)
0
100
200
300
400
500
600
700
800
900
0800-0959
1000-1159
1200-1359
1400-1559
1600-1759
1800-1959
2000-2159
2200-2359
0000-0159
0200-0359
0400-0559
0600-0759
Time of presentation
Num
ber o
f epi
sode
s
MaSH All Participating Trusts
21
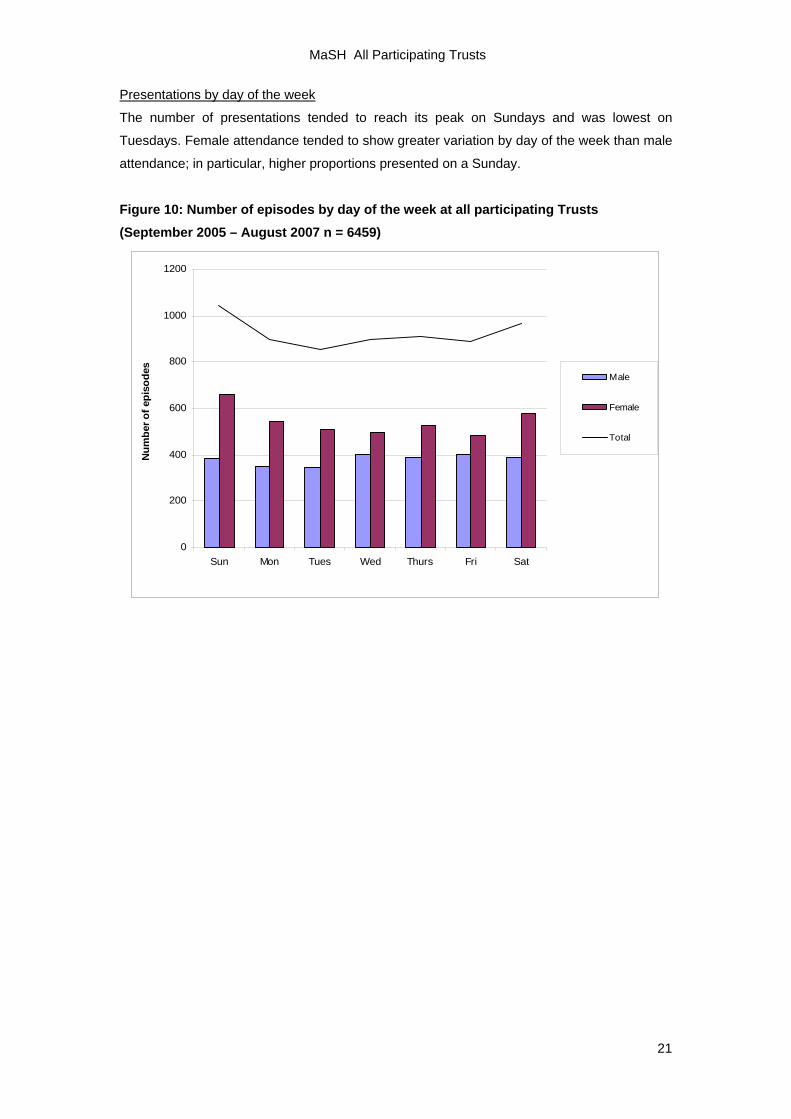
Presentations by day of the week
The number of presentations tended to reach its peak on Sundays and was lowest on
Tuesdays. Female attendance tended to show greater variation by day of the week than male
attendance; in particular, higher proportions presented on a Sunday.
Figure 10: Number of episodes by day of the week at all participating Trusts (September 2005 – August 2007 n = 6459)
0
200
400
600
800
1000
1200
Sun Mon Tues Wed Thurs Fri Sat
Num
ber o
f epi
sode
s
Male
Female
Total
MaSH All Participating Trusts
22
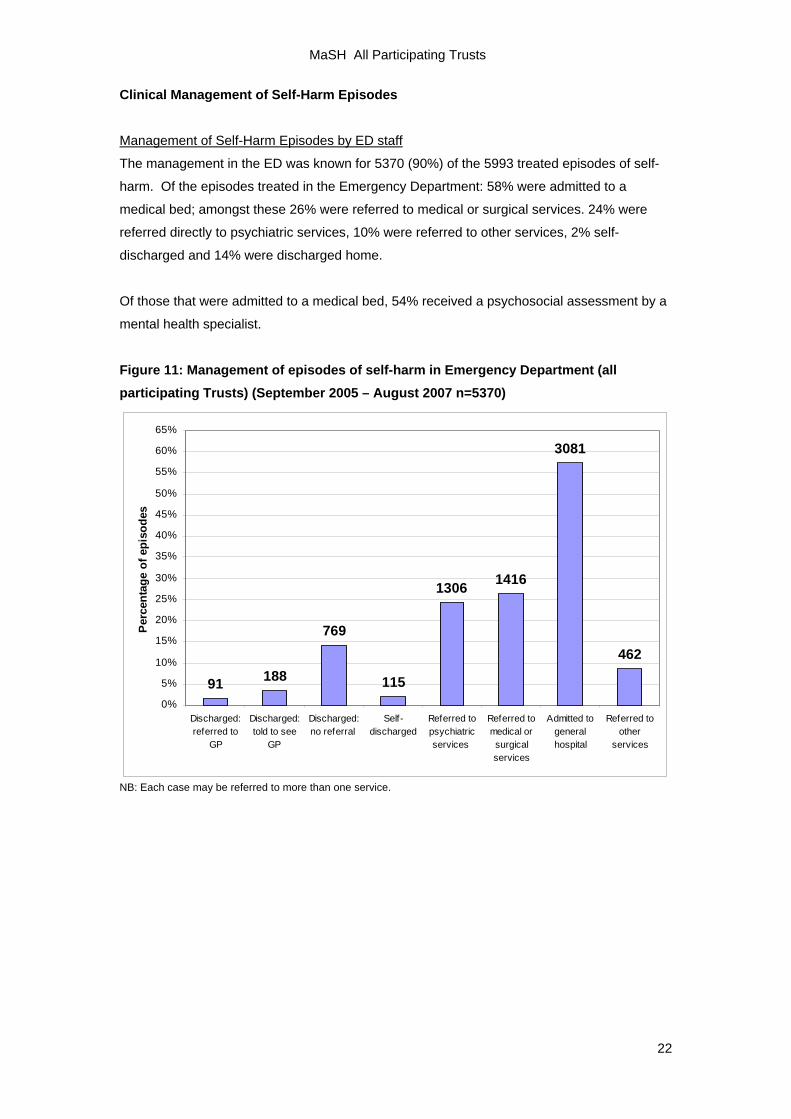
Clinical Management of Self-Harm Episodes
Management of Self-Harm Episodes by ED staff
The management in the ED was known for 5370 (90%) of the 5993 treated episodes of self-
harm. Of the episodes treated in the Emergency Department: 58% were admitted to a
medical bed; amongst these 26% were referred to medical or surgical services. 24% were
referred directly to psychiatric services, 10% were referred to other services, 2% self-
discharged and 14% were discharged home.
Of those that were admitted to a medical bed, 54% received a psychosocial assessment by a
mental health specialist.
Figure 11: Management of episodes of self-harm in Emergency Department (all participating Trusts) (September 2005 – August 2007 n=5370)
462
3081
14161306
115
769
188910%
5%
10%
15%
20%
25%
30%
35%
40%
45%
50%
55%
60%
65%
Discharged:referred to
GP
Discharged:told to see
GP
Discharged:no referral
Self-discharged
Referred topsychiatricservices
Referred tomedical orsurgicalservices
Admitted togeneralhospital
Referred toother
services
Perc
enta
ge o
f epi
sode
s
NB: Each case may be referred to more than one service.
MaSH All Participating Trusts
Management of Self-Harm Episodes by Mental Health Specialists There were 2807 episodes assessed by mental health specialists, of which 70% were
completed by nurses and 28% by Senior House Officers (SHOs). The management by
mental health specialists was known for 2772 episodes (99%).
Figure 12: Management of self-harm episodes by mental health specialists (all participating Trusts) (September 2005 – August 2007 n=2773)
126 83 135 112 171 166 125242
52
254 256
70 21
1247
0%5%
10%15%20%25%30%35%40%45%50%
Admitte
d to p
sych
iatric
unit
Urgent
referr
al
Day ho
spita
l
Communit
y psy
chiat
ry
MH outpa
tient a
ppoin
tmen
t
Duty SHO
CDT/CAT re
ferral
CDT/CAT (to
ld to
see)
Social S
ervice
s
Volunta
ry se
rvice
s
Other re
ferral
Psych
iatric re
view
Self-di
scha
rge
GP only
Per
cent
age
of e
piso
des
NB Each case may be referred to more than one service.
There were 126 (5%) admissions to a psychiatric unit, 15 of these made under the Mental
Health Act, 2007. Of the 83 (3%) urgent referrals, 68 were made to out-patients, 10 to the
crisis resolution team and 5 to the 24-hour community service team. Other mental health
referrals constituted 709 (26%) of the episodes, which included referral to day hospital,
community psychiatry, out-patient appointments, community drug and alcohol teams, and
psychiatric review by the assessor. 562 (20%) episodes were referred to other services
including social services and voluntary services (e.g. Relate, Cruse, 42nd Street, debt
counselling, psychotherapy). Referral to GP (with no other formal referral) constituted 1247
(45%) of the episodes.
23
MaSH All Participating Trusts
Comparisons across all participating Trusts
Comparisons of the characteristics of self-harm presentations at the three EDs are
summarised below:
MRI (Manchester Royal Infirmary)
• MRI had the highest number of episodes and individuals presenting to the ED within
the study period: 2153 individuals accounting for 2702 episodes. Wythenshawe had
1511 individuals making up 1975 episodes and NMGH had the least: 1392 individuals
accounting for 1782 episodes.
• At MRI, the group most likely to present with self-harm were females aged 25-29,
whilst the group most likely to present to NMGH and Wythenshawe were females
aged 15-19.
• MRI had the highest proportion of individuals from ethnic minority groups (20%) with
the most common being Indian/Pakistani/Bangladeshi (8%) and Black (7%). This
compares to 12% at MRI and 7% at Wythenshawe being from ethnic minority groups.
• The rate of unemployment was highest amongst those presenting at MRI (40%)
compared to 37% at NMGH and 35% at Wythenshawe. MRI also had the highest
proportion of students (17%) compared to Wythenshawe (12%) and NMGH (9%).
• MRI had the highest proportion of specialist assessments carried out by Senior
House Officers (SHOs) (55% compared to 42% carried out by nurses). In NMGH and
Wythenshawe specialist assessments were more likely to be carried out by nurses
(NMGH: 90% carried out by nurses vs. 9% by SHOs; Wythenshawe: 88% nurses vs.
11% SHOs).
• Admission to a psychiatric unit following assessment by a mental health specialist
was most likely at MRI (7% compared to 3% at Wythenshawe and 2% at NMGH).
Other psychiatric referrals (urgent and non-urgent outpatient) were also highest at
MRI (33%) compared to 28% at Wythenshawe and 23% at NMGH.
NMGH (North Manchester General Hospital)
• NMGH had the lowest proportion of females presenting with self-harm (55% of all
individuals vs. 62% at Wythenshawe and 60% at MRI).
• The mean age of individuals was highest at NMGH (35 years compared to 33 years
at Wythenshawe and 31 years at MRI).
• NMGH had a higher proportion of individuals living alone (23% vs. 21% at
Wythenshawe and 19% at MRI).
• The proportion of episodes where the patient did not wait for treatment was lowest at
NMGH (3% compared to 6% at Wythenshawe and 11% at MRI).
• NMGH discharged the highest proportion of episodes from the ED (either to the GP
or without referral) (35% compared to 16% at MRI and 9% at Wythenshawe).
24
MaSH All Participating Trusts
• Referrals to non-psychiatric ‘other’ services (e.g. voluntary, social services) following
specialist assessment were highest at NMGH (34%) compared to 19% at MRI and
10% at Wythenshawe.
• NMGH had a higher proportion of people who used ‘other’ methods of self-injury
(including hanging and asphyxiation) as a method of self-harm (6% compared to 4%
at MRI and 4% at Wythenshawe).
Wythenshawe Hospital
• At Wythenshawe, self-harm presentations were highest for men aged 35-39, whilst
self-harm amongst males was highest in the 20-24 age group for NMGH and MRI.
• The highest proportion of individuals living with their parents was at Wythenshawe
(27% vs. 21% at NMGH and 16% at MRI).
• Wythenshawe had the highest proportion of episodes with a completed ED
assessment form (72%) compared to 28% at MRI and 26% at NMGH.
• Wythenshawe admitted the highest proportion of episodes to a medical ward (69%)
compared to 45% at NMGH and 57% at MRI.
• Wythenshawe had the highest proportion of episodes with a completed specialist
(psychiatric) assessment (46%) compared to 43% at NMGH and 42% at MRI.
• The proportion of individuals who were currently receiving psychiatric treatment was
higher in Wythenshawe (47%) compared to 44% at MRI and 40% at NMGH.
• Information on the presence or absence of mental disorder was available for fewer
individuals at Wythenshawe (21% compared to 39% at NMGH and 42% at MRI).
• Repetition within 6 months was higher at Wythenshawe (15% compared to 12% at
both NMGH and MRI). Repetition rate for a repeat presentation of self-harm within 12
months of the index episode was similar across the 3 hospitals (19% for both NMGH
and Wythenshawe and 17% for MRI).
25
MaSH All Participating Trusts
TRENDS OVER TIME AND FIVE YEAR ANALYSES
Since September 2002, the MaSH Project has been collecting data on all episodes of self-harm
(including non-assessed episodes). In this report we present 5-year trends and subgroup analyses of
rates and self-harm repetition from 2002 to 2007.
Trends in Self-Harm Rates
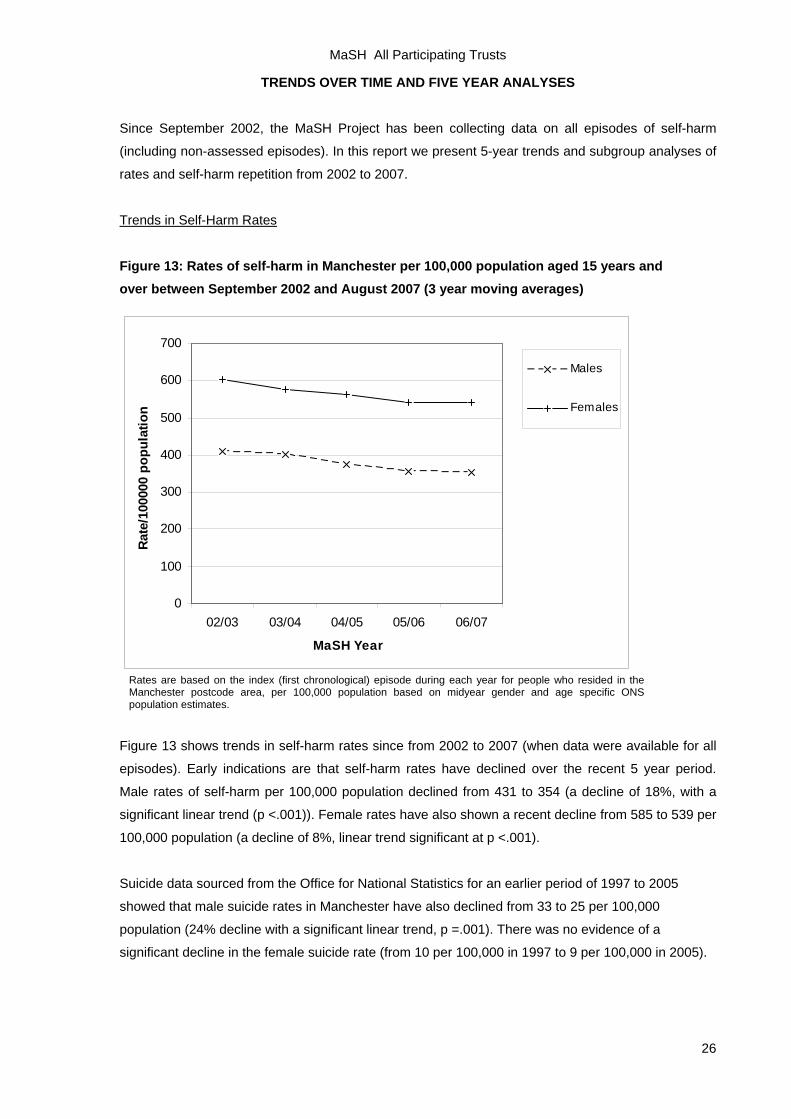
Figure 13: Rates of self-harm in Manchester per 100,000 population aged 15 years and over between September 2002 and August 2007 (3 year moving averages)
0
100
200
300
400
500
600
700
02/03 03/04 04/05 05/06 06/07
MaSH Year
Rate
/100
000
popu
latio
n
Males
Females
Rates are based on the index (first chronological) episode during each year for people who resided in the Manchester postcode area, per 100,000 population based on midyear gender and age specific ONS population estimates.
Figure 13 shows trends in self-harm rates since from 2002 to 2007 (when data were available for all
episodes). Early indications are that self-harm rates have declined over the recent 5 year period.
Male rates of self-harm per 100,000 population declined from 431 to 354 (a decline of 18%, with a
significant linear trend (p <.001)). Female rates have also shown a recent decline from 585 to 539 per
100,000 population (a decline of 8%, linear trend significant at p <.001).
Suicide data sourced from the Office for National Statistics for an earlier period of 1997 to 2005
showed that male suicide rates in Manchester have also declined from 33 to 25 per 100,000
population (24% decline with a significant linear trend, p =.001). There was no evidence of a
significant decline in the female suicide rate (from 10 per 100,000 in 1997 to 9 per 100,000 in 2005).
26
MaSH All Participating Trusts
Trends in Self-Harm Rates by Gender and Age
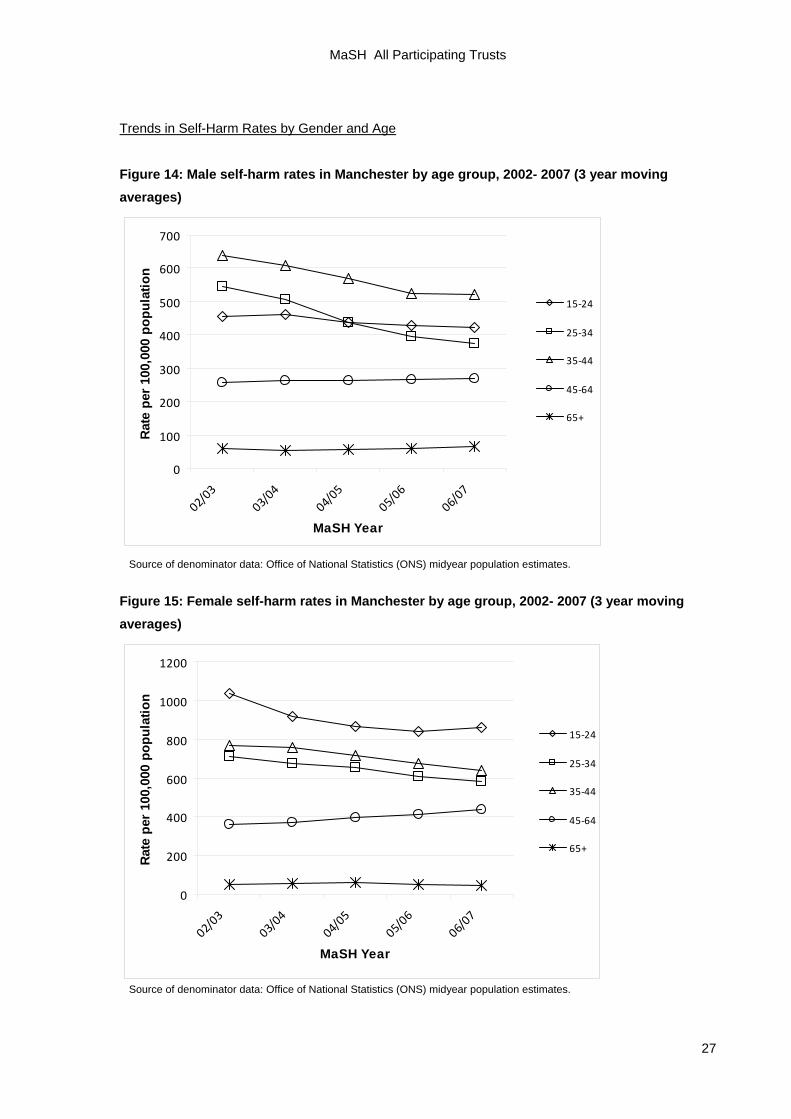
Figure 14: Male self-harm rates in Manchester by age group, 2002- 2007 (3 year moving averages)
0
100
200
300
400
500
600
700
02/03
03/04
04/05
05/06
06/07
MaSH Year
Rat
e pe
r 10
0,00
0 po
pula
tion
15‐24
25‐34
35‐44
45‐64
65+
Source of denominator data: Office of National Statistics (ONS) midyear population estimates.
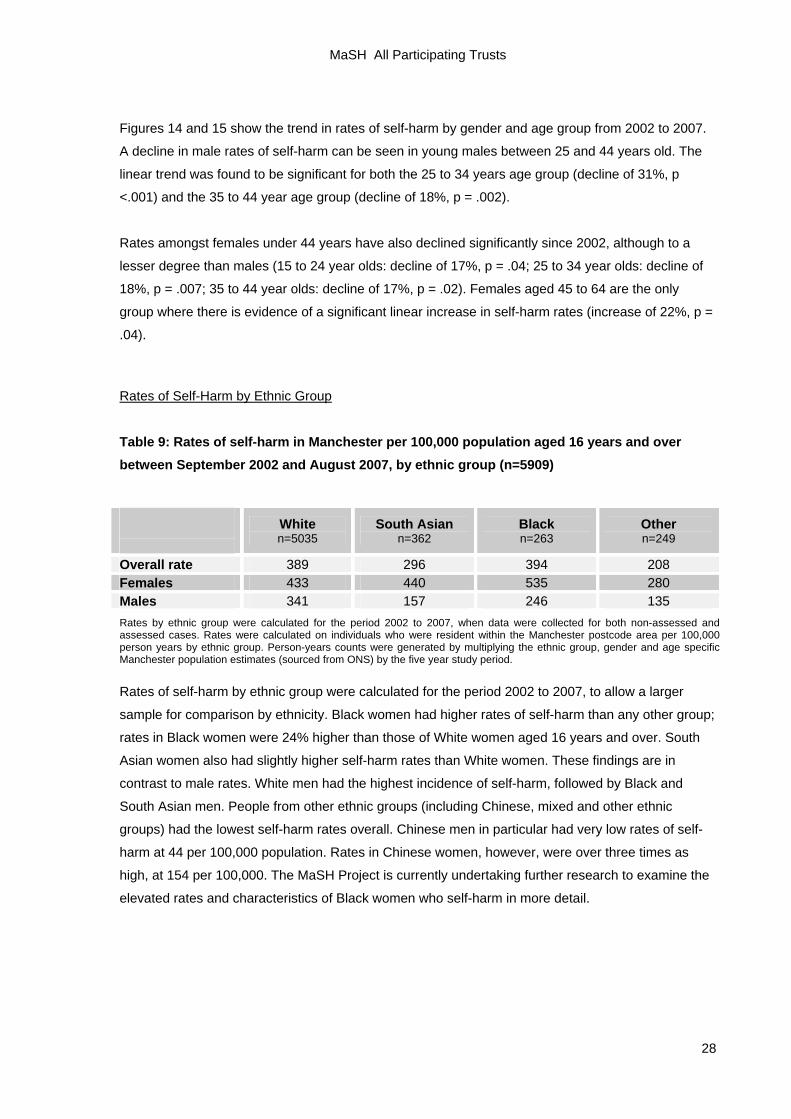
Figure 15: Female self-harm rates in Manchester by age group, 2002- 2007 (3 year moving averages)
0
200
400
600
800
1000
1200
02/03
03/04
04/05
05/06
06/07
MaSH Year
Rate
per
100
,000
pop
ulat
ion
15‐24
25‐34
35‐44
45‐64
65+
Source of denominator data: Office of National Statistics (ONS) midyear population estimates.
27
MaSH All Participating Trusts
Figures 14 and 15 show the trend in rates of self-harm by gender and age group from 2002 to 2007.
A decline in male rates of self-harm can be seen in young males between 25 and 44 years old. The
linear trend was found to be significant for both the 25 to 34 years age group (decline of 31%, p
<.001) and the 35 to 44 year age group (decline of 18%, p = .002).
Rates amongst females under 44 years have also declined significantly since 2002, although to a
lesser degree than males (15 to 24 year olds: decline of 17%, p = .04; 25 to 34 year olds: decline of
18%, p = .007; 35 to 44 year olds: decline of 17%, p = .02). Females aged 45 to 64 are the only
group where there is evidence of a significant linear increase in self-harm rates (increase of 22%, p =
.04).
Rates of Self-Harm by Ethnic Group
Table 9: Rates of self-harm in Manchester per 100,000 population aged 16 years and over between September 2002 and August 2007, by ethnic group (n=5909)
White n=5035
South Asian n=362
Black n=263
Other n=249
Overall rate 389 296 394 208 Females 433 440 535 280 Males 341 157 246 135 Rates by ethnic group were calculated for the period 2002 to 2007, when data were collected for both non-assessed and assessed cases. Rates were calculated on individuals who were resident within the Manchester postcode area per 100,000 person years by ethnic group. Person-years counts were generated by multiplying the ethnic group, gender and age specific Manchester population estimates (sourced from ONS) by the five year study period.
Rates of self-harm by ethnic group were calculated for the period 2002 to 2007, to allow a larger
sample for comparison by ethnicity. Black women had higher rates of self-harm than any other group;
rates in Black women were 24% higher than those of White women aged 16 years and over. South
Asian women also had slightly higher self-harm rates than White women. These findings are in
contrast to male rates. White men had the highest incidence of self-harm, followed by Black and
South Asian men. People from other ethnic groups (including Chinese, mixed and other ethnic
groups) had the lowest self-harm rates overall. Chinese men in particular had very low rates of self-
harm at 44 per 100,000 population. Rates in Chinese women, however, were over three times as
high, at 154 per 100,000. The MaSH Project is currently undertaking further research to examine the
elevated rates and characteristics of Black women who self-harm in more detail.
28
MaSH All Participating Trusts
Trends in Annual Rate of Self-Harm Repetition by Gender
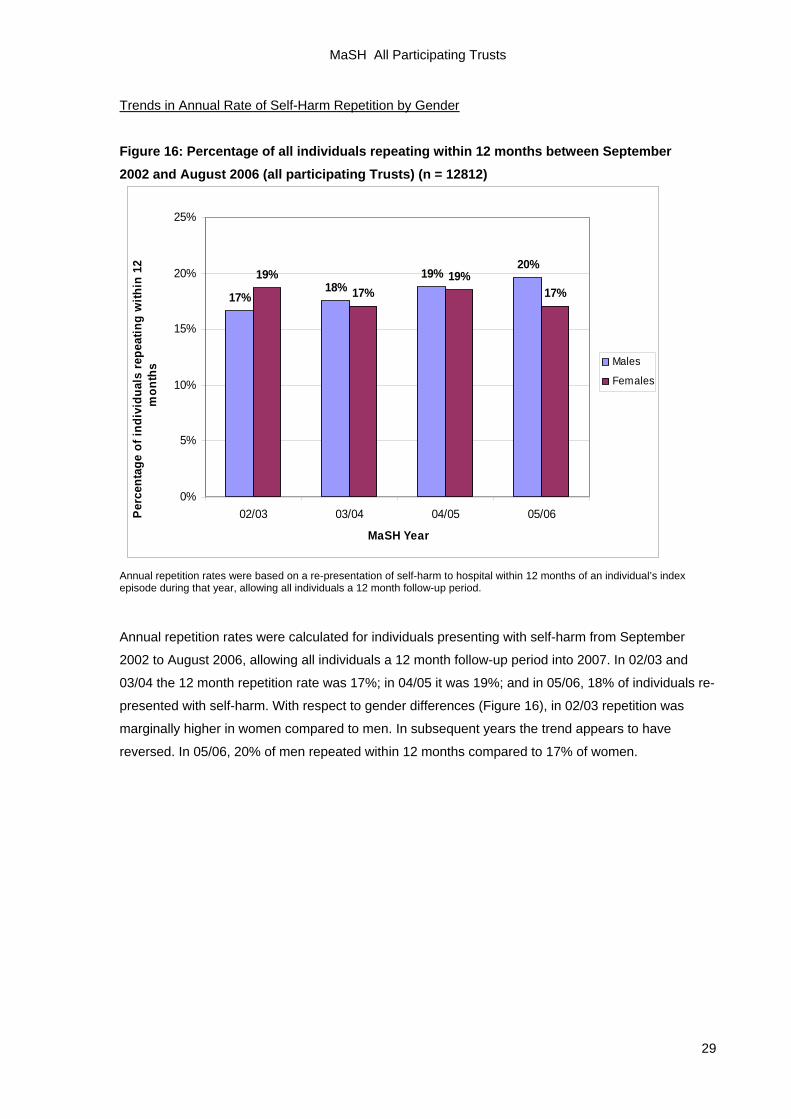
Figure 16: Percentage of all individuals repeating within 12 months between September 2002 and August 2006 (all participating Trusts) (n = 12812)
17%18%
19%20%
19%17%
19%17%
0%
5%
10%
15%
20%
25%
02/03 03/04 04/05 05/06
MaSH Year
Perc
enta
ge o
f ind
ivid
uals
repe
atin
g w
ithin
12
mon
ths Males
Females
Annual repetition rates were based on a re-presentation of self-harm to hospital within 12 months of an individual’s index episode during that year, allowing all individuals a 12 month follow-up period.
Annual repetition rates were calculated for individuals presenting with self-harm from September
2002 to August 2006, allowing all individuals a 12 month follow-up period into 2007. In 02/03 and
03/04 the 12 month repetition rate was 17%; in 04/05 it was 19%; and in 05/06, 18% of individuals re-
presented with self-harm. With respect to gender differences (Figure 16), in 02/03 repetition was
marginally higher in women compared to men. In subsequent years the trend appears to have
reversed. In 05/06, 20% of men repeated within 12 months compared to 17% of women.
29
MaSH All Participating Trusts
Rates of Self-Harm Repetition by Method and Gender
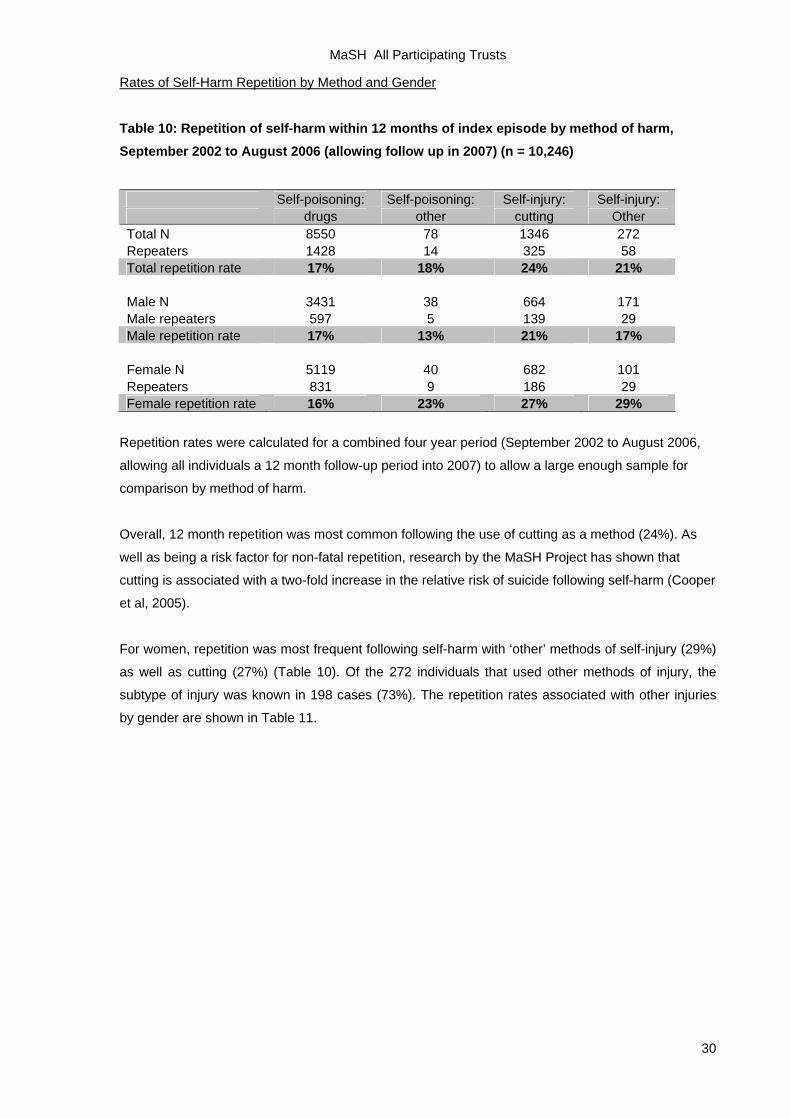
Table 10: Repetition of self-harm within 12 months of index episode by method of harm, September 2002 to August 2006 (allowing follow up in 2007) (n = 10,246)
Self-poisoning: Self-poisoning: Self-injury: Self-injury: drugs other cutting Other Total N 8550 78 1346 272 Repeaters 1428 14 325 58 Total repetition rate 17% 18% 24% 21% Male N 3431 38 664 171 Male repeaters 597 5 139 29 Male repetition rate 17% 13% 21% 17% Female N 5119 40 682 101 Repeaters 831 9 186 29 Female repetition rate 16% 23% 27% 29%
Repetition rates were calculated for a combined four year period (September 2002 to August 2006,
allowing all individuals a 12 month follow-up period into 2007) to allow a large enough sample for
comparison by method of harm.
Overall, 12 month repetition was most common following the use of cutting as a method (24%). As
well as being a risk factor for non-fatal repetition, research by the MaSH Project has shown that
cutting is associated with a two-fold increase in the relative risk of suicide following self-harm (Cooper
et al, 2005).
For women, repetition was most frequent following self-harm with ‘other’ methods of self-injury (29%)
as well as cutting (27%) (Table 10). Of the 272 individuals that used other methods of injury, the
subtype of injury was known in 198 cases (73%). The repetition rates associated with other injuries
by gender are shown in Table 11.
30
MaSH All Participating Trusts
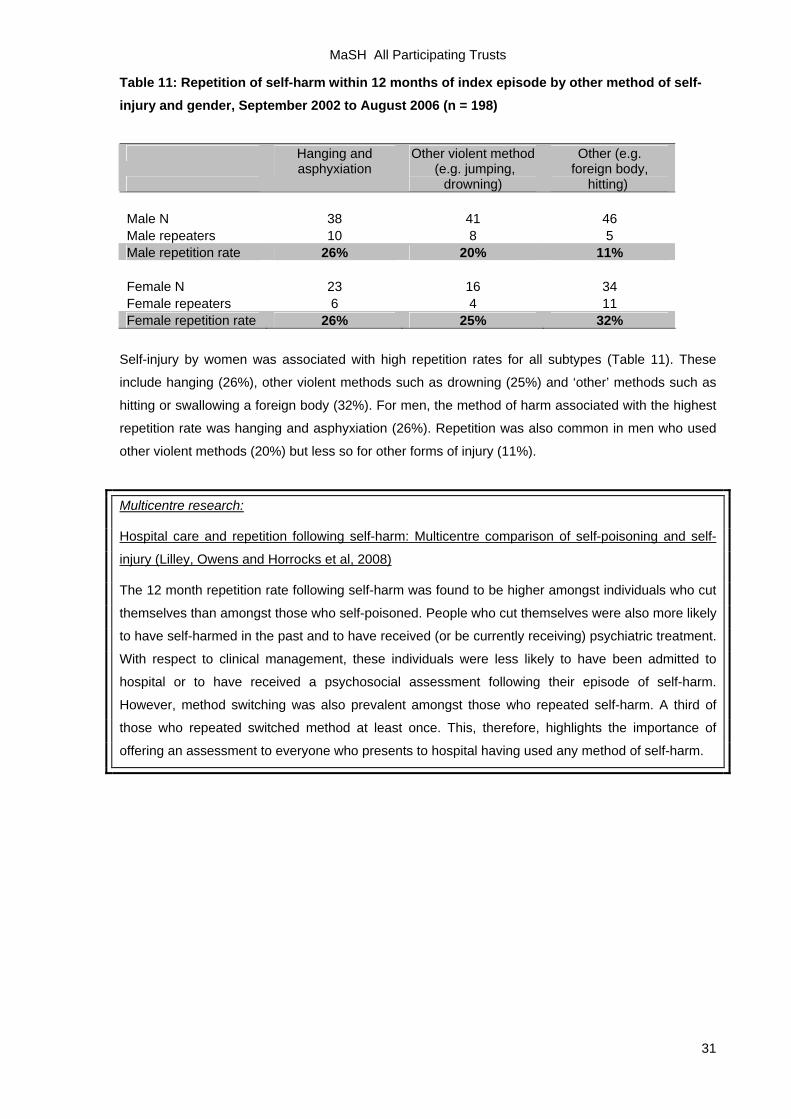
Table 11: Repetition of self-harm within 12 months of index episode by other method of self-injury and gender, September 2002 to August 2006 (n = 198)
Hanging and Other violent method Other (e.g.
asphyxiation (e.g. jumping,
drowning) foreign body,
hitting) Male N 38 41 46 Male repeaters 10 8 5 Male repetition rate 26% 20% 11% Female N 23 16 34 Female repeaters 6 4 11 Female repetition rate 26% 25% 32%
Self-injury by women was associated with high repetition rates for all subtypes (Table 11). These
include hanging (26%), other violent methods such as drowning (25%) and ‘other’ methods such as
hitting or swallowing a foreign body (32%). For men, the method of harm associated with the highest
repetition rate was hanging and asphyxiation (26%). Repetition was also common in men who used
other violent methods (20%) but less so for other forms of injury (11%).
Multicentre research:
Hospital care and repetition following self-harm: Multicentre comparison of self-poisoning and self-
injury (Lilley, Owens and Horrocks et al, 2008)
The 12 month repetition rate following self-harm was found to be higher amongst individuals who cut
themselves than amongst those who self-poisoned. People who cut themselves were also more likely
to have self-harmed in the past and to have received (or be currently receiving) psychiatric treatment.
With respect to clinical management, these individuals were less likely to have been admitted to
hospital or to have received a psychosocial assessment following their episode of self-harm.
However, method switching was also prevalent amongst those who repeated self-harm. A third of
those who repeated switched method at least once. This, therefore, highlights the importance of
offering an assessment to everyone who presents to hospital having used any method of self-harm.
31
MaSH All Participating Trusts
Recent Research based on the MaSH Project Data from the MaSH Project have been used to assist further research into self-harm. Brief
summaries of recent projects are outlined below.
Communication between secondary and primary care following self-harm: Are National Institute of
Clinical Excellence (NICE) guidelines being met? (Cooper et al, 2008)
Most patients contact their GP following presentation to an Emergency Department (ED) after a self-
harm incident. The aim of this study was to assess the standard of documentation and
communication to GPs from secondary care as recommended by the National Institute of Clinical
Excellence (NICE) guidelines on the short-term management of people who self-harm. NICE
guidelines recommend that all patients presenting with self-harm should receive a psychosocial
assessment of social, psychological and motivational factors, mood and risk and that this information
should be passed on to the patient’s GP.
Data were collected on 93 consecutive episodes of self-harm presenting at the Manchester Royal
Infirmary over a four week period. 62% of episodes were communicated to the patient’s GP, 58% of
these communications were within 24 hours and most within 3 days. Communication via psychiatric
staff was most detailed. ED clinicians provided few communications, and they were of limited content.
Communication with the patient's GP was not made in half of those cases seen by a mental health
specialist.
The results suggest that government guidelines are only partially being met. Reliance on
communication by ED staff would leave a substantial proportion of patients discharged from the ED
with no or minimal communication to primary care. Psychiatric services also need to improve the rate
of communication to the patient's GP following assessment.
Psychosocial assessment following self-harm: Results from the Multi-Centre Monitoring of Self-Harm
Project (Kapur et al, 2008)
Psychosocial assessment is central to the management of self-harm, but not all individuals receive
an assessment following presentation to hospital. Episodes of self-harm presenting to six hospitals in
the UK cities of Oxford, Leeds, and Manchester over an 18-month period (1st March 2000 to 31st
August 2001) were identified. A total of 7,344 individuals presented with 10,498 episodes of self-harm
during the study period. Overall, 60% of episodes resulted in a specialist psychosocial assessment.
Factors associated with an increased likelihood of assessment included age over 55 years, current
psychiatric treatment, admission to a medical ward, and ingestion of antidepressants. Factors
associated with a decreased likelihood of assessment included unemployment, self-cutting, attending
outside normal working hours, and self-discharge.
The study concluded that many people who harm themselves, including potentially vulnerable
individuals, do not receive an adequate assessment while at hospital. Staff should be aware of the
organisational and clinical factors associated with non-assessment.
32
MaSH All Participating Trusts
The effect of using NHS number as the unique identifier for patients who self-harm: A multi-centre
descriptive study (Cooper et al, 2007)
The aims of this research were to determine the proportion of individuals who presented to
Emergency Departments with self-harm where an NHS number had been successfully traced and to
investigate the characteristics of patients associated with non-capture. Data from the Multicentre
Monitoring of Self-Harm Project were used to identify consecutive patients (N = 3000) who were
treated in six Emergency Departments in Oxford, Manchester and Leeds in 2004 and 2005 following
self-harm.
NHS number was available for 55% to 73% of individuals across centres. Characteristics associated
with non-recording of NHS number in more than one centre included ethnic minority groups and the
homeless or those living in a hostel or other institution. Individual centre characteristics included
being of male gender, not being admitted to general hospital and using self-injury as a method of
harm. Being aged less than 25 years was also associated with non-recording of NHS number in
another centre.
The study concluded that basing research studies on NHS number as the unique identifier, as
suggested by the Data Protection Act 1998 and the Patient Information Advisory Group, would
exclude some of the most vulnerable groups for further self-harm or suicide. This bias may also affect
other research registers.
The Multicentre Investigation of Self-Harm Projects based upon collection of data on self-harm in multiple centres are an integral component of
the National Suicide Prevention Strategy for England (2002). The MaSH Project is part of a
Department of Health funded multicentre collaboration with Oxford and Derby. The benefits of
multicentre monitoring include:
• the provision of data on national trends to inform suicide prevention strategies
• the ability to compare differences between centres and detect changing patterns of mortality
following self-harm
• the ability to study sub-groups within the self-harming population, and
• the establishment of a network that can conduct studies to inform the development of clinical
services and evaluate specific prevention initiatives.
Resource for research experience during medical training
We also provide a resource for psychiatrists and medics in training who want to get involved in
research and audit. Projects currently being undertaken include an investigation of patient outcomes
according to the type of service model in place, including specialist self-harm teams. Previous
projects that medical trainees have been involved in include the audit of communication between
primary and secondary care (Cooper et al, 2008), a study of risk assessment and management of
heavy drinkers (Taylor et al, 1999), and a dissertation on gender and self-harm repetition.
33
MaSH All Participating Trusts
References Cooper, J., Murphy, E., Jordan, R. & Mackway-Jones, K. (2008). ‘Communication between secondary and primary care following self-harm: are NICE guidelines being met?’ Annals of General Psychiatry 7:21. Cooper, J., Husain, N., Webb, R., Waheed, W., Kapur, N., Guthrie E. & Appleby, L. (2006). ‘Self-harm in the UK - Differences between South Asians and Whites in rates, characteristics, provision of service and repetition.’ Social Psychiatry and Psychiatric Epidemiology 41(10): 782-788. Cooper, J., Kapur, N., Dunning, J., Guthrie, E. & Appleby, L. (2006). ‘A clinical tool for assessing risk after self-harm.’ Annals of Emergency Medicine 48(4): 459-466. Cooper, J. Kapur, N., Webb, R., Lawlor, M., Guthrie, E., Mackway-Jones, K. & Appleby, L. (2005). ‘Suicide after deliberate self-harm: A 4-year cohort study.’ American Journal of Psychiatry 162 (2):297-303. Corcoran, P., Arensman, E. & Perry, I. (2007). ‘The area-level association between hospital-treated deliberate self-harm, deprivation and social fragmentation in Ireland.’ Journal of Epidemiology and Community Health 61 (12): 1050-1055. Department of Health (2002). ‘National Suicide Prevention Strategy for England.’ London: Department of Health. Douglas, J., Cooper, J., Amos, T., Webb, R., Guthrie, E. & Appleby, L. (2004). ‘"Near-fatal" deliberate self-harm: characteristics, prevention and implications for the prevention of suicide.’ Journal of Affective Disorders 79(1-3): 263-268. Gunnell, D., Shepherd, M. & Evans, M. (2000). ‘Are recent increases in deliberate self-harm associated with changes in socio-economic conditions? An ecological analysis of patterns of deliberate self-harm in Bristol 1972-3 and 1996-6.’ Psychological Medicine 30 (5): 1197-1203. Hawton, K., Bergen, H., Casey, D., Simkin, S., Palmer, B., Cooper, J., Kapur, N., Horrocks, J., House, A., Lilley, R., Noble, R. & Owens, D. (2007). ‘Self-harm in England: a tale of three cities - Multicentre study of self-harm.’ Social Psychiatry and Psychiatric Epidemiology 42(7): 513-521. Hawton, K. & Harriss, L. (2006). ‘Deliberate self-harm in people aged 60 years and over: characteristics and outcome of a 20-year cohort.’ International Journal of Geriatric Psychiatry 21 (6): 572-581. Hawton, K., Simkin, S., Deeks, J., Cooper, J., Johnston, A., Waters, K., Arundel, M., Bernal, W., Gunson, B., Hudson, M., Suri, D. & Simpson K. (2004). ‘UK legislation on analgesic packs: before and after study of long term effect on poisonings.’ British Medical Journal 329(7474): 1076-1079. Hawton, K. & D. Zahl, Weatherall, R. (2003). "Suicide following deliberate self-harm: long-term follow-up of patients who presented to a general hospital." British Journal of Psychiatry 182: 537-542. Hawton, K., Harriss, L., Hodder, K., Simkin, S. & Gunnell, D. (2001). ‘The influence of the economic and social environment on deliberate self-harm and suicide: an ecological and person-based study.’ Psychological Medicine 31 (5): 827-836. Index of Multiple Deprivation (2007). Available from: www.communities.gov.uk/communities/neighbourhoodrenewal/deprivation/deprivation07 Johnston, A. Cooper, J. & Kapur, N. (2006). ‘Exploring the Relationship Between Area Characteristics and Self-Harm: Old and New Approaches.’ Crisis 27 (2):88-91. Johnston, A., Cooper, J., Webb, R. & Kapur, N. (2006). ‘Individual and area-level predictors of self-harm repetition.’ British Journal of Psychiatry 189: 416-421.
Kapur, N., Cooper, J., King-Hele, S., Webb, R., Lawlor, M., Rodway, C. & Appleby, L. (2006). ‘The repetition of suicidal behaviour: a multi-centre cohort study.’ Journal of Clinical Psychiatry 6 Lilley, R., Owens, D., Horrocks, J., Noble, R., Bergen, H., Hawton, K., Casey, D., Simkin, S., Murphy, E., Cooper, J. & Kapur, N. (2008). ‘Hospital care and repetition following self-harm: Multicentre comparison of self-poisoning and self-injury.’ The British Journal of Psychiatry 192 (6): 440-445. Murphy, E., Dickson, S., Donaldson, I., Healey, M., Kapur, N., Appleby, L. & Cooper, J. (2007). ‘Self-harm in Manchester: 1st September 2003 to 31st August 2005’ (MaSH Audit). National Collaborating Centre for Mental Health (2004). ‘Self-harm: The short-term physical and psychological management and secondary prevention self-harm in primary and secondary care’. London: National Institute for Health and Clinical Excellence. Office for National Statistics (2001) – Census 2001 – Neighbourhood Statistics – Manchester – Ethnic Groups (Internet). Available from: http://neighbourhood.statistics.gov.uk/dissemination/LeadTableView.do?a=7&b=276778&c=manchester&d=13&e=15&g=351271&i=1001x1003x1004&m=0&r=1&s=1250776292597&enc=1&dsFamilyId=47 (Accessed 19/08/2009). Office for National Statistics - Neighbourhood Statistics (2006-2007) – Manchester – Work Deprivation (Internet). Available from: http://www.neighbourhood.statistics.gov.uk/dissemination/LeadKeyFigures.do?a=3&b=276778&c=manchester&d=13&e=9&g=351271&i=1001x1003x1004x1011&m=0&r=1&s=1233245236789&enc=1 (Accessed 29/01/2009). Office for National Statistics - Neighbourhood Statistics (2006) – Manchester – Incapacity Benefit/Severe Disablement Allowance Claimants (Internet). Available from: http://www.neighbourhood.statistics.gov.uk/dissemination/LeadTableView.do?a=3&b=276778&c=manchester&d=13&e=9&f=19810&g=351271&i=1001x1003x1004x1005&l=1359&o=235&m=0&r=1&s=1233246224398&enc=1 (Accessed 29/01/2009). Office for National Statistics – National Suicide Data 1991 to 2006. Available from: www.statistics.gov.uk/downloads/theme_health/suicide_uk_1991to2006_table.xls (Accessed 29/01/2009). O'Reilly, D., Rosato, M., Connolly, S. & Cardwell, C. (2008). ‘Area factors and suicide: 5-year follow-up of the Northern Ireland population.’ British Journal of Psychiatry 192 (2): 106-111. Royal College of Psychiatrists (2004). ‘Assessment following self-harm in adults’. Council Report CR122. Royal College of Psychiatrists 28 (12): 468.
Taylor, C., Cooper, J., & Appleby, L. (1999). ‘Is suicide risk taken seriously in heavy drinkers who harm themselves?’ Acta Psychiatrica Scandinavica 100: 309-311.