60
The Mathematical Sciences People Pipeline October 2015

The Mathematical Sciences People Pipeline
October 2015
LMS-BTL-70_ReportFINAL.pdf 1 25/09/2015 10:26LMS-BTL-70_ReportFINAL.pdf 64 25/09/2015 10:26
This report was prepared for the Council for the Mathematical Sciences by Andrew Rowell (Senior Research Analyst) and Fiona Tuck (Head of Research) of TBR’s Skills and Labour Market Team.
Floor D, Milburn House,Dean Street, Newcastle upon Tyne, NE1 1LE
Telephone: +44 (0) 191 279 0900Fax: +44 (0) 191 221 2220Email: [email protected]
www.tbr.co.uk
LMS-BTL-70_ReportFINAL.pdf 2 25/09/2015 10:26
The Mathematical Sciences Pipeline | 55
LMS-BTL-70_ReportFINAL.pdf 63 25/09/2015 10:26
56 | The Mathematical Sciences Pipeline
UCAS Analysis of applicants to Mathematical Science courses, 2009–2013 [bespoke extract]
HESA Student Record 2009/10–2012/13 [bespoke extract]
HESA Matched Destinations of Leavers Survey and Student Record 2009/10–2012/13 [bespoke extract]
HESA Destinations of Leavers Longitudinal Survey 2004/05, 2006/07, 2008/09 [bespoke extract]
Office for National Statistics. Social Survey Division, Annual Population Survey, October 2010 - September 2011: Special Licence Access [computer file]. 2nd Edition. Colchester, Essex: UK Data Archive [distributor], December 2012. SN: 7004 , http://dx.doi.org/10.5255/UKDA-SN-7004-2
Office for National Statistics. Social Survey Division, Annual Population Survey, October 2011 - September 2012: Special Licence Access [computer file]. Colchester, Essex: UK Data Archive [distributor], November 2013. SN: 7413 , http://dx.doi.org/10.5255/UKDA-SN-7413-1
Office for National Statistics. Social Survey Division, Annual Population Survey, October 2012 - September 2013: Special Licence Access [computer file]. Colchester, Essex: UK Data Archive [distributor], January 2014. SN: 7444 , http://dx.doi.org/10.5255/UKDA-SN-7444-1
This report contains public sector information licensed under the Open Government Licence v2.0
TBR and the Council for the Mathematical Sciences are grateful to UCAS, HESA, the Office for National Statistics and the UK Data Service for making these data available. Neither UCAS, HESA, the Office for National Statistics nor the UK Data Service bear any responsibility for the analysis or interpretation of the data.
10. Appendix 1: Data sources
LMS-BTL-70_ReportFINAL.pdf 60 25/09/2015 10:26
58 | The Mathematical Sciences Pipeline
Natural and social scientists
IT managers, analysts, architects and systems designers
Programmers and software developers
Research and development managers
Education and teaching professionals in higher, further and secondary education
Chartered and certified accountants
Management consultants and business analysts
Actuaries, economists and statisticians
Taxation experts
11. Appendix 2: Occupations in the Tier 1 Mathematical Sciences workforce
LMS-BTL-70_ReportFINAL.pdf 62 25/09/2015 10:26
The Mathematical Sciences Pipeline
1. Foreword 1
2. Glossary of key terms 22.1 Acronyms 4
3. Executive summary 63.1 The Application Phase 63.2 The Learning Phase 63.3 The Graduate Phase 6
4. Introduction 84.1 Methodology 8
5. The Mathematical Sciences People Pipeline 11
6. The Application Phase: Demand for Mathematical Sciences Higher Education 136.1 Trends in Demand 136.2 Entry Requirements 146.3 Acceptance Routes 166.4 Educational Background 176.5 Gender 17
7. The Learning Phase: Student Profile 187.1 Student Numbers 187.2 Subjects Studied 207.3 Prior Attainment 217.4 Geography 217.5 Region of Institution 247.6 Mode of Study 257.7 Demographics 277.8 Non-Continuation Rates 31
8. The Graduate Phase: Destinations 328.1 Graduate Numbers 328.2 Economic Activity 338.3 Graduate Employment 368.4 Graduate Earnings 398.5 Importance of Qualifications 40
9. The Importance of Mathematical Sciences to the Economy: the Mathematical Sciences Workforce 439.1 Categorising the Mathematical Sciences Workforce 439.2 Trends in the Mathematical Sciences Workforce 439.3 Employment by Sector 449.4 Geography 469.5 Demographics 479.6 Qualifications 509.7 Employment Status 529.8 Salary 539.9 Public/Private Nature of Organisation 54
10. Appendix 1: Data Sources 55
11. Appendix 2: Occupations in the Tier 1 Mathematical Sciences Workforce 55
Contents
LMS-BTL-70_ReportFINAL.pdf 3 25/09/2015 10:26
The Mathematical Sciences Pipeline
CMS Member organisations:Professor Sir Adrian Smith, FRS became Chair of the Council for the Mathematical Sciences in September 2013.
The Institute of Mathematics and its Applications (IMA) is the UK’s learned and professional society for mathematics and its applications. The IMA exists to support the advancement of mathematical knowledge and its applications and to promote and enhance mathematical culture in the United Kingdom and elsewhere, for the public good. Further information can be found at www.ima.org.uk
The London Mathematical Society (LMS), established in 1865, is the UK’s learned society for mathematics. Its purpose is the academic and public advancement, dissemination and promotion of mathematical knowledge and its wide-reaching benefits to society, representing mathematics both nationally and internationally. Further information can be found at www.lms.ac.uk
The Royal Statistical Society (RSS) is one of the world’s leading organisations to promote the importance of statistics and data, and has done so since it was founded in 1834. It is a professional body for all statisticians and data analysts, wherever they may live and has more than 6,000 members in the UK and across the world. As a charity, the RSS advocates the key role of statistics and data in society, and works to ensure that policy formulation and decision making are informed by evidence, for the public good. Further information can be found at www.rss.org.uk
The Edinburgh Mathematical Society (EMS) was founded in 1883 and has since become firmly established as the principal mathematical society for the university community in Scotland. Its aims are the promotion and extension of the Mathematical Sciences, pure and applied, particularly in Scotland, and it draws its membership from all the Scottish universities and other educational institutions as well as from mathematicians in industry and commerce both at home and overseas. Further information can be found at www.ems.ac.uk
The Operational Research Society (ORS) was founded over 50 years ago in succession to the Operational Research Club which was set up in 1948. It is the world’s oldest-established learned society catering to the Operational Research (O.R.) profession, and one of the largest in the world, with 2500 members in 53 countries. The ORS provides training, conferences, publications, and information to those working in Operational Research and also provides information about Operational Research to interested members of the general public. Further information can be found at www.theorsociety.com
About the Council for the Mathematical Sciences (CMS)
Prof Sir Adrian Smith (Chair, CMS)
Prof Peter Diggle (President, RSS)
Prof Dame Celia Hoyles (President, IMA)
Prof Tony Carbery (President, EMS)
Prof Terry Lyons (President, LMS)
Prof Stewart Robinson (President, ORS)
The Council for the Mathematical Sciences (CMS) was established in 2001 by the Institute of Mathematics and its Applications (IMA), the London Mathematical Society (LMS) and the Royal Statistical Society (RSS). In 2008 the Edinburgh Mathematical Society (EMS) and the Operational Research Society (ORS) also became members of the CMS. The CMS comprises representatives and observers from the Mathematical Sciences community, including the Presidents and Chief Executives of these societies.
The CMS provides an authoritative and objective body that exists to develop, influence and respond to UK policy issues that affect the Mathematical Sciences in higher education and research, and therefore the UK economy and society in general. The objectives of the Council for the Mathematical Sciences are:
to provide an expert advisory group on matters affecting the Mathematical Sciences in higher education and research in the UK.
to engage (proactively and responsively) with government and other decision-makers and to respond coherently and effectively to proposals in which the Mathematical Sciences in higher education and research in the UK have a role, or may be affected.
to engage with funding agencies for higher education and research on maintaining and improving a strong mathematics base in the UK.
to bring together the Mathematical Sciences community and facilitate communication between the community and other stakeholders to explore common issues and potential solutions.
LMS-BTL-70_ReportFINAL.pdf 4 25/09/2015 10:26
The Mathematical Sciences Pipeline | 01
The Mathematical Sciences pervade our lives, and the complexities of the changing world could not be managed without them. In the Mathematical Sciences more than anywhere, and at all levels, the strength of the infrastructure is embodied in people.
The importance to the UK of having a good supply of well qualified people cannot be overstated, but reliable quantitative information has been hard to find. Accordingly, the Council for the Mathematical Sciences (CMS) commissioned TBR to examine the higher education and career routes of students taking Mathematical Sciences courses to provide an understanding of the critical processes of the Mathematical Sciences career pipeline.
The present report paints a quantitative picture of the flow of people through higher education and into the workforce. It gives not only the size of the pyramid, but also its slope; not only the gender imbalance, but also how it develops. And we have a quantitative picture of which occupations Mathematical Sciences graduates enter and how important the qualification is to their careers.
This information adds to a sequence of reports over the last few years supplying evidence about the value and requirements of mathematical training.
The starting point was to gather evidence which demonstrates the importance of Mathematical Sciences across the economy. The 2012 Deloitte
Report, Measuring the Economic Benefits of Mathematical Science Research in the UK, commissioned by the EPSRC and the CMS decisively established this importance: “The Mathematical Sciences play a vital part in all aspects of modern society. Without research and training in mathematics, there would be no engineering, economics or computer science; no smart phones, MRI scanners, bank accounts or PIN numbers”. The report estimates the contribution of the Mathematical Sciences to the UK economy to be 2.8 million in employment terms (around 10 per cent of all jobs in the UK) and £208 billion in terms of Gross Value Added (around 16 per cent of total UK GVA).
The 2011 Mathematical Needs report from ACME informed education policy by identifying what is needed from schools: “The Mathematical Needs report is about the mathematics that we need, as a nation, in order to ensure that we are able to fulfil the demands that we face, whether they be economic, intellectual or societal”.
Together, these reports begin to tell us where we are, and equip us to think about a future in which the Mathematical Sciences will only become more important. It is hard to imagine making decisions about national strategy without understanding this landscape. We believe this new report will play an important part in ensuring a healthy, appropriate and flexible people pipeline to supply a flourishing future.
1. Foreword
Professor Sir Adrian Smith CMS Chair
LMS-BTL-70_ReportFINAL.pdf 5 25/09/2015 10:26
02 | The Mathematical Sciences Pipeline
2. Glossary of key terms
Acceptances The number of firm acceptances by an applicant in response to a higher education institution’s offer of a place on a course. There can only be one acceptance per successful applicant.
Age Student age refers to age as at 31 August, i.e. the start of academic year. Graduate age refers to age as at 31 July, i.e. the end of the academic year.
Applications The number of individual applications made through UCAS. Each applicant can make up to five applications, and can apply to more than one institution, and/or make several applications for different courses at the same institution. The number of applications is therefore likely to exceed the number of applicants (on average, each applicant made four applications in 2013). Note that most applications to postgraduate courses, and many applications to part-time undergraduate courses, are made directly to higher education institutions and not through UCAS.
Continuation status The continuation or change in status of full-time students from Year 1 to Year 2, and of part-time students from Year 2 to Year 3.
Destination of Leavers from Higher Education (DLHE)
A survey of students obtaining a higher education qualification, examining their activities 6 months after the end of their course. A follow-up survey examines activities 3.5 years following graduation. The survey excludes those leaving with further education qualifications, those who studied overseas and incoming exchange students.
Doctorate Includes doctoral degrees obtained (or not obtained) primarily through research and New Route PhD (an integrated programme of research and structured training).
Domicile The UK region or country in which the individual resides on application, or at the commencement of their course. For students from outside the UK, domicile is recorded as EU or non-EU.
First Degree Otherwise known as undergraduate degrees or bachelors’ degrees including those studying for postgraduate bachelors’ degrees. Common first degrees in the Mathematical Sciences include three-year Bachelor of Science (BSc) and Bachelor of Arts (BA) degrees, as well as four-year Integrated Masters (MMath) degrees.
Graduates The number of students gaining a higher education qualification during the relevant academic year.
Level Refers to the level of a qualification, i.e. first degree, Masters or PhD.
Masters Includes taught and research Masters’ degrees, usually undertaken as a free-standing qualification after completion of a first degree. Integrated Masters qualifications, which usually combine three years’ of undergraduate level study with an additional year at postgraduate level, are counted as first degrees.
LMS-BTL-70_ReportFINAL.pdf 6 25/09/2015 10:26
The Mathematical Sciences Pipeline | 03
Mathematical Sciences Higher education courses are categorised by up to three subjects, using the Joint Academic Coding System (JACS). Where a subject accounts for more than 50% of the teaching time in a course, it is categorised as the main subject. Where teaching time is split evenly between subjects, the course is categorised as a combination of subjects. Mathematical Sciences courses include all courses where one of the three subject classifications is in the following JACS codes:
JACS 2.0
G01: Broadly based programmes within Mathematical Sciences
G1: Mathematics
G2: Operational research
G3: Statistics
G91: Others in Mathematical Sciences
JACS 3.0
G1: Mathematics
G2: Operational research
G3: Statistics
G9: Others in Mathematical Sciences
Other Postgraduate courses Including (but not limited to) postgraduate diplomas, certificates and professional qualifications and Postgraduate Certificate in Education (PGCE level M).
Other Undergraduate courses
Qualifications at or below first degree level, including (but not limited to) foundation degrees, Diplomas of Higher Education, including Higher National Diplomas (HNDs) and Higher National Certificates (HNCs), and National Vocational Qualifications (NVQs) at Level 4 or above.
Postgraduate courses Postgraduate courses include Masters degrees, Doctorates and a range of other qualifications which generally have an undergraduate qualification (or equivalent experience) as an entry requirement.
Professional occupations Defined in the Standard Occupational Classification (SOC) as occupations whose main tasks require a high level of knowledge and experience in the natural sciences, engineering, life sciences, social sciences, humanities and related fields. The main tasks in these occupations consist of the practical application of an extensive body of theoretical knowledge, increasing the stock of knowledge by means of research and communicating such knowledge by teaching methods and other means. Most Professional occupations require a degree or equivalent qualification, with some occupations requiring postgraduate qualifications and/or a formal period of experience-related training.
Students Students are counted if they are included in the HESA standard registration population. This is defined as the number of students active at a registered higher education institution (or on a registered higher education course delivered by a further education institution) during the relevant academic year. To be counted, students must be studying a course above Level 3 of the Qualifications and Credit Framework (QCF), i.e. a Certificate of Higher Education or higher qualification. Students are excluded if they are “dormant” (i.e. have ceased studying but have not formally de-registered), on sabbatical, a visiting exchange student, or primarily studying overseas.
LMS-BTL-70_ReportFINAL.pdf 7 25/09/2015 10:26
04 | The Mathematical Sciences Pipeline
Tariff Bands Tariff points are used to quantify the level of qualification of the student. Points are awarded for each qualification, based on the level of study. Tariff points are generally only counted for the highest level of achievement in a subject – for example, an AS-level is not normally included if the student also has an A-level in the same subject. Full details of the tariff points associated with different qualifications are available at: www.ucas.com/how-it-all-works/explore-your-options/entry-requirements/tariff-tables
Tariff points may refer to the points associated with a firm offer from an institution (i.e. the points an individual is expected to achieve in order to take up a place) or to the actual points achieved.
Undergraduate courses Undergraduate courses include first degrees and a range of other undergraduate courses at or below degree level.
APS Annual Population Survey – A survey of households in Great Britain conducted by the Office for National Statistics, published quarterly but with results covering a full 12 months. The sample size for each dataset is approximately 170,000 households and 360,000 individuals. The survey covers a range of topics including economic activity and employment, health and education.
FPE Full Person Equivalent – A standardised measure relating to the amount of time in which an individual is engaged in a particular activity. An FPE of 1.0 describes an individual whose time is spent on a single activity.
FTE Full Time Equivalent – A standardised measure relating to the workload of an individual, used to compare workloads. An FTE of 1.0 is equivalent to a full-time student or employee.
HESA Higher Education Statistics Agency – The official source of data on higher education institutions in the UK.
SIC Standard Industrial Classification – A taxonomy which classifies organisations according to the type of economic activity in which they engage. The classification provides a common framework for the collection, analysis and presentation of data describing what organisations do.
SOC Standard Occupational Classification – A taxonomy which classifies people’s jobs according to their skill level and skill content. The classification provides a common framework for the collection, analysis and presentation of data describing what work people do.
DLHE Destination of Leavers from Higher Education – A survey of students obtaining a higher education qualification, examining their activities 6 months after the end of their course. A follow-up survey examines activities 3.5 years following graduation.
JACS Joint Academic Coding System – A classification system used by HESA and the Universities and Colleges Admissions Service (UCAS) to classify academic subjects. JACS codes which relate to Mathematical Sciences subjects are described in the Methodology (section 4.1, page 8).
2.1 Acronyms
A number of acronyms are used throughout this report, and are defined below:
LMS-BTL-70_ReportFINAL.pdf 8 25/09/2015 10:26
The Mathematical Sciences Pipeline | 05
1 The Quality Assurance Agency’s qualifications frameworks cover higher education qualifications across all four national administrations in the UK. More information is available at: www.qaa.ac.uk/en/Publications/Documents/qualifications-frameworks.pdf
NQF National Qualifications Framework – A credit transfer system for qualifications in England, Wales and Northern Ireland, replaced in 2010 by the Qualifications and Credit Framework (QCF)1. The NQF covered all levels of learning in secondary education, further education, vocational, and higher education. Academic higher education qualifications (such as academic degrees) were not covered, but the NQF was broadly aligned with the Framework for Higher Education Qualifications (FHEQ), allowing levels of achievement to be compared. The NQF is still used to describe qualification levels in the Annual Population Survey:
NQF Level 4 and above includes higher education qualifications.
NQF Level 3 is equivalent to A-level qualifications.
NQF Level 2 is equivalent to GCSE qualifications at grades A*–C.
NQF Level 1 is equivalent to GCSE qualifications at grades D–G.
More information on the NQF is available at: www.gov.uk/what-different-qualification-levels-mean/compare-different-qualification-levels
UCAS Universities and Colleges Admissions Service – A charity which provides the undergraduate application process for most British universities. While the main UCAS scheme is its undergraduate application service, it also provides application services for performing arts at UK conservatoires, for postgraduate teacher training schemes, for some postgraduate courses and some post-16 education and training.
LMS-BTL-70_ReportFINAL.pdf 9 25/09/2015 10:26
06 | The Mathematical Sciences Pipeline
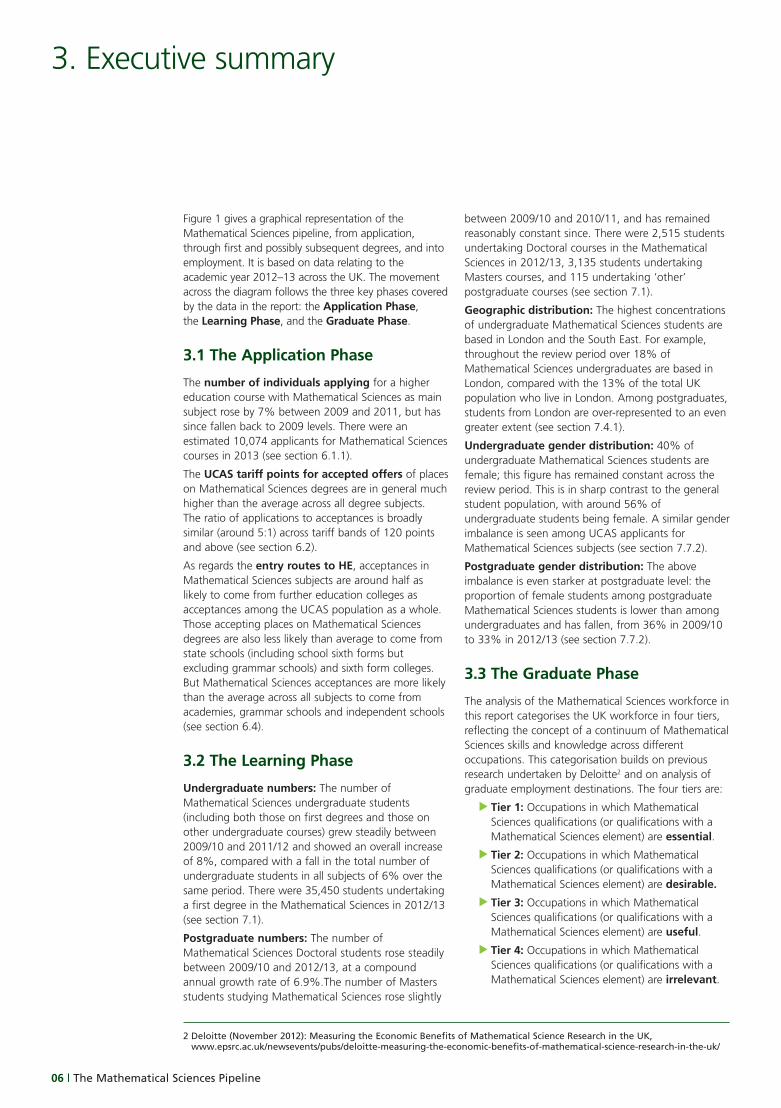
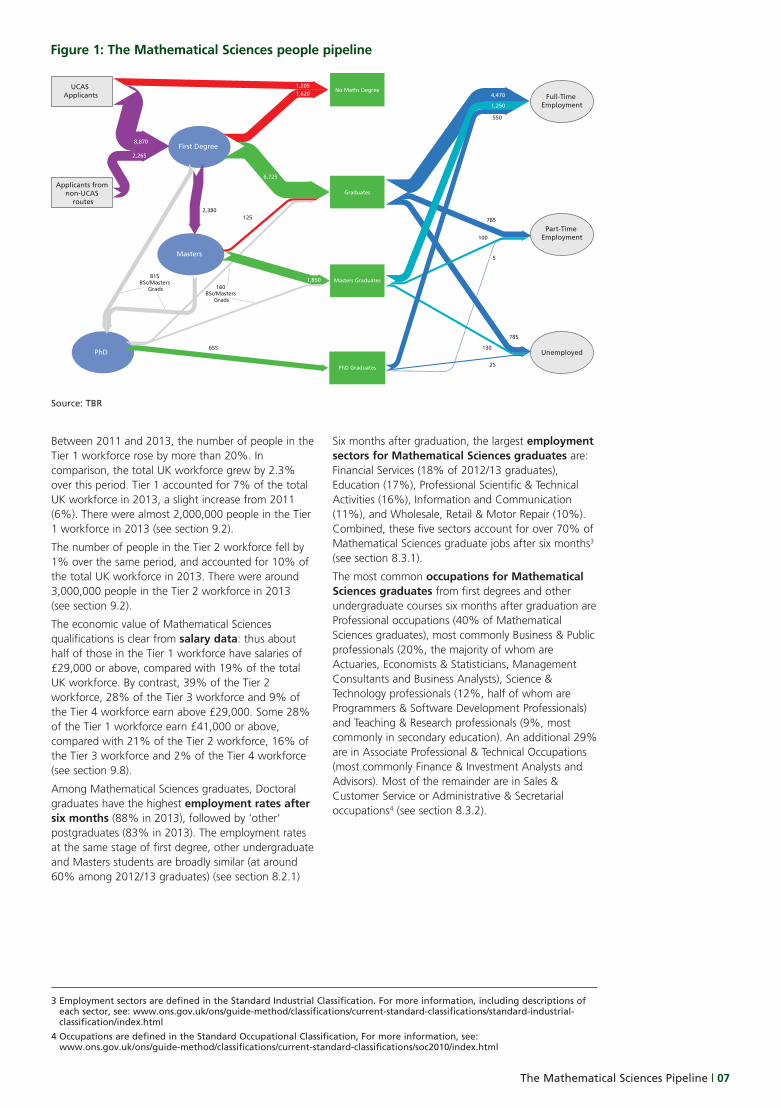
Figure 1 gives a graphical representation of the Mathematical Sciences pipeline, from application, through first and possibly subsequent degrees, and into employment. It is based on data relating to the academic year 2012–13 across the UK. The movement across the diagram follows the three key phases covered by the data in the report: the Application Phase, the Learning Phase, and the Graduate Phase.
3.1 The Application Phase
The number of individuals applying for a higher education course with Mathematical Sciences as main subject rose by 7% between 2009 and 2011, but has since fallen back to 2009 levels. There were an estimated 10,074 applicants for Mathematical Sciences courses in 2013 (see section 6.1.1).
The UCAS tariff points for accepted offers of places on Mathematical Sciences degrees are in general much higher than the average across all degree subjects. The ratio of applications to acceptances is broadly similar (around 5:1) across tariff bands of 120 points and above (see section 6.2).
As regards the entry routes to HE, acceptances in Mathematical Sciences subjects are around half as likely to come from further education colleges as acceptances among the UCAS population as a whole. Those accepting places on Mathematical Sciences degrees are also less likely than average to come from state schools (including school sixth forms but excluding grammar schools) and sixth form colleges. But Mathematical Sciences acceptances are more likely than the average across all subjects to come from academies, grammar schools and independent schools (see section 6.4).
3.2 The Learning Phase
Undergraduate numbers: The number of Mathematical Sciences undergraduate students (including both those on first degrees and those on other undergraduate courses) grew steadily between 2009/10 and 2011/12 and showed an overall increase of 8%, compared with a fall in the total number of undergraduate students in all subjects of 6% over the same period. There were 35,450 students undertaking a first degree in the Mathematical Sciences in 2012/13 (see section 7.1).
Postgraduate numbers: The number of Mathematical Sciences Doctoral students rose steadily between 2009/10 and 2012/13, at a compound annual growth rate of 6.9%.The number of Masters students studying Mathematical Sciences rose slightly
between 2009/10 and 2010/11, and has remained reasonably constant since. There were 2,515 students undertaking Doctoral courses in the Mathematical Sciences in 2012/13, 3,135 students undertaking Masters courses, and 115 undertaking ‘other’ postgraduate courses (see section 7.1).
Geographic distribution: The highest concentrations of undergraduate Mathematical Sciences students are based in London and the South East. For example, throughout the review period over 18% of Mathematical Sciences undergraduates are based in London, compared with the 13% of the total UK population who live in London. Among postgraduates, students from London are over-represented to an even greater extent (see section 7.4.1).
Undergraduate gender distribution: 40% of undergraduate Mathematical Sciences students are female; this figure has remained constant across the review period. This is in sharp contrast to the general student population, with around 56% of undergraduate students being female. A similar gender imbalance is seen among UCAS applicants for Mathematical Sciences subjects (see section 7.7.2).
Postgraduate gender distribution: The above imbalance is even starker at postgraduate level: the proportion of female students among postgraduate Mathematical Sciences students is lower than among undergraduates and has fallen, from 36% in 2009/10 to 33% in 2012/13 (see section 7.7.2).
3.3 The Graduate Phase
The analysis of the Mathematical Sciences workforce in this report categorises the UK workforce in four tiers, reflecting the concept of a continuum of Mathematical Sciences skills and knowledge across different occupations. This categorisation builds on previous research undertaken by Deloitte2 and on analysis of graduate employment destinations. The four tiers are:
Tier 1: Occupations in which Mathematical Sciences qualifications (or qualifications with a Mathematical Sciences element) are essential.
Tier 2: Occupations in which Mathematical Sciences qualifications (or qualifications with a Mathematical Sciences element) are desirable.
Tier 3: Occupations in which Mathematical Sciences qualifications (or qualifications with a Mathematical Sciences element) are useful.
Tier 4: Occupations in which Mathematical Sciences qualifications (or qualifications with a Mathematical Sciences element) are irrelevant.
3. Executive summary
2 Deloitte (November 2012): Measuring the Economic Benefits of Mathematical Science Research in the UK, www.epsrc.ac.uk/newsevents/pubs/deloitte-measuring-the-economic-benefits-of-mathematical-science-research-in-the-uk/
LMS-BTL-70_ReportFINAL.pdf 10 25/09/2015 10:26
The Mathematical Sciences Pipeline | 07
Between 2011 and 2013, the number of people in the Tier 1 workforce rose by more than 20%. In comparison, the total UK workforce grew by 2.3% over this period. Tier 1 accounted for 7% of the total UK workforce in 2013, a slight increase from 2011 (6%). There were almost 2,000,000 people in the Tier 1 workforce in 2013 (see section 9.2).
The number of people in the Tier 2 workforce fell by 1% over the same period, and accounted for 10% of the total UK workforce in 2013. There were around 3,000,000 people in the Tier 2 workforce in 2013 (see section 9.2).
The economic value of Mathematical Sciences qualifications is clear from salary data: thus about half of those in the Tier 1 workforce have salaries of £29,000 or above, compared with 19% of the total UK workforce. By contrast, 39% of the Tier 2 workforce, 28% of the Tier 3 workforce and 9% of the Tier 4 workforce earn above £29,000. Some 28% of the Tier 1 workforce earn £41,000 or above, compared with 21% of the Tier 2 workforce, 16% of the Tier 3 workforce and 2% of the Tier 4 workforce (see section 9.8).
Among Mathematical Sciences graduates, Doctoral graduates have the highest employment rates after six months (88% in 2013), followed by ‘other’ postgraduates (83% in 2013). The employment rates at the same stage of first degree, other undergraduate and Masters students are broadly similar (at around 60% among 2012/13 graduates) (see section 8.2.1)
Six months after graduation, the largest employment sectors for Mathematical Sciences graduates are: Financial Services (18% of 2012/13 graduates), Education (17%), Professional Scientific & Technical Activities (16%), Information and Communication (11%), and Wholesale, Retail & Motor Repair (10%). Combined, these five sectors account for over 70% of Mathematical Sciences graduate jobs after six months3 (see section 8.3.1).
The most common occupations for Mathematical Sciences graduates from first degrees and other undergraduate courses six months after graduation are Professional occupations (40% of Mathematical Sciences graduates), most commonly Business & Public professionals (20%, the majority of whom are Actuaries, Economists & Statisticians, Management Consultants and Business Analysts), Science & Technology professionals (12%, half of whom are Programmers & Software Development Professionals) and Teaching & Research professionals (9%, most commonly in secondary education). An additional 29% are in Associate Professional & Technical Occupations (most commonly Finance & Investment Analysts and Advisors). Most of the remainder are in Sales & Customer Service or Administrative & Secretarial occupations4 (see section 8.3.2).
3 Employment sectors are defined in the Standard Industrial Classification. For more information, including descriptions of each sector, see: www.ons.gov.uk/ons/guide-method/classifications/current-standard-classifications/standard-industrial-classification/index.html
4 Occupations are defined in the Standard Occupational Classification, For more information, see: www.ons.gov.uk/ons/guide-method/classifications/current-standard-classifications/soc2010/index.html
First Degree
Masters
No Maths Degree
Graduates
Masters Graduates
125
PhD
PhD Graduates
Full-Time Employment
Part-Time Employment
Unemployed
1,620
6,725
655
2,380
4,470
785
785
1,250
100
130
550
5
25
UCAS Applicants
Applicants from non-UCAS
routes
2,265
1,205
8,870
1,850815
BSc/Masters Grads 160
BSc/Masters Grads
Source: TBR
Figure 1: The Mathematical Sciences people pipeline
LMS-BTL-70_ReportFINAL.pdf 11 25/09/2015 10:26
08 | The Mathematical Sciences Pipeline
Research undertaken by Deloitte has demonstrated the enormous economic impact of Mathematical Sciences research. The CMS is keen to develop a greater understanding of the Mathematical Sciences career pipeline, because of its importance. The CMS is also keen to gather evidence which demonstrates the importance of Mathematical Sciences across the economy. The CMS commissioned TBR to undertake secondary research examining the career routes of students participating in Mathematical Sciences courses in HE, and to provide insight into the role of Mathematical Sciences courses in providing the necessary skills to the UK workforce.
The Mathematical Sciences pipeline is captured in a range of detailed data sources, collected by different agencies which cannot be matched together to show a single, seamless timeline. It is not possible to track an individual from their application to HE, through to graduation and beyond (though data tracking the activities of graduates after the end of their courses are available). We have therefore examined the pipeline in three distinct phases: the application phase, the learning phase, and the graduate phase. We have drawn on additional data on the UK workforce to examine the importance of Mathematical Sciences to the economy. The research aims to provide robust, transparent evidence of:
1. The numbers and profile of students applying for and accepting places on Mathematical Sciences courses in HE.
2. The numbers and profile of students participating in Mathematical Sciences courses in HE.
3. The immediate and longer-term professional destinations of students leaving Mathematical Sciences courses in higher education.
4. The occupations and sectors which depend on Mathematical Sciences qualifications.
5. The characteristics of the Mathematical Sciences workforce.
4.1 Methodology
The research involved analysis of data collected by a number of different agencies, including both administrative and survey sources. Each of the datasets used relates to a different part of our analysis. Each is collected and coded in different ways, and each therefore requires different treatment from the next.
4.1.1 The application phaseUCAS is the central organisation through which applications for entry to higher education are processed, and provides data on the number and characteristics of applicants to higher education, the number of applications, and the number of places offered which are accepted. It should be noted that the data only include applicants making applications through UCAS. Direct applications to higher education institutions are not included. The data have good coverage of the undergraduate level, though institutions which are outside the UCAS system (including the Open University) are not included. The data have poor coverage of postgraduate levels, however, as most applications at this level are made directly to institutions.
UCAS counts reflect the categorisation of courses by up to three subjects. Courses are categorised by main subject group (subject one) wherever this accounts for more than 50% of teaching time. Our analysis includes courses in non-mathematics subject groups (classified by subject one), where these courses include a Mathematical Sciences element in subject two or subject three5. Courses that are evenly split between two or more subjects (and therefore cannot be categorised by main subject) are categorised as ‘combined subjects’.
Our analysis covers Mathematical Sciences courses, defined in version 3.0 of the Joint Academic Coding System (JACS 3.0) as subject groups G1: Mathematics, G2: Operational research, G3: Statistics, and G9: Others in Mathematical Sciences. JACS 3.0 was introduced in data relating to those entering higher education from 2012. Our analysis covers entries over the period 2009–2013. We have therefore adopted a broadly equivalent definition of Mathematical Sciences subjects using the earlier JACS 2.0, including subject groups G01: Broadly based programmes within Mathematical Sciences, G1: Mathematics, G2: Operational research, G3: Statistics, and G91: Others in Mathematical Sciences6. The key change between the two versions of the classification, in relation to our analysis, is the deprecation of JACS 2.0 subject group G01: Broadly based programmes within Mathematical Sciences7.
4. Introduction
5 The actual proportion of teaching time in each subject is not known.
6 Subjects prefixed G in JACS 2.0 included mathematical and computing sciences. JACS 3.0 places computing sciences subjects into their own group (prefixed I). Our definitions include only mathematical sciences subjects. Further information on the JACS coding system can be found at www.hesa.ac.uk/jacs3
7 It should be noted that subject coding depends on data supplied by higher education institutions to HESA, and that institutions are not always consistent with one another in the use of JACS codes. For example, some universities use the code G3 to describe students undertaking a statistics module within a mathematics degree, while others do not.
LMS-BTL-70_ReportFINAL.pdf 12 25/09/2015 10:26
The Mathematical Sciences Pipeline | 09
Data were supplied by UCAS at institution level. This means that counts of applicants in the source data are overstated, because each applicant is counted once at each institution to which they have applied8. Applicant figures in our analysis are therefore derived from aggregate data published by UCAS, which do not involve such double-counting9. Published data, however, assign applicants to a single subject group only if all their applications are to courses within that subject group. A large number of applicants are therefore counted in ‘no preferred subject’ groups. We have apportioned applicants in this group to estimate the number of individuals applying to one or more Mathematical Sciences course. It should be noted that the number of applicants is not directly comparable to the number of applications and acceptances, as it does not include applicants to courses in non-mathematics subject groups which have a Mathematical Sciences element. Our detailed analysis therefore focuses on data relating to applications, and acceptances.
To prevent disclosure of personal information, UCAS supplies data in which counts of 1 or 2 are suppressed. For the purposes of analysis, we have assumed a value of 1.5 wherever UCAS has applied this suppression.
4.1.2 The learning phaseThe Higher Education Statistics Authority (HESA) collects a range of data from higher education institutions across the UK, and provides data on the number and characteristics of students and graduates. The data have excellent coverage of both undergraduate and postgraduate levels, and include institutions which operate an applications system outside UCAS (such as the Open University).
HESA takes a similar approach to categorising courses by subject as UCAS, using up to three subject categories for each course. Unlike UCAS, however, these HESA data count Mathematical Sciences students and graduates (qualifiers) on a Full Person Equivalent (FPE) basis, reflecting the proportion of their courses’ teaching time which is in the Mathematical Sciences subject group. Based on the same JACS definition as our UCAS analysis, any student studying Mathematical Sciences as one of the three subject areas associated with their course is included in our analysis. Students studying only Mathematical Sciences subjects (i.e. those where 100% of teaching time is within Mathematical Sciences subjects) are counted as
1. Students studying combinations of mathematics with other subjects are assigned a FPE value based on the proportion of their degree that is made up of Mathematical Sciences subjects; minor (0.33); balanced with one other subject (0.5); balanced with two other subjects (0.33); major (0.67)10.
HESA data are supplied without suppression. To prevent disclosure of personal information, analytical outputs are rounded to the nearest multiple of five. This rounding strategy is also applied to total figures; as a result, the sum of numbers in each row or column of a table may not match the total shown.
4.1.3 The graduate phaseAs well as collecting administrative data on students (and other aspects of higher education) HESA conducts the Destinations of Leavers from Higher Education (DLHE) survey, which asks leavers from higher education what they are doing some time after graduation. The survey is conducted in two parts:
Each year, HESA conducts a census of all leavers around six months after graduation. This is known as the Early survey. Around three quarters of leavers complete the survey.
Every two years, a sample of leavers who completed the early DLHE survey are contacted again, 3.5 years after graduation. This is known as the Longitudinal survey. A smaller proportion of leavers respond to the Longitudinal survey, though response rates have increased in recent surveys to around 15% of leavers.
HESA links the data collected in the DLHE survey to its administrative data on students and graduates. The data therefore provide a rich source of evidence on the activities of graduates from Mathematical Sciences courses, based on the same subject definition and FPE apportioning described in the learning phase. The results of both the Early and Longitudinal surveys are weighted to reflect the graduate population as a whole. Results are also subject to rounding, as described in the learning phase.
8 Counts of applications and acceptances are not affected.
9 UCAS Annual Reference Tables: www.ucas.com/data-analysis/data-resources/data-tables
10 Because HESA record up to three subjects, these FPE proportions are the only ones possible.
LMS-BTL-70_ReportFINAL.pdf 13 25/09/2015 10:26
10 | The Mathematical Sciences Pipeline
4.1.4 The Mathematical Sciences workforceData relating to the Mathematical Sciences workforce are drawn from the Annual Population Survey (APS), an annualised dataset derived from the quarterly Labour Force Survey conducted by the Office for National Statistics. The survey is designed to provide reliable estimates for a range of indicators, including several relating to economic activity, at local authority level (it is the official source of unemployment estimates, for example). Its large sample size means that it is the most robust source available of data on individuals in the workforce, and their jobs.
The profile of the Mathematical Sciences workforce presented in this report, and in the accompanying data pack, uses a categorisation based on the Standard Occupational Classification 2010 (SOC 2010)11. Each occupation defined in SOC 2010 is categorised in one of four groups, which we describe as tiers, reflecting the importance of Mathematical Sciences qualifications (or qualifications with a Mathematical Sciences element) associated with that occupation. This categorisation was developed in conjunction with the CMS and is informed by both expert review and analysis of HESA’s DLHE data12 on the occupations in which Mathematical Sciences graduates are concentrated, and the importance of Mathematical Sciences qualifications in these occupations13:
Tier 1: Occupations in which Mathematical Sciences qualifications (or qualifications with a Mathematical Sciences element) are essential.
Tier 2: Occupations in which Mathematical Sciences qualifications (or qualifications with a Mathematical Sciences element) are desirable.
Tier 3: Occupations in which Mathematical Sciences qualifications (or qualifications with a Mathematical Sciences element) are useful.
Tier 4: Occupations in which Mathematical Sciences qualifications (or qualifications with a Mathematical Sciences element) are irrelevant.
Our analysis compares the characteristics of the workforce in each tier. Some aspects of our workforce analysis, it should be noted, take a different approach to that in analysis of UCAS and HESA data. Most significantly, the APS does not define the subjects of qualifications achieved by individuals among the workforce at the level of detail available in UCAS and HESA data. Analysis of the subject areas of qualifications among the workforce, based on APS data, therefore takes a broad approach to describing qualifications in Science, Technology, Engineering and Mathematics (STEM) subjects. Any degree or vocational qualification in a STEM subject is counted. When looking specifically at Mathematics qualifications, however, only those whose main subject is in the Mathematical Sciences are counted14.
APS data are weighted to reflect the workforce as a whole. To protect the confidentiality of respondents, estimates based on an unweighted count of 1–2 respondents are suppressed; where appropriate, further suppression is also applied to outputs to prevent disclosure by deduction. Weighted estimates are also rounded to the nearest 100. It should be noted that reflecting the survey-based nature of APS data, and the risk of sampling variability associated with any survey, weighted APS estimates lower than 1,000 are generally considered unreliable because they are based on a small unweighted number of respondents.
4.1.5 Coverage of data and analysisData from both UCAS and HESA cover higher education across the UK as a whole, and include applicants and students domiciled in the UK and overseas. Similarly, APS data cover the entire UK workforce. Analysis covers the entire population unless otherwise stated.
11 SOC 2010 is widely used as a means of categorising people’s jobs into similar occupations, based on the level of skill, knowledge and experience required for competence in the job as well as the specific tasks associated with the role. More information can be found at www.ons.gov.uk/ons/guide-method/classifications/current-standard-classifications/soc2010/index.html
12 Like the APS, HESA’s DLHE survey uses the SOC 2010 classification to define graduates’ occupations.
13 For the purposes of our categorisation, a qualification need not be a mathematical sciences qualification as described in the Gloassary. For example, it may be a degree in a Science, Technology, Engineering and Mathematics (STEM) subject with an A-level in a mathematical sciences subject.
14 Analysis of qualifications among the workforce is shown in data pack W4, tables S11 and S12.
LMS-BTL-70_ReportFINAL.pdf 14 25/09/2015 10:26
The Mathematical Sciences Pipeline | 11
15 For presentation purposes, each arrow is scaled based on the square root of the number of individuals it represents, because of large differences in numbers in each part of the pipeline. Boxes representing distinct stages and/or processes within the pipeline are not scaled.
16 It should also be noted that the number of individuals who start a first degree but are awarded another undergraduate qualification, and the number who start a Masters degree and are awarded another postgraduate qualification, are unknown.
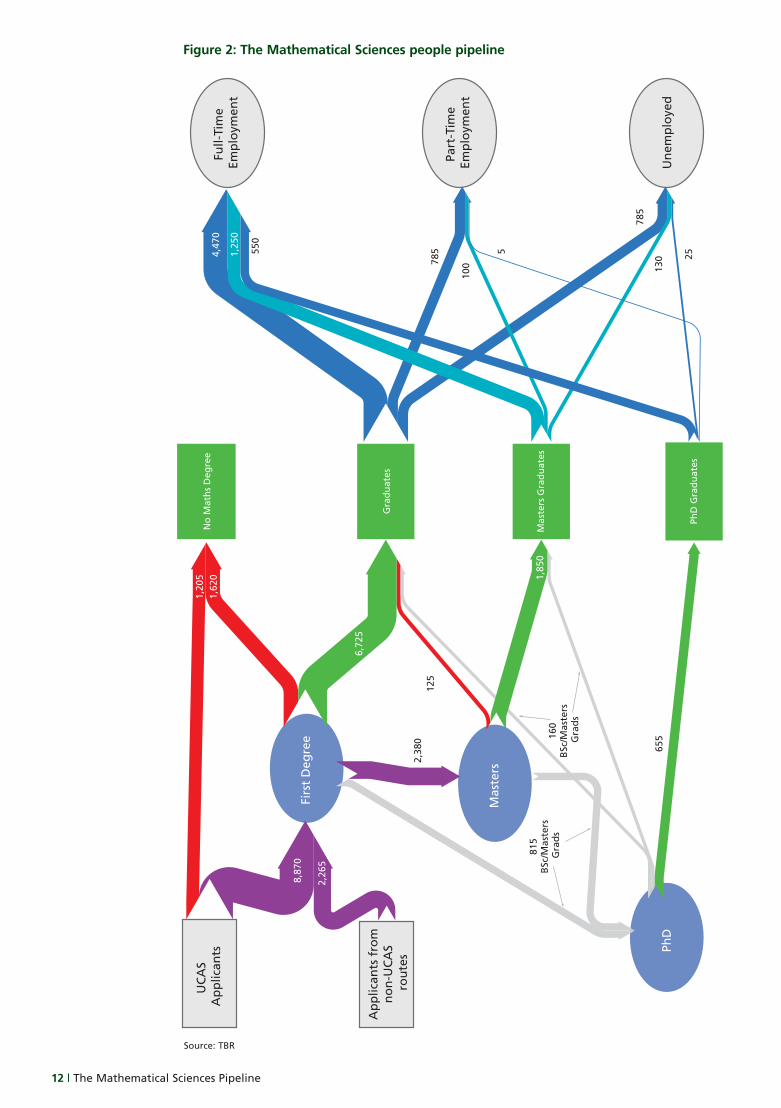
Figure 2 (overleaf) shows a graphical representation of the Mathematical Sciences pipeline, in the form of a Minard-Sankey diagram. The diagram shows the number of individuals flowing through different routes in the pipeline, from application to a first degree in Mathematical Sciences through to further study and/or to employment outcomes 6 months after graduation. Each arrow in the diagram is scaled to show the variation in the numbers of individuals in each part of the pipeline15.
There are a number of caveats associated with such a representation of the pipeline, of course. Firstly, it should be noted that as no single data source is available which tracks individuals from their application to higher education through to graduation and beyond, the diagram combines data from a number of different sources. It should also be noted that although it represents a flow of individuals from application to activity following graduation, the diagram is based on data relating to a single year (the 2012/13 academic year). This reflects the fact that it is impossible to standardise a timeframe for the various routes through the pipeline – an individual leaving a first degree and entering employment, for example, would be expected to do so in a shorter timeframe than an individual progressing from first degree, to Masters, to Doctorate and beyond. The figures on which the diagram is based, and with which the diagram is labelled, should therefore not be read as the actual number of individuals within the Mathematical Sciences pipeline at a given period in time, but should be taken as indicative of the number of people flowing through the pipeline, based on the latest available estimates:
The number of UCAS applicants is estimated, based on data published by UCAS as described in section 4.1.1, above.
The number of non-UCAS applicants is estimated by subtracting the number of UCAS acceptances from the number of first-year students, based on HESA data. It should be noted that consistency of subject categorisation between UCAS and HESA data cannot be guaranteed.
So as not to over-complicate the diagram, first degrees include other undergraduate courses as well as Integrated Masters courses. Similarly, Masters include other postgraduate courses. Compared with the number of individuals undertaking first degrees in Mathematical Sciences subjects, the number on other undergraduate courses is relatively small. Similarly, the number of individuals undertaking other postgraduate courses is small compared with the number on Masters courses16.
The number of individuals who enter a PhD from a first degree, and the number who enter with a Masters, are unavailable.
The number of graduates from first degrees (and other undergraduate qualifications) is calculated as the number of graduates less the number of first-year postgraduate students.
The numbers of individuals entering employment or unemployment are calculated by applying proportions from HESA’s DLHE survey to graduate numbers.
Colours in the diagram are coded to show different aspects of the pipeline:
Purple represents the number of individuals commencing further study (e.g. the number entering a first degree, and the flow from first degree to Masters).
Green represents the number of qualifying students.
Red represents the number of individuals unsuccessful in their application to higher education, or who do not successfully achieve their qualification.
Blue represents employment outcomes.
Grey represents unknown numbers (e.g. the prior qualifications of individuals entering PhDs).
Subsequent sections of this report describe each phase of the Mathematical Sciences pipeline in more detail.
5. The Mathematical Sciences people pipeline
LMS-BTL-70_ReportFINAL.pdf 15 25/09/2015 10:26
12 | The Mathematical Sciences Pipeline
Firs
t D
egre
e
Mas
ters
No
Mat
hs
Deg
ree
Gra
du
ates
Mas
ters
Gra
du
ates
125
PhD
PhD
Gra
du
ates
Full-
Tim
e Em
plo
ymen
t
Part
-Tim
e Em
plo
ymen
t
Un
emp
loye
d
1,62
0
6,72
5
655
2,38
0
4,47
0
785
785
1,25
0
100 13
0
550
5 25
UC
AS
Ap
plic
ants
Ap
plic
ants
fro
m
no
n-U
CA
S ro
ute
s
2,26
5
1,20
5
8,87
0
1,85
081
5 B
Sc/M
aste
rs
Gra
ds
160
BSc
/Mas
ters
G
rad
s
Source: TBR
Figure 2: The Mathematical Sciences people pipeline
LMS-BTL-70_ReportFINAL.pdf 16 25/09/2015 10:26
The Mathematical Sciences Pipeline | 13
6.1 Trends in demand
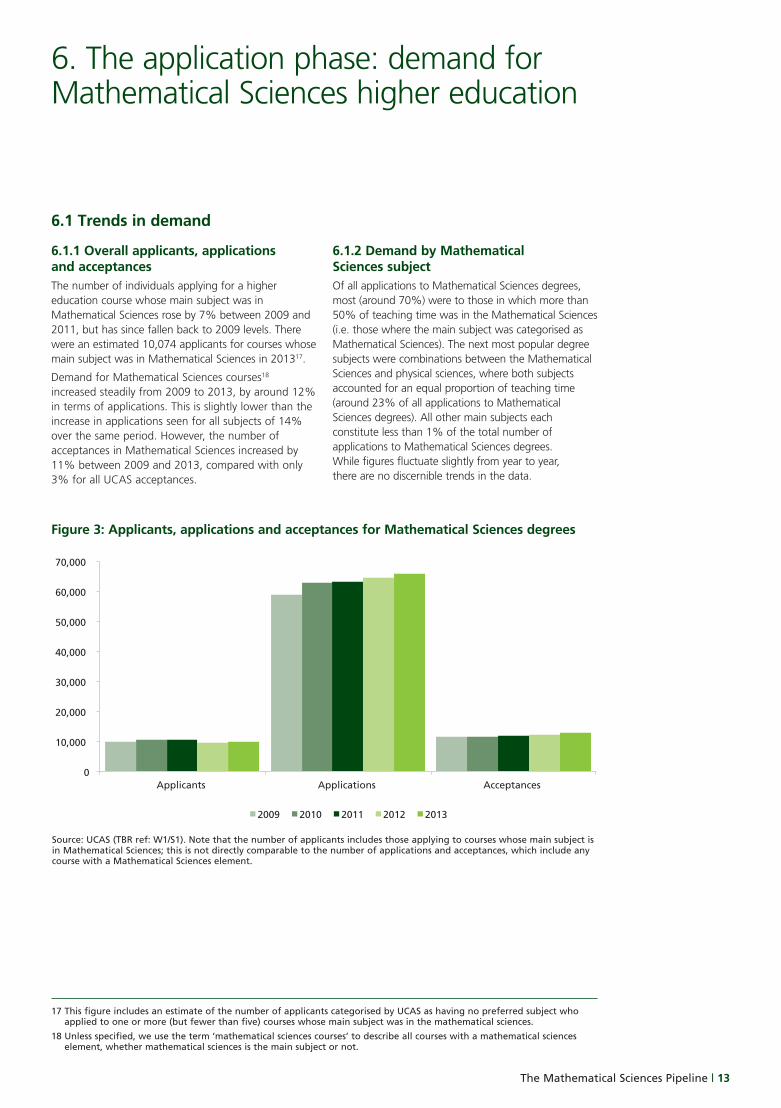
6.1.1 Overall applicants, applications and acceptances The number of individuals applying for a higher education course whose main subject was in Mathematical Sciences rose by 7% between 2009 and 2011, but has since fallen back to 2009 levels. There were an estimated 10,074 applicants for courses whose main subject was in Mathematical Sciences in 201317.
Demand for Mathematical Sciences courses18 increased steadily from 2009 to 2013, by around 12% in terms of applications. This is slightly lower than the increase in applications seen for all subjects of 14% over the same period. However, the number of acceptances in Mathematical Sciences increased by 11% between 2009 and 2013, compared with only 3% for all UCAS acceptances.
6.1.2 Demand by Mathematical Sciences subjectOf all applications to Mathematical Sciences degrees, most (around 70%) were to those in which more than 50% of teaching time was in the Mathematical Sciences (i.e. those where the main subject was categorised as Mathematical Sciences). The next most popular degree subjects were combinations between the Mathematical Sciences and physical sciences, where both subjects accounted for an equal proportion of teaching time (around 23% of all applications to Mathematical Sciences degrees). All other main subjects each constitute less than 1% of the total number of applications to Mathematical Sciences degrees. While figures fluctuate slightly from year to year, there are no discernible trends in the data.
6. The application phase: demand for Mathematical Sciences higher education
0
10,000
20,000
30,000
40,000
50,000
60,000
70,000
Applicants Applications Acceptances
2009 2010 2011 2012 2013
Source: UCAS (TBR ref: W1/S1). Note that the number of applicants includes those applying to courses whose main subject is in Mathematical Sciences; this is not directly comparable to the number of applications and acceptances, which include any course with a Mathematical Sciences element.
Figure 3: Applicants, applications and acceptances for Mathematical Sciences degrees
17 This figure includes an estimate of the number of applicants categorised by UCAS as having no preferred subject who applied to one or more (but fewer than five) courses whose main subject was in the mathematical sciences.
18 Unless specified, we use the term ‘mathematical sciences courses’ to describe all courses with a mathematical sciences element, whether mathematical sciences is the main subject or not.
LMS-BTL-70_ReportFINAL.pdf 17 25/09/2015 10:26
14 | The Mathematical Sciences Pipeline
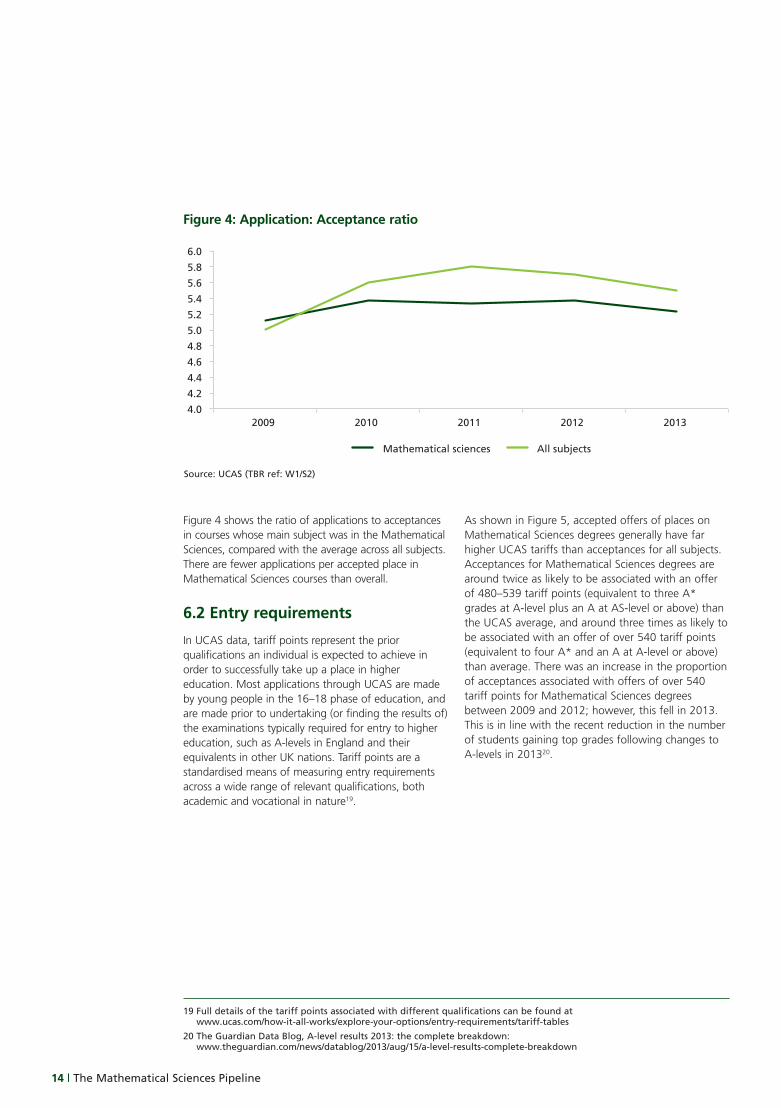
Figure 4 shows the ratio of applications to acceptances in courses whose main subject was in the Mathematical Sciences, compared with the average across all subjects. There are fewer applications per accepted place in Mathematical Sciences courses than overall.
6.2 Entry requirements
In UCAS data, tariff points represent the prior qualifications an individual is expected to achieve in order to successfully take up a place in higher education. Most applications through UCAS are made by young people in the 16–18 phase of education, and are made prior to undertaking (or finding the results of) the examinations typically required for entry to higher education, such as A-levels in England and their equivalents in other UK nations. Tariff points are a standardised means of measuring entry requirements across a wide range of relevant qualifications, both academic and vocational in nature19.
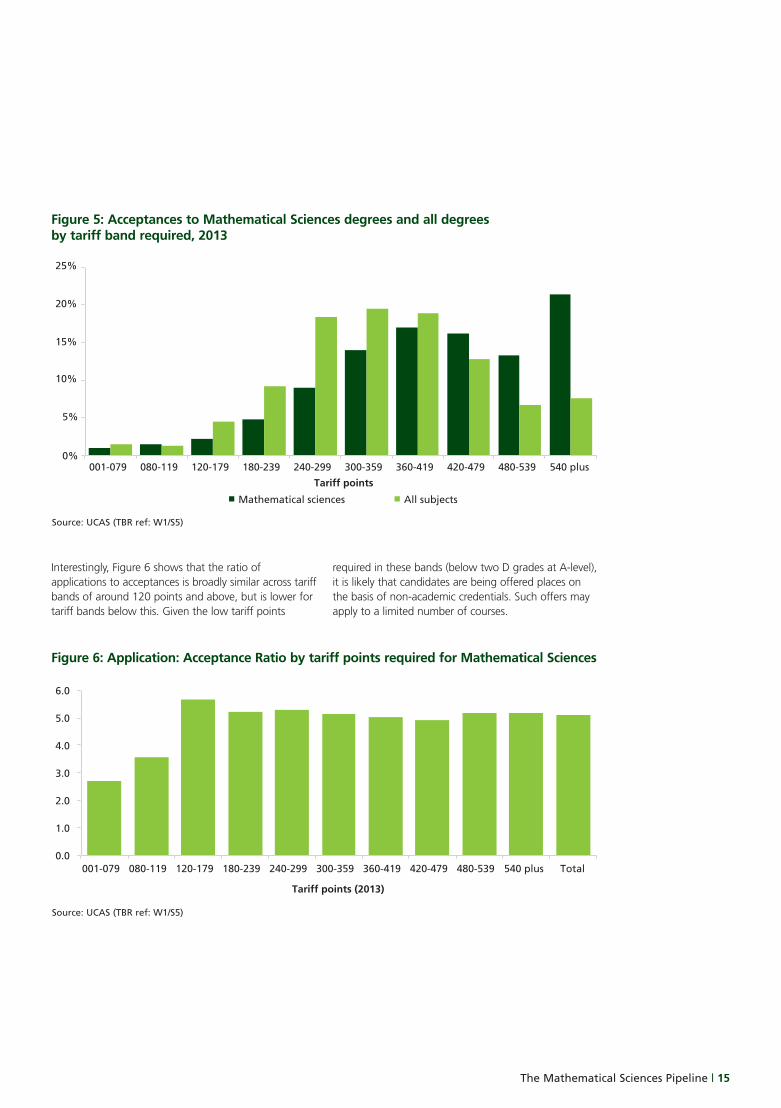
As shown in Figure 5, accepted offers of places on Mathematical Sciences degrees generally have far higher UCAS tariffs than acceptances for all subjects. Acceptances for Mathematical Sciences degrees are around twice as likely to be associated with an offer of 480–539 tariff points (equivalent to three A* grades at A-level plus an A at AS-level or above) than the UCAS average, and around three times as likely to be associated with an offer of over 540 tariff points (equivalent to four A* and an A at A-level or above) than average. There was an increase in the proportion of acceptances associated with offers of over 540 tariff points for Mathematical Sciences degrees between 2009 and 2012; however, this fell in 2013. This is in line with the recent reduction in the number of students gaining top grades following changes to A-levels in 201320.
4.04.24.44.64.85.05.25.45.65.86.0
2009 2010 2011 2012 2013
Mathematical sciences All subjects
Source: UCAS (TBR ref: W1/S2)
Figure 4: Application: Acceptance ratio
19 Full details of the tariff points associated with different qualifications can be found at www.ucas.com/how-it-all-works/explore-your-options/entry-requirements/tariff-tables
20 The Guardian Data Blog, A-level results 2013: the complete breakdown: www.theguardian.com/news/datablog/2013/aug/15/a-level-results-complete-breakdown
LMS-BTL-70_ReportFINAL.pdf 18 25/09/2015 10:26
The Mathematical Sciences Pipeline | 15
Interestingly, Figure 6 shows that the ratio of applications to acceptances is broadly similar across tariff bands of around 120 points and above, but is lower for tariff bands below this. Given the low tariff points
required in these bands (below two D grades at A-level), it is likely that candidates are being offered places on the basis of non-academic credentials. Such offers may apply to a limited number of courses.
Tariff points (2013)
0.0
1.0
2.0
3.0
4.0
5.0
6.0
001-079 080-119 120-179 180-239 240-299 300-359 360-419 420-479 480-539 540 plus Total
Source: UCAS (TBR ref: W1/S5)
Figure 6: Application: Acceptance Ratio by tariff points required for Mathematical Sciences
0%
5%
10%
15%
20%
25%
001-079 080-119 120-179 180-239 240-299 300-359 360-419 420-479 480-539 540 plus
Tariff points
Mathematical sciences All subjects
Source: UCAS (TBR ref: W1/S5)
Figure 5: Acceptances to Mathematical Sciences degrees and all degrees by tariff band required, 2013
LMS-BTL-70_ReportFINAL.pdf 19 25/09/2015 10:26
16 | The Mathematical Sciences Pipeline
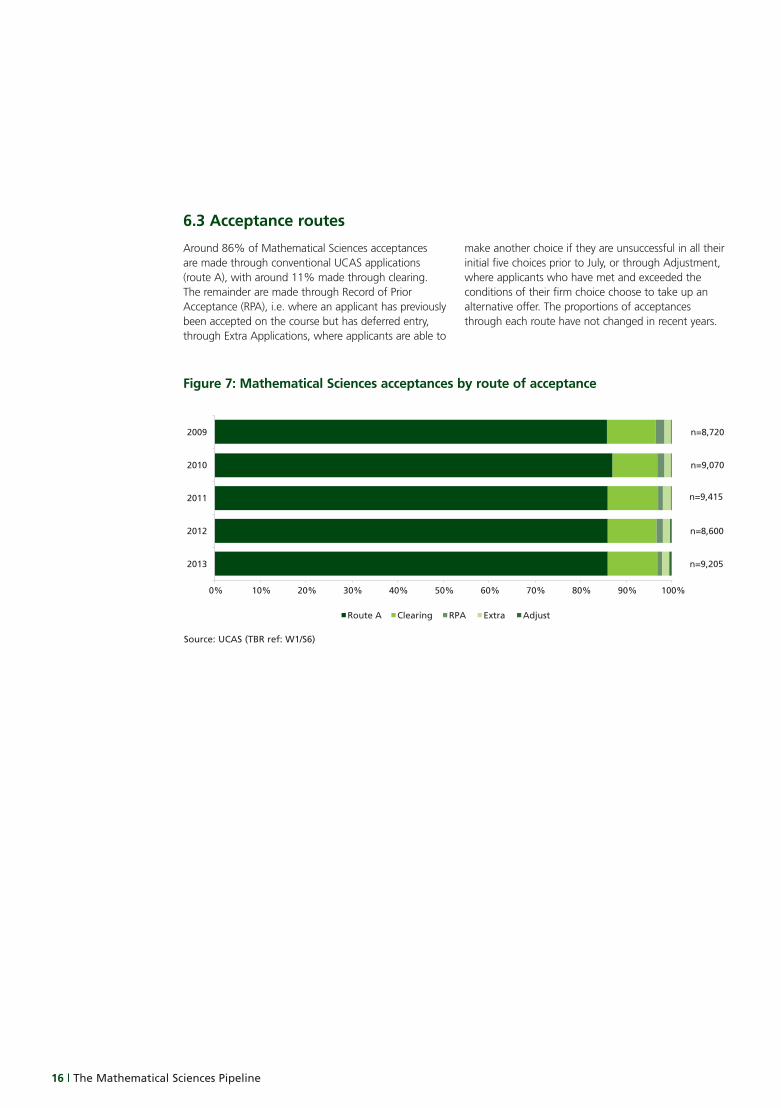
6.3 Acceptance routes
Around 86% of Mathematical Sciences acceptances are made through conventional UCAS applications (route A), with around 11% made through clearing. The remainder are made through Record of Prior Acceptance (RPA), i.e. where an applicant has previously been accepted on the course but has deferred entry, through Extra Applications, where applicants are able to
make another choice if they are unsuccessful in all their initial five choices prior to July, or through Adjustment, where applicants who have met and exceeded the conditions of their firm choice choose to take up an alternative offer. The proportions of acceptances through each route have not changed in recent years.
n=8,720
n=9,070
n=9,415
n=8,600
n=9,205
0% 10% 20% 30% 40% 50% 60% 70% 80% 90% 100%
2009
2010
2011
2012
2013
Route A Clearing RPA Extra Adjust
Source: UCAS (TBR ref: W1/S6)
Figure 7: Mathematical Sciences acceptances by route of acceptance
LMS-BTL-70_ReportFINAL.pdf 20 25/09/2015 10:26
The Mathematical Sciences Pipeline | 17
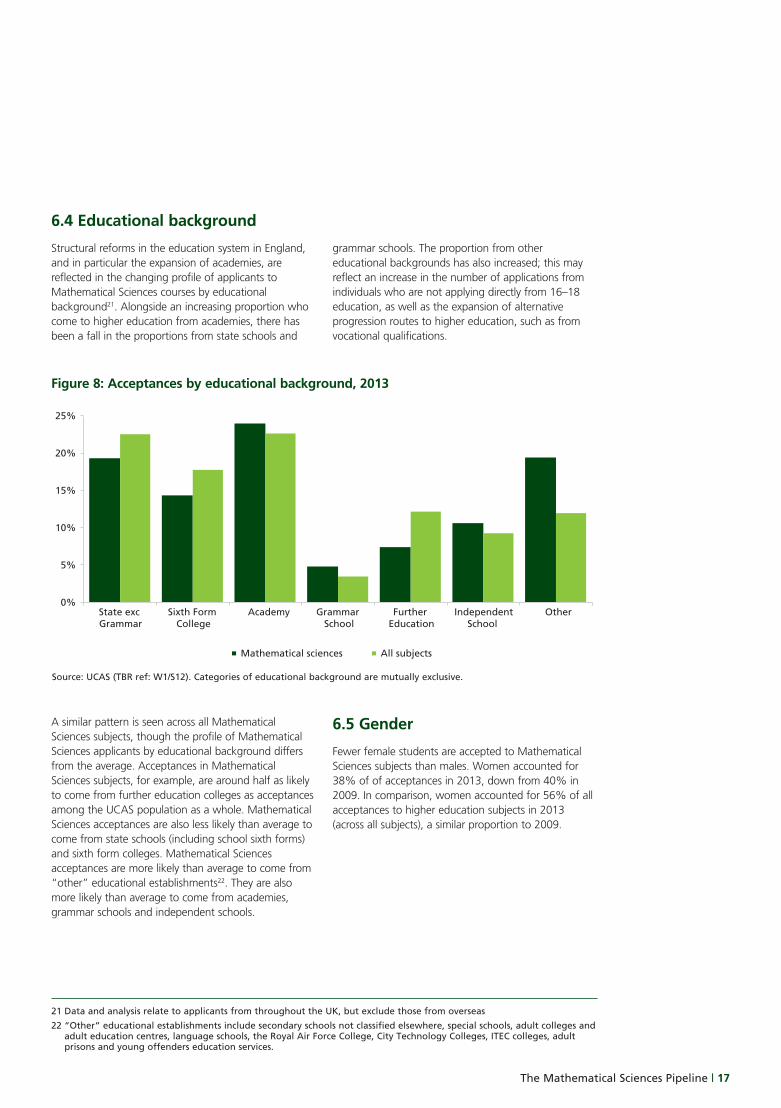
6.4 Educational background
Structural reforms in the education system in England, and in particular the expansion of academies, are reflected in the changing profile of applicants to Mathematical Sciences courses by educational background21. Alongside an increasing proportion who come to higher education from academies, there has been a fall in the proportions from state schools and
grammar schools. The proportion from other educational backgrounds has also increased; this may reflect an increase in the number of applications from individuals who are not applying directly from 16–18 education, as well as the expansion of alternative progression routes to higher education, such as from vocational qualifications.
A similar pattern is seen across all Mathematical Sciences subjects, though the profile of Mathematical Sciences applicants by educational background differs from the average. Acceptances in Mathematical Sciences subjects, for example, are around half as likely to come from further education colleges as acceptances among the UCAS population as a whole. Mathematical Sciences acceptances are also less likely than average to come from state schools (including school sixth forms) and sixth form colleges. Mathematical Sciences acceptances are more likely than average to come from “other” educational establishments22. They are also more likely than average to come from academies, grammar schools and independent schools.
6.5 Gender
Fewer female students are accepted to Mathematical Sciences subjects than males. Women accounted for 38% of of acceptances in 2013, down from 40% in 2009. In comparison, women accounted for 56% of all acceptances to higher education subjects in 2013 (across all subjects), a similar proportion to 2009.
0%
5%
10%
15%
20%
25%
State exc Grammar
Sixth Form College
Academy Grammar School
Further Education
IndependentSchool
Other
Mathematical sciences All subjects
Source: UCAS (TBR ref: W1/S12). Categories of educational background are mutually exclusive.
Figure 8: Acceptances by educational background, 2013
21 Data and analysis relate to applicants from throughout the UK, but exclude those from overseas
22 “Other” educational establishments include secondary schools not classified elsewhere, special schools, adult colleges and adult education centres, language schools, the Royal Air Force College, City Technology Colleges, ITEC colleges, adult prisons and young offenders education services.
LMS-BTL-70_ReportFINAL.pdf 21 25/09/2015 10:26
18 | The Mathematical Sciences Pipeline
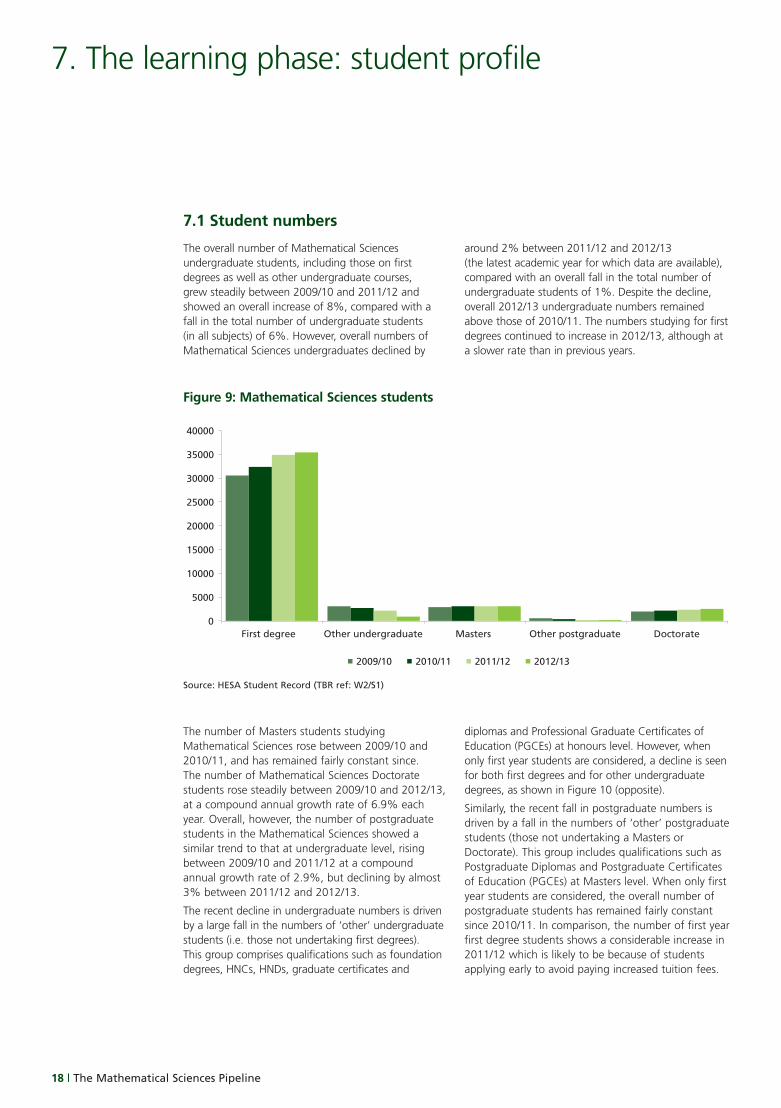
The number of Masters students studying Mathematical Sciences rose between 2009/10 and 2010/11, and has remained fairly constant since. The number of Mathematical Sciences Doctorate students rose steadily between 2009/10 and 2012/13, at a compound annual growth rate of 6.9% each year. Overall, however, the number of postgraduate students in the Mathematical Sciences showed a similar trend to that at undergraduate level, rising between 2009/10 and 2011/12 at a compound annual growth rate of 2.9%, but declining by almost 3% between 2011/12 and 2012/13.
The recent decline in undergraduate numbers is driven by a large fall in the numbers of ‘other’ undergraduate students (i.e. those not undertaking first degrees). This group comprises qualifications such as foundation degrees, HNCs, HNDs, graduate certificates and
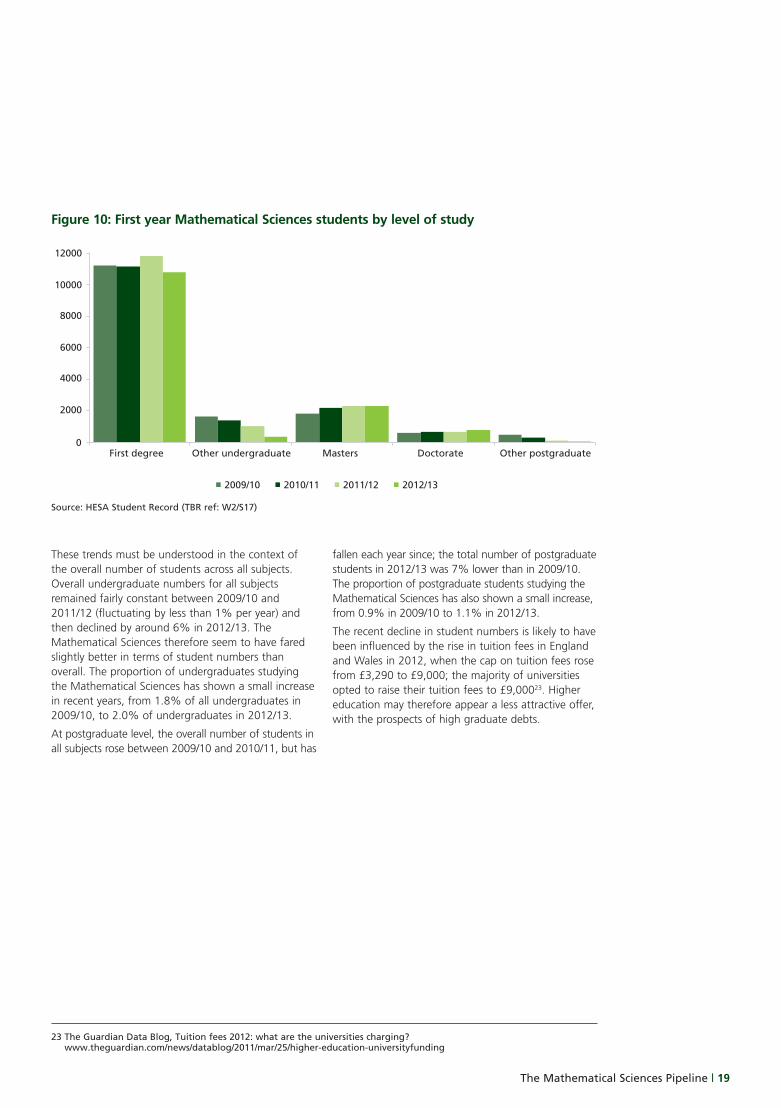
diplomas and Professional Graduate Certificates of Education (PGCEs) at honours level. However, when only first year students are considered, a decline is seen for both first degrees and for other undergraduate degrees, as shown in Figure 10 (opposite).
Similarly, the recent fall in postgraduate numbers is driven by a fall in the numbers of ‘other’ postgraduate students (those not undertaking a Masters or Doctorate). This group includes qualifications such as Postgraduate Diplomas and Postgraduate Certificates of Education (PGCEs) at Masters level. When only first year students are considered, the overall number of postgraduate students has remained fairly constant since 2010/11. In comparison, the number of first year first degree students shows a considerable increase in 2011/12 which is likely to be because of students applying early to avoid paying increased tuition fees.
7.1 Student numbers
The overall number of Mathematical Sciences undergraduate students, including those on first degrees as well as other undergraduate courses, grew steadily between 2009/10 and 2011/12 and showed an overall increase of 8%, compared with a fall in the total number of undergraduate students (in all subjects) of 6%. However, overall numbers of Mathematical Sciences undergraduates declined by
around 2% between 2011/12 and 2012/13 (the latest academic year for which data are available), compared with an overall fall in the total number of undergraduate students of 1%. Despite the decline, overall 2012/13 undergraduate numbers remained above those of 2010/11. The numbers studying for first degrees continued to increase in 2012/13, although at a slower rate than in previous years.
7. The learning phase: student profile
0
5000
10000
15000
20000
25000
30000
35000
40000
First degree Other undergraduate Masters Other postgraduate Doctorate
2009/10 2010/11 2011/12 2012/13
Source: HESA Student Record (TBR ref: W2/S1)
Figure 9: Mathematical Sciences students
LMS-BTL-70_ReportFINAL.pdf 22 25/09/2015 10:26
The Mathematical Sciences Pipeline | 19
These trends must be understood in the context of the overall number of students across all subjects. Overall undergraduate numbers for all subjects remained fairly constant between 2009/10 and 2011/12 (fluctuating by less than 1% per year) and then declined by around 6% in 2012/13. The Mathematical Sciences therefore seem to have fared slightly better in terms of student numbers than overall. The proportion of undergraduates studying the Mathematical Sciences has shown a small increase in recent years, from 1.8% of all undergraduates in 2009/10, to 2.0% of undergraduates in 2012/13.
At postgraduate level, the overall number of students in all subjects rose between 2009/10 and 2010/11, but has
fallen each year since; the total number of postgraduate students in 2012/13 was 7% lower than in 2009/10. The proportion of postgraduate students studying the Mathematical Sciences has also shown a small increase, from 0.9% in 2009/10 to 1.1% in 2012/13.
The recent decline in student numbers is likely to have been influenced by the rise in tuition fees in England and Wales in 2012, when the cap on tuition fees rose from £3,290 to £9,000; the majority of universities opted to raise their tuition fees to £9,00023. Higher education may therefore appear a less attractive offer, with the prospects of high graduate debts.
2009/10 2010/11 2011/12 2012/13
0
2000
4000
6000
8000
10000
12000
First degree Other undergraduate Masters Doctorate Other postgraduate
Source: HESA Student Record (TBR ref: W2/S17)
Figure 10: First year Mathematical Sciences students by level of study
23 The Guardian Data Blog, Tuition fees 2012: what are the universities charging? www.theguardian.com/news/datablog/2011/mar/25/higher-education-universityfunding
LMS-BTL-70_ReportFINAL.pdf 23 25/09/2015 10:26
20 | The Mathematical Sciences Pipeline
7.2 Subjects studied
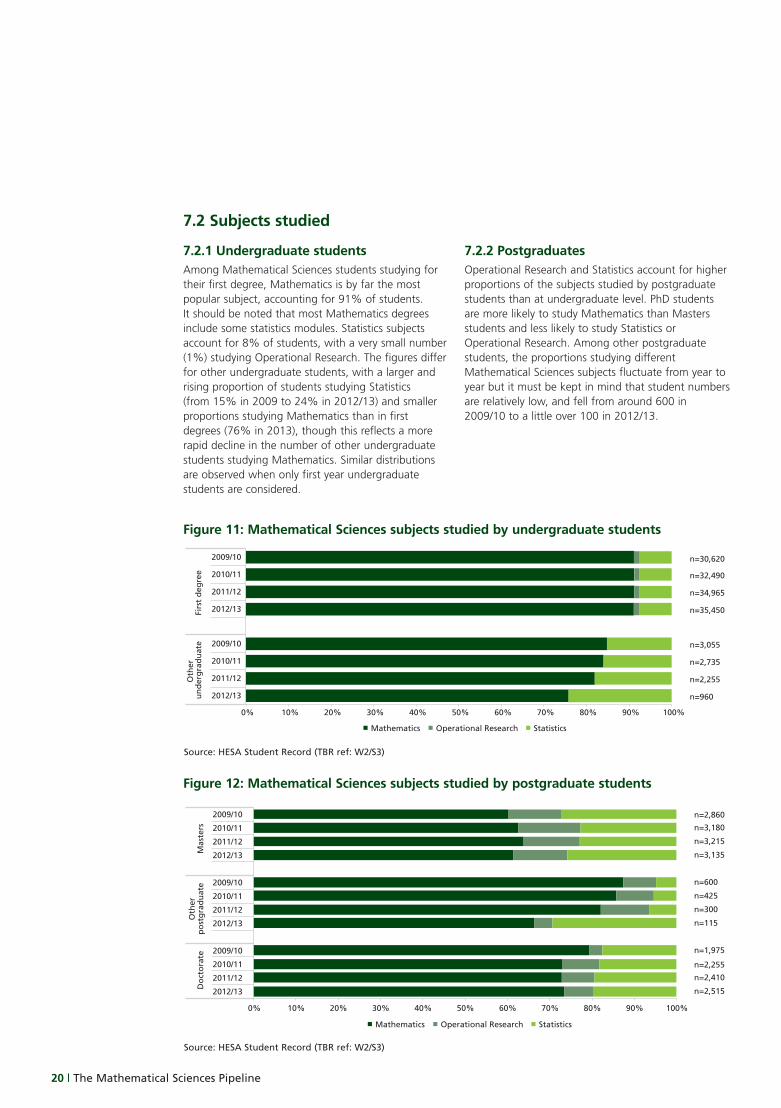
7.2.1 Undergraduate studentsAmong Mathematical Sciences students studying for their first degree, Mathematics is by far the most popular subject, accounting for 91% of students. It should be noted that most Mathematics degrees include some statistics modules. Statistics subjects account for 8% of students, with a very small number (1%) studying Operational Research. The figures differ for other undergraduate students, with a larger and rising proportion of students studying Statistics (from 15% in 2009 to 24% in 2012/13) and smaller proportions studying Mathematics than in first degrees (76% in 2013), though this reflects a more rapid decline in the number of other undergraduate students studying Mathematics. Similar distributions are observed when only first year undergraduate students are considered.
7.2.2 PostgraduatesOperational Research and Statistics account for higher proportions of the subjects studied by postgraduate students than at undergraduate level. PhD students are more likely to study Mathematics than Masters students and less likely to study Statistics or Operational Research. Among other postgraduate students, the proportions studying different Mathematical Sciences subjects fluctuate from year to year but it must be kept in mind that student numbers are relatively low, and fell from around 600 in 2009/10 to a little over 100 in 2012/13.
0% 10% 20% 30% 40% 50% 60% 70% 80% 90% 100%
2009/10
2010/11
2011/12
2012/13
2009/10
2010/11
2011/12
2012/13
Firs
t d
egre
eO
ther
u
nd
erg
rad
uat
e
n=30,620
n=32,490
n=34,965
n=35,450
n=3,055
n=2,735
n=2,255
n=960
Mathematics Operational Research Statistics
Source: HESA Student Record (TBR ref: W2/S3)
Figure 11: Mathematical Sciences subjects studied by undergraduate students
0% 10% 20% 30% 40% 50% 60% 70% 80% 90% 100%
2009/10
2010/11
2011/12
2012/13
2009/10
2010/11
2011/12
2012/13
2009/10
2010/11
2011/12
2012/13
Mas
ters
Oth
er
po
stg
rad
uat
eD
oct
ora
te
Mathematics Operational Research Statistics
n=2,860
n=3,180
n=3,215
n=3,135
n=600
n=425
n=300
n=115
n=1,975
n=2,255
n=2,410
n=2,515
Source: HESA Student Record (TBR ref: W2/S3)
Figure 12: Mathematical Sciences subjects studied by postgraduate students
LMS-BTL-70_ReportFINAL.pdf 24 25/09/2015 10:26
The Mathematical Sciences Pipeline | 21
7.4 Geography
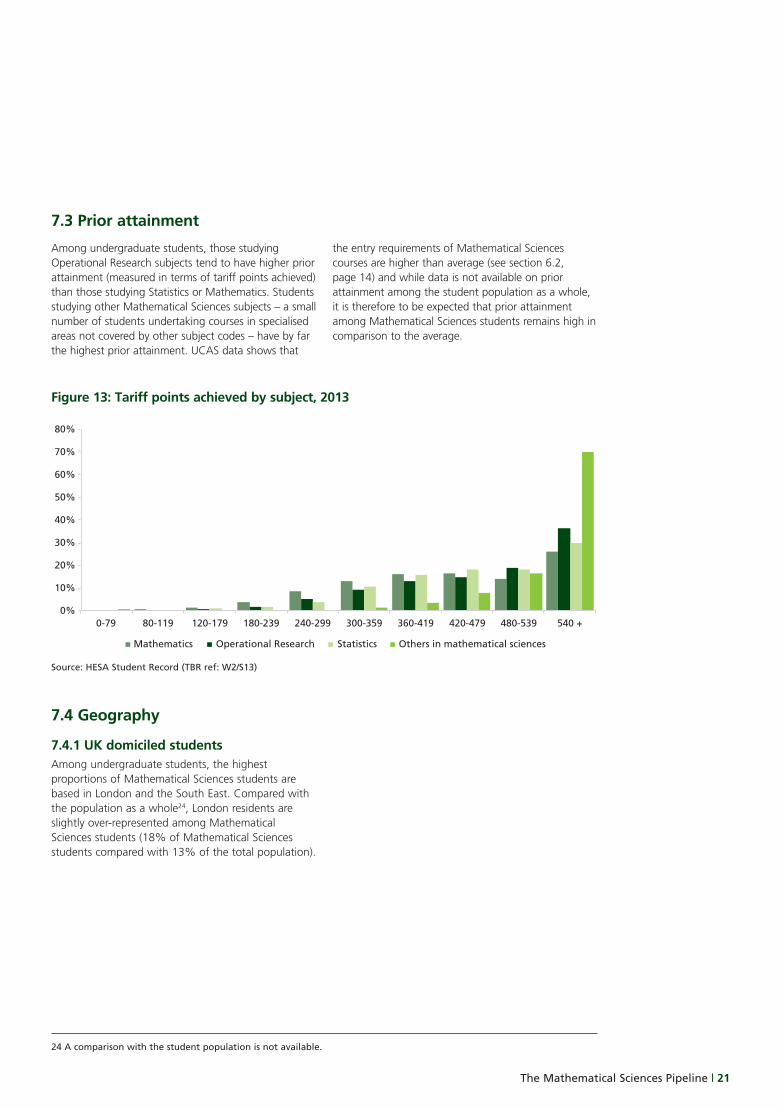
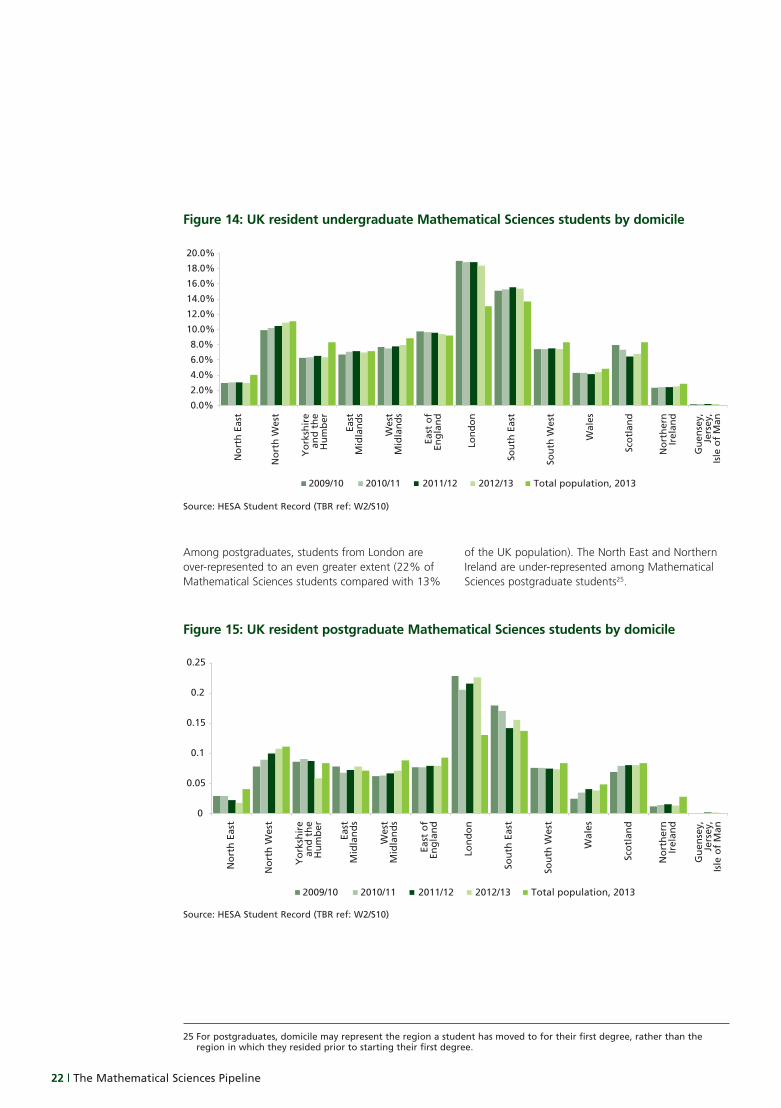
7.4.1 UK domiciled studentsAmong undergraduate students, the highest proportions of Mathematical Sciences students are based in London and the South East. Compared with the population as a whole24, London residents are slightly over-represented among Mathematical Sciences students (18% of Mathematical Sciences students compared with 13% of the total population).
7.3 Prior attainment
Among undergraduate students, those studying Operational Research subjects tend to have higher prior attainment (measured in terms of tariff points achieved) than those studying Statistics or Mathematics. Students studying other Mathematical Sciences subjects – a small number of students undertaking courses in specialised areas not covered by other subject codes – have by far the highest prior attainment. UCAS data shows that
the entry requirements of Mathematical Sciences courses are higher than average (see section 6.2, page 14) and while data is not available on prior attainment among the student population as a whole, it is therefore to be expected that prior attainment among Mathematical Sciences students remains high in comparison to the average.
0%
10%
20%
30%
40%
50%
60%
70%
80%
0-79 80-119 120-179 180-239 240-299 300-359 360-419 420-479 480-539 540 +
Mathematics Operational Research Statistics Others in mathematical sciences
Source: HESA Student Record (TBR ref: W2/S13)
Figure 13: Tariff points achieved by subject, 2013
24 A comparison with the student population is not available.
LMS-BTL-70_ReportFINAL.pdf 25 25/09/2015 10:26
22 | The Mathematical Sciences Pipeline
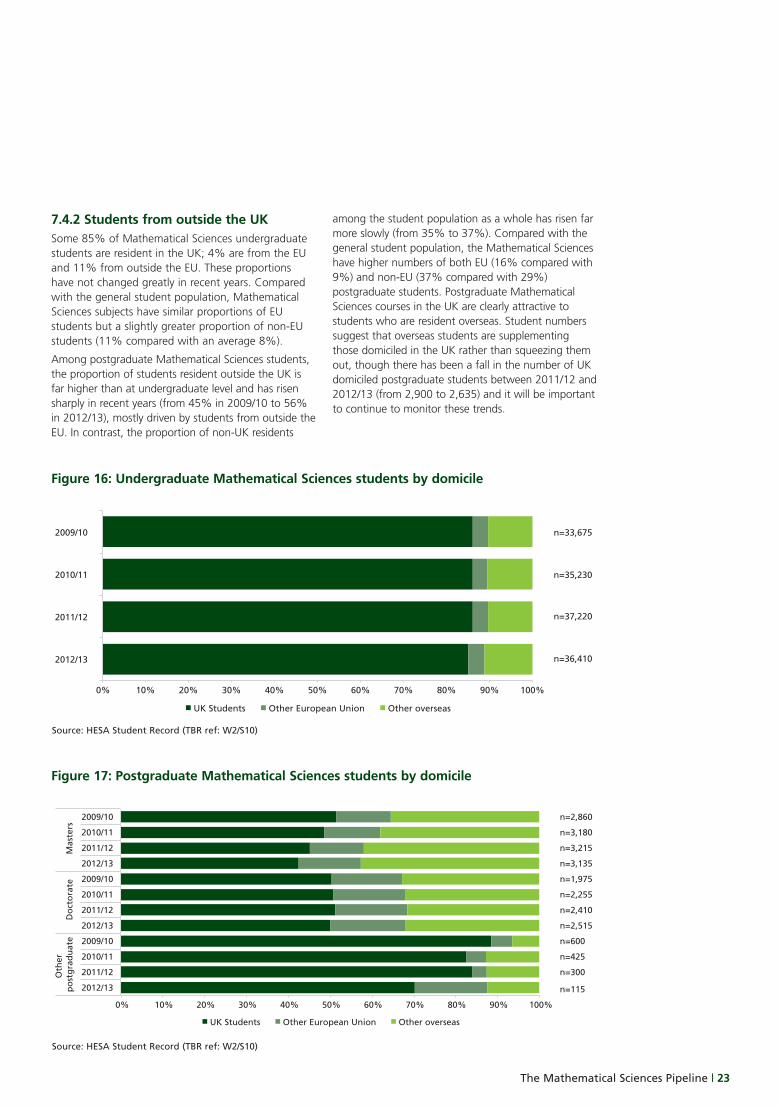
Among postgraduates, students from London are over-represented to an even greater extent (22% of Mathematical Sciences students compared with 13%
of the UK population). The North East and Northern Ireland are under-represented among Mathematical Sciences postgraduate students25.
No
rth
Eas
t
No
rth
Wes
t
Yo
rksh
ire
and
th
eH
um
ber
East
Mid
lan
ds
Wes
tM
idla
nd
s
East
of
Eng
lan
d
Lon
do
n
Sou
th E
ast
Sou
th W
est
Wal
es
Sco
tlan
d
No
rth
ern
Irel
and
Gu
ense
y,Je
rsey
,Is
le o
f M
an
2009/10 2010/11 2011/12 2012/13 Total population, 2013
0.0%
2.0%
4.0%
6.0%
8.0%
10.0%
12.0%
14.0%
16.0%
18.0%
20.0%
Source: HESA Student Record (TBR ref: W2/S10)
Figure 14: UK resident undergraduate Mathematical Sciences students by domicile
25 For postgraduates, domicile may represent the region a student has moved to for their first degree, rather than the region in which they resided prior to starting their first degree.
No
rth
Eas
t
No
rth
Wes
t
Yo
rksh
ire
and
th
eH
um
ber
East
Mid
lan
ds
Wes
tM
idla
nd
s
East
of
Eng
lan
d
Lon
do
n
Sou
th E
ast
Sou
th W
est
Wal
es
Sco
tlan
d
No
rth
ern
Irel
and
Gu
ense
y,Je
rsey
,Is
le o
f M
an
2009/10 2010/11 2011/12 2012/13 Total population, 2013
0
0.05
0.1
0.15
0.2
0.25
Source: HESA Student Record (TBR ref: W2/S10)
Figure 15: UK resident postgraduate Mathematical Sciences students by domicile
LMS-BTL-70_ReportFINAL.pdf 26 25/09/2015 10:26
The Mathematical Sciences Pipeline | 23
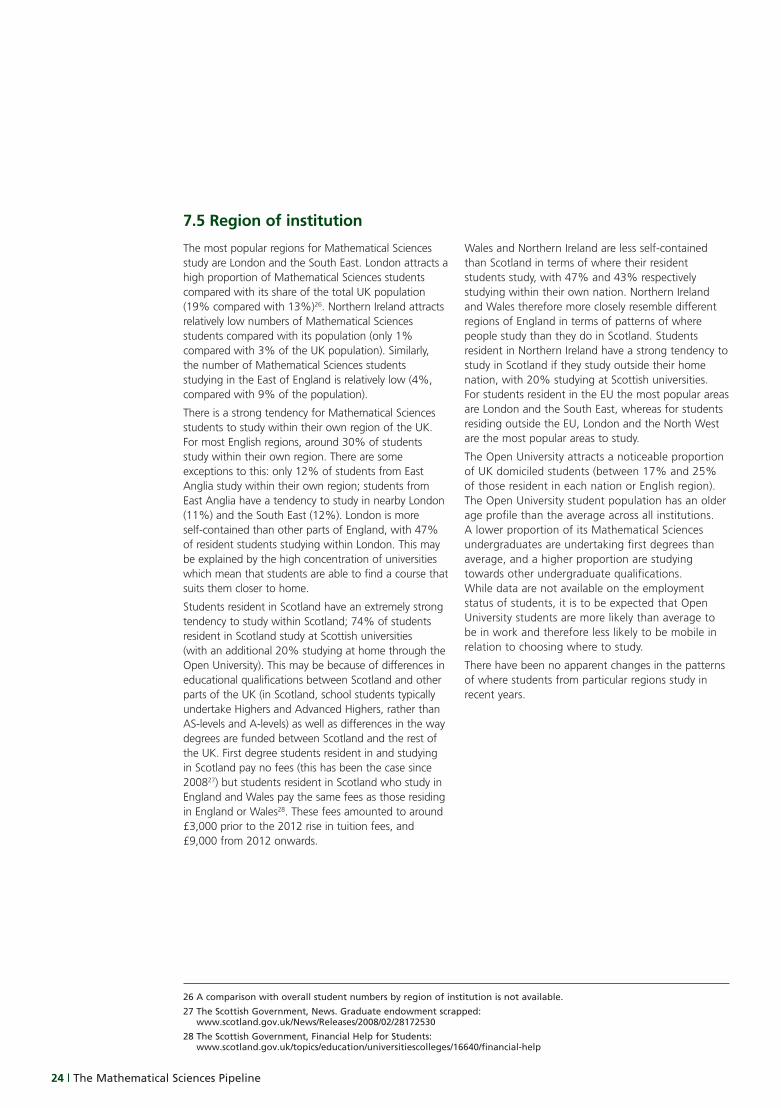
7.4.2 Students from outside the UKSome 85% of Mathematical Sciences undergraduate students are resident in the UK; 4% are from the EU and 11% from outside the EU. These proportions have not changed greatly in recent years. Compared with the general student population, Mathematical Sciences subjects have similar proportions of EU students but a slightly greater proportion of non-EU students (11% compared with an average 8%).
Among postgraduate Mathematical Sciences students, the proportion of students resident outside the UK is far higher than at undergraduate level and has risen sharply in recent years (from 45% in 2009/10 to 56% in 2012/13), mostly driven by students from outside the EU. In contrast, the proportion of non-UK residents
among the student population as a whole has risen far more slowly (from 35% to 37%). Compared with the general student population, the Mathematical Sciences have higher numbers of both EU (16% compared with 9%) and non-EU (37% compared with 29%) postgraduate students. Postgraduate Mathematical Sciences courses in the UK are clearly attractive to students who are resident overseas. Student numbers suggest that overseas students are supplementing those domiciled in the UK rather than squeezing them out, though there has been a fall in the number of UK domiciled postgraduate students between 2011/12 and 2012/13 (from 2,900 to 2,635) and it will be important to continue to monitor these trends.
n=33,675
n=35,230
n=37,220
n=36,410
0% 10% 20% 30% 40% 50% 60% 70% 80% 90% 100%
2009/10
2010/11
2011/12
2012/13
UK Students Other European Union Other overseas
Source: HESA Student Record (TBR ref: W2/S10)
Figure 16: Undergraduate Mathematical Sciences students by domicile
n=2,860
n=3,180
n=3,215
n=3,135
n=1,975
n=2,255
n=2,410
n=2,515
n=600
n=425
n=300
n=115
0% 10% 20% 30% 40% 50% 60% 70% 80% 90% 100%
2009/10
2010/11
2011/12
2012/13
2009/10
2010/11
2011/12
2012/13
2009/10
2010/11
2011/12
2012/13
Mas
ters
Do
cto
rate
Oth
er
po
stg
rad
uat
e
UK Students Other European Union Other overseas
Source: HESA Student Record (TBR ref: W2/S10)
Figure 17: Postgraduate Mathematical Sciences students by domicile
LMS-BTL-70_ReportFINAL.pdf 27 25/09/2015 10:26
24 | The Mathematical Sciences Pipeline
7.5 Region of institution
The most popular regions for Mathematical Sciences study are London and the South East. London attracts a high proportion of Mathematical Sciences students compared with its share of the total UK population (19% compared with 13%)26. Northern Ireland attracts relatively low numbers of Mathematical Sciences students compared with its population (only 1% compared with 3% of the UK population). Similarly, the number of Mathematical Sciences students studying in the East of England is relatively low (4%, compared with 9% of the population).
There is a strong tendency for Mathematical Sciences students to study within their own region of the UK. For most English regions, around 30% of students study within their own region. There are some exceptions to this: only 12% of students from East Anglia study within their own region; students from East Anglia have a tendency to study in nearby London (11%) and the South East (12%). London is more self-contained than other parts of England, with 47% of resident students studying within London. This may be explained by the high concentration of universities which mean that students are able to find a course that suits them closer to home.
Students resident in Scotland have an extremely strong tendency to study within Scotland; 74% of students resident in Scotland study at Scottish universities (with an additional 20% studying at home through the Open University). This may be because of differences in educational qualifications between Scotland and other parts of the UK (in Scotland, school students typically undertake Highers and Advanced Highers, rather than AS-levels and A-levels) as well as differences in the way degrees are funded between Scotland and the rest of the UK. First degree students resident in and studying in Scotland pay no fees (this has been the case since 200827) but students resident in Scotland who study in England and Wales pay the same fees as those residing in England or Wales28. These fees amounted to around £3,000 prior to the 2012 rise in tuition fees, and £9,000 from 2012 onwards.
Wales and Northern Ireland are less self-contained than Scotland in terms of where their resident students study, with 47% and 43% respectively studying within their own nation. Northern Ireland and Wales therefore more closely resemble different regions of England in terms of patterns of where people study than they do in Scotland. Students resident in Northern Ireland have a strong tendency to study in Scotland if they study outside their home nation, with 20% studying at Scottish universities. For students resident in the EU the most popular areas are London and the South East, whereas for students residing outside the EU, London and the North West are the most popular areas to study.
The Open University attracts a noticeable proportion of UK domiciled students (between 17% and 25% of those resident in each nation or English region). The Open University student population has an older age profile than the average across all institutions. A lower proportion of its Mathematical Sciences undergraduates are undertaking first degrees than average, and a higher proportion are studying towards other undergraduate qualifications. While data are not available on the employment status of students, it is to be expected that Open University students are more likely than average to be in work and therefore less likely to be mobile in relation to choosing where to study.
There have been no apparent changes in the patterns of where students from particular regions study in recent years.
26 A comparison with overall student numbers by region of institution is not available.
27 The Scottish Government, News. Graduate endowment scrapped: www.scotland.gov.uk/News/Releases/2008/02/28172530
28 The Scottish Government, Financial Help for Students: www.scotland.gov.uk/topics/education/universitiescolleges/16640/financial-help
LMS-BTL-70_ReportFINAL.pdf 28 25/09/2015 10:26
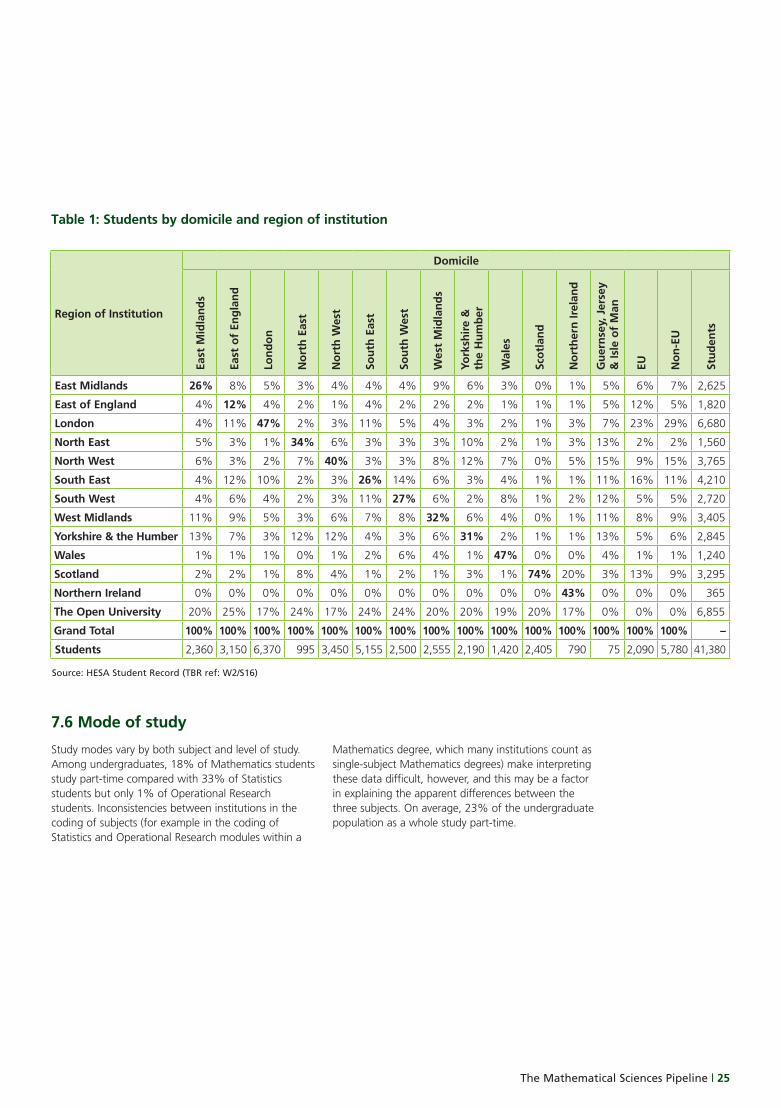
The Mathematical Sciences Pipeline | 25
Region of Institution
Domicile
East
Mid
land
s
East
of
Engl
and
Lond
on
Nor
th E
ast
Nor
th W
est
Sout
h Ea
st
Sout
h W
est
Wes
t M
idla
nds
York
shir
e &
th
e H
umbe
r
Wal
es
Scot
land
Nor
ther
n Ir
elan
d
Gue
rnse
y, J
erse
y
& Is
le o
f M
an
EU Non
-EU
Stud
ents
East Midlands 26% 8% 5% 3% 4% 4% 4% 9% 6% 3% 0% 1% 5% 6% 7% 2,625
East of England 4% 12% 4% 2% 1% 4% 2% 2% 2% 1% 1% 1% 5% 12% 5% 1,820
London 4% 11% 47% 2% 3% 11% 5% 4% 3% 2% 1% 3% 7% 23% 29% 6,680
North East 5% 3% 1% 34% 6% 3% 3% 3% 10% 2% 1% 3% 13% 2% 2% 1,560
North West 6% 3% 2% 7% 40% 3% 3% 8% 12% 7% 0% 5% 15% 9% 15% 3,765
South East 4% 12% 10% 2% 3% 26% 14% 6% 3% 4% 1% 1% 11% 16% 11% 4,210
South West 4% 6% 4% 2% 3% 11% 27% 6% 2% 8% 1% 2% 12% 5% 5% 2,720
West Midlands 11% 9% 5% 3% 6% 7% 8% 32% 6% 4% 0% 1% 11% 8% 9% 3,405
Yorkshire & the Humber 13% 7% 3% 12% 12% 4% 3% 6% 31% 2% 1% 1% 13% 5% 6% 2,845
Wales 1% 1% 1% 0% 1% 2% 6% 4% 1% 47% 0% 0% 4% 1% 1% 1,240
Scotland 2% 2% 1% 8% 4% 1% 2% 1% 3% 1% 74% 20% 3% 13% 9% 3,295
Northern Ireland 0% 0% 0% 0% 0% 0% 0% 0% 0% 0% 0% 43% 0% 0% 0% 365
The Open University 20% 25% 17% 24% 17% 24% 24% 20% 20% 19% 20% 17% 0% 0% 0% 6,855
Grand Total 100% 100% 100% 100% 100% 100% 100% 100% 100% 100% 100% 100% 100% 100% 100% –
Students 2,360 3,150 6,370 995 3,450 5,155 2,500 2,555 2,190 1,420 2,405 790 75 2,090 5,780 41,380
Table 1: Students by domicile and region of institution
7.6 Mode of study
Study modes vary by both subject and level of study. Among undergraduates, 18% of Mathematics students study part-time compared with 33% of Statistics students but only 1% of Operational Research students. Inconsistencies between institutions in the coding of subjects (for example in the coding of Statistics and Operational Research modules within a
Mathematics degree, which many institutions count as single-subject Mathematics degrees) make interpreting these data difficult, however, and this may be a factor in explaining the apparent differences between the three subjects. On average, 23% of the undergraduate population as a whole study part-time.
Source: HESA Student Record (TBR ref: W2/S16)
LMS-BTL-70_ReportFINAL.pdf 29 25/09/2015 10:26
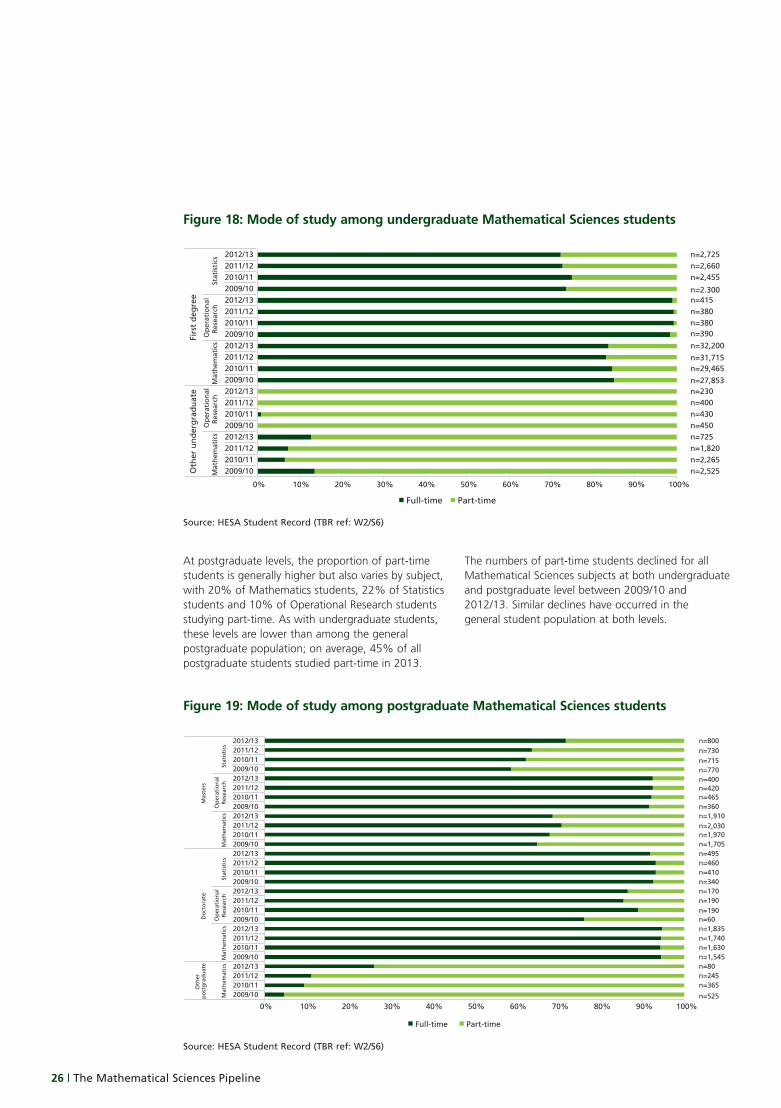
26 | The Mathematical Sciences Pipeline
At postgraduate levels, the proportion of part-time students is generally higher but also varies by subject, with 20% of Mathematics students, 22% of Statistics students and 10% of Operational Research students studying part-time. As with undergraduate students, these levels are lower than among the general postgraduate population; on average, 45% of all postgraduate students studied part-time in 2013.
The numbers of part-time students declined for all Mathematical Sciences subjects at both undergraduate and postgraduate level between 2009/10 and 2012/13. Similar declines have occurred in the general student population at both levels.
n=2,525n=2,265n=1,820n=725n=450n=430n=400n=230n=27,853n=29,465n=31,715n=32,200n=390n=380n=380n=415n=2.300
n=2,455n=2,660n=2,725
0% 10% 20% 30% 40% 50% 60% 70% 80% 90% 100%
2009/102010/112011/122012/132009/102010/112011/122012/132009/102010/112011/122012/132009/102010/112011/122012/132009/102010/112011/122012/13
Mat
hem
atic
sO
per
atio
nal
R
esea
rch
Mat
hem
atic
sO
per
atio
nal
R
esea
rch
Stat
isti
cs
Oth
er u
nd
erg
rad
uat
eFi
rst
deg
ree
Full-time Part-time
Source: HESA Student Record (TBR ref: W2/S6)
Figure 18: Mode of study among undergraduate Mathematical Sciences students
Full-time Part-time
n=525
n=365n=245n=80n=1,545n=1,630n=1,740n=1,835n=60n=190n=190n=170n=340n=410n=460n=495n=1,705n=1,970n=2,030n=1,910n=360n=465n=420n=400n=770n=715n=730n=800
0% 10% 20% 30% 40% 50% 60% 70% 80% 90% 100%
2009/102010/112011/122012/132009/102010/112011/122012/132009/102010/112011/122012/132009/102010/112011/122012/132009/102010/112011/122012/132009/102010/112011/122012/132009/102010/112011/122012/13
Mat
hem
atic
sM
ath
emat
ics
Op
erat
ion
al
Res
earc
hSt
atis
tics
Mat
hem
atic
sO
per
atio
nal
R
esea
rch
Stat
isti
cs
Oth
er
po
stg
rad
uat
eD
oct
ora
teM
aste
rs
Source: HESA Student Record (TBR ref: W2/S6)
Figure 19: Mode of study among postgraduate Mathematical Sciences students
LMS-BTL-70_ReportFINAL.pdf 30 25/09/2015 10:26
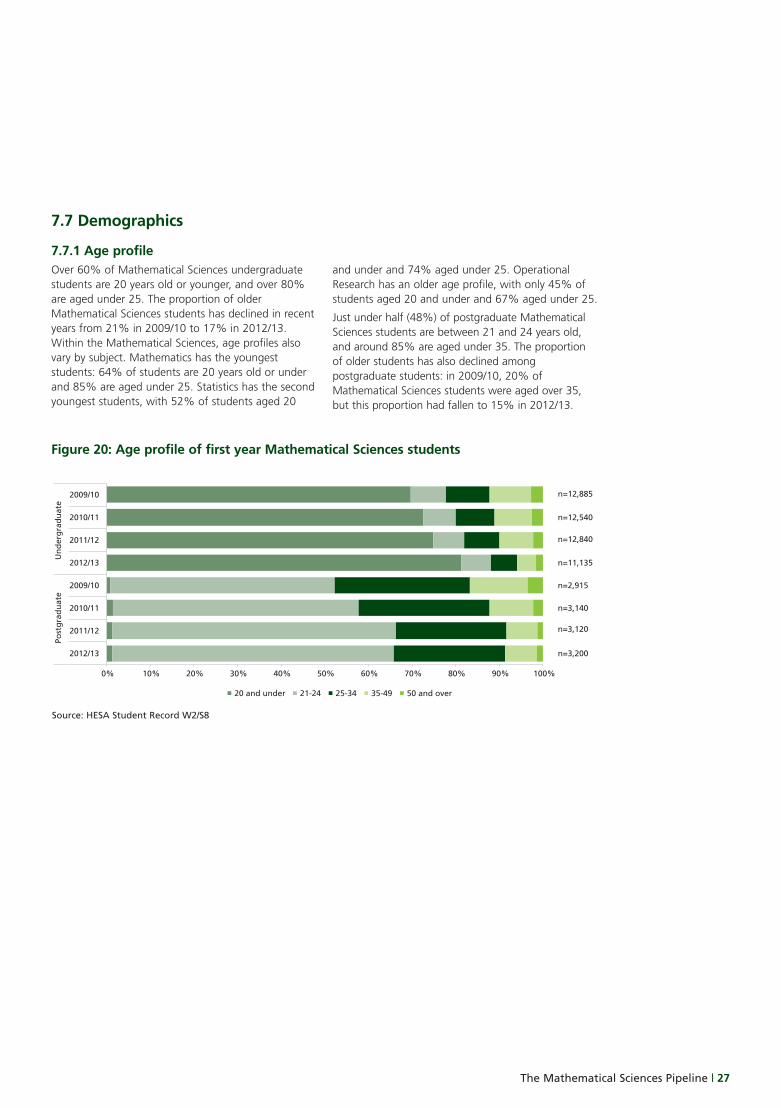
The Mathematical Sciences Pipeline | 27
7.7 Demographics
7.7.1 Age profileOver 60% of Mathematical Sciences undergraduate students are 20 years old or younger, and over 80% are aged under 25. The proportion of older Mathematical Sciences students has declined in recent years from 21% in 2009/10 to 17% in 2012/13. Within the Mathematical Sciences, age profiles also vary by subject. Mathematics has the youngest students: 64% of students are 20 years old or under and 85% are aged under 25. Statistics has the second youngest students, with 52% of students aged 20
and under and 74% aged under 25. Operational Research has an older age profile, with only 45% of students aged 20 and under and 67% aged under 25.
Just under half (48%) of postgraduate Mathematical Sciences students are between 21 and 24 years old, and around 85% are aged under 35. The proportion of older students has also declined among postgraduate students: in 2009/10, 20% of Mathematical Sciences students were aged over 35, but this proportion had fallen to 15% in 2012/13.
n=12,885
n=12,540
n=12,840
n=11,135
n=2,915
n=3,140
n=3,120
n=3,200
0% 10% 20% 30% 40% 50% 60% 70% 80% 90% 100%
2009/10
2010/11
2011/12
2012/13
2009/10
2010/11
2011/12
2012/13
Un
der
gra
du
ate
Post
gra
du
ate
20 and under 21-24 25-34 35-49 50 and over
Source: HESA Student Record W2/S8
Figure 20: Age profile of first year Mathematical Sciences students
LMS-BTL-70_ReportFINAL.pdf 31 25/09/2015 10:26
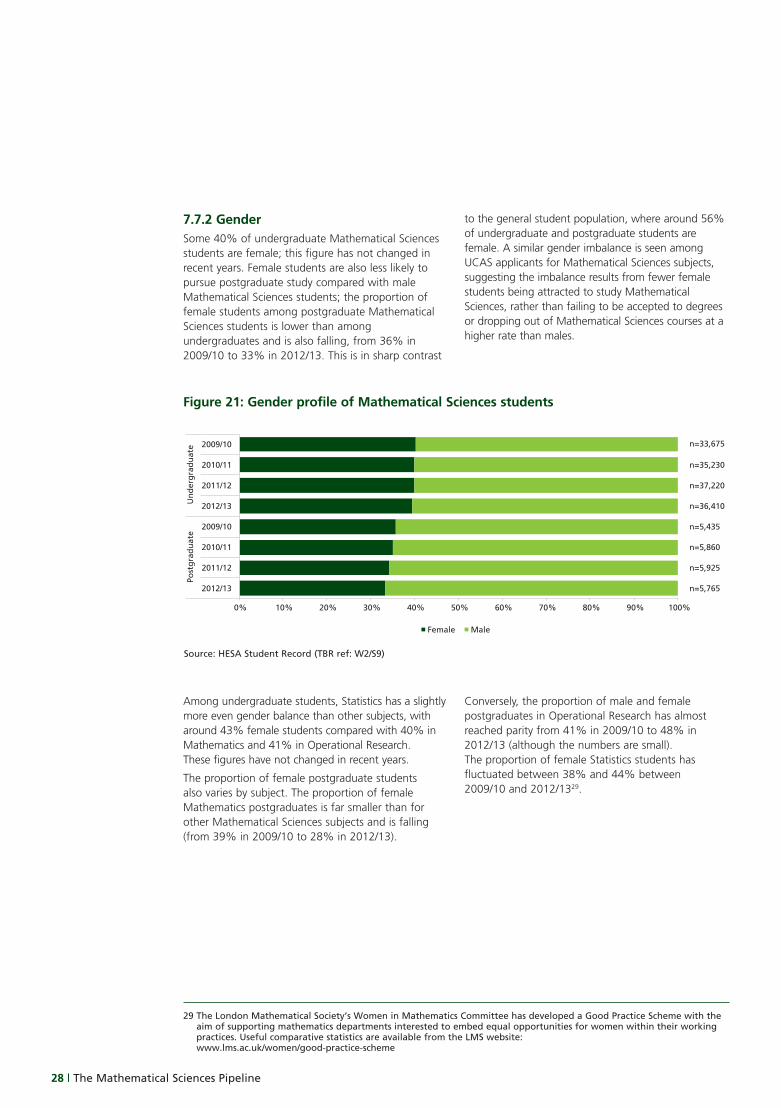
28 | The Mathematical Sciences Pipeline
7.7.2 GenderSome 40% of undergraduate Mathematical Sciences students are female; this figure has not changed in recent years. Female students are also less likely to pursue postgraduate study compared with male Mathematical Sciences students; the proportion of female students among postgraduate Mathematical Sciences students is lower than among undergraduates and is also falling, from 36% in 2009/10 to 33% in 2012/13. This is in sharp contrast
to the general student population, where around 56% of undergraduate and postgraduate students are female. A similar gender imbalance is seen among UCAS applicants for Mathematical Sciences subjects, suggesting the imbalance results from fewer female students being attracted to study Mathematical Sciences, rather than failing to be accepted to degrees or dropping out of Mathematical Sciences courses at a higher rate than males.
Among undergraduate students, Statistics has a slightly more even gender balance than other subjects, with around 43% female students compared with 40% in Mathematics and 41% in Operational Research. These figures have not changed in recent years.
The proportion of female postgraduate students also varies by subject. The proportion of female Mathematics postgraduates is far smaller than for other Mathematical Sciences subjects and is falling (from 39% in 2009/10 to 28% in 2012/13).
Conversely, the proportion of male and female postgraduates in Operational Research has almost reached parity from 41% in 2009/10 to 48% in 2012/13 (although the numbers are small). The proportion of female Statistics students has fluctuated between 38% and 44% between 2009/10 and 2012/1329.
n=33,675
n=35,230
n=37,220
n=36,410
n=5,435
n=5,860
n=5,925
n=5,765
0% 10% 20% 30% 40% 50% 60% 70% 80% 90% 100%
2009/10
2010/11
2011/12
2012/13
2009/10
2010/11
2011/12
2012/13
Un
der
gra
du
ate
Post
gra
du
ate
Female Male
Source: HESA Student Record (TBR ref: W2/S9)
Figure 21: Gender profile of Mathematical Sciences students
29 The London Mathematical Society’s Women in Mathematics Committee has developed a Good Practice Scheme with the aim of supporting mathematics departments interested to embed equal opportunities for women within their working practices. Useful comparative statistics are available from the LMS website: www.lms.ac.uk/women/good-practice-scheme
LMS-BTL-70_ReportFINAL.pdf 32 25/09/2015 10:26
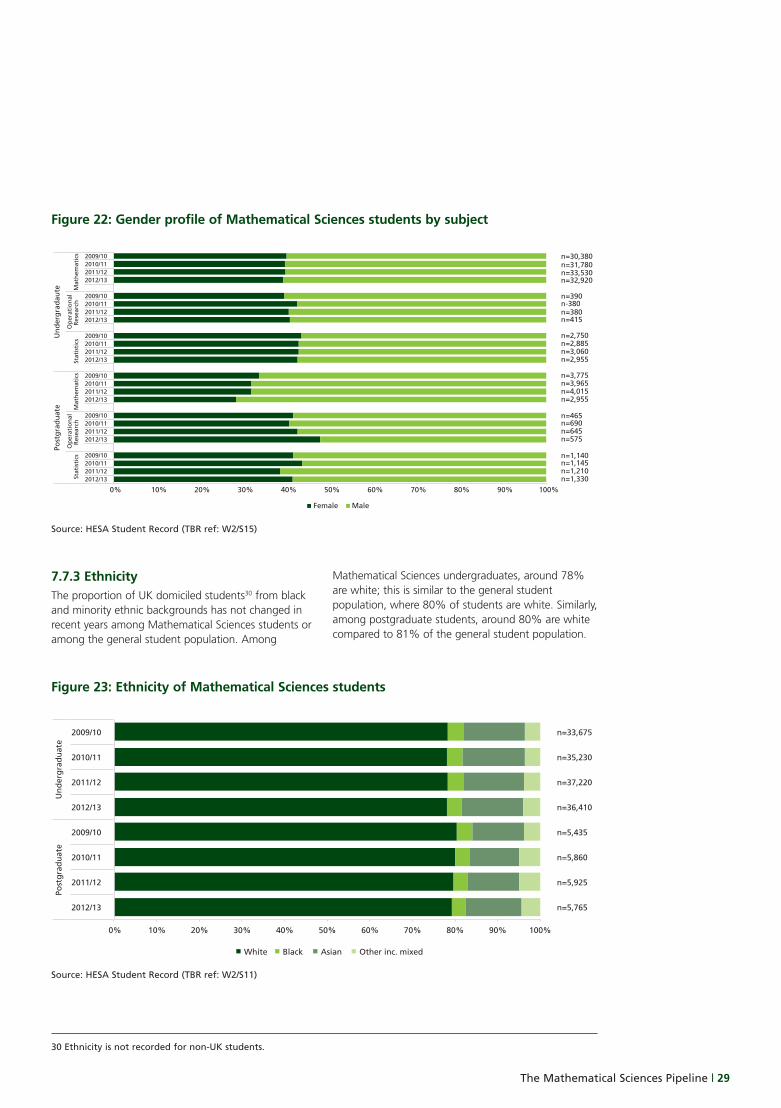
The Mathematical Sciences Pipeline | 29
n=30,380n=31,780n=33,530n=32,920
n=390n-380n=380n=415
n=2,750n=2,885n=3,060n=2,955
n=3,775n=3,965n=4,015n=2,955
n=465n=690n=645n=575
n=1,140n=1,145n=1,210n=1,330
0% 10% 20% 30% 40% 50% 60% 70% 80% 90% 100%
2009/102010/112011/122012/13
2009/102010/112011/122012/13
2009/102010/112011/122012/13
2009/102010/112011/122012/13
2009/102010/112011/122012/13
2009/102010/112011/122012/13
Mat
hem
atic
sO
per
atio
nal
R
esea
rch
Stat
isti
csM
ath
emat
ics
Op
erat
ion
al
Res
earc
hSt
atis
tics
Un
der
gra
dau
tePo
stg
rad
uat
e
Female Male
Source: HESA Student Record (TBR ref: W2/S15)
Figure 22: Gender profile of Mathematical Sciences students by subject
7.7.3 Ethnicity The proportion of UK domiciled students30 from black and minority ethnic backgrounds has not changed in recent years among Mathematical Sciences students or among the general student population. Among
Mathematical Sciences undergraduates, around 78% are white; this is similar to the general student population, where 80% of students are white. Similarly, among postgraduate students, around 80% are white compared to 81% of the general student population.
White Black Asian Other inc. mixed
n=33,675
n=35,230
n=37,220
n=36,410
n=5,435
n=5,860
n=5,925
n=5,765
0% 10% 20% 30% 40% 50% 60% 70% 80% 90% 100%
2009/10
2010/11
2011/12
2012/13
2009/10
2010/11
2011/12
2012/13
Un
der
gra
du
ate
Post
gra
du
ate
Source: HESA Student Record (TBR ref: W2/S11)
Figure 23: Ethnicity of Mathematical Sciences students
30 Ethnicity is not recorded for non-UK students.
LMS-BTL-70_ReportFINAL.pdf 33 25/09/2015 10:26
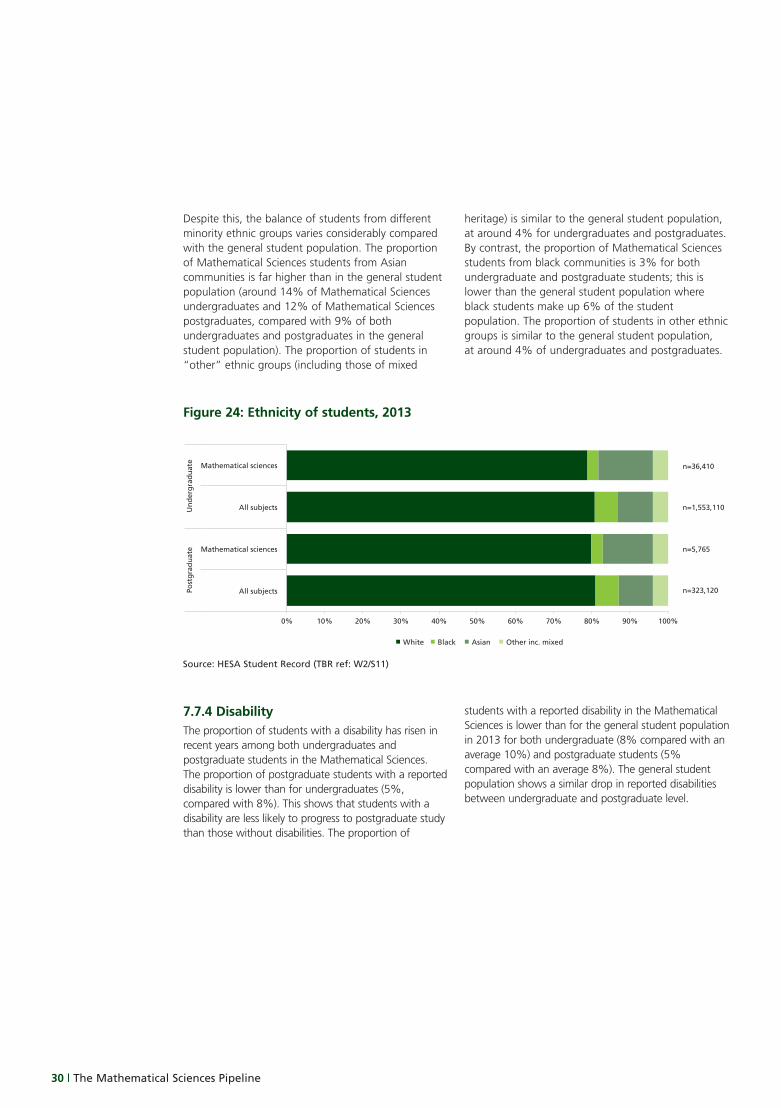
30 | The Mathematical Sciences Pipeline
Despite this, the balance of students from different minority ethnic groups varies considerably compared with the general student population. The proportion of Mathematical Sciences students from Asian communities is far higher than in the general student population (around 14% of Mathematical Sciences undergraduates and 12% of Mathematical Sciences postgraduates, compared with 9% of both undergraduates and postgraduates in the general student population). The proportion of students in “other” ethnic groups (including those of mixed
heritage) is similar to the general student population, at around 4% for undergraduates and postgraduates. By contrast, the proportion of Mathematical Sciences students from black communities is 3% for both undergraduate and postgraduate students; this is lower than the general student population where black students make up 6% of the student population. The proportion of students in other ethnic groups is similar to the general student population, at around 4% of undergraduates and postgraduates.
7.7.4 Disability The proportion of students with a disability has risen in recent years among both undergraduates and postgraduate students in the Mathematical Sciences. The proportion of postgraduate students with a reported disability is lower than for undergraduates (5%, compared with 8%). This shows that students with a disability are less likely to progress to postgraduate study than those without disabilities. The proportion of
students with a reported disability in the Mathematical Sciences is lower than for the general student population in 2013 for both undergraduate (8% compared with an average 10%) and postgraduate students (5% compared with an average 8%). The general student population shows a similar drop in reported disabilities between undergraduate and postgraduate level.
n=36,410
n=1,553,110
n=5,765
n=323,120
0% 10% 20% 30% 40% 50% 60% 70% 80% 90% 100%
Mathematical sciences
All subjects
Mathematical sciences
All subjects
Un
der
gra
du
ate
Post
gra
du
ate
White Black Asian Other inc. mixed
Source: HESA Student Record (TBR ref: W2/S11)
Figure 24: Ethnicity of students, 2013
LMS-BTL-70_ReportFINAL.pdf 34 25/09/2015 10:26
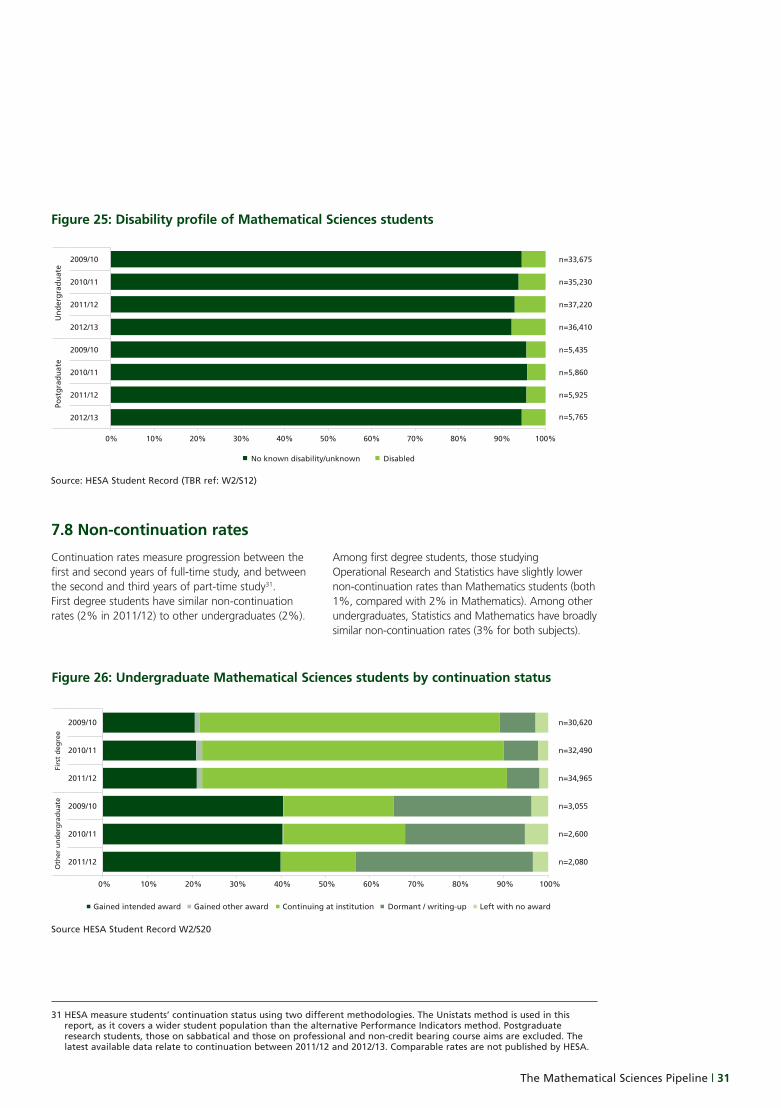
The Mathematical Sciences Pipeline | 31
n=33,675
n=35,230
n=37,220
n=36,410
n=5,435
n=5,860
n=5,925
n=5,765
0% 10% 20% 30% 40% 50% 60% 70% 80% 90% 100%
2009/10
2010/11
2011/12
2012/13
2009/10
2010/11
2011/12
2012/13
Un
der
gra
du
ate
Post
gra
du
ate
No known disability/unknown Disabled
Source: HESA Student Record (TBR ref: W2/S12)
Figure 25: Disability profile of Mathematical Sciences students
7.8 Non-continuation rates
Continuation rates measure progression between the first and second years of full-time study, and between the second and third years of part-time study31. First degree students have similar non-continuation rates (2% in 2011/12) to other undergraduates (2%).
Among first degree students, those studying Operational Research and Statistics have slightly lower non-continuation rates than Mathematics students (both 1%, compared with 2% in Mathematics). Among other undergraduates, Statistics and Mathematics have broadly similar non-continuation rates (3% for both subjects).
31 HESA measure students’ continuation status using two different methodologies. The Unistats method is used in this report, as it covers a wider student population than the alternative Performance Indicators method. Postgraduate research students, those on sabbatical and those on professional and non-credit bearing course aims are excluded. The latest available data relate to continuation between 2011/12 and 2012/13. Comparable rates are not published by HESA.
n=30,620
n=32,490
n=34,965
n=3,055
n=2,600
n=2,080
0% 10% 20% 30% 40% 50% 60% 70% 80% 90% 100%
2009/10
2010/11
2011/12
2009/10
2010/11
2011/12
Firs
t d
egre
eO
ther
un
der
gra
du
ate
Gained intended award Gained other award Continuing at institution Dormant / writing-up Left with no award
Source HESA Student Record W2/S20
Figure 26: Undergraduate Mathematical Sciences students by continuation status
LMS-BTL-70_ReportFINAL.pdf 35 25/09/2015 10:26
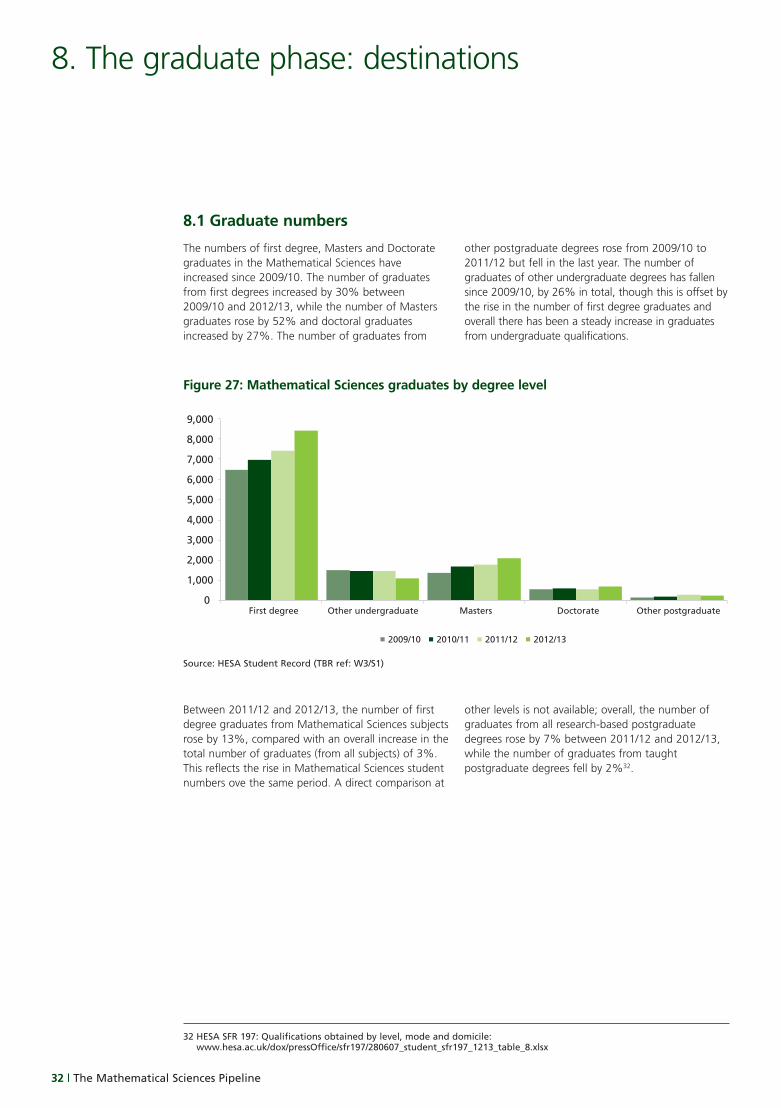
32 | The Mathematical Sciences Pipeline
32 HESA SFR 197: Qualifications obtained by level, mode and domicile: www.hesa.ac.uk/dox/pressOffice/sfr197/280607_student_sfr197_1213_table_8.xlsx
Between 2011/12 and 2012/13, the number of first degree graduates from Mathematical Sciences subjects rose by 13%, compared with an overall increase in the total number of graduates (from all subjects) of 3%. This reflects the rise in Mathematical Sciences student numbers ove the same period. A direct comparison at
other levels is not available; overall, the number of graduates from all research-based postgraduate degrees rose by 7% between 2011/12 and 2012/13, while the number of graduates from taught postgraduate degrees fell by 2%32.
8.1 Graduate numbers
The numbers of first degree, Masters and Doctorate graduates in the Mathematical Sciences have increased since 2009/10. The number of graduates from first degrees increased by 30% between 2009/10 and 2012/13, while the number of Masters graduates rose by 52% and doctoral graduates increased by 27%. The number of graduates from
other postgraduate degrees rose from 2009/10 to 2011/12 but fell in the last year. The number of graduates of other undergraduate degrees has fallen since 2009/10, by 26% in total, though this is offset by the rise in the number of first degree graduates and overall there has been a steady increase in graduates from undergraduate qualifications.
8. The graduate phase: destinations
0
1,000
2,000
3,000
4,000
5,000
6,000
7,000
8,000
9,000
First degree Other undergraduate Masters Doctorate Other postgraduate
2009/10 2010/11 2011/12 2012/13
Source: HESA Student Record (TBR ref: W3/S1)
Figure 27: Mathematical Sciences graduates by degree level
LMS-BTL-70_ReportFINAL.pdf 36 25/09/2015 10:26
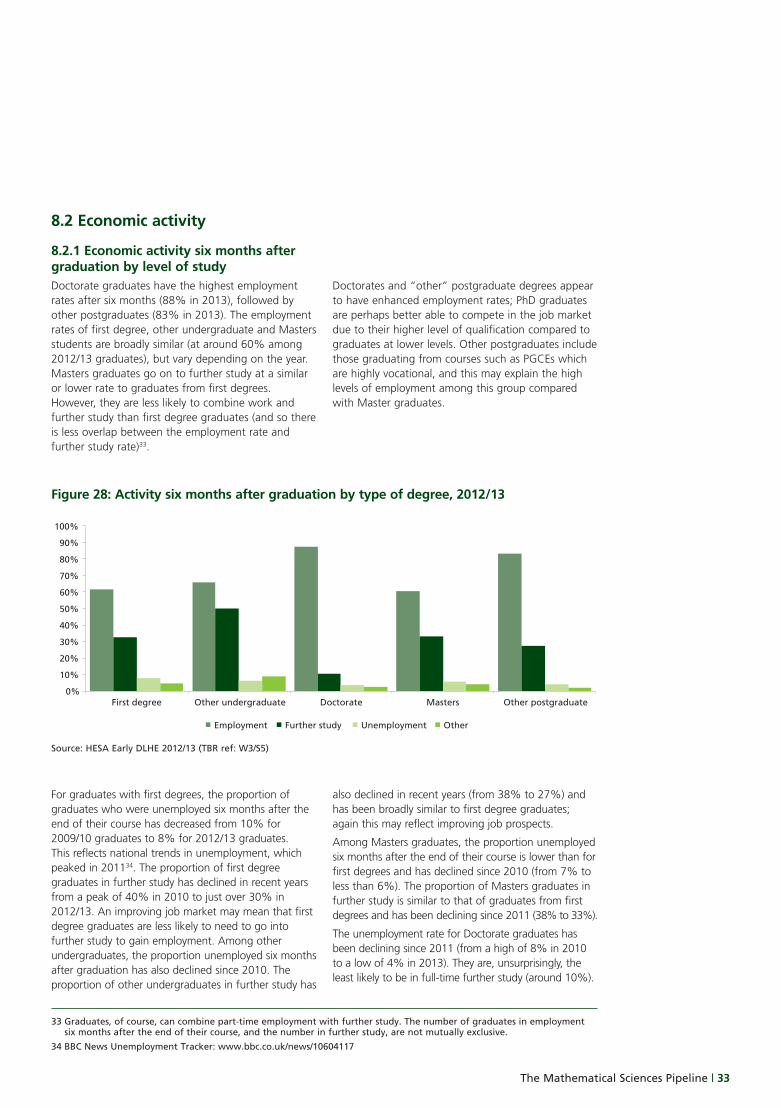
The Mathematical Sciences Pipeline | 33
33 Graduates, of course, can combine part-time employment with further study. The number of graduates in employment six months after the end of their course, and the number in further study, are not mutually exclusive.
34 BBC News Unemployment Tracker: www.bbc.co.uk/news/10604117
For graduates with first degrees, the proportion of graduates who were unemployed six months after the end of their course has decreased from 10% for 2009/10 graduates to 8% for 2012/13 graduates. This reflects national trends in unemployment, which peaked in 201134. The proportion of first degree graduates in further study has declined in recent years from a peak of 40% in 2010 to just over 30% in 2012/13. An improving job market may mean that first degree graduates are less likely to need to go into further study to gain employment. Among other undergraduates, the proportion unemployed six months after graduation has also declined since 2010. The proportion of other undergraduates in further study has
also declined in recent years (from 38% to 27%) and has been broadly similar to first degree graduates; again this may reflect improving job prospects.
Among Masters graduates, the proportion unemployed six months after the end of their course is lower than for first degrees and has declined since 2010 (from 7% to less than 6%). The proportion of Masters graduates in further study is similar to that of graduates from first degrees and has been declining since 2011 (38% to 33%).
The unemployment rate for Doctorate graduates has been declining since 2011 (from a high of 8% in 2010 to a low of 4% in 2013). They are, unsurprisingly, the least likely to be in full-time further study (around 10%).
8.2 Economic activity
8.2.1 Economic activity six months after graduation by level of studyDoctorate graduates have the highest employment rates after six months (88% in 2013), followed by other postgraduates (83% in 2013). The employment rates of first degree, other undergraduate and Masters students are broadly similar (at around 60% among 2012/13 graduates), but vary depending on the year. Masters graduates go on to further study at a similar or lower rate to graduates from first degrees. However, they are less likely to combine work and further study than first degree graduates (and so there is less overlap between the employment rate and further study rate)33.
Doctorates and “other” postgraduate degrees appear to have enhanced employment rates; PhD graduates are perhaps better able to compete in the job market due to their higher level of qualification compared to graduates at lower levels. Other postgraduates include those graduating from courses such as PGCEs which are highly vocational, and this may explain the high levels of employment among this group compared with Master graduates.
0%
10%
20%
30%
40%
50%
60%
70%
80%
90%
100%
First degree Other undergraduate Doctorate Masters Other postgraduate
Employment Further study Unemployment Other
Source: HESA Early DLHE 2012/13 (TBR ref: W3/S5)
Figure 28: Activity six months after graduation by type of degree, 2012/13
LMS-BTL-70_ReportFINAL.pdf 37 25/09/2015 10:26
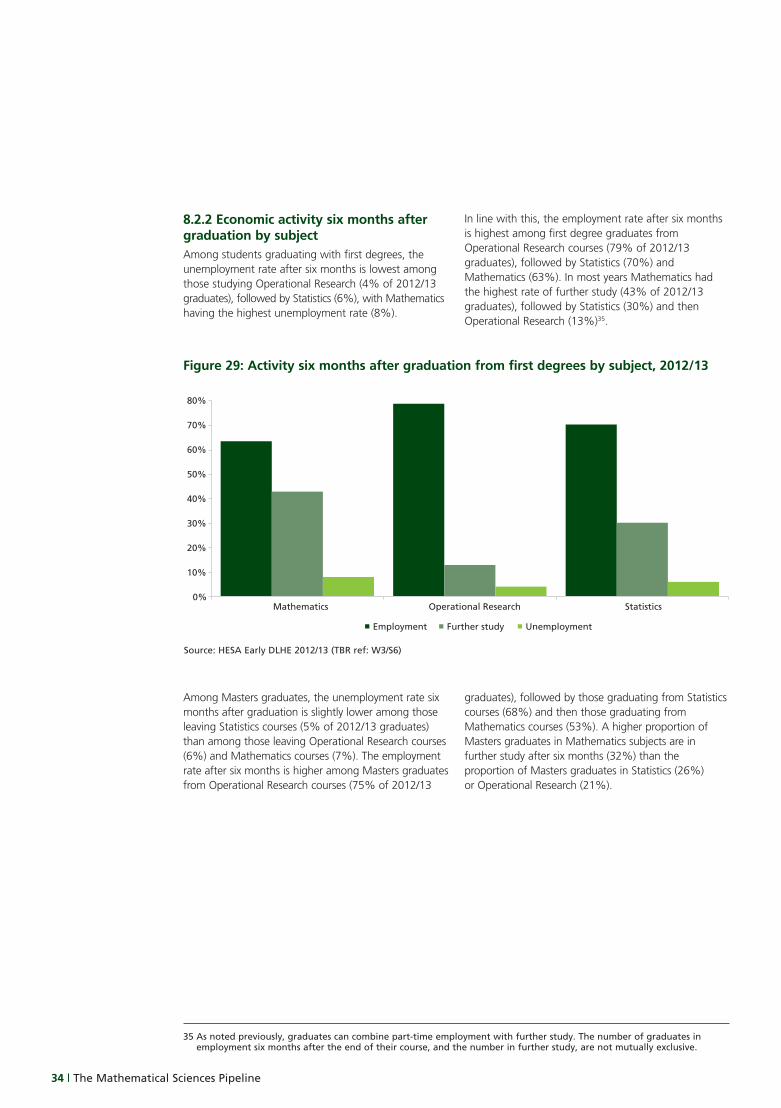
34 | The Mathematical Sciences Pipeline
8.2.2 Economic activity six months after graduation by subjectAmong students graduating with first degrees, the unemployment rate after six months is lowest among those studying Operational Research (4% of 2012/13 graduates), followed by Statistics (6%), with Mathematics having the highest unemployment rate (8%).
In line with this, the employment rate after six months is highest among first degree graduates from Operational Research courses (79% of 2012/13 graduates), followed by Statistics (70%) and Mathematics (63%). In most years Mathematics had the highest rate of further study (43% of 2012/13 graduates), followed by Statistics (30%) and then Operational Research (13%)35.
Among Masters graduates, the unemployment rate six months after graduation is slightly lower among those leaving Statistics courses (5% of 2012/13 graduates) than among those leaving Operational Research courses (6%) and Mathematics courses (7%). The employment rate after six months is higher among Masters graduates from Operational Research courses (75% of 2012/13
graduates), followed by those graduating from Statistics courses (68%) and then those graduating from Mathematics courses (53%). A higher proportion of Masters graduates in Mathematics subjects are in further study after six months (32%) than the proportion of Masters graduates in Statistics (26%) or Operational Research (21%).
Mathematics Operational Research Statistics
Employment Further study Unemployment
0%
10%
20%
30%
40%
50%
60%
70%
80%
Source: HESA Early DLHE 2012/13 (TBR ref: W3/S6)
Figure 29: Activity six months after graduation from first degrees by subject, 2012/13
35 As noted previously, graduates can combine part-time employment with further study. The number of graduates in employment six months after the end of their course, and the number in further study, are not mutually exclusive.
LMS-BTL-70_ReportFINAL.pdf 38 25/09/2015 10:26
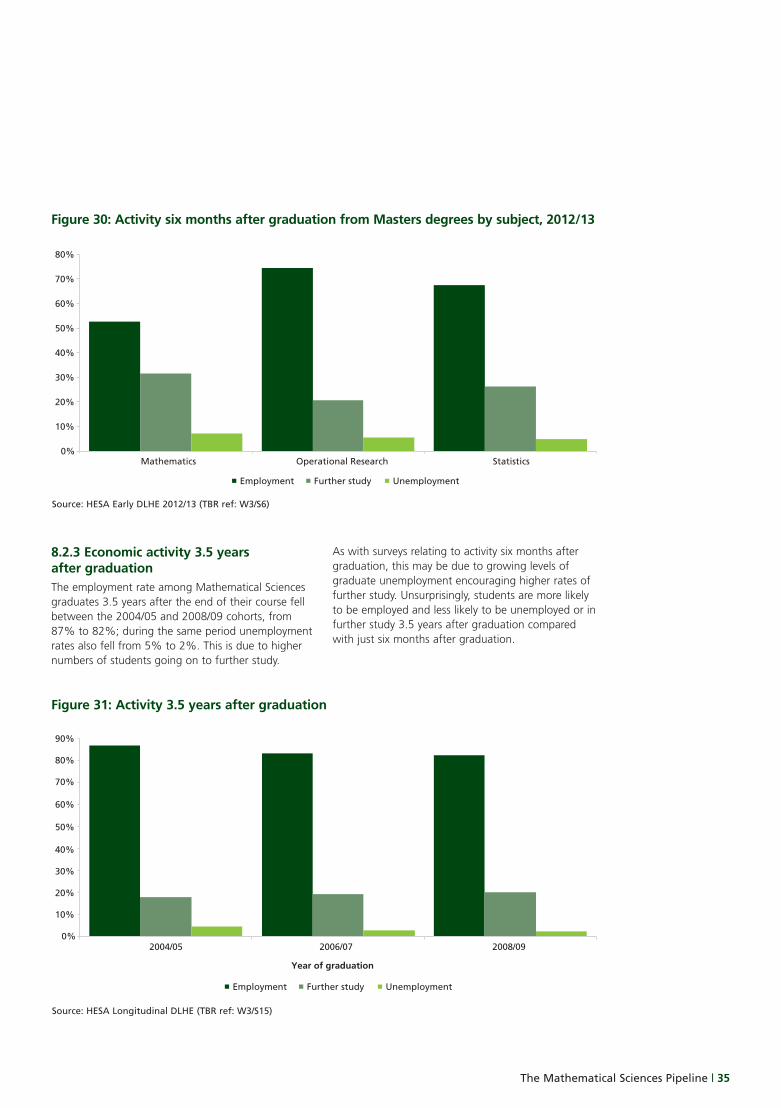
The Mathematical Sciences Pipeline | 35
8.2.3 Economic activity 3.5 years after graduationThe employment rate among Mathematical Sciences graduates 3.5 years after the end of their course fell between the 2004/05 and 2008/09 cohorts, from 87% to 82%; during the same period unemployment rates also fell from 5% to 2%. This is due to higher numbers of students going on to further study.
As with surveys relating to activity six months after graduation, this may be due to growing levels of graduate unemployment encouraging higher rates of further study. Unsurprisingly, students are more likely to be employed and less likely to be unemployed or in further study 3.5 years after graduation compared with just six months after graduation.
Employment Further study Unemployment
0%
10%
20%
30%
40%
50%
60%
70%
80%
Mathematics Operational Research Statistics
Source: HESA Early DLHE 2012/13 (TBR ref: W3/S6)
Figure 30: Activity six months after graduation from Masters degrees by subject, 2012/13
Employment Further study Unemployment
0%
10%
20%
30%
40%
50%
60%
70%
80%
90%
2004/05 2006/07 2008/09
Year of graduation
Source: HESA Longitudinal DLHE (TBR ref: W3/S15)
Figure 31: Activity 3.5 years after graduation
LMS-BTL-70_ReportFINAL.pdf 39 25/09/2015 10:26
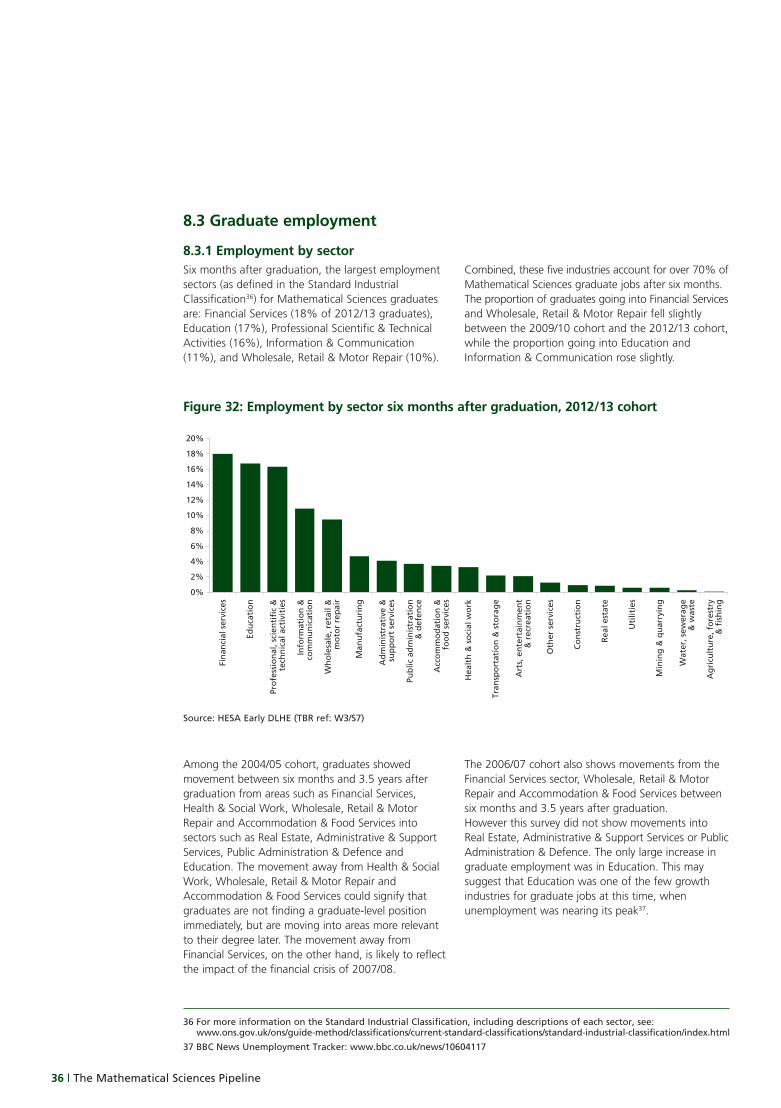
36 | The Mathematical Sciences Pipeline
36 For more information on the Standard Industrial Classification, including descriptions of each sector, see: www.ons.gov.uk/ons/guide-method/classifications/current-standard-classifications/standard-industrial-classification/index.html
37 BBC News Unemployment Tracker: www.bbc.co.uk/news/10604117
Among the 2004/05 cohort, graduates showed movement between six months and 3.5 years after graduation from areas such as Financial Services, Health & Social Work, Wholesale, Retail & Motor Repair and Accommodation & Food Services into sectors such as Real Estate, Administrative & Support Services, Public Administration & Defence and Education. The movement away from Health & Social Work, Wholesale, Retail & Motor Repair and Accommodation & Food Services could signify that graduates are not finding a graduate-level position immediately, but are moving into areas more relevant to their degree later. The movement away from Financial Services, on the other hand, is likely to reflect the impact of the financial crisis of 2007/08.
The 2006/07 cohort also shows movements from the Financial Services sector, Wholesale, Retail & Motor Repair and Accommodation & Food Services between six months and 3.5 years after graduation. However this survey did not show movements into Real Estate, Administrative & Support Services or Public Administration & Defence. The only large increase in graduate employment was in Education. This may suggest that Education was one of the few growth industries for graduate jobs at this time, when unemployment was nearing its peak37.
8.3 Graduate employment
8.3.1 Employment by sectorSix months after graduation, the largest employment sectors (as defined in the Standard Industrial Classification36) for Mathematical Sciences graduates are: Financial Services (18% of 2012/13 graduates), Education (17%), Professional Scientific & Technical Activities (16%), Information & Communication (11%), and Wholesale, Retail & Motor Repair (10%).
Combined, these five industries account for over 70% of Mathematical Sciences graduate jobs after six months. The proportion of graduates going into Financial Services and Wholesale, Retail & Motor Repair fell slightly between the 2009/10 cohort and the 2012/13 cohort, while the proportion going into Education and Information & Communication rose slightly.
0%
2%
4%
6%
8%
10%
12%
14%
16%
18%
20%
Fin
anci
al s
ervi
ces
Edu
cati
on
Pro
fess
ion
al, s
cien
tifi
c &
tech
nic
al a
ctiv
itie
s
Info
rmat
ion
&co
mm
un
icat
ion
Wh
ole
sale
, ret
ail &
mo
tor
rep
air
Man
ufa
ctu
rin
g
Ad
min
istr
ativ
e &
sup
po
rt s
ervi
ces
Pub
lic a
dm
inis
trat
ion
& d
efen
ce
Acc
om
mo
dat
ion
&fo
od
ser
vice
s
Hea
lth
& s
oci
al w
ork
Tran
spo
rtat
ion
& s
tora
ge
Art
s, e
nte
rtai
nm
ent
& r
ecre
atio
n
Oth
er s
ervi
ces
Co
nst
ruct
ion
Rea
l est
ate
Uti
litie
s
Min
ing
& q
uar
ryin
g
Wat
er, s
ewer
age
& w
aste
Ag
ricu
ltu
re, f
ore
stry
& fi
shin
gSource: HESA Early DLHE (TBR ref: W3/S7)
Figure 32: Employment by sector six months after graduation, 2012/13 cohort
LMS-BTL-70_ReportFINAL.pdf 40 25/09/2015 10:26
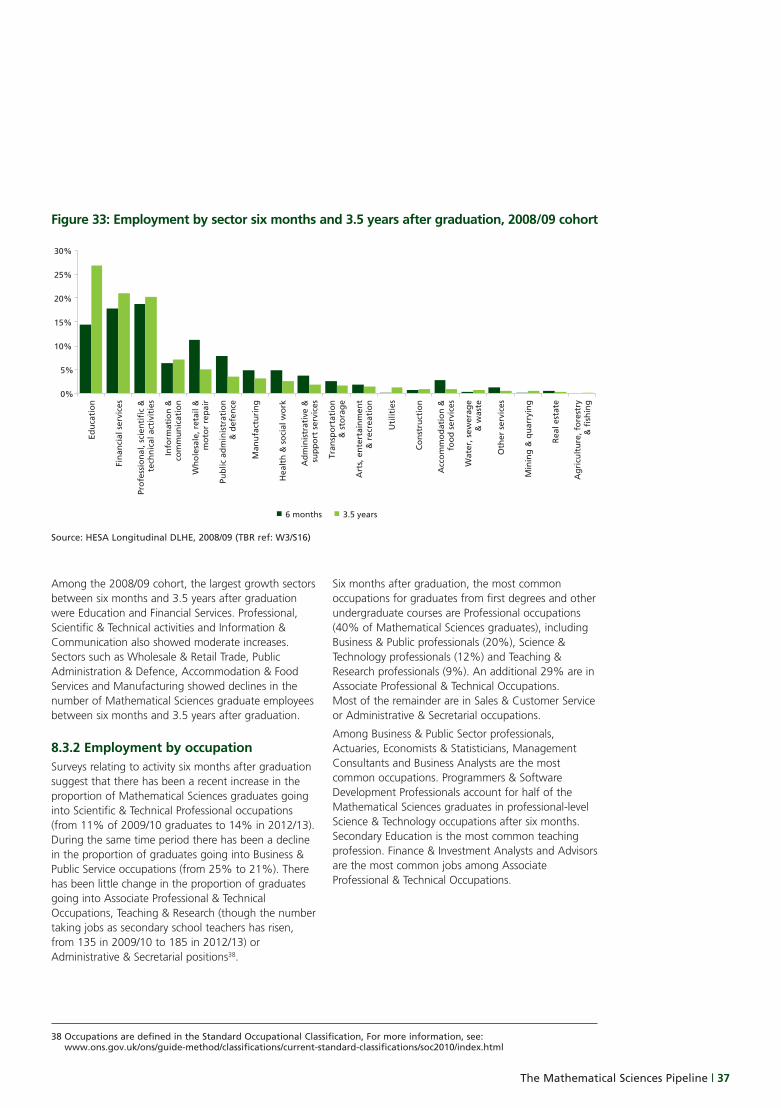
The Mathematical Sciences Pipeline | 37
Among the 2008/09 cohort, the largest growth sectors between six months and 3.5 years after graduation were Education and Financial Services. Professional, Scientific & Technical activities and Information & Communication also showed moderate increases. Sectors such as Wholesale & Retail Trade, Public Administration & Defence, Accommodation & Food Services and Manufacturing showed declines in the number of Mathematical Sciences graduate employees between six months and 3.5 years after graduation.
8.3.2 Employment by occupationSurveys relating to activity six months after graduation suggest that there has been a recent increase in the proportion of Mathematical Sciences graduates going into Scientific & Technical Professional occupations (from 11% of 2009/10 graduates to 14% in 2012/13). During the same time period there has been a decline in the proportion of graduates going into Business & Public Service occupations (from 25% to 21%). There has been little change in the proportion of graduates going into Associate Professional & Technical Occupations, Teaching & Research (though the number taking jobs as secondary school teachers has risen, from 135 in 2009/10 to 185 in 2012/13) or Administrative & Secretarial positions38.
Six months after graduation, the most common occupations for graduates from first degrees and other undergraduate courses are Professional occupations (40% of Mathematical Sciences graduates), including Business & Public professionals (20%), Science & Technology professionals (12%) and Teaching & Research professionals (9%). An additional 29% are in Associate Professional & Technical Occupations. Most of the remainder are in Sales & Customer Service or Administrative & Secretarial occupations.
Among Business & Public Sector professionals, Actuaries, Economists & Statisticians, Management Consultants and Business Analysts are the most common occupations. Programmers & Software Development Professionals account for half of the Mathematical Sciences graduates in professional-level Science & Technology occupations after six months. Secondary Education is the most common teaching profession. Finance & Investment Analysts and Advisors are the most common jobs among Associate Professional & Technical Occupations.
0%
5%
10%
15%
20%
25%
30%
Edu
cati
on
Fin
anci
al s
ervi
ces
Pro
fess
ion
al, s
cien
tifi
c &
tech
nic
al a
ctiv
itie
s
Info
rmat
ion
&co
mm
un
icat
ion
Wh
ole
sale
, ret
ail &
mo
tor
rep
air
Pub
lic a
dm
inis
trat
ion
& d
efen
ce
Man
ufa
ctu
rin
g
Hea
lth
& s
oci
al w
ork
Ad
min
istr
ativ
e &
sup
po
rt s
ervi
ces
Tran
spo
rtat
ion
& s
tora
ge
Art
s, e
nte
rtai
nm
ent
& r
ecre
atio
n
Uti
litie
s
Co
nst
ruct
ion
Acc
om
mo
dat
ion
&fo
od
ser
vice
s
Wat
er, s
ewer
age
& w
aste
Oth
er s
ervi
ces
Min
ing
& q
uar
ryin
g
Rea
l est
ate
Ag
ricu
ltu
re, f
ore
stry
& fi
shin
g
6 months 3.5 years
Source: HESA Longitudinal DLHE, 2008/09 (TBR ref: W3/S16)
Figure 33: Employment by sector six months and 3.5 years after graduation, 2008/09 cohort
38 Occupations are defined in the Standard Occupational Classification, For more information, see: www.ons.gov.uk/ons/guide-method/classifications/current-standard-classifications/soc2010/index.html
LMS-BTL-70_ReportFINAL.pdf 41 25/09/2015 10:26
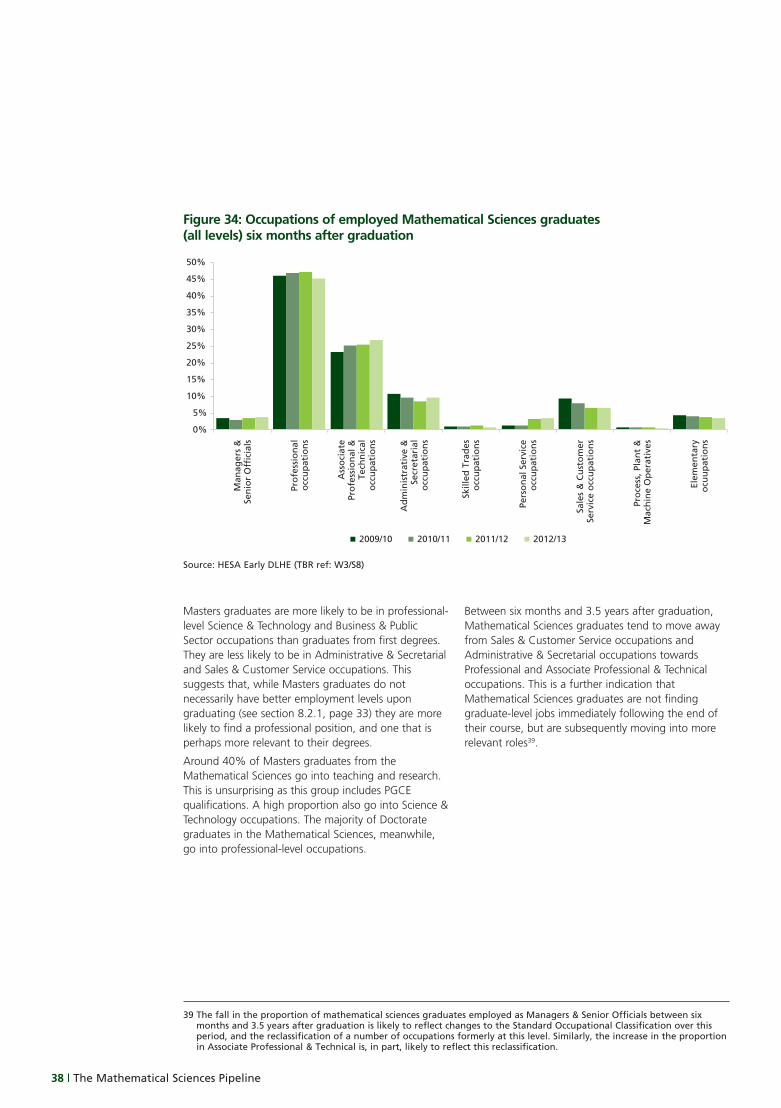
38 | The Mathematical Sciences Pipeline
Masters graduates are more likely to be in professional-level Science & Technology and Business & Public Sector occupations than graduates from first degrees. They are less likely to be in Administrative & Secretarial and Sales & Customer Service occupations. This suggests that, while Masters graduates do not necessarily have better employment levels upon graduating (see section 8.2.1, page 33) they are more likely to find a professional position, and one that is perhaps more relevant to their degrees.
Around 40% of Masters graduates from the Mathematical Sciences go into teaching and research. This is unsurprising as this group includes PGCE qualifications. A high proportion also go into Science & Technology occupations. The majority of Doctorate graduates in the Mathematical Sciences, meanwhile, go into professional-level occupations.
Between six months and 3.5 years after graduation, Mathematical Sciences graduates tend to move away from Sales & Customer Service occupations and Administrative & Secretarial occupations towards Professional and Associate Professional & Technical occupations. This is a further indication that Mathematical Sciences graduates are not finding graduate-level jobs immediately following the end of their course, but are subsequently moving into more relevant roles39.
0%
5%
10%
15%
20%
25%
30%
35%
40%
45%
50%
Man
ager
s &
Sen
ior
Off
icia
ls
Pro
fess
ion
alo
ccu
pat
ion
s
Ass
oci
ate
Pro
fess
ion
al &
Tech
nic
alo
ccu
pat
ion
s
Ad
min
istr
ativ
e &
Secr
etar
ial
occ
up
atio
ns
Ski
lled
Tra
des
occ
up
atio
ns
Pers
on
al S
ervi
ceo
ccu
pat
ion
s
Sale
s &
Cu
sto
mer
Ser
vice
occ
up
atio
ns
Pro
cess
, Pla
nt
&M
ach
ine
Op
erat
ives
Elem
enta
ryo
cuu
pat
ion
s
2009/10 2010/11 2011/12 2012/13
Source: HESA Early DLHE (TBR ref: W3/S8)
Figure 34: Occupations of employed Mathematical Sciences graduates (all levels) six months after graduation
39 The fall in the proportion of mathematical sciences graduates employed as Managers & Senior Officials between six months and 3.5 years after graduation is likely to reflect changes to the Standard Occupational Classification over this period, and the reclassification of a number of occupations formerly at this level. Similarly, the increase in the proportion in Associate Professional & Technical is, in part, likely to reflect this reclassification.
LMS-BTL-70_ReportFINAL.pdf 42 25/09/2015 10:26
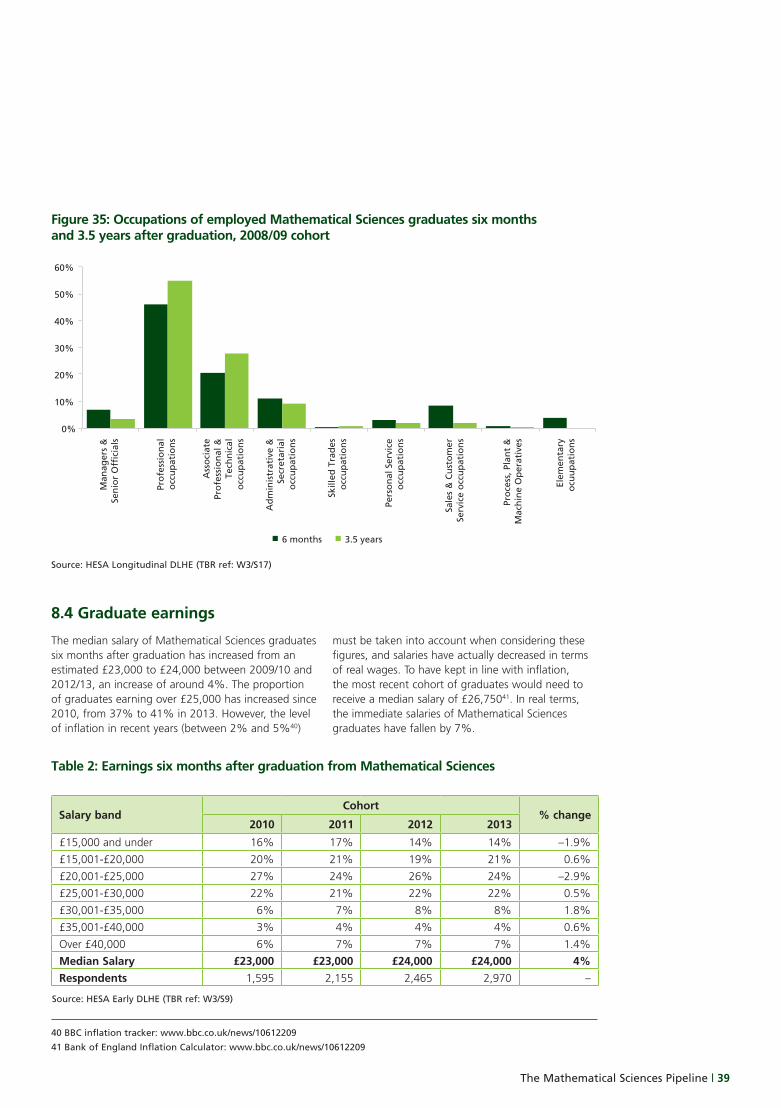
The Mathematical Sciences Pipeline | 39
8.4 Graduate earnings
The median salary of Mathematical Sciences graduates six months after graduation has increased from an estimated £23,000 to £24,000 between 2009/10 and 2012/13, an increase of around 4%. The proportion of graduates earning over £25,000 has increased since 2010, from 37% to 41% in 2013. However, the level of inflation in recent years (between 2% and 5%40)
must be taken into account when considering these figures, and salaries have actually decreased in terms of real wages. To have kept in line with inflation, the most recent cohort of graduates would need to receive a median salary of £26,75041. In real terms, the immediate salaries of Mathematical Sciences graduates have fallen by 7%.
6 months 3.5 years
0%
10%
20%
30%
40%
50%
60%
Man
ager
s &
Sen
ior
Off
icia
ls
Pro
fess
ion
alo
ccu
pat
ion
s
Ass
oci
ate
Pro
fess
ion
al &
Tech
nic
alo
ccu
pat
ion
s
Ad
min
istr
ativ
e &
Secr
etar
ial
occ
up
atio
ns
Ski
lled
Tra
des
occ
up
atio
ns
Pers
on
al S
ervi
ceo
ccu
pat
ion
s
Sale
s &
Cu
sto
mer
Serv
ice
occ
up
atio
ns
Pro
cess
, Pla
nt
&M
ach
ine
Op
erat
ives
Elem
enta
ryo
cuu
pat
ion
sSource: HESA Longitudinal DLHE (TBR ref: W3/S17)
Figure 35: Occupations of employed Mathematical Sciences graduates six months and 3.5 years after graduation, 2008/09 cohort
40 BBC inflation tracker: www.bbc.co.uk/news/10612209
41 Bank of England Inflation Calculator: www.bbc.co.uk/news/10612209
Salary bandCohort
% change2010 2011 2012 2013
£15,000 and under 16% 17% 14% 14% –1.9%
£15,001-£20,000 20% 21% 19% 21% 0.6%
£20,001-£25,000 27% 24% 26% 24% –2.9%
£25,001-£30,000 22% 21% 22% 22% 0.5%
£30,001-£35,000 6% 7% 8% 8% 1.8%
£35,001-£40,000 3% 4% 4% 4% 0.6%
Over £40,000 6% 7% 7% 7% 1.4%
Median Salary £23,000 £23,000 £24,000 £24,000 4%Respondents 1,595 2,155 2,465 2,970 –
Table 2: Earnings six months after graduation from Mathematical Sciences
Source: HESA Early DLHE (TBR ref: W3/S9)
LMS-BTL-70_ReportFINAL.pdf 43 25/09/2015 10:26
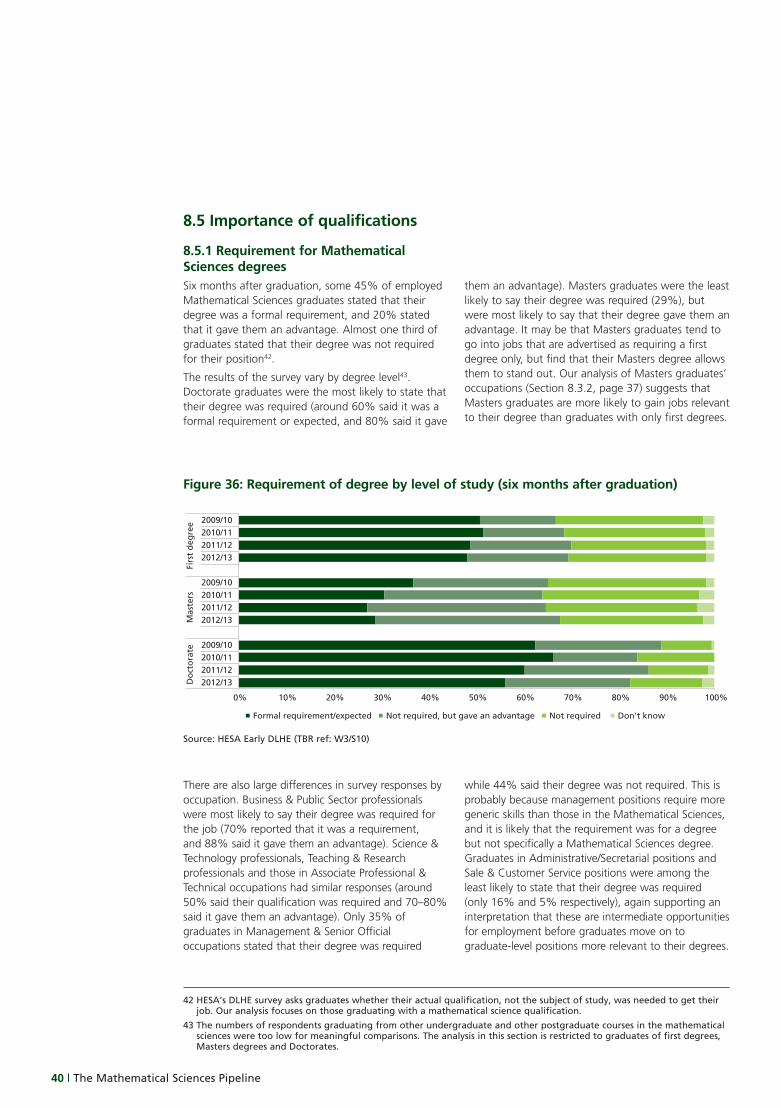
40 | The Mathematical Sciences Pipeline
42 HESA’s DLHE survey asks graduates whether their actual qualification, not the subject of study, was needed to get their job. Our analysis focuses on those graduating with a mathematical science qualification.
43 The numbers of respondents graduating from other undergraduate and other postgraduate courses in the mathematical sciences were too low for meaningful comparisons. The analysis in this section is restricted to graduates of first degrees, Masters degrees and Doctorates.
There are also large differences in survey responses by occupation. Business & Public Sector professionals were most likely to say their degree was required for the job (70% reported that it was a requirement, and 88% said it gave them an advantage). Science & Technology professionals, Teaching & Research professionals and those in Associate Professional & Technical occupations had similar responses (around 50% said their qualification was required and 70–80% said it gave them an advantage). Only 35% of graduates in Management & Senior Official occupations stated that their degree was required
while 44% said their degree was not required. This is probably because management positions require more generic skills than those in the Mathematical Sciences, and it is likely that the requirement was for a degree but not specifically a Mathematical Sciences degree. Graduates in Administrative/Secretarial positions and Sale & Customer Service positions were among the least likely to state that their degree was required (only 16% and 5% respectively), again supporting an interpretation that these are intermediate opportunities for employment before graduates move on to graduate-level positions more relevant to their degrees.
8.5 Importance of qualifications
8.5.1 Requirement for Mathematical Sciences degreesSix months after graduation, some 45% of employed Mathematical Sciences graduates stated that their degree was a formal requirement, and 20% stated that it gave them an advantage. Almost one third of graduates stated that their degree was not required for their position42.
The results of the survey vary by degree level43. Doctorate graduates were the most likely to state that their degree was required (around 60% said it was a formal requirement or expected, and 80% said it gave
them an advantage). Masters graduates were the least likely to say their degree was required (29%), but were most likely to say that their degree gave them an advantage. It may be that Masters graduates tend to go into jobs that are advertised as requiring a first degree only, but find that their Masters degree allows them to stand out. Our analysis of Masters graduates’ occupations (Section 8.3.2, page 37) suggests that Masters graduates are more likely to gain jobs relevant to their degree than graduates with only first degrees.
0% 10% 20% 30% 40% 50% 60% 70% 80% 90% 100%
2009/102010/112011/122012/13
2009/102010/112011/122012/13
2009/102010/112011/122012/13
Firs
t d
egre
eM
aste
rsD
oct
ora
te
Formal requirement/expected Not required, but gave an advantage Not required Don't know
Source: HESA Early DLHE (TBR ref: W3/S10)
Figure 36: Requirement of degree by level of study (six months after graduation)
LMS-BTL-70_ReportFINAL.pdf 44 25/09/2015 10:26
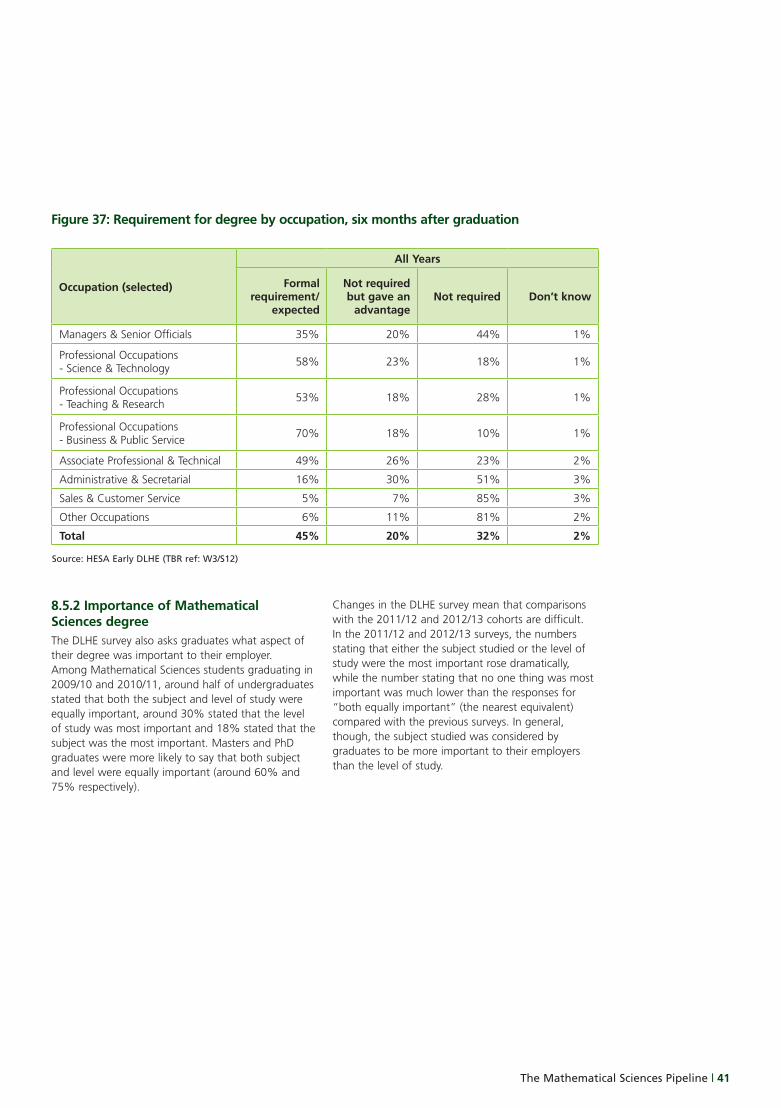
The Mathematical Sciences Pipeline | 41
Occupation (selected)
All Years
Formal requirement/
expected
Not required but gave an
advantageNot required Don’t know
Managers & Senior Officials 35% 20% 44% 1%
Professional Occupations - Science & Technology 58% 23% 18% 1%
Professional Occupations - Teaching & Research 53% 18% 28% 1%
Professional Occupations - Business & Public Service 70% 18% 10% 1%
Associate Professional & Technical 49% 26% 23% 2%
Administrative & Secretarial 16% 30% 51% 3%
Sales & Customer Service 5% 7% 85% 3%
Other Occupations 6% 11% 81% 2%
Total 45% 20% 32% 2%
Figure 37: Requirement for degree by occupation, six months after graduation
Source: HESA Early DLHE (TBR ref: W3/S12)
8.5.2 Importance of Mathematical Sciences degreeThe DLHE survey also asks graduates what aspect of their degree was important to their employer. Among Mathematical Sciences students graduating in 2009/10 and 2010/11, around half of undergraduates stated that both the subject and level of study were equally important, around 30% stated that the level of study was most important and 18% stated that the subject was the most important. Masters and PhD graduates were more likely to say that both subject and level were equally important (around 60% and 75% respectively).
Changes in the DLHE survey mean that comparisons with the 2011/12 and 2012/13 cohorts are difficult. In the 2011/12 and 2012/13 surveys, the numbers stating that either the subject studied or the level of study were the most important rose dramatically, while the number stating that no one thing was most important was much lower than the responses for “both equally important” (the nearest equivalent) compared with the previous surveys. In general, though, the subject studied was considered by graduates to be more important to their employers than the level of study.
LMS-BTL-70_ReportFINAL.pdf 45 25/09/2015 10:26
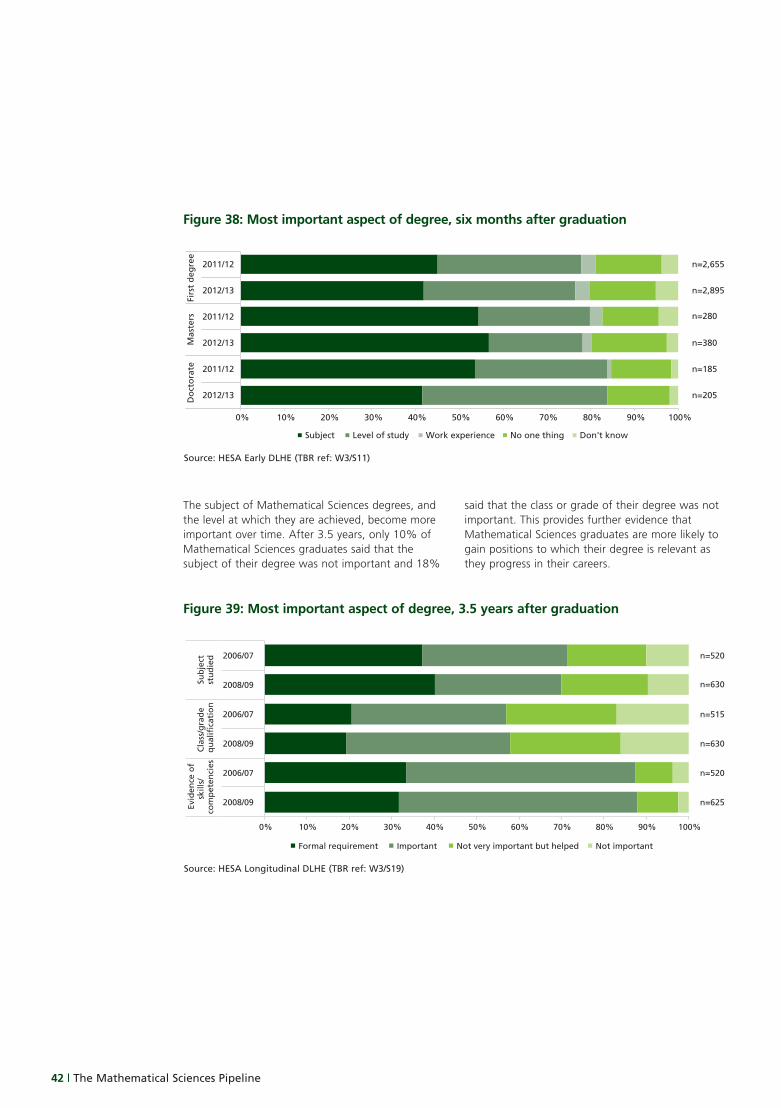
42 | The Mathematical Sciences Pipeline
The subject of Mathematical Sciences degrees, and the level at which they are achieved, become more important over time. After 3.5 years, only 10% of Mathematical Sciences graduates said that the subject of their degree was not important and 18%
said that the class or grade of their degree was not important. This provides further evidence that Mathematical Sciences graduates are more likely to gain positions to which their degree is relevant as they progress in their careers.
n=2,655
n=2,895
n=280
n=380
n=185
n=205
0% 10% 20% 30% 40% 50% 60% 70% 80% 90% 100%
2011/12
2012/13
2011/12
2012/13
2011/12
2012/13
Firs
t d
egre
eM
aste
rsD
oct
ora
te
Subject Level of study Work experience No one thing Don't know
Source: HESA Early DLHE (TBR ref: W3/S11)
Figure 38: Most important aspect of degree, six months after graduation
n=520
n=630
n=515
n=630
n=520
n=625
0% 10% 20% 30% 40% 50% 60% 70% 80% 90% 100%
2006/07
2008/09
2006/07
2008/09
2006/07
2008/09
Sub
ject
st
ud
ied
Cla
ss/g
rad
e q
ual
ifica
tio
n
Evid
ence
of
skill
s/
com
pet
enci
es
Formal requirement Important Not very important but helped Not important
Source: HESA Longitudinal DLHE (TBR ref: W3/S19)
Figure 39: Most important aspect of degree, 3.5 years after graduation
LMS-BTL-70_ReportFINAL.pdf 46 25/09/2015 10:26
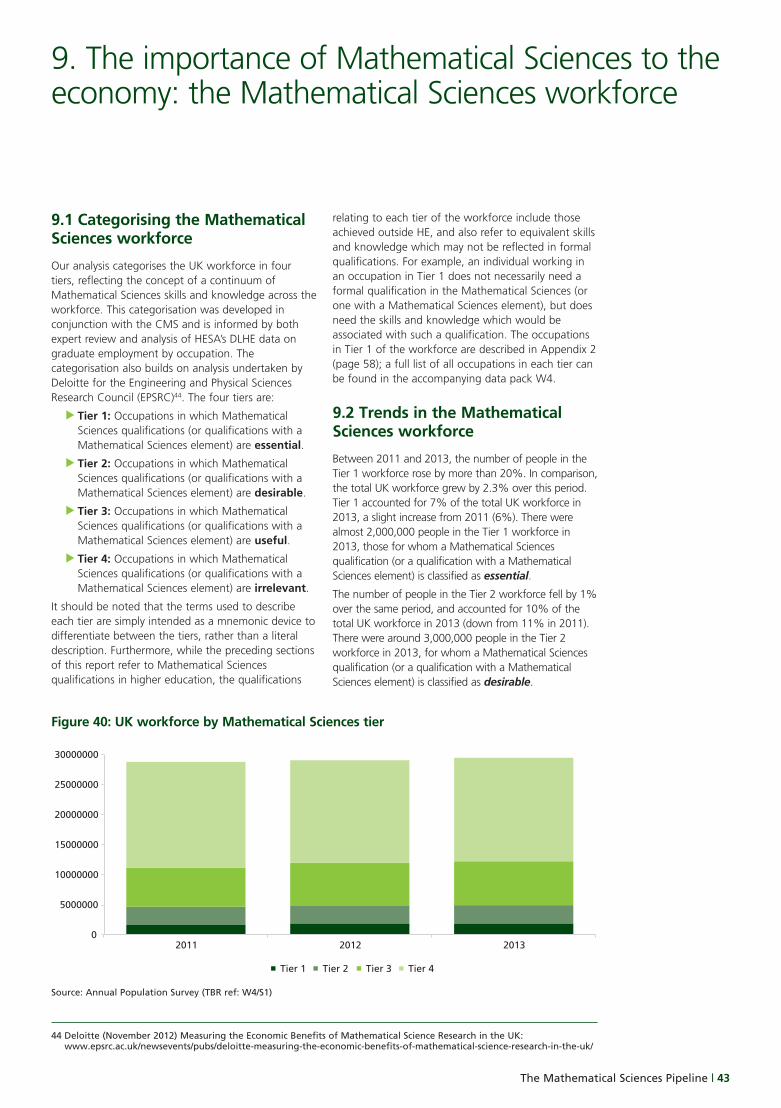
The Mathematical Sciences Pipeline | 43
44 Deloitte (November 2012) Measuring the Economic Benefits of Mathematical Science Research in the UK: www.epsrc.ac.uk/newsevents/pubs/deloitte-measuring-the-economic-benefits-of-mathematical-science-research-in-the-uk/
9.1 Categorising the Mathematical Sciences workforce
Our analysis categorises the UK workforce in four tiers, reflecting the concept of a continuum of Mathematical Sciences skills and knowledge across the workforce. This categorisation was developed in conjunction with the CMS and is informed by both expert review and analysis of HESA’s DLHE data on graduate employment by occupation. The categorisation also builds on analysis undertaken by Deloitte for the Engineering and Physical Sciences Research Council (EPSRC)44. The four tiers are:
Tier 1: Occupations in which Mathematical Sciences qualifications (or qualifications with a Mathematical Sciences element) are essential.
Tier 2: Occupations in which Mathematical Sciences qualifications (or qualifications with a Mathematical Sciences element) are desirable.
Tier 3: Occupations in which Mathematical Sciences qualifications (or qualifications with a Mathematical Sciences element) are useful.
Tier 4: Occupations in which Mathematical Sciences qualifications (or qualifications with a Mathematical Sciences element) are irrelevant.
It should be noted that the terms used to describe each tier are simply intended as a mnemonic device to differentiate between the tiers, rather than a literal description. Furthermore, while the preceding sections of this report refer to Mathematical Sciences qualifications in higher education, the qualifications
relating to each tier of the workforce include those achieved outside HE, and also refer to equivalent skills and knowledge which may not be reflected in formal qualifications. For example, an individual working in an occupation in Tier 1 does not necessarily need a formal qualification in the Mathematical Sciences (or one with a Mathematical Sciences element), but does need the skills and knowledge which would be associated with such a qualification. The occupations in Tier 1 of the workforce are described in Appendix 2 (page 58); a full list of all occupations in each tier can be found in the accompanying data pack W4.
9.2 Trends in the Mathematical Sciences workforce
Between 2011 and 2013, the number of people in the Tier 1 workforce rose by more than 20%. In comparison, the total UK workforce grew by 2.3% over this period. Tier 1 accounted for 7% of the total UK workforce in 2013, a slight increase from 2011 (6%). There were almost 2,000,000 people in the Tier 1 workforce in 2013, those for whom a Mathematical Sciences qualification (or a qualification with a Mathematical Sciences element) is classified as essential.
The number of people in the Tier 2 workforce fell by 1% over the same period, and accounted for 10% of the total UK workforce in 2013 (down from 11% in 2011). There were around 3,000,000 people in the Tier 2 workforce in 2013, for whom a Mathematical Sciences qualification (or a qualification with a Mathematical Sciences element) is classified as desirable.
9. The importance of Mathematical Sciences to the economy: the Mathematical Sciences workforce
0
5000000
10000000
15000000
20000000
25000000
30000000
201320122011
Tier 1 Tier 2 Tier 3 Tier 4
Source: Annual Population Survey (TBR ref: W4/S1)
Figure 40: UK workforce by Mathematical Sciences tier
LMS-BTL-70_ReportFINAL.pdf 47 25/09/2015 10:26
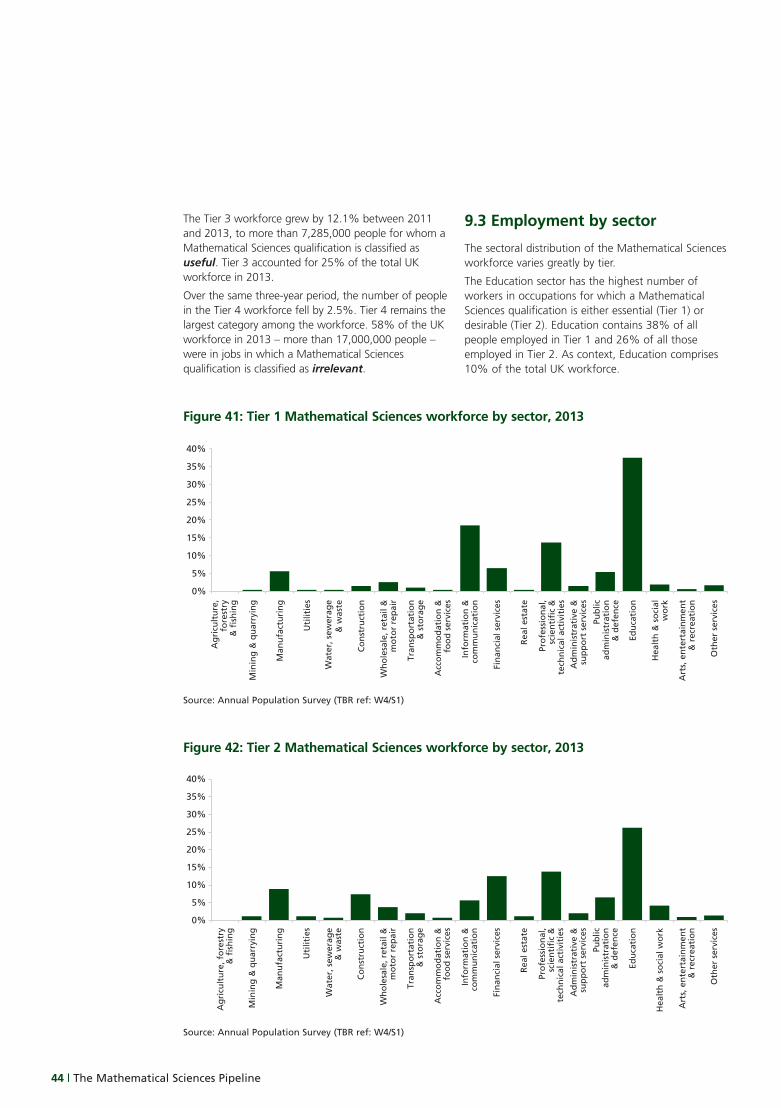
44 | The Mathematical Sciences Pipeline
The Tier 3 workforce grew by 12.1% between 2011 and 2013, to more than 7,285,000 people for whom a Mathematical Sciences qualification is classified as useful. Tier 3 accounted for 25% of the total UK workforce in 2013.
Over the same three-year period, the number of people in the Tier 4 workforce fell by 2.5%. Tier 4 remains the largest category among the workforce. 58% of the UK workforce in 2013 – more than 17,000,000 people – were in jobs in which a Mathematical Sciences qualification is classified as irrelevant.
9.3 Employment by sector
The sectoral distribution of the Mathematical Sciences workforce varies greatly by tier.
The Education sector has the highest number of workers in occupations for which a Mathematical Sciences qualification is either essential (Tier 1) or desirable (Tier 2). Education contains 38% of all people employed in Tier 1 and 26% of all those employed in Tier 2. As context, Education comprises 10% of the total UK workforce.
0%
5%
10%
15%
20%
25%
30%
35%
40%
Ag
ricu
ltu
re,
fore
stry
& fi
shin
g
Min
ing
& q
uar
ryin
g
Man
ufa
ctu
rin
g
Uti
litie
s
Wat
er, s
ewer
age
& w
aste
Co
nst
ruct
ion
Wh
ole
sale
, ret
ail &
mo
tor
rep
air
Tran
spo
rtat
ion
& s
tora
ge
Acc
om
mo
dat
ion
&fo
od
ser
vice
s
Info
rmat
ion
&co
mm
un
icat
ion
Fin
anci
al s
ervi
ces
Rea
l est
ate
Pro
fess
ion
al,
scie
nti
fic
&te
chn
ical
act
ivit
ies
Ad
min
istr
ativ
e &
sup
po
rt s
ervi
ces
Pub
licad
min
istr
atio
n&
def
ence
Edu
cati
on
Hea
lth
& s
oci
alw
ork
Art
s, e
nte
rtai
nm
ent
& r
ecre
atio
n
Oth
er s
ervi
ces
Source: Annual Population Survey (TBR ref: W4/S1)
Figure 41: Tier 1 Mathematical Sciences workforce by sector, 2013
0%
5%
10%
15%
20%
25%
30%
35%
40%
Ag
ricu
ltu
re, f
ore
stry
& fi
shin
g
Min
ing
& q
uar
ryin
g
Man
ufa
ctu
rin
g
Uti
litie
s
Wat
er, s
ewer
age
& w
aste
Co
nst
ruct
ion
Wh
ole
sale
, ret
ail &
mo
tor
rep
air
Tran
spo
rtat
ion
& s
tora
ge
Acc
om
mo
dat
ion
&fo
od
ser
vice
s
Info
rmat
ion
&co
mm
un
icat
ion
Fin
anci
al s
ervi
ces
Rea
l est
ate
Pro
fess
ion
al,
scie
nti
fic
&te
chn
ical
act
ivit
ies
Ad
min
istr
ativ
e &
sup
po
rt s
ervi
ces
Pub
licad
min
istr
atio
n&
def
ence
Edu
cati
on
Hea
lth
& s
oci
al w
ork
Art
s, e
nte
rtai
nm
ent
& r
ecre
atio
n
Oth
er s
ervi
ces
Source: Annual Population Survey (TBR ref: W4/S1)
Figure 42: Tier 2 Mathematical Sciences workforce by sector, 2013
LMS-BTL-70_ReportFINAL.pdf 48 25/09/2015 10:26
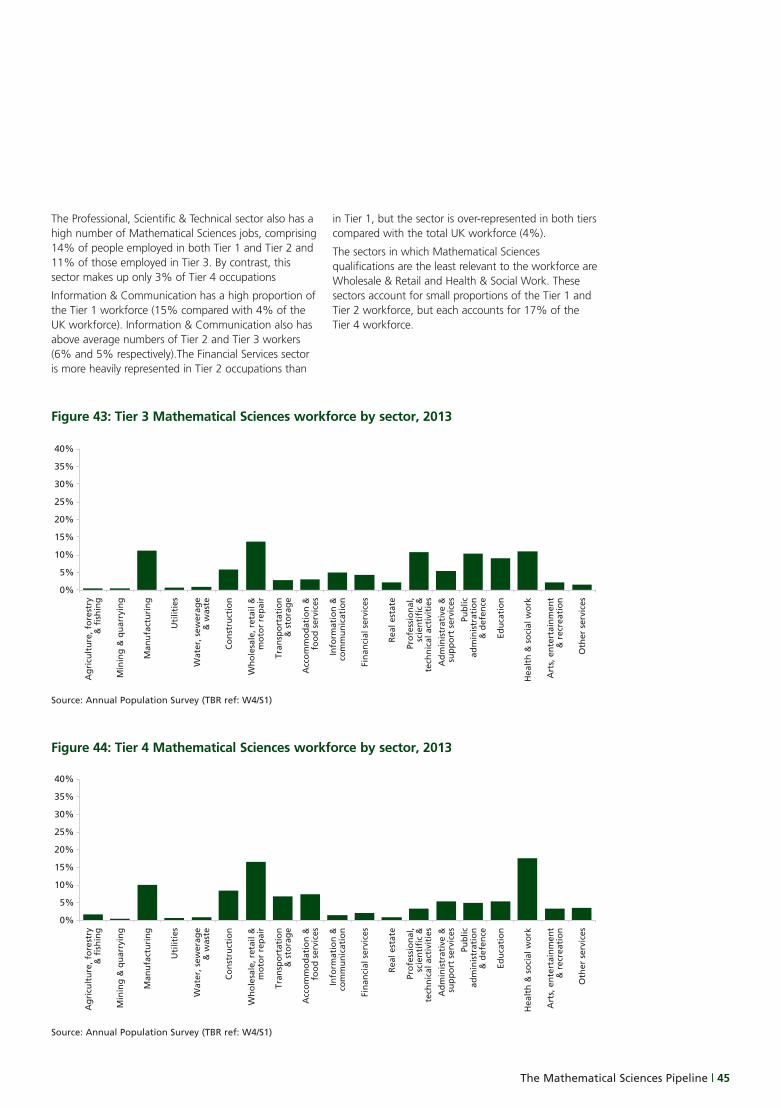
The Mathematical Sciences Pipeline | 45
The Professional, Scientific & Technical sector also has a high number of Mathematical Sciences jobs, comprising 14% of people employed in both Tier 1 and Tier 2 and 11% of those employed in Tier 3. By contrast, this sector makes up only 3% of Tier 4 occupations
Information & Communication has a high proportion of the Tier 1 workforce (15% compared with 4% of the UK workforce). Information & Communication also has above average numbers of Tier 2 and Tier 3 workers (6% and 5% respectively).The Financial Services sector is more heavily represented in Tier 2 occupations than
in Tier 1, but the sector is over-represented in both tiers compared with the total UK workforce (4%).
The sectors in which Mathematical Sciences qualifications are the least relevant to the workforce are Wholesale & Retail and Health & Social Work. These sectors account for small proportions of the Tier 1 and Tier 2 workforce, but each accounts for 17% of the Tier 4 workforce.
0%
5%
10%
15%
20%
25%
30%
35%
40%
Ag
ricu
ltu
re, f
ore
stry
& fi
shin
g
Min
ing
& q
uar
ryin
g
Man
ufa
ctu
rin
g
Uti
litie
s
Wat
er, s
ewer
age
& w
aste
Co
nst
ruct
ion
Wh
ole
sale
, ret
ail &
mo
tor
rep
air
Tran
spo
rtat
ion
& s
tora
ge
Acc
om
mo
dat
ion
&fo
od
ser
vice
s
Info
rmat
ion
&co
mm
un
icat
ion
Fin
anci
al s
ervi
ces
Rea
l est
ate
Pro
fess
ion
al,
scie
nti
fic
&te
chn
ical
act
ivit
ies
Ad
min
istr
ativ
e &
sup
po
rt s
ervi
ces
Pub
licad
min
istr
atio
n&
def
ence
Edu
cati
on
Hea
lth
& s
oci
al w
ork
Art
s, e
nte
rtai
nm
ent
& r
ecre
atio
n
Oth
er s
ervi
ces
Source: Annual Population Survey (TBR ref: W4/S1)
Figure 43: Tier 3 Mathematical Sciences workforce by sector, 2013
0%
5%
10%
15%
20%
25%
30%
35%
40%
Ag
ricu
ltu
re, f
ore
stry
& fi
shin
g
Min
ing
& q
uar
ryin
g
Man
ufa
ctu
rin
g
Uti
litie
s
Wat
er, s
ewer
age
& w
aste
Co
nst
ruct
ion
Wh
ole
sale
, ret
ail &
mo
tor
rep
air
Tran
spo
rtat
ion
& s
tora
ge
Acc
om
mo
dat
ion
&fo
od
ser
vice
s
Info
rmat
ion
&co
mm
un
icat
ion
Fin
anci
al s
ervi
ces
Rea
l est
ate
Pro
fess
ion
al,
scie
nti
fic
&te
chn
ical
act
ivit
ies
Ad
min
istr
ativ
e &
sup
po
rt s
ervi
ces
Pub
licad
min
istr
atio
n&
def
ence
Edu
cati
on
Hea
lth
& s
oci
al w
ork
Art
s, e
nte
rtai
nm
ent
& r
ecre
atio
n
Oth
er s
ervi
ces
Source: Annual Population Survey (TBR ref: W4/S1)
Figure 44: Tier 4 Mathematical Sciences workforce by sector, 2013
LMS-BTL-70_ReportFINAL.pdf 49 25/09/2015 10:26
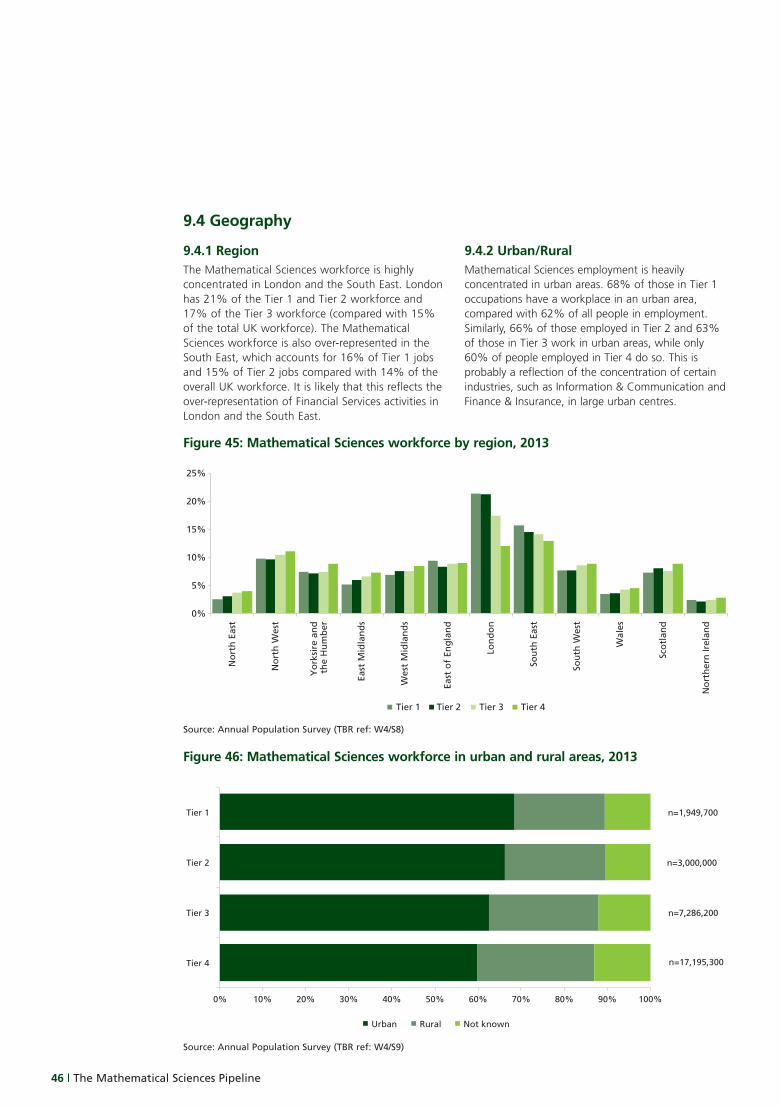
46 | The Mathematical Sciences Pipeline
9.4 Geography
9.4.1 RegionThe Mathematical Sciences workforce is highly concentrated in London and the South East. London has 21% of the Tier 1 and Tier 2 workforce and 17% of the Tier 3 workforce (compared with 15% of the total UK workforce). The Mathematical Sciences workforce is also over-represented in the South East, which accounts for 16% of Tier 1 jobs and 15% of Tier 2 jobs compared with 14% of the overall UK workforce. It is likely that this reflects the over-representation of Financial Services activities in London and the South East.
9.4.2 Urban/RuralMathematical Sciences employment is heavily concentrated in urban areas. 68% of those in Tier 1 occupations have a workplace in an urban area, compared with 62% of all people in employment. Similarly, 66% of those employed in Tier 2 and 63% of those in Tier 3 work in urban areas, while only 60% of people employed in Tier 4 do so. This is probably a reflection of the concentration of certain industries, such as Information & Communication and Finance & Insurance, in large urban centres.
0%
5%
10%
15%
20%
25%
No
rth
Eas
t
No
rth
Wes
t
Yo
rksi
re a
nd
the
Hu
mb
er
East
Mid
lan
ds
Wes
t M
idla
nd
s
East
of
Eng
lan
d
Lon
do
n
Sou
th E
ast
Sou
th W
est
Wal
es
Sco
tlan
d
No
rth
ern
Irel
and
Tier 1 Tier 2 Tier 3 Tier 4
n=1,949,700
n=3,000,000
n=7,286,200
n=17,195,300
0% 10% 20% 30% 40% 50% 60% 70% 80% 90% 100%
Tier 1
Tier 2
Tier 3
Tier 4
Urban Rural Not known
Source: Annual Population Survey (TBR ref: W4/S8)
Source: Annual Population Survey (TBR ref: W4/S9)
Figure 45: Mathematical Sciences workforce by region, 2013
Figure 46: Mathematical Sciences workforce in urban and rural areas, 2013
LMS-BTL-70_ReportFINAL.pdf 50 25/09/2015 10:26
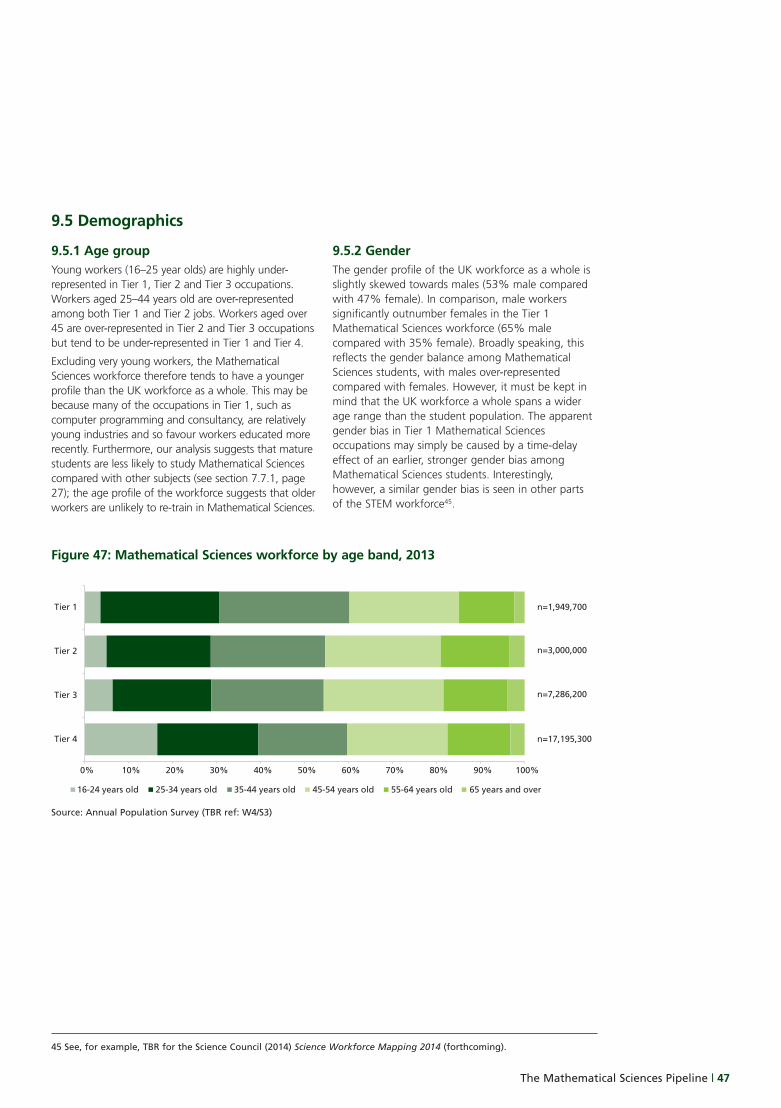
The Mathematical Sciences Pipeline | 47
9.5 Demographics
9.5.1 Age groupYoung workers (16–25 year olds) are highly under-represented in Tier 1, Tier 2 and Tier 3 occupations. Workers aged 25–44 years old are over-represented among both Tier 1 and Tier 2 jobs. Workers aged over 45 are over-represented in Tier 2 and Tier 3 occupations but tend to be under-represented in Tier 1 and Tier 4.
Excluding very young workers, the Mathematical Sciences workforce therefore tends to have a younger profile than the UK workforce as a whole. This may be because many of the occupations in Tier 1, such as computer programming and consultancy, are relatively young industries and so favour workers educated more recently. Furthermore, our analysis suggests that mature students are less likely to study Mathematical Sciences compared with other subjects (see section 7.7.1, page 27); the age profile of the workforce suggests that older workers are unlikely to re-train in Mathematical Sciences.
9.5.2 GenderThe gender profile of the UK workforce as a whole is slightly skewed towards males (53% male compared with 47% female). In comparison, male workers significantly outnumber females in the Tier 1 Mathematical Sciences workforce (65% male compared with 35% female). Broadly speaking, this reflects the gender balance among Mathematical Sciences students, with males over-represented compared with females. However, it must be kept in mind that the UK workforce a whole spans a wider age range than the student population. The apparent gender bias in Tier 1 Mathematical Sciences occupations may simply be caused by a time-delay effect of an earlier, stronger gender bias among Mathematical Sciences students. Interestingly, however, a similar gender bias is seen in other parts of the STEM workforce45.
45 See, for example, TBR for the Science Council (2014) Science Workforce Mapping 2014 (forthcoming).
n=1,949,700
n=3,000,000
n=7,286,200
n=17,195,300
0% 10% 20% 30% 40% 50% 60% 70% 80% 90% 100%
Tier 1
Tier 2
Tier 3
Tier 4
16-24 years old 25-34 years old 35-44 years old 45-54 years old 55-64 years old 65 years and over
Source: Annual Population Survey (TBR ref: W4/S3)
Figure 47: Mathematical Sciences workforce by age band, 2013
LMS-BTL-70_ReportFINAL.pdf 51 25/09/2015 10:26
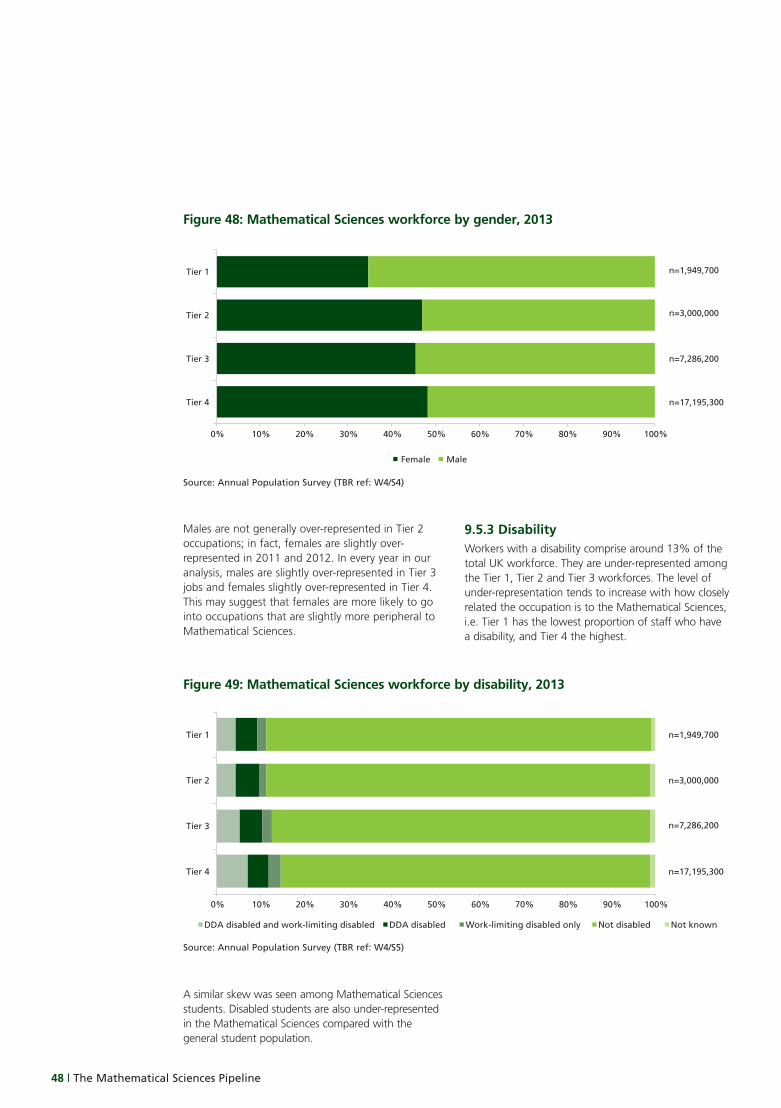
48 | The Mathematical Sciences Pipeline
n=1,949,700
n=3,000,000
n=7,286,200
n=17,195,300
0% 10% 20% 30% 40% 50% 60% 70% 80% 90% 100%
Tier 1
Tier 2
Tier 3
Tier 4
Female Male
Source: Annual Population Survey (TBR ref: W4/S4)
Figure 48: Mathematical Sciences workforce by gender, 2013
Males are not generally over-represented in Tier 2 occupations; in fact, females are slightly over-represented in 2011 and 2012. In every year in our analysis, males are slightly over-represented in Tier 3 jobs and females slightly over-represented in Tier 4. This may suggest that females are more likely to go into occupations that are slightly more peripheral to Mathematical Sciences.
9.5.3 DisabilityWorkers with a disability comprise around 13% of the total UK workforce. They are under-represented among the Tier 1, Tier 2 and Tier 3 workforces. The level of under-representation tends to increase with how closely related the occupation is to the Mathematical Sciences, i.e. Tier 1 has the lowest proportion of staff who have a disability, and Tier 4 the highest.
A similar skew was seen among Mathematical Sciences students. Disabled students are also under-represented in the Mathematical Sciences compared with the general student population.
n=1,949,700
n=3,000,000
n=7,286,200
n=17,195,300
0% 10% 20% 30% 40% 50% 60% 70% 80% 90% 100%
Tier 1
Tier 2
Tier 3
Tier 4
DDA disabled and work-limiting disabled DDA disabled Work-limiting disabled only Not disabled Not known
Source: Annual Population Survey (TBR ref: W4/S5)
Figure 49: Mathematical Sciences workforce by disability, 2013
LMS-BTL-70_ReportFINAL.pdf 52 25/09/2015 10:26
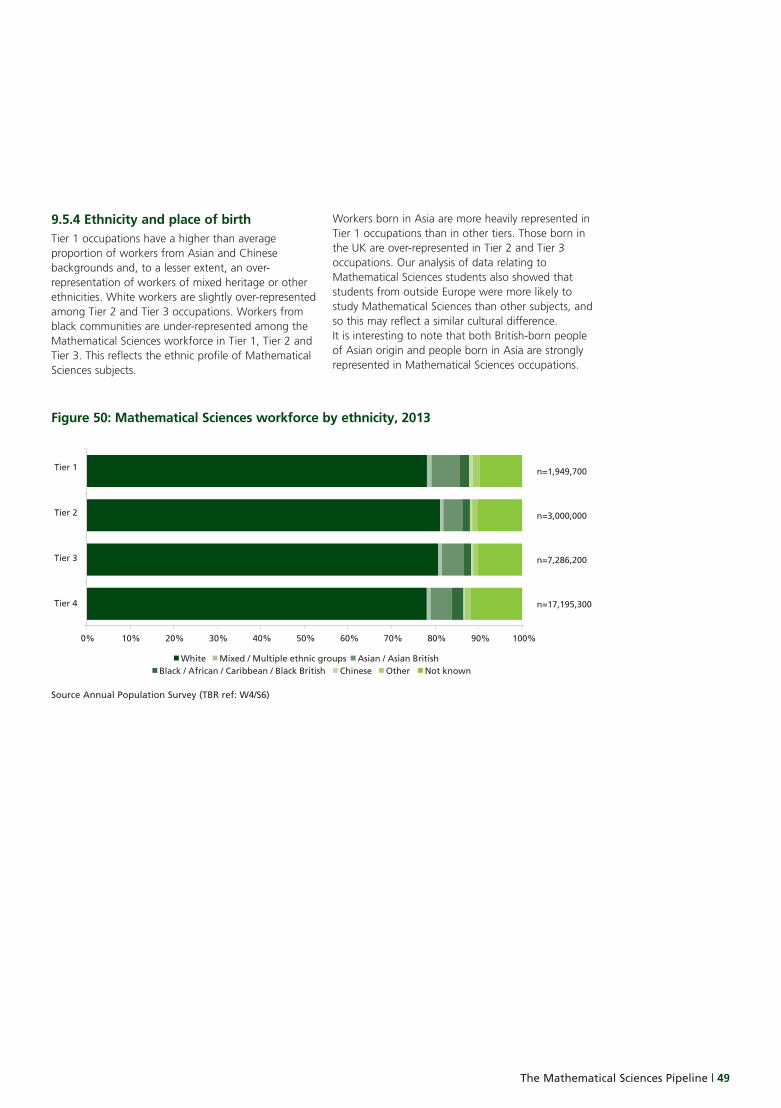
The Mathematical Sciences Pipeline | 49
9.5.4 Ethnicity and place of birthTier 1 occupations have a higher than average proportion of workers from Asian and Chinese backgrounds and, to a lesser extent, an over-representation of workers of mixed heritage or other ethnicities. White workers are slightly over-represented among Tier 2 and Tier 3 occupations. Workers from black communities are under-represented among the Mathematical Sciences workforce in Tier 1, Tier 2 and Tier 3. This reflects the ethnic profile of Mathematical Sciences subjects.
Workers born in Asia are more heavily represented in Tier 1 occupations than in other tiers. Those born in the UK are over-represented in Tier 2 and Tier 3 occupations. Our analysis of data relating to Mathematical Sciences students also showed that students from outside Europe were more likely to study Mathematical Sciences than other subjects, and so this may reflect a similar cultural difference. It is interesting to note that both British-born people of Asian origin and people born in Asia are strongly represented in Mathematical Sciences occupations.
0% 10% 20% 30% 40% 50% 60% 70% 80% 90% 100%
Tier 1
Tier 2
Tier 3
Tier 4
n=1,949,700
n=3,000,000
n=7,286,200
n=17,195,300
White Mixed / Multiple ethnic groups Asian / Asian BritishBlack / African / Caribbean / Black British Chinese Other Not known
Source Annual Population Survey (TBR ref: W4/S6)
Figure 50: Mathematical Sciences workforce by ethnicity, 2013
LMS-BTL-70_ReportFINAL.pdf 53 25/09/2015 10:26
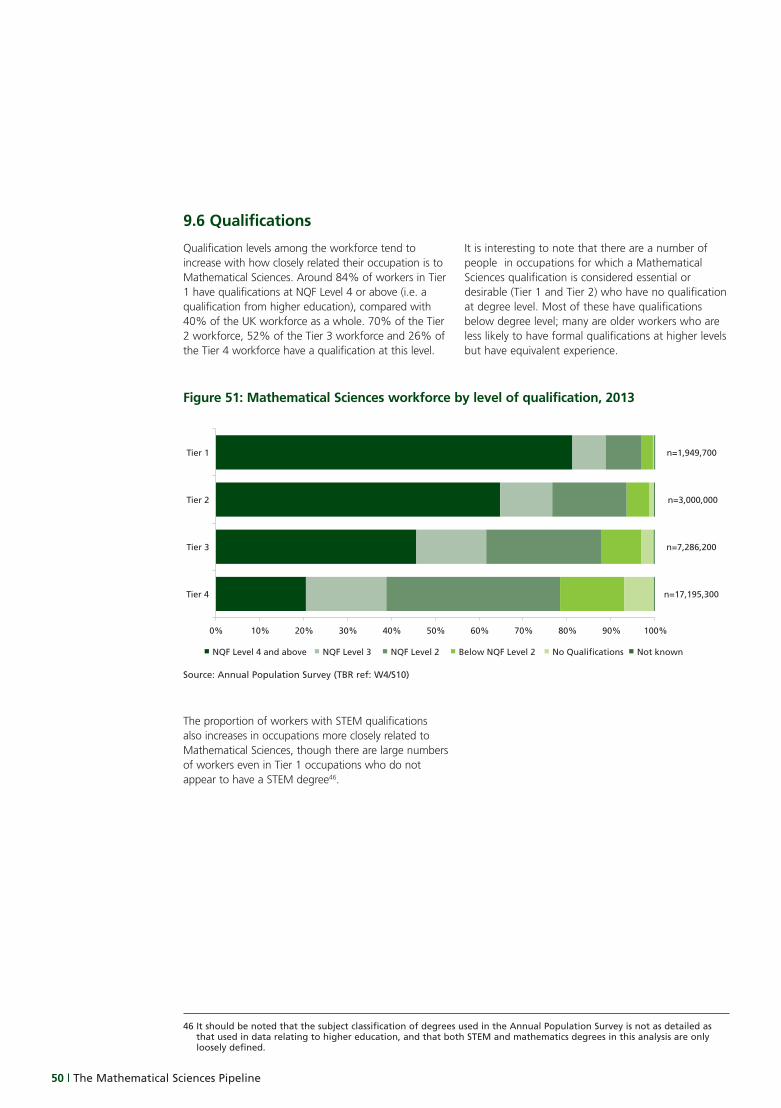
50 | The Mathematical Sciences Pipeline
9.6 Qualifications
Qualification levels among the workforce tend to increase with how closely related their occupation is to Mathematical Sciences. Around 84% of workers in Tier 1 have qualifications at NQF Level 4 or above (i.e. a qualification from higher education), compared with 40% of the UK workforce as a whole. 70% of the Tier 2 workforce, 52% of the Tier 3 workforce and 26% of the Tier 4 workforce have a qualification at this level.
It is interesting to note that there are a number of people in occupations for which a Mathematical Sciences qualification is considered essential or desirable (Tier 1 and Tier 2) who have no qualification at degree level. Most of these have qualifications below degree level; many are older workers who are less likely to have formal qualifications at higher levels but have equivalent experience.
n=1,949,700
n=3,000,000
n=7,286,200
n=17,195,300
0% 10% 20% 30% 40% 50% 60% 70% 80% 90% 100%
Tier 1
Tier 2
Tier 3
Tier 4
NQF Level 4 and above NQF Level 3 NQF Level 2 Below NQF Level 2 No Qualifications Not known
Source: Annual Population Survey (TBR ref: W4/S10)
Figure 51: Mathematical Sciences workforce by level of qualification, 2013
The proportion of workers with STEM qualifications also increases in occupations more closely related to Mathematical Sciences, though there are large numbers of workers even in Tier 1 occupations who do not appear to have a STEM degree46.
46 It should be noted that the subject classification of degrees used in the Annual Population Survey is not as detailed as that used in data relating to higher education, and that both STEM and mathematics degrees in this analysis are only loosely defined.
LMS-BTL-70_ReportFINAL.pdf 54 25/09/2015 10:26
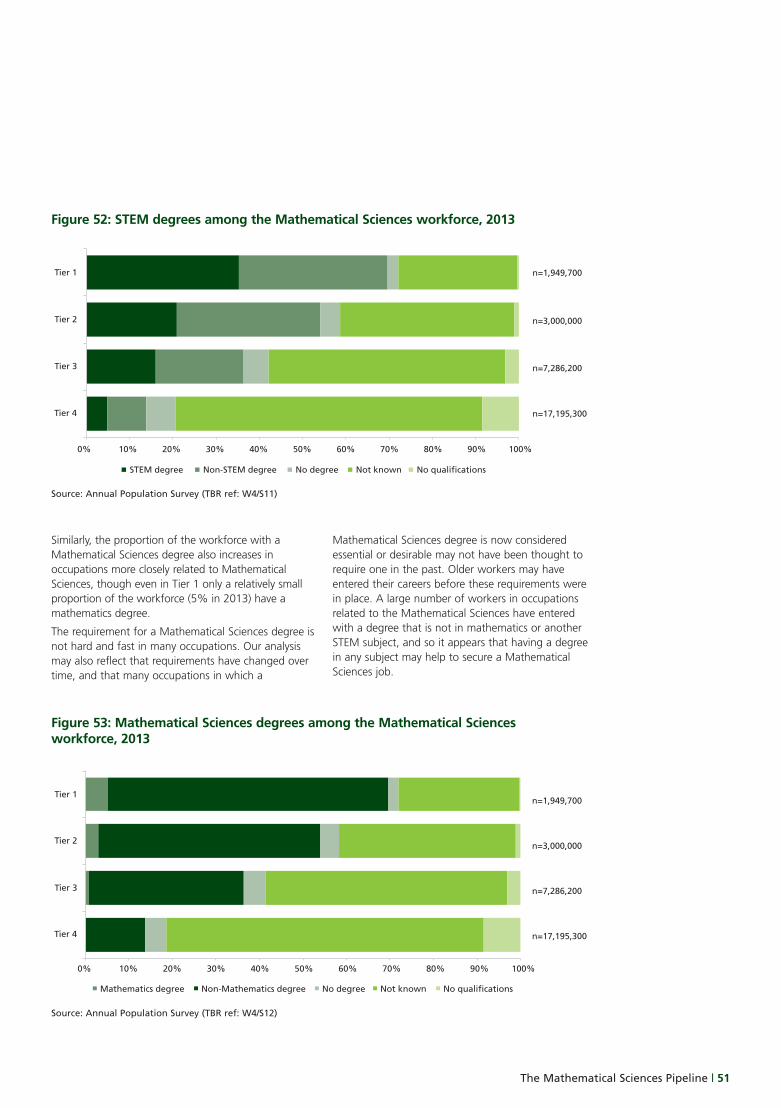
The Mathematical Sciences Pipeline | 51
0% 10% 20% 30% 40% 50% 60% 70% 80% 90% 100%
Tier 1
Tier 2
Tier 3
Tier 4
n=1,949,700
n=3,000,000
n=7,286,200
n=17,195,300
STEM degree Non-STEM degree No degree Not known No qualifications
Source: Annual Population Survey (TBR ref: W4/S11)
Figure 52: STEM degrees among the Mathematical Sciences workforce, 2013
Similarly, the proportion of the workforce with a Mathematical Sciences degree also increases in occupations more closely related to Mathematical Sciences, though even in Tier 1 only a relatively small proportion of the workforce (5% in 2013) have a mathematics degree.
The requirement for a Mathematical Sciences degree is not hard and fast in many occupations. Our analysis may also reflect that requirements have changed over time, and that many occupations in which a
Mathematical Sciences degree is now considered essential or desirable may not have been thought to require one in the past. Older workers may have entered their careers before these requirements were in place. A large number of workers in occupations related to the Mathematical Sciences have entered with a degree that is not in mathematics or another STEM subject, and so it appears that having a degree in any subject may help to secure a Mathematical Sciences job.
0% 10% 20% 30% 40% 50% 60% 70% 80% 90% 100%
Tier 1
Tier 2
Tier 3
Tier 4
n=1,949,700
n=3,000,000
n=7,286,200
n=17,195,300
Mathematics degree Non-Mathematics degree No degree Not known No qualifications
Source: Annual Population Survey (TBR ref: W4/S12)
Figure 53: Mathematical Sciences degrees among the Mathematical Sciences workforce, 2013
LMS-BTL-70_ReportFINAL.pdf 55 25/09/2015 10:26
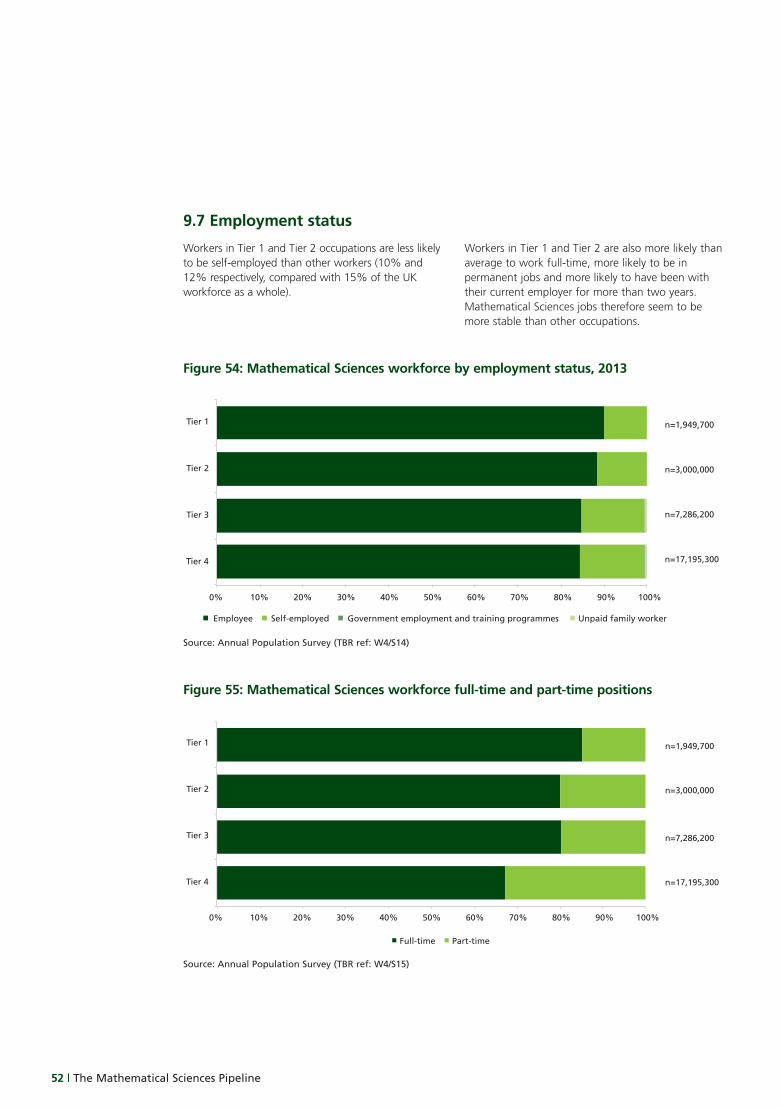
52 | The Mathematical Sciences Pipeline
9.7 Employment status
Workers in Tier 1 and Tier 2 occupations are less likely to be self-employed than other workers (10% and 12% respectively, compared with 15% of the UK workforce as a whole).
Workers in Tier 1 and Tier 2 are also more likely than average to work full-time, more likely to be in permanent jobs and more likely to have been with their current employer for more than two years. Mathematical Sciences jobs therefore seem to be more stable than other occupations.
0% 10% 20% 30% 40% 50% 60% 70% 80% 90% 100%
Tier 1
Tier 2
Tier 3
Tier 4
n=1,949,700
n=3,000,000
n=7,286,200
n=17,195,300
Employee Self-employed Government employment and training programmes Unpaid family worker
Source: Annual Population Survey (TBR ref: W4/S14)
Figure 54: Mathematical Sciences workforce by employment status, 2013
0% 10% 20% 30% 40% 50% 60% 70% 80% 90% 100%
Tier 1
Tier 2
Tier 3
Tier 4
n=1,949,700
n=3,000,000
n=7,286,200
n=17,195,300
Full-time Part-time
Source: Annual Population Survey (TBR ref: W4/S15)
Figure 55: Mathematical Sciences workforce full-time and part-time positions
LMS-BTL-70_ReportFINAL.pdf 56 25/09/2015 10:26
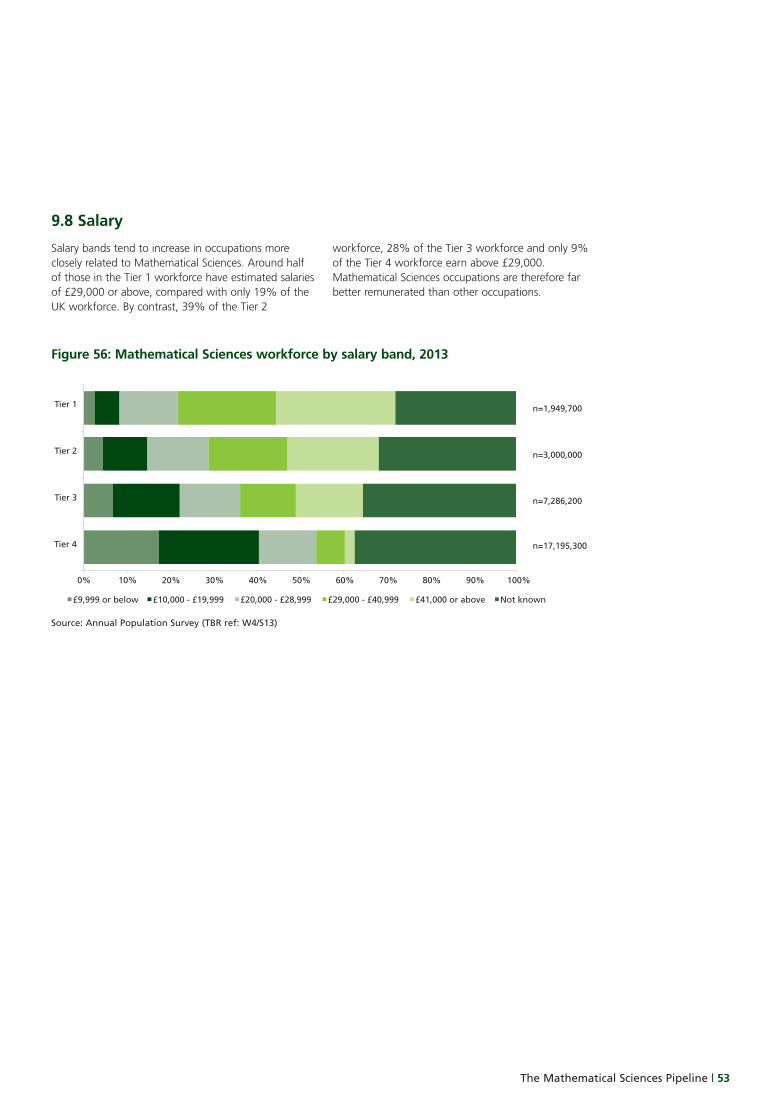
The Mathematical Sciences Pipeline | 53
9.8 Salary
Salary bands tend to increase in occupations more closely related to Mathematical Sciences. Around half of those in the Tier 1 workforce have estimated salaries of £29,000 or above, compared with only 19% of the UK workforce. By contrast, 39% of the Tier 2
workforce, 28% of the Tier 3 workforce and only 9% of the Tier 4 workforce earn above £29,000. Mathematical Sciences occupations are therefore far better remunerated than other occupations.
0% 10% 20% 30% 40% 50% 60% 70% 80% 90% 100%
Tier 1
Tier 2
Tier 3
Tier 4
n=1,949,700
n=3,000,000
n=7,286,200
n=17,195,300
£9,999 or below £10,000 - £19,999 £20,000 - £28,999 £29,000 - £40,999 £41,000 or above Not known
Source: Annual Population Survey (TBR ref: W4/S13)
Figure 56: Mathematical Sciences workforce by salary band, 2013
LMS-BTL-70_ReportFINAL.pdf 57 25/09/2015 10:26
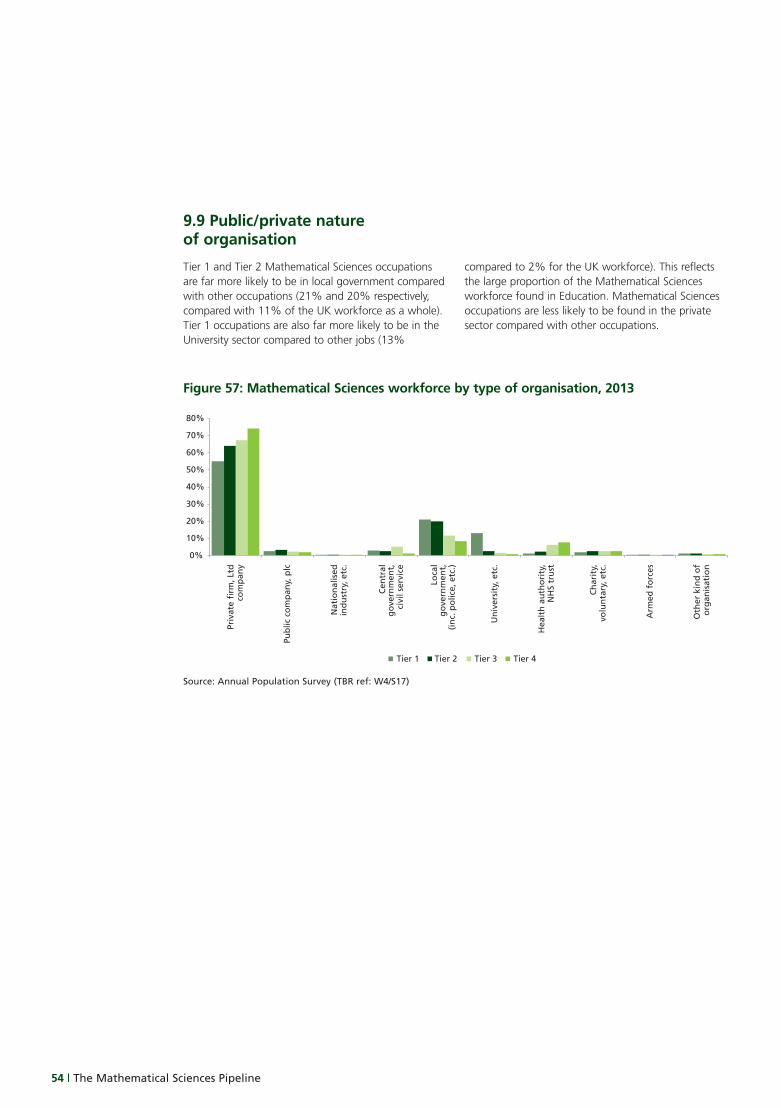
54 | The Mathematical Sciences Pipeline
9.9 Public/private nature of organisation
Tier 1 and Tier 2 Mathematical Sciences occupations are far more likely to be in local government compared with other occupations (21% and 20% respectively, compared with 11% of the UK workforce as a whole). Tier 1 occupations are also far more likely to be in the University sector compared to other jobs (13%
compared to 2% for the UK workforce). This reflects the large proportion of the Mathematical Sciences workforce found in Education. Mathematical Sciences occupations are less likely to be found in the private sector compared with other occupations.
0%
10%
20%
30%
40%
50%
60%
70%
80%
Priv
ate
firm
, Ltd
co
mp
any
Pub
lic c
om
pan
y, p
lc
Nat
ion
alis
ed
ind
ust
ry, e
tc.
Cen
tral
g
ove
rnm
ent,
ci
vil s
ervi
ce
Loca
l g
ove
rnm
ent,
(i
nc.
po
lice,
etc
.)
Un
iver
sity
, etc
.
Hea
lth
au
tho
rity
, N
HS
tru
st
Ch
arit
y,
volu
nta
ry, e
tc.
Arm
ed f
orc
es
Oth
er k
ind
of
org
anis
atio
n
Tier 1 Tier 2 Tier 3 Tier 4
Source: Annual Population Survey (TBR ref: W4/S17)
Figure 57: Mathematical Sciences workforce by type of organisation, 2013
LMS-BTL-70_ReportFINAL.pdf 58 25/09/2015 10:26
This report was prepared for the Council for the Mathematical Sciences by Andrew Rowell (Senior Research Analyst) and Fiona Tuck (Head of Research) of TBR’s Skills and Labour Market Team.
Floor D, Milburn House,Dean Street, Newcastle upon Tyne, NE1 1LE
Telephone: +44 (0) 191 279 0900Fax: +44 (0) 191 221 2220Email: [email protected]
www.tbr.co.uk
LMS-BTL-70_ReportFINAL.pdf 2 25/09/2015 10:26
The Mathematical Sciences Pipeline | 55
LMS-BTL-70_ReportFINAL.pdf 63 25/09/2015 10:26
56 | The Mathematical Sciences Pipeline
UCAS Analysis of applicants to Mathematical Science courses, 2009–2013 [bespoke extract]
HESA Student Record 2009/10–2012/13 [bespoke extract]
HESA Matched Destinations of Leavers Survey and Student Record 2009/10–2012/13 [bespoke extract]
HESA Destinations of Leavers Longitudinal Survey 2004/05, 2006/07, 2008/09 [bespoke extract]
Office for National Statistics. Social Survey Division, Annual Population Survey, October 2010 - September 2011: Special Licence Access [computer file]. 2nd Edition. Colchester, Essex: UK Data Archive [distributor], December 2012. SN: 7004 , http://dx.doi.org/10.5255/UKDA-SN-7004-2
Office for National Statistics. Social Survey Division, Annual Population Survey, October 2011 - September 2012: Special Licence Access [computer file]. Colchester, Essex: UK Data Archive [distributor], November 2013. SN: 7413 , http://dx.doi.org/10.5255/UKDA-SN-7413-1
Office for National Statistics. Social Survey Division, Annual Population Survey, October 2012 - September 2013: Special Licence Access [computer file]. Colchester, Essex: UK Data Archive [distributor], January 2014. SN: 7444 , http://dx.doi.org/10.5255/UKDA-SN-7444-1
This report contains public sector information licensed under the Open Government Licence v2.0
TBR and the Council for the Mathematical Sciences are grateful to UCAS, HESA, the Office for National Statistics and the UK Data Service for making these data available. Neither UCAS, HESA, the Office for National Statistics nor the UK Data Service bear any responsibility for the analysis or interpretation of the data.
10. Appendix 1: Data sources
LMS-BTL-70_ReportFINAL.pdf 60 25/09/2015 10:26
58 | The Mathematical Sciences Pipeline
Natural and social scientists
IT managers, analysts, architects and systems designers
Programmers and software developers
Research and development managers
Education and teaching professionals in higher, further and secondary education
Chartered and certified accountants
Management consultants and business analysts
Actuaries, economists and statisticians
Taxation experts
11. Appendix 2: Occupations in the Tier 1 Mathematical Sciences workforce
LMS-BTL-70_ReportFINAL.pdf 62 25/09/2015 10:26

The Mathematical Sciences People Pipeline
October 2015
LMS-BTL-70_ReportFINAL.pdf 1 25/09/2015 10:26LMS-BTL-70_ReportFINAL.pdf 64 25/09/2015 10:26


