Universiteit van Amsterdam Roel Beetsma (UvA & European Fiscal Board) Massimo Giuliodori (UvA & Tinbergen Institute) Jesper Hanson (IMF & UvA) Frank de Jong (Tilburg University) Presentation ESM – December 11, 2018 The Maturity of Sovereign Bond Issuance in the Euro Area
Transcript
Universiteit van Amsterdam
Roel Beetsma (UvA & European Fiscal Board)
Massimo Giuliodori (UvA & Tinbergen Institute)
Jesper Hanson (IMF & UvA)
Frank de Jong (Tilburg University)
Presentation ESM – December 11, 2018
The Maturity of Sovereign Bond Issuance in the Euro Area
Universiteit van Amsterdam
Motivation and overview
What determines debt maturity choice of govts. in Eurozone?
Eliciting policymakers’ preferences from data on composition of debt stock is difficult – changes in maturity are slow-moving
Unique dataset of Eurozone sovereign debt auctions 1999-2017
New debt issuances provide opportunity to move maturity composition into preferred direction
Our debt auction data should provide information on maturity preferences
Universiteit van Amsterdam
Motivation and overview
Start with theoretical framework with trade-off between short and long maturity in the face liquidity preference shocks, shocks to risk aversion and to repayment capacity (roll-over risk)
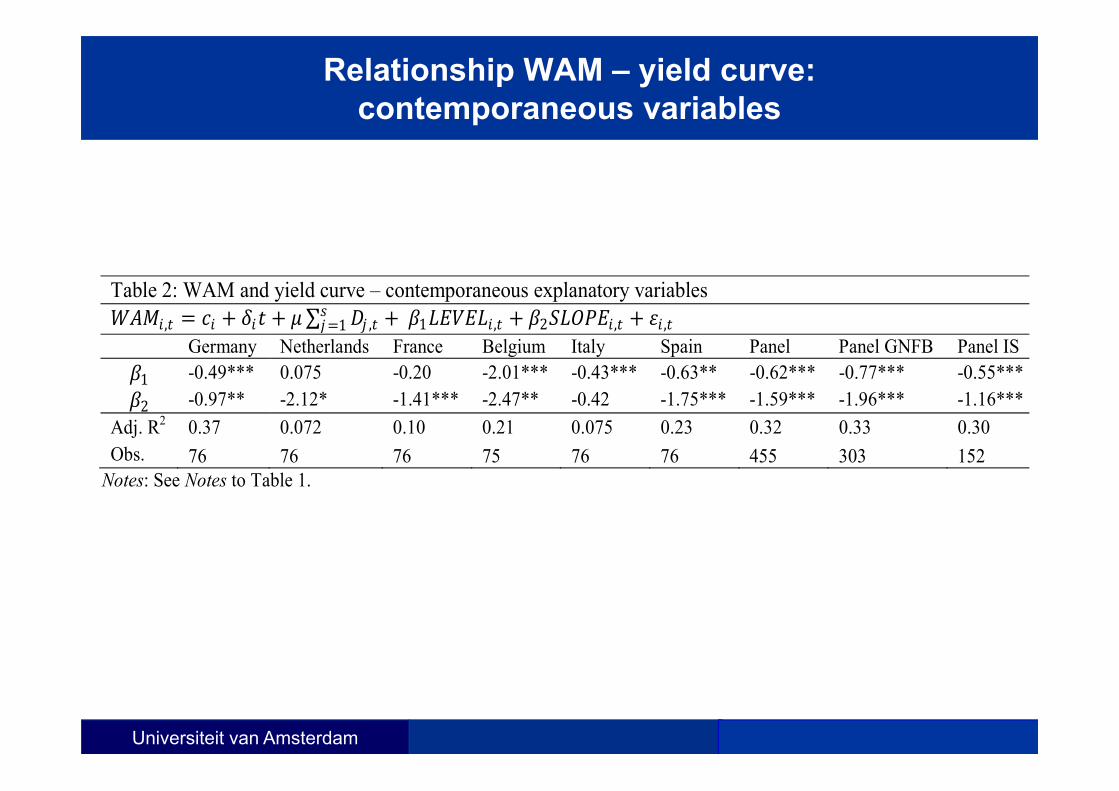
Relationship between maturity and yield curve
Study effects of underlying shocks to liquidity preference, risk aversion and repayment capacity
Combines approach Broner et al. (2013), which trades off higher cost of longer debt against lower roll-over risk, with adding liquidity services of short risk-free debt (Greenwood et al., 2015)
Roll-over risk is relevant for euro-area:
– CACs since 2013– Haircut 2012 privately-held Greek government debt– Ongoing discussions about sovereign debt restructuring
framework
Universiteit van Amsterdam
Model
Three periods: 0, 1, 2
Government maximizes ∑
Period 0, government can restructure debt subject to
Period 1 government budget constraint is
Universiteit van Amsterdam
Model
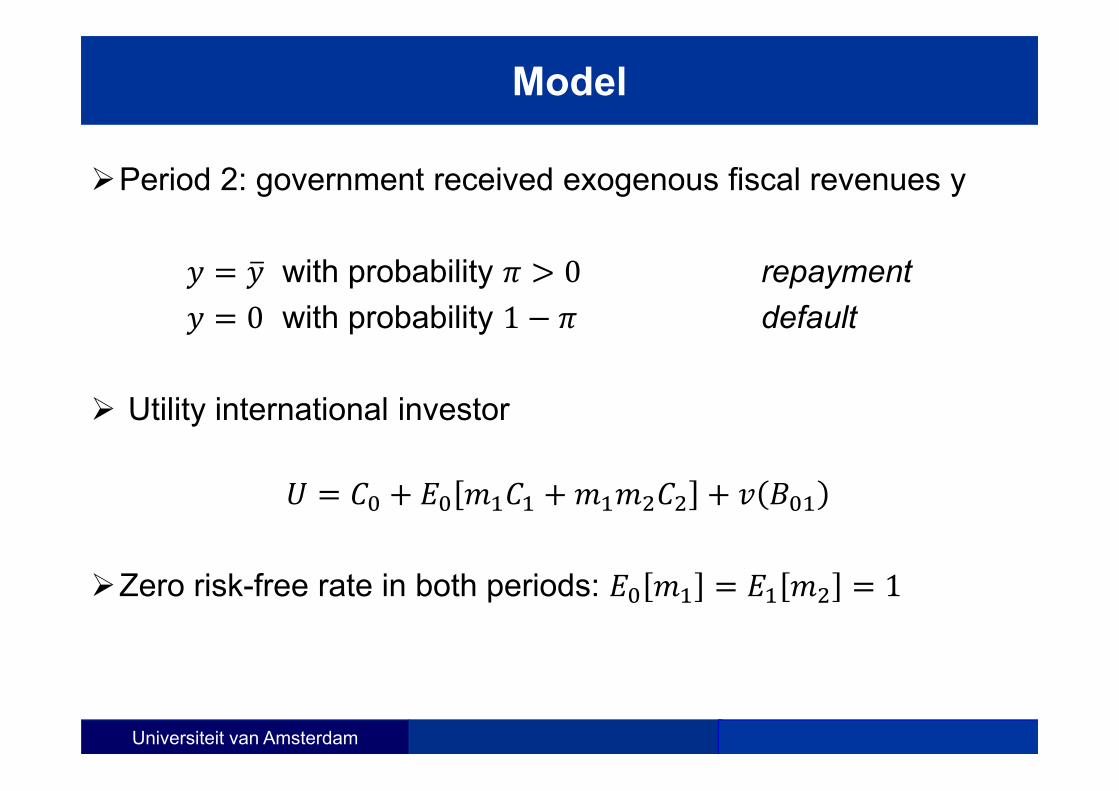
Period 2: government received exogenous fiscal revenues y
with probability 0 repayment0 with probability 1 default
Utility international investor
Zero risk-free rate in both periods: 1
Universiteit van Amsterdam
Model
Period 0 short-term debt is riskless:
′ 1 ′ .
Investors risk-neutral w.r.t. investment period 1:
Price period-0 long bonds is . With and negatively correlated,
,
Universiteit van Amsterdam
Model: timing
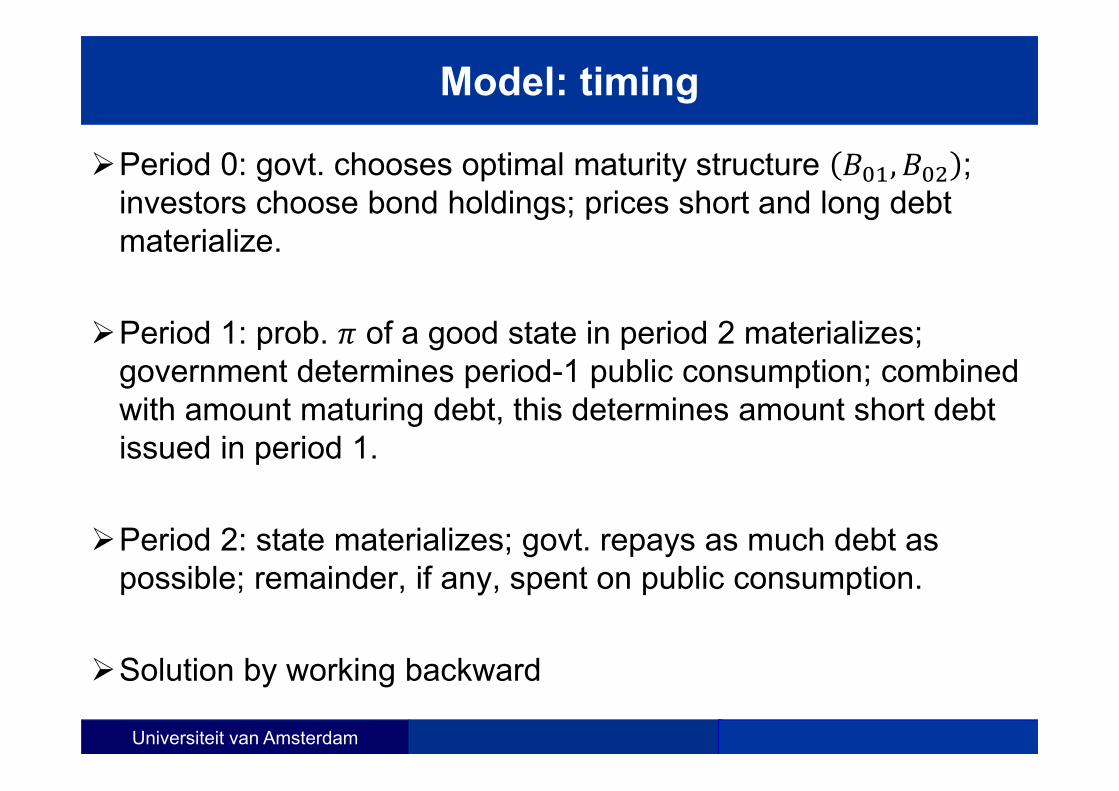
Period 0: govt. chooses optimal maturity structure , ; investors choose bond holdings; prices short and long debt materialize.
Period 1: prob. of a good state in period 2 materializes; government determines period-1 public consumption; combined with amount maturing debt, this determines amount short debt issued in period 1.
Period 2: state materializes; govt. repays as much debt as possible; remainder, if any, spent on public consumption.
Solution by working backward
Universiteit van Amsterdam
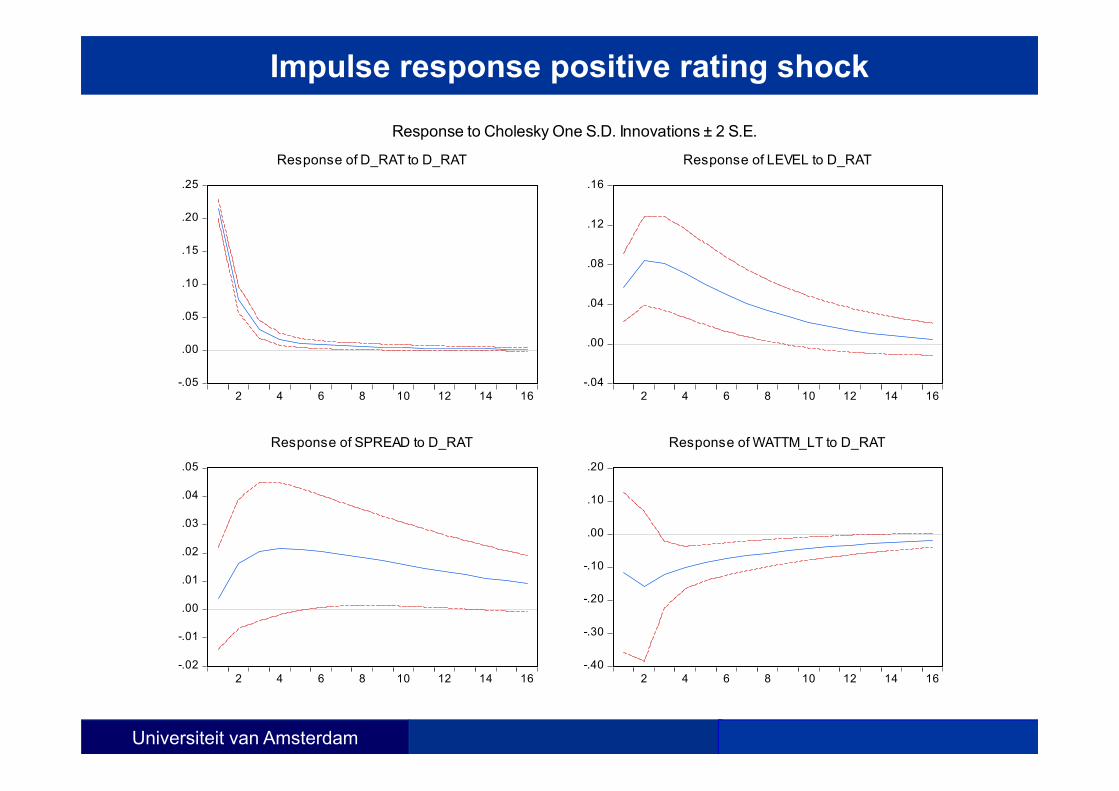
Proposition 1
Higher risk aversion (lower ) produces in period 0:– a shortening of the mature structure– an upward shift in the yield curve level (fall in and )– no unambiguous effect on the slope can be established.
Risk aversion risk premium long bond to restore equilibrium, liquidity services short debt
Universiteit van Amsterdam
Proposition 2
Reduced expected repayment prob. leads in period 0 to:– lengthening of the maturity structure– increase in the yield curve slope ( rises, falls)– no unambiguous effect on the yield curve level can be
established
P2: government less wealthy relative risk aversion given variance repayment probability around , (exp.) marg. utility govt. in periods 1 and 2 is higher if govt. issues more long debt to limit fluctuations in marginal utility
Universiteit van Amsterdam
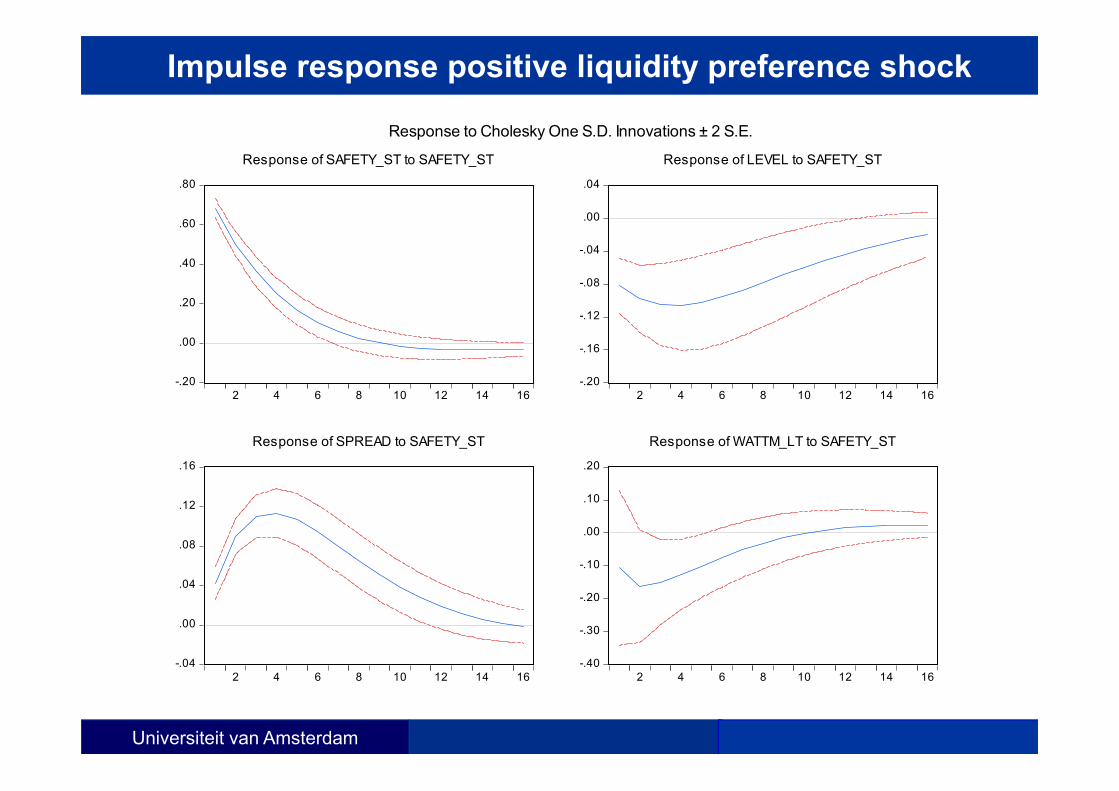
Proposition 3
Assume that and suppose rises – then in period 0:
– the maturity structure shortens– the slope of the yield curve increases ( rises, remains
unchanged)– the yield curve level shifts down
P3: marg. utility liquidity services to restore optimal trade-off, issue relatively more short
Universiteit van Amsterdam
Data
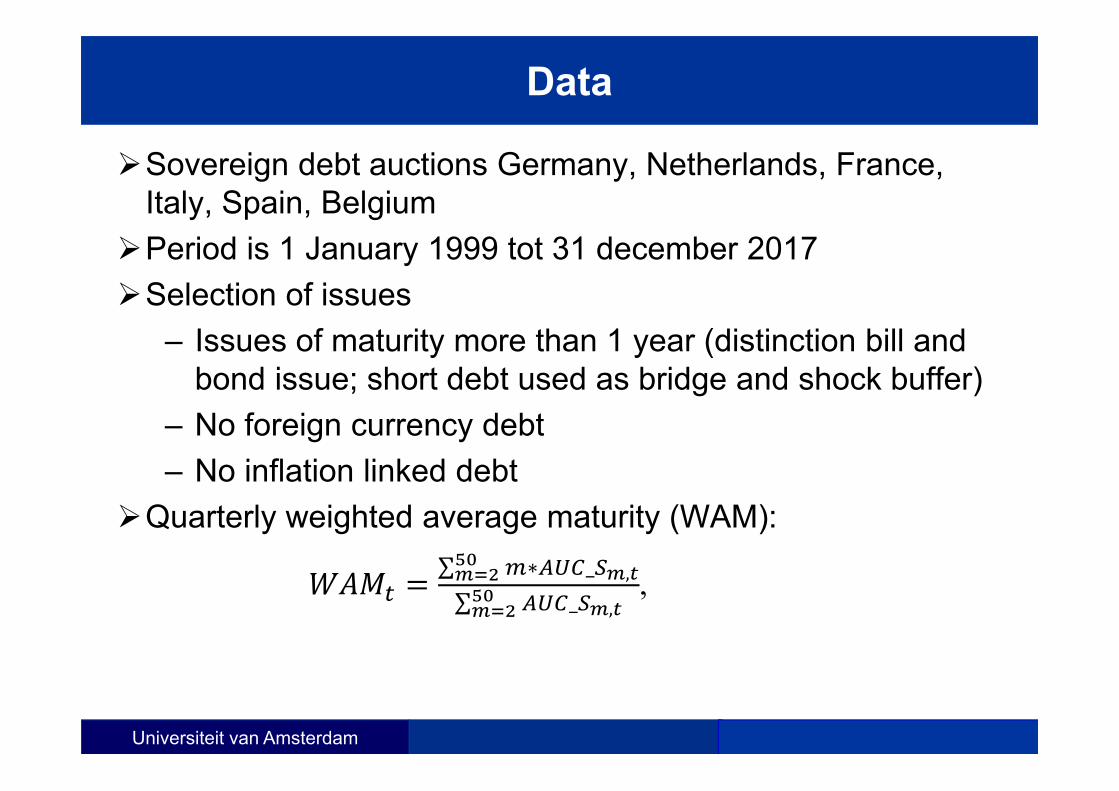
Sovereign debt auctions Germany, Netherlands, France, Italy, Spain, Belgium
Period is 1 January 1999 tot 31 december 2017Selection of issues
– Issues of maturity more than 1 year (distinction bill and bond issue; short debt used as bridge and shock buffer)
– No foreign currency debt – No inflation linked debt
Quarterly weighted average maturity (WAM):∑ ∗ _ ,∑ _ ,
,
Universiteit van Amsterdam
Weighted average maturity new debt issues
Figure 1: Weighted average maturity of bond issues at quarterly frequency Germany Netherlands
3
4
5
6
7
8
9
10
11
12
2000 2002 2004 2006 2008 2010 2012 2014 2016
WAM_DE
0
4
8
12
16
20
2000 2002 2004 2006 2008 2010 2012 2014 2016
WAM_NL
France Belgium
6
7
8
9
10
11
12
13
14
15
2000 2002 2004 2006 2008 2010 2012 2014 2016
WAM_FR
4
8
12
16
20
24
28
32
2000 2002 2004 2006 2008 2010 2012 2014 2016
WAM_BE
Italy Spain
5
6
7
8
9
10
11
12
13
2000 2002 2004 2006 2008 2010 2012 2014 2016
WAM_IT
4
6
8
10
12
14
16
2000 2002 2004 2006 2008 2010 2012 2014 2016
WAM_ES
Universiteit van Amsterdam
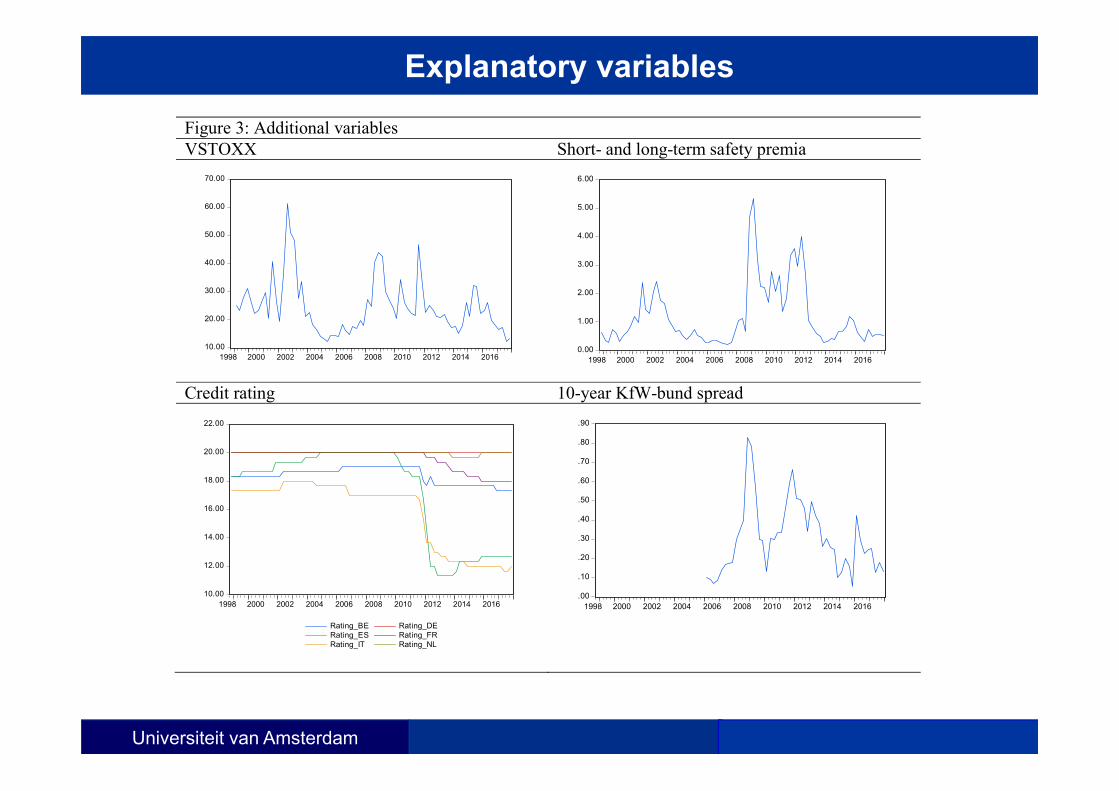
Secondary market yields
Figure 2: Secondary market yields 1-year yields Spread between 10-year and 1-year yields
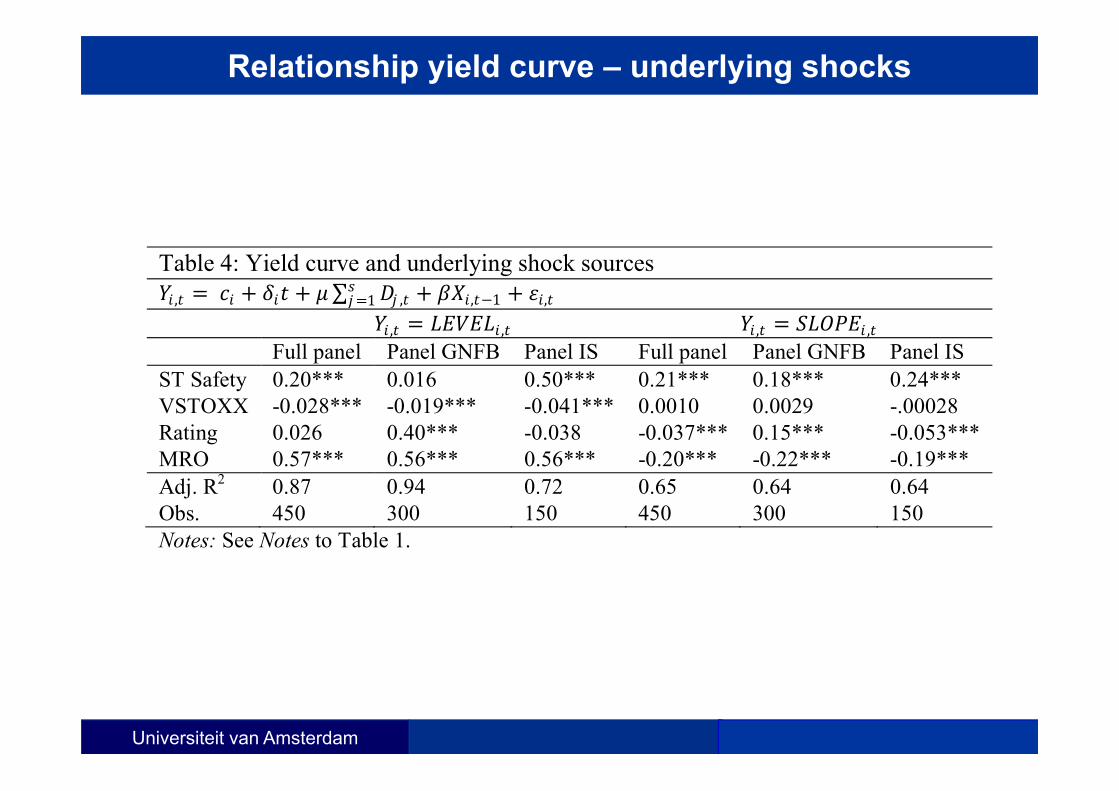
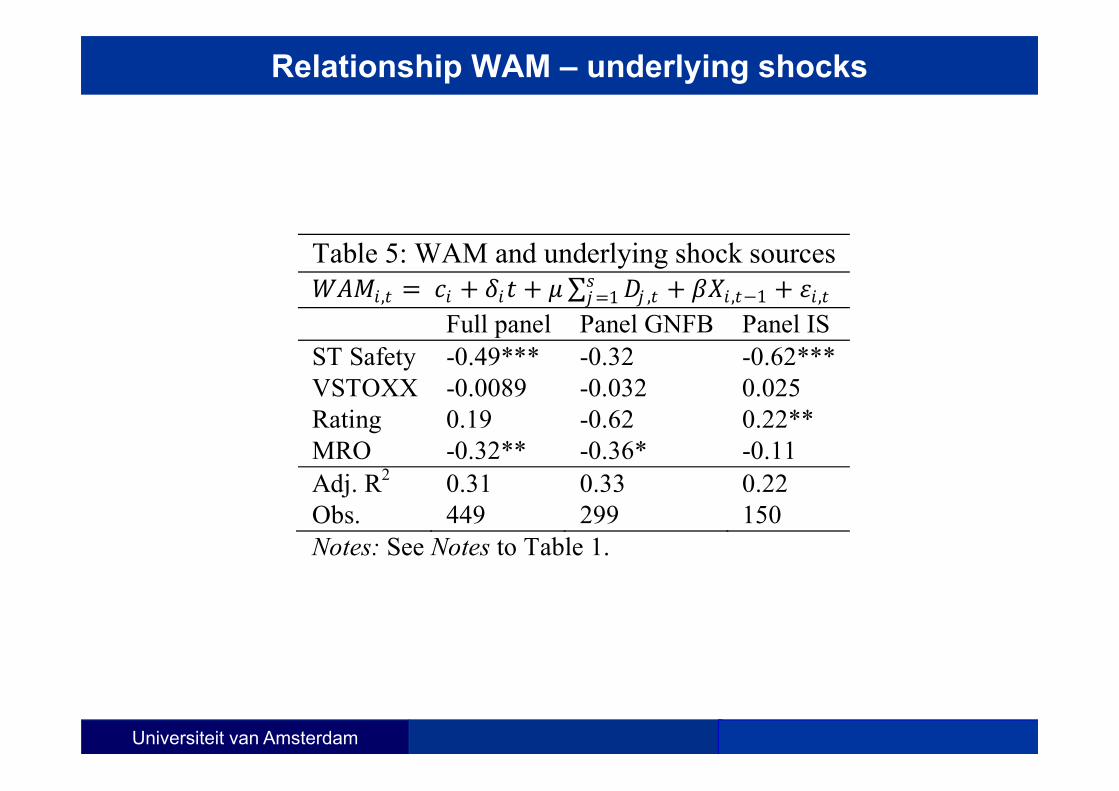
Notes: Estimation is for the period January 1, 1999 – December 31, 2017. Estimation method is Ordinary Least Squares (OLS) with Newey-West adjusted standard errors. The columns under the headers “Full panel”, “Panel GNFB” and “Panel IS” report panel OLS regressions estimated with country fixed effects. Further, *, ** and *** denote significance at the 10%-, 5%-, and 1%-levels, respectively. Finally, “Panel GNFB” is the sub-panel formed by Germany, Netherlands, France and Belgium, and “Panel IS” is the sub-panel formed by Italy and Spain.
Full panel Panel GNFB Panel IS 1 -0.94*** -1.26*** -0.50** 2 -1.87*** -2.41*** -1.42***
Adj. R2 0.32 0.32 0.29 Obs. 449 299 150
Notes: Estimation method is Instrumental Variables (IV) regression with Newey-West adjusted standard errors, where , and , are instrumented with the first lags of the short-term safety premium, the VSTOXX, the credit rating and the interest rate on Main Refinancing Operations. Further, see Notes to Table 1.
Universiteit van Amsterdam
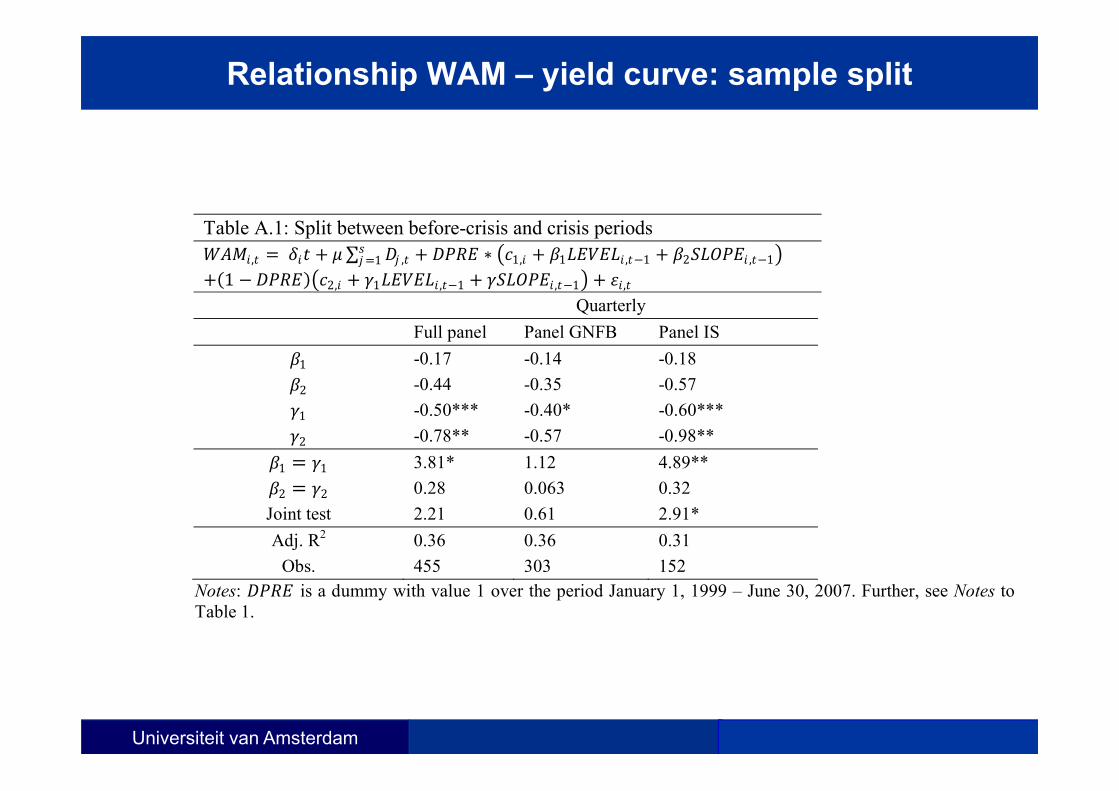
Relationship WAM – yield curve: sample split
Table A.1: Split between before-crisis and crisis periods , ∑ ,1 ∗ 1, 1 , 1 2 , 1
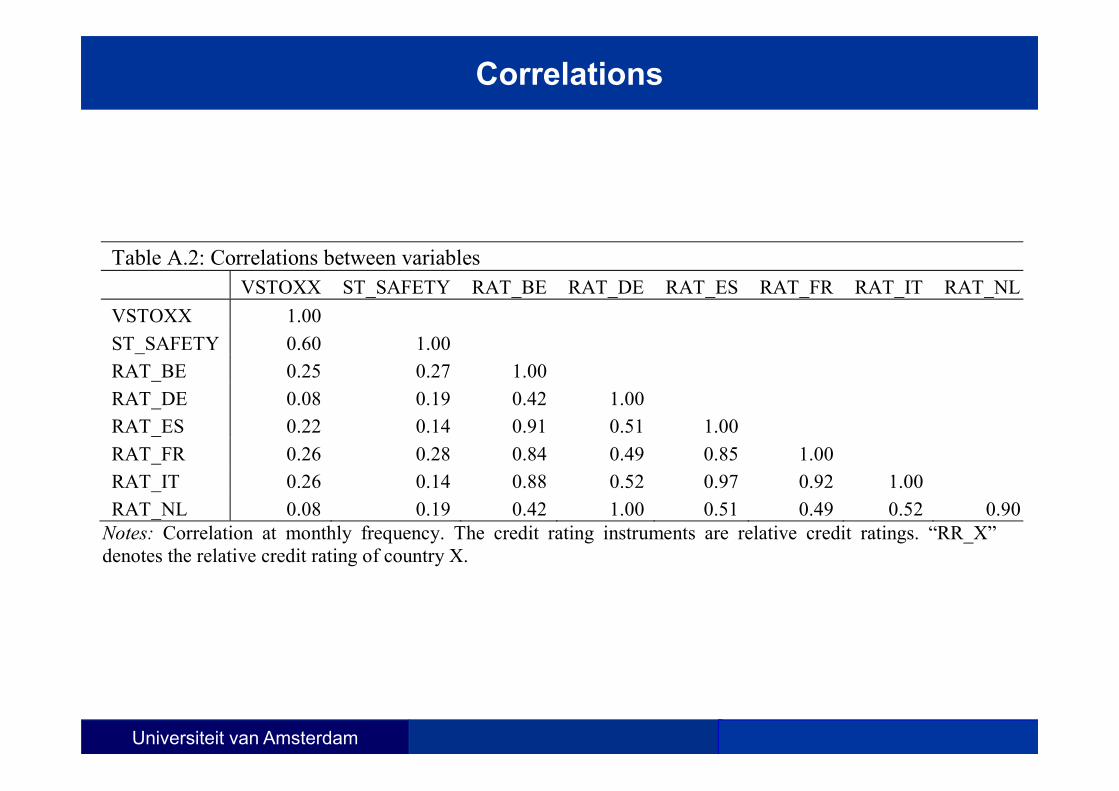
Notes: Correlation at monthly frequency. The credit rating instruments are relative credit ratings. “RR_X” denotes the relative credit rating of country X.


![Garage Policy Issuance Guidelines Ed 0313 - … · Garage Policy Issuance Guidelines Ed. 01/13 [1]$ $ GARAGE POLICY ISSUANCE GUIDELINES 2013 Issuance Changes ... 32 As defined by](https://static.documents.pub/doc/80x56/5b91c6dd09d3f277288c7415/garage-policy-issuance-guidelines-ed-0313-garage-policy-issuance-guidelines.jpg)


